Targeted memory reactivation in human REM sleep elicits detectable reactivation
- School of Psychology, Cardiff University Brain Research Imaging Centre (CUBRIC), United Kingdom
- School of Computer Science and Informatics, Cardiff University, United Kingdom
Figures
Figure 1 with 1 supplement
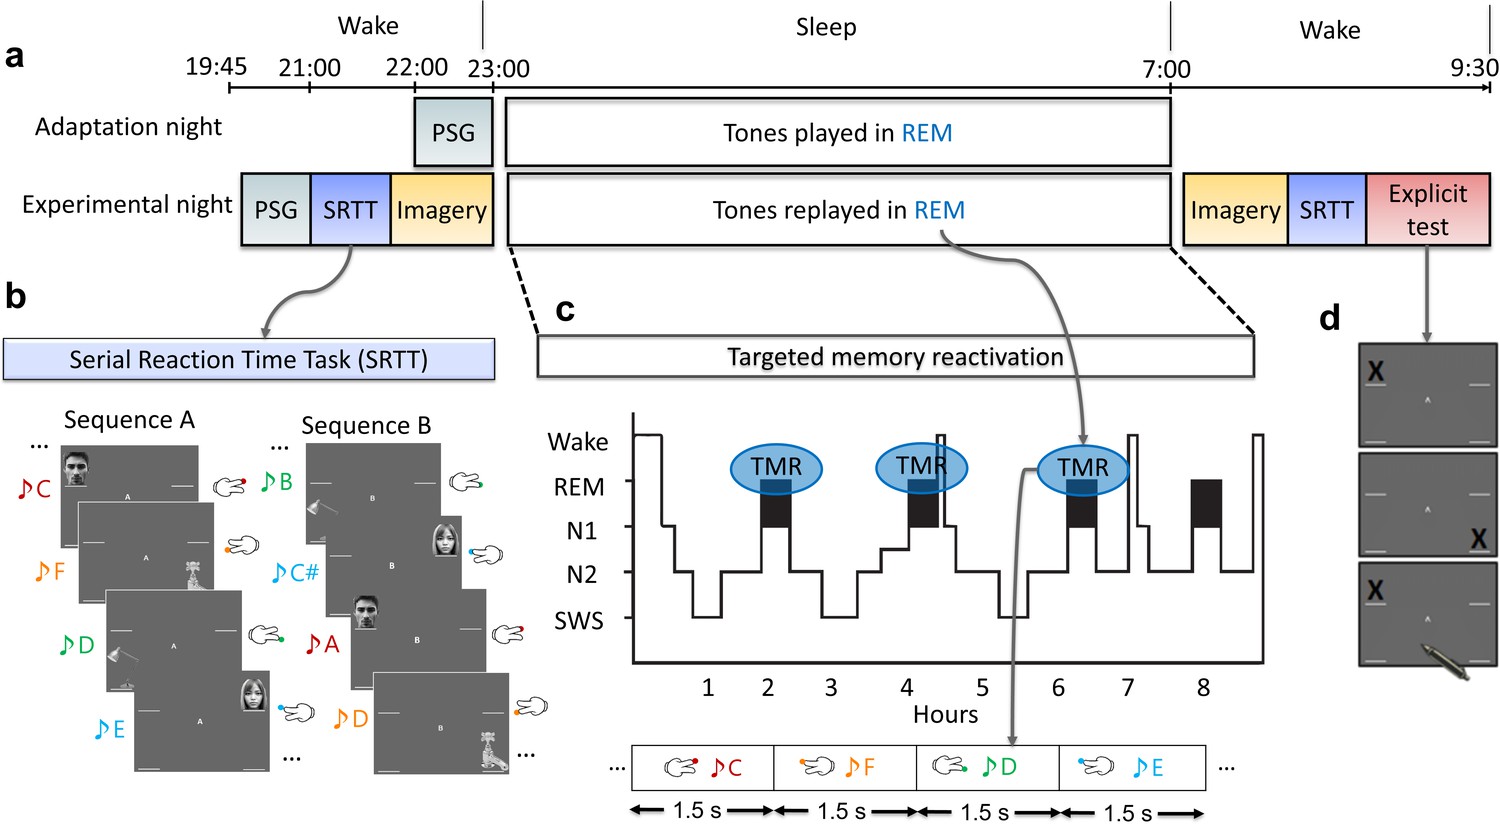
Experimental design.
(a) The experiment consisted of two nights: an adaptation and an experimental night. On both nights, participants were wired up for polysomnography (PSG) and we recorded brain activity throughout the night. In both nights, tones were presented during rapid eye movement (REM) sleep. However, prior to the experimental night, participants completed training on the serial reaction time task (SRTT), and then performed an imagery task in which they were cued with pictures and sounds, but only imagine performing the finger tapping (without movement). PSG was recorded throughout these tasks. After waking up, from the experimental night, participants completed the motor imagery and the SRTT again, and finally did the explicit recall task. (b) In the SRTT, images were presented in two different sequences each with a different set of tones. Each image was associated with a unique tone and required a specific button press. In the imagery task, participants heard the tones and saw the images as in the SRTT, but only imagined pressing the buttons. This imagery data was used for classification, as it has cleaner signals compared to SRTT since there are no movement artefacts. (c) The sounds of only one learned sequence (cued sequence) were played during REM sleep to trigger the associated memories of left- and right-hand presses. (d) Participants were asked to mark the order of each sequence on paper as accurately as they could remember during the explicit recall test after sleep.
Figure 1—figure supplement 1

Illustration of the four images that appeared in the task: two faces and two objects.
Figure 2 with 5 supplements
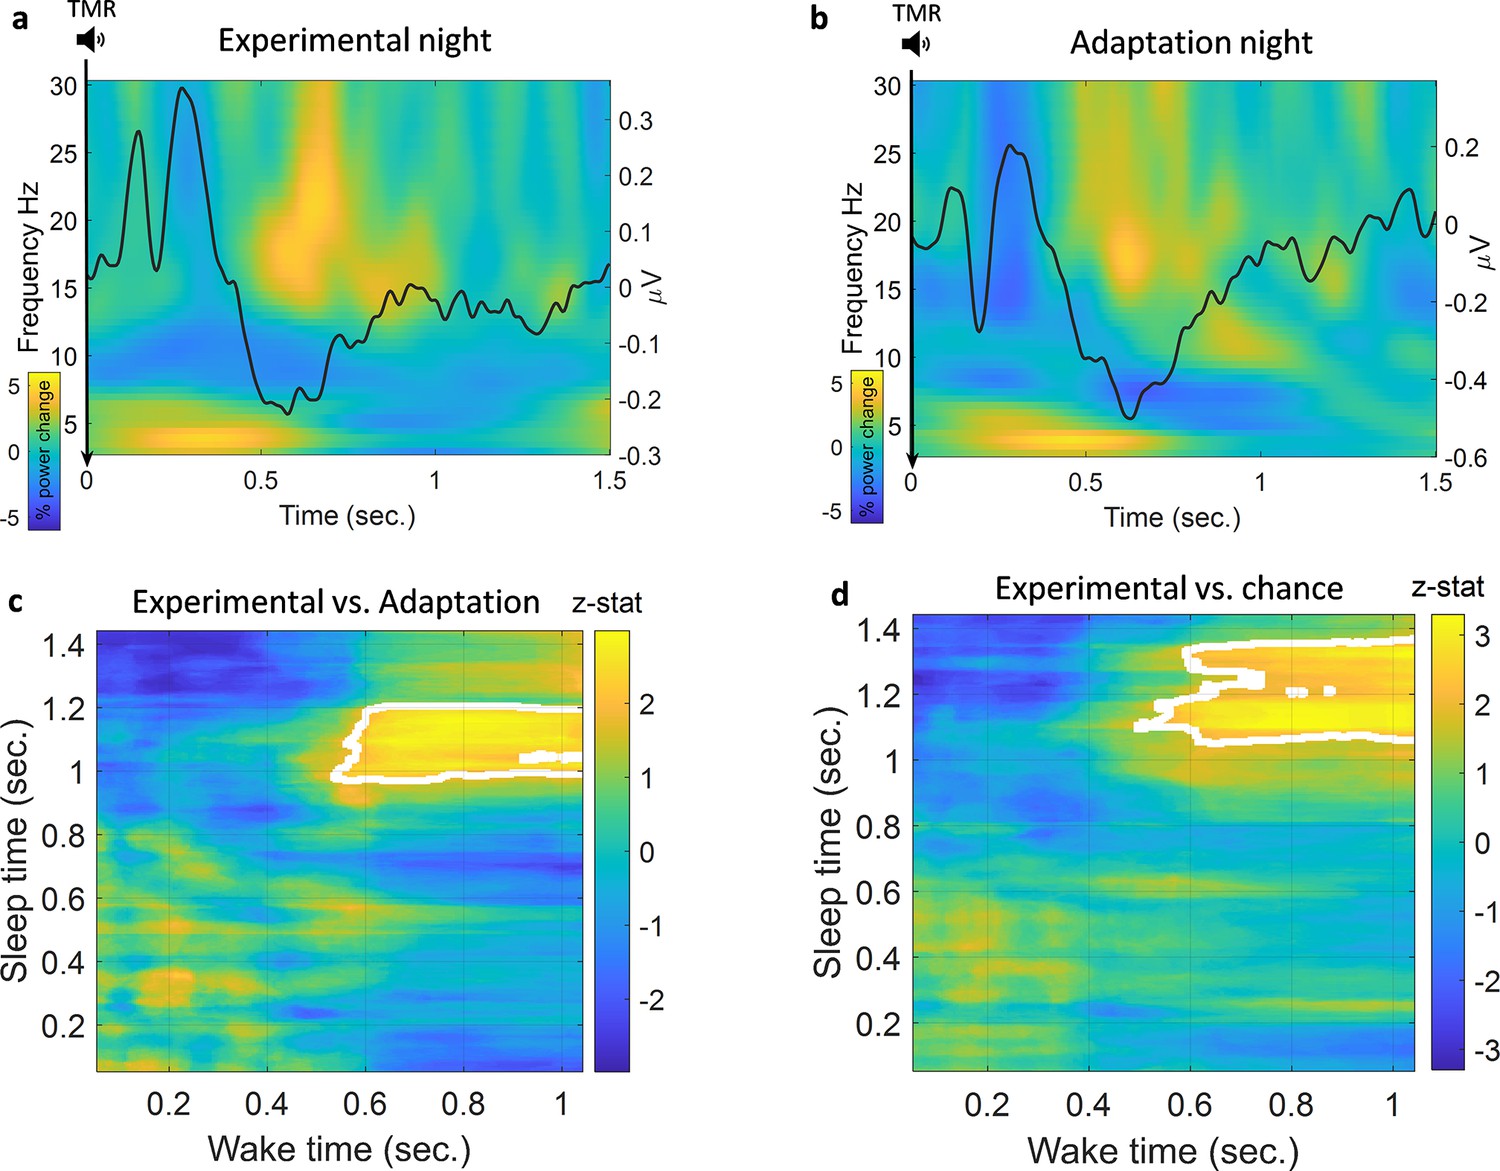
Classification of left vs. right hand.
(a) Time-frequency and ERP analyses of the experimental night. Power percentage changes from the baseline period are shown with colours. The solid black line represents the average results of all ERP analyses from all participants. (b) Time-frequency analysis and ERP analysis of the adaptation night. (c) Comparison between classification performance on experimental and adaptation nights reveals a significant effect described by a cluster which shows a higher classification performance for the experimental night compared to adaptation (n=14, p=0.004), a z-statistic value at every point is shown and cluster edges are marked with white after correcting for multiple comparisons with cluster-based permutation (see Methods for details). (d) Classification performance for the experimental night was also significantly higher than chance (AUC: 0.5) as shown by the cluster after correction (n=14, p=0.009).
Figure 2—figure supplement 1
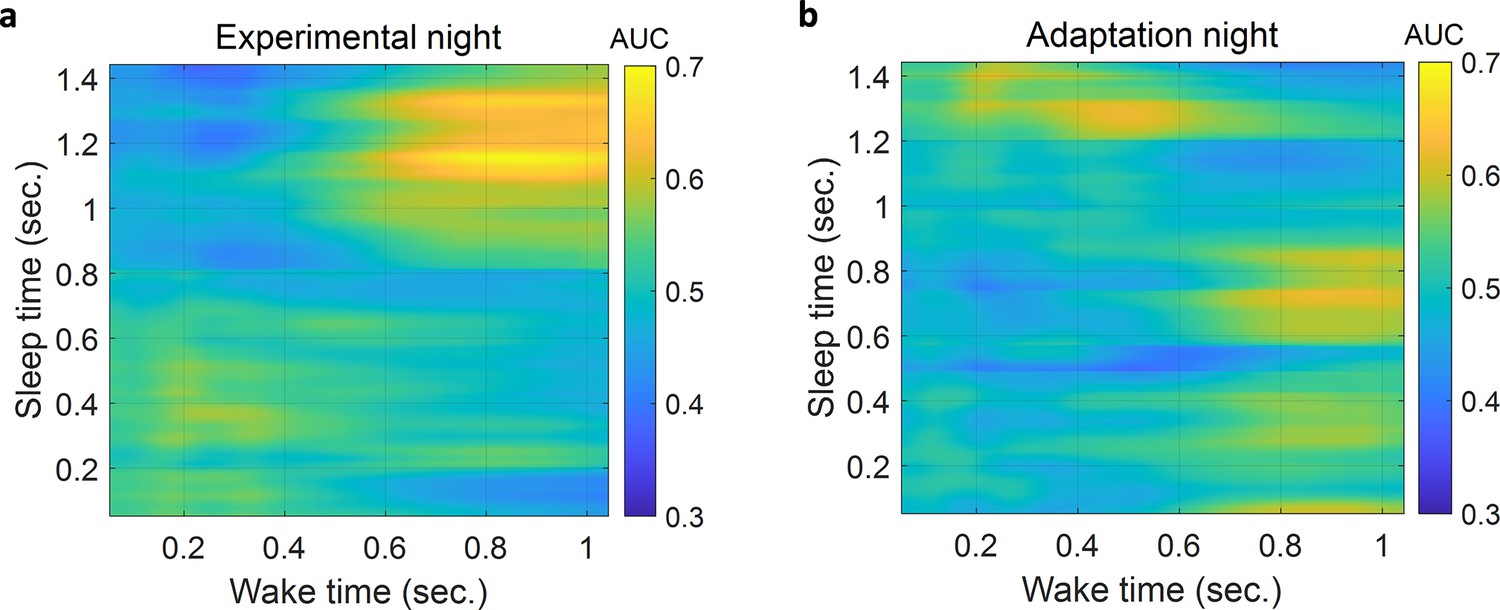
Classification of left vs. right hand.
(a) Classification performance when classifiers were trained on sleep using the experimental night and tested on wake. (b) Classification performance when classifiers were trained on sleep using the adaptation night and tested on wake.
Figure 2—figure supplement 2
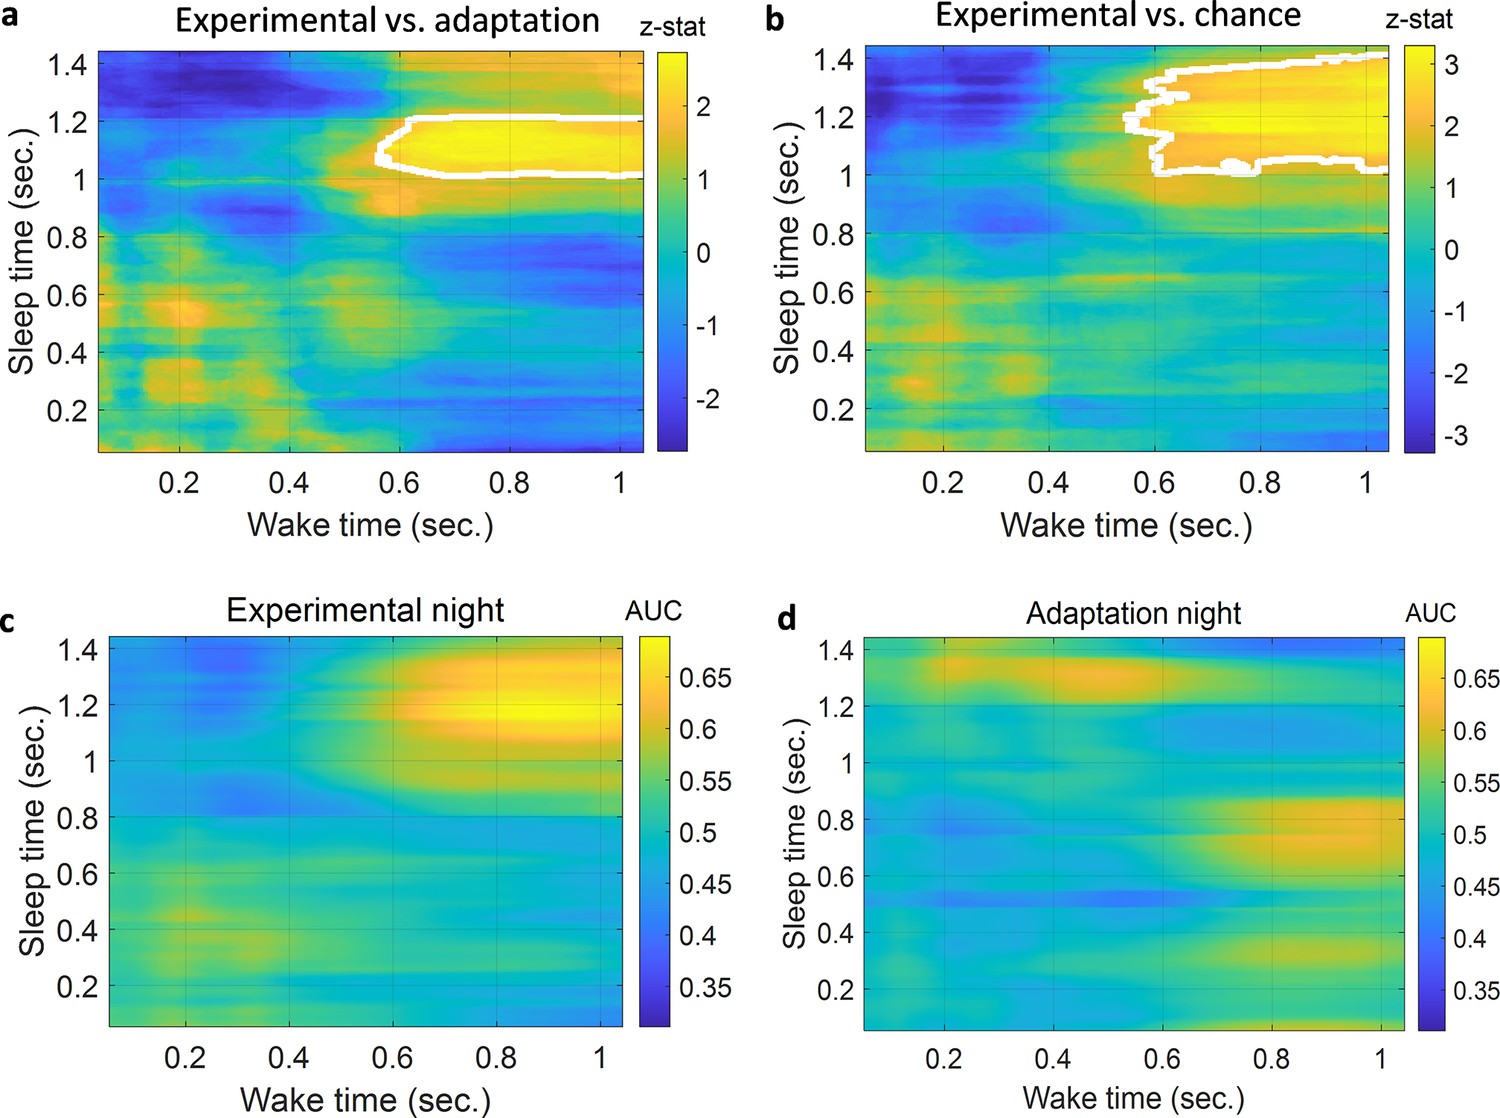
Classification of left vs. right hand when theta band [4 8]Hz is filtered out.
(a) Comparison between the classification performance of the experimental vs. adaptation night reveals a significant effect described by a cluster which shows a higher classification performance for the experimental night compared to adaptation (n=14, p=0.009), a z-statistic value at every point is shown and cluster edges are marked with white after correcting for multiple comparisons with cluster-based permutation (see Methods for details). (b) Classification performance for the experimental night was also significantly higher than chance (AUC: 0.5) as shown by the cluster after correction (n=14, p=0.007). (c) Classification performance when classifiers were trained on sleep using the experimental night and tested on wake. (d) Classification performance when classifiers were trained on sleep using the adaptation night and tested on wake.
Figure 2—figure supplement 3
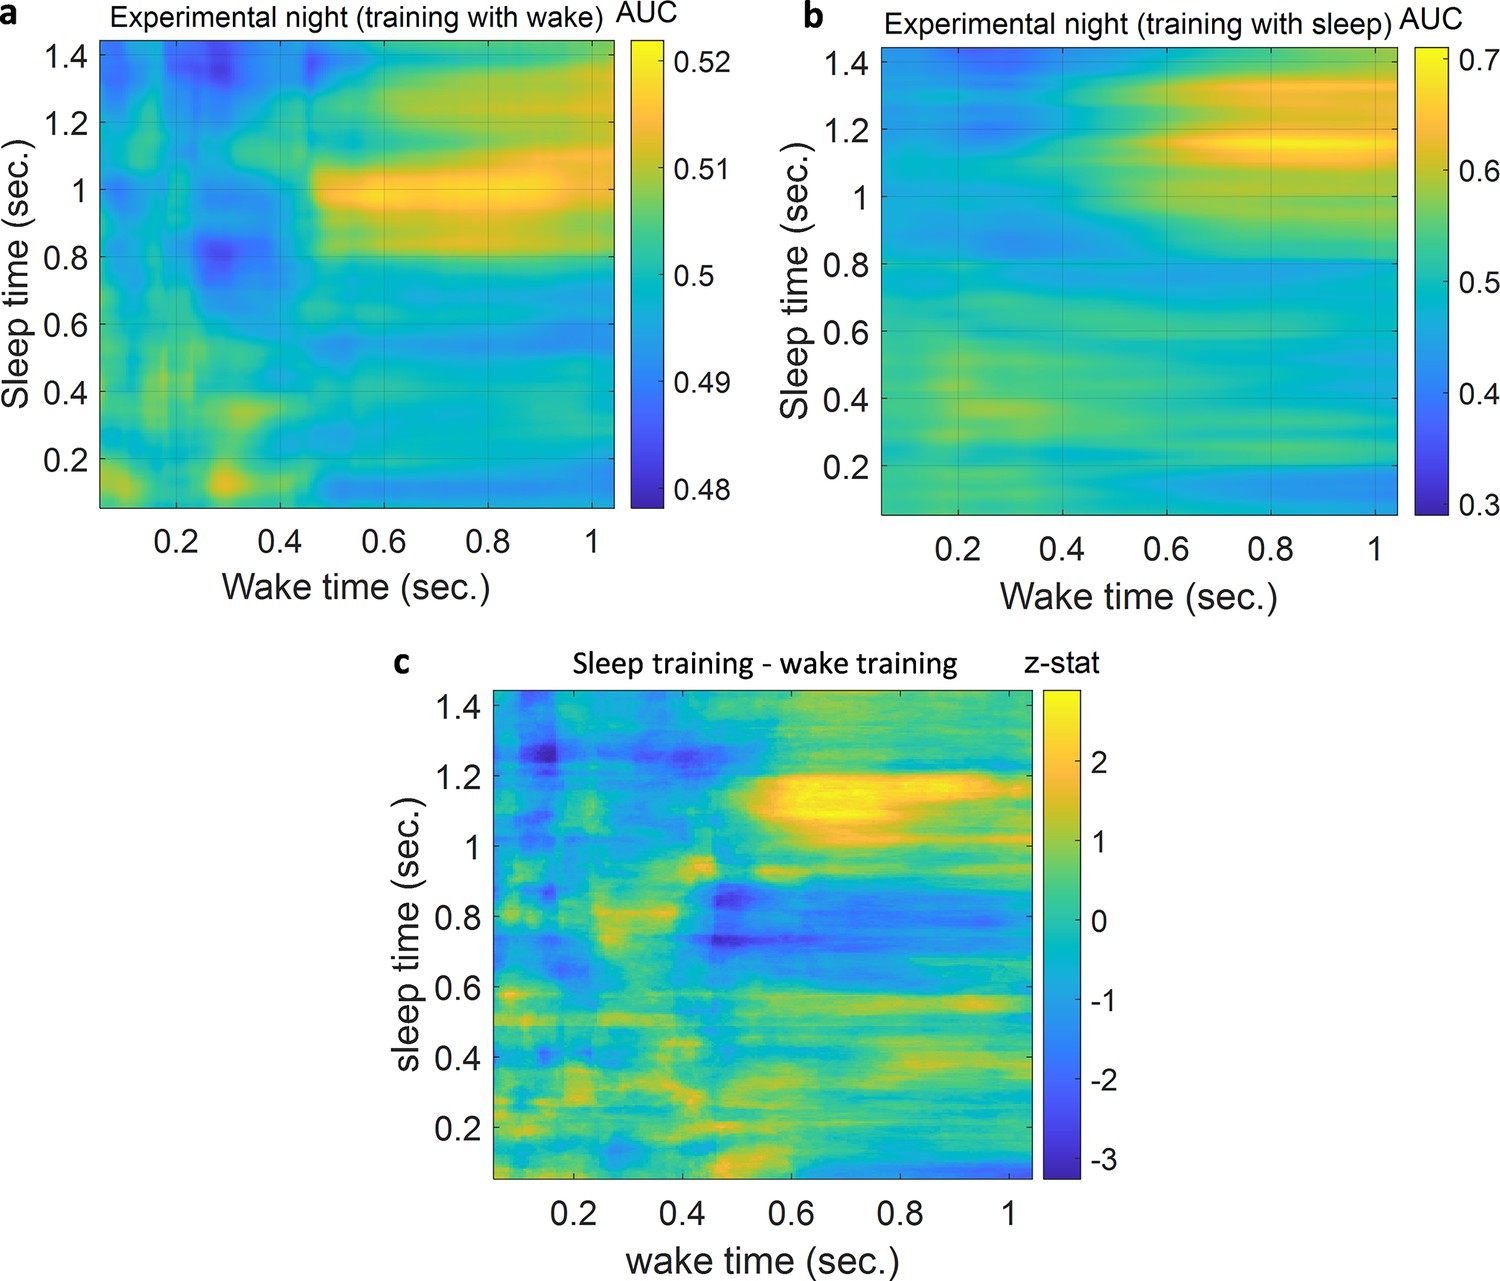
Training with wake vs. training with sleep.
(a) Training the classifiers with wake and testing with sleep. (b) Training the classifiers with sleep and testing with wake. We can see the difference expressed by the AUC values. To make sure that this is consistent among participants and not due to averaging the classification performance, we compared each of the classification outcomes to their corresponding classification of the adaptation night which gave two 2D z-scores and in (c) we show the difference between the two z-scores, when the z-scores of the wake trained is subtracted from sleep trained approach. We can see that the difference of z-scores is positive and higher than 2 in the parts around 1 s which was the part that gave significant effect. This shows that training classifiers with sleep enabled the classifiers to adapt to sleep.
Figure 2—figure supplement 4

Searchlight analysis with linear classification on motor imagery data.
(a) Classification of left vs. right hand using searchlight analysis wherein time points from each channel are used as features to locate the channels with the highest classification performance. (b) Comparison of classification performance using the mean of the highest four channels (which came from channels around the motor area) and the mean of all other channels, which shows that the classification of those channels was significantly higher than the classification of all other channels (Wilcoxon signed rank test, n=12, p=0.002).
Figure 2—figure supplement 5

Example of the time × time classification procedure wherein one time point is used from sleep to build a classifier model and all wake time points were used for testing.
Figure 3
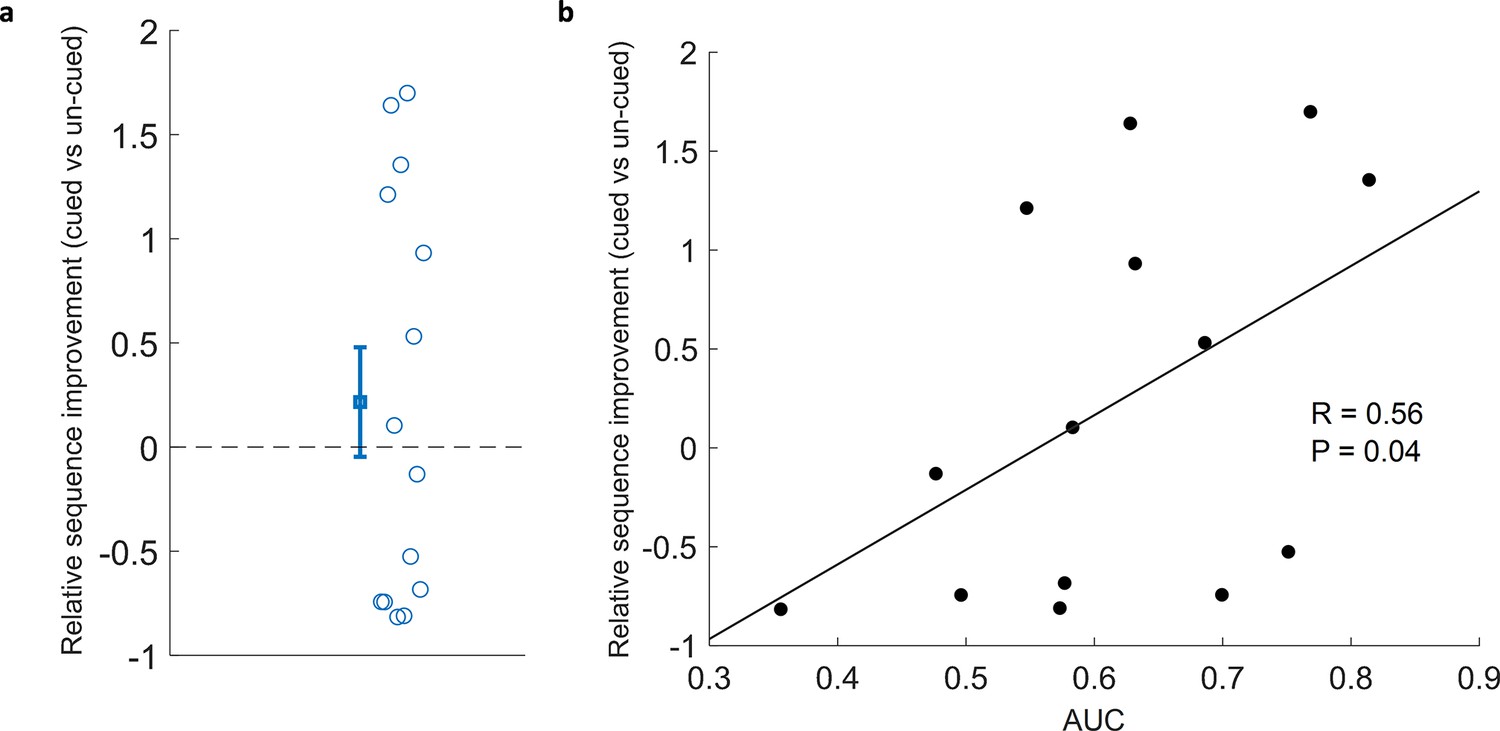
Correlation of classification with cued sequence improvement.
(a) Relative sequence improvement (cued vs un-cued) did not show significant improvement (Wilcoxon signed rank test, n=14, p=0.43). (b) Classification performance positively correlated with relative sequence improvement (Spearman correlation, n=14, r=0.56, p=0.04).
Additional files
-
Supplementary file 1
The number of stimulations for left and right hand in sleep.
- https://cdn.elifesciences.org/articles/84324/elife-84324-supp1-v2.xlsx
-
MDAR checklist
- https://cdn.elifesciences.org/articles/84324/elife-84324-mdarchecklist1-v2.docx
Download links
A two-part list of links to download the article, or parts of the article, in various formats.
Downloads (link to download the article as PDF)
Open citations (links to open the citations from this article in various online reference manager services)
Cite this article (links to download the citations from this article in formats compatible with various reference manager tools)
Targeted memory reactivation in human REM sleep elicits detectable reactivation
eLife 12:e84324.
https://doi.org/10.7554/eLife.84324


