Evolutionary consequences of nascent multicellular life cycles
- Los Alamos National Laboratory, United States
- School of Biological Sciences, Georgia Institute of Technology, United States
- Interdisciplinary Graduate Program in Quantitative Biosciences, Georgia Institute of Technology, United States
- Department of Biology, University of North Carolina at Chapel Hill, United States
- IceLab, Umeå University, Sweden
Figures
Figure 1
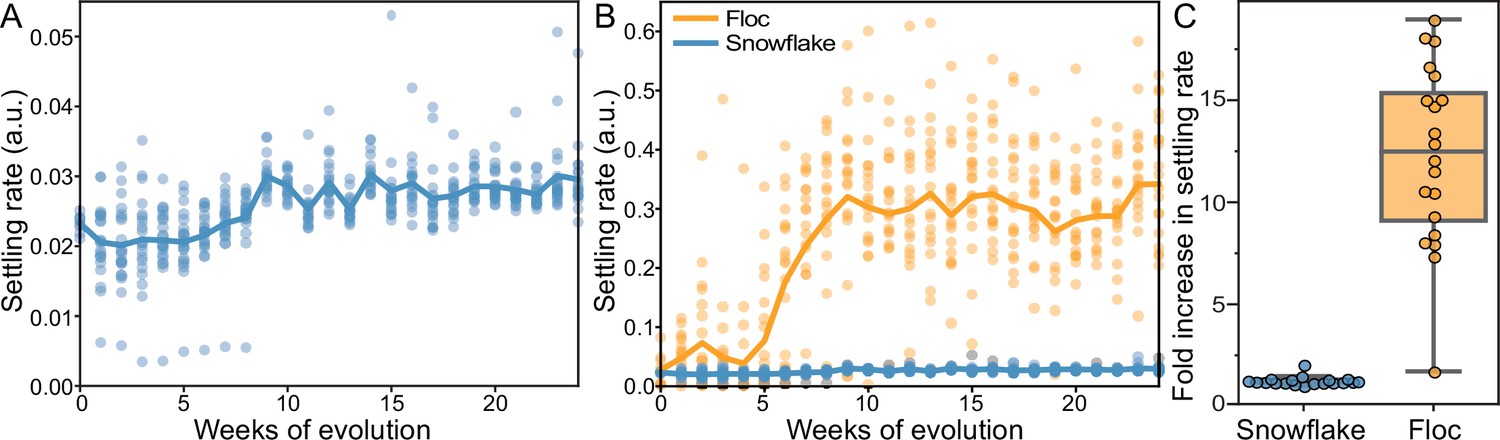
Dynamics of settling rate evolution in snowflake and floc populations.
The settling rate (as determined by time-lapse imaging, see Methods) of 40 independently evolving populations of snowflake yeast (A) and floc yeast (B) over 24 weeks of evolution. Settling rate was measured for each population weekly. Each data point shows the mean of 4 biological replicates for each population. Snowflake yeast evolved to settle 30% faster over 24 weeks of evolution, while floc evolved to settle an average of 12-fold faster (C).
Figure 2 with 4 supplements
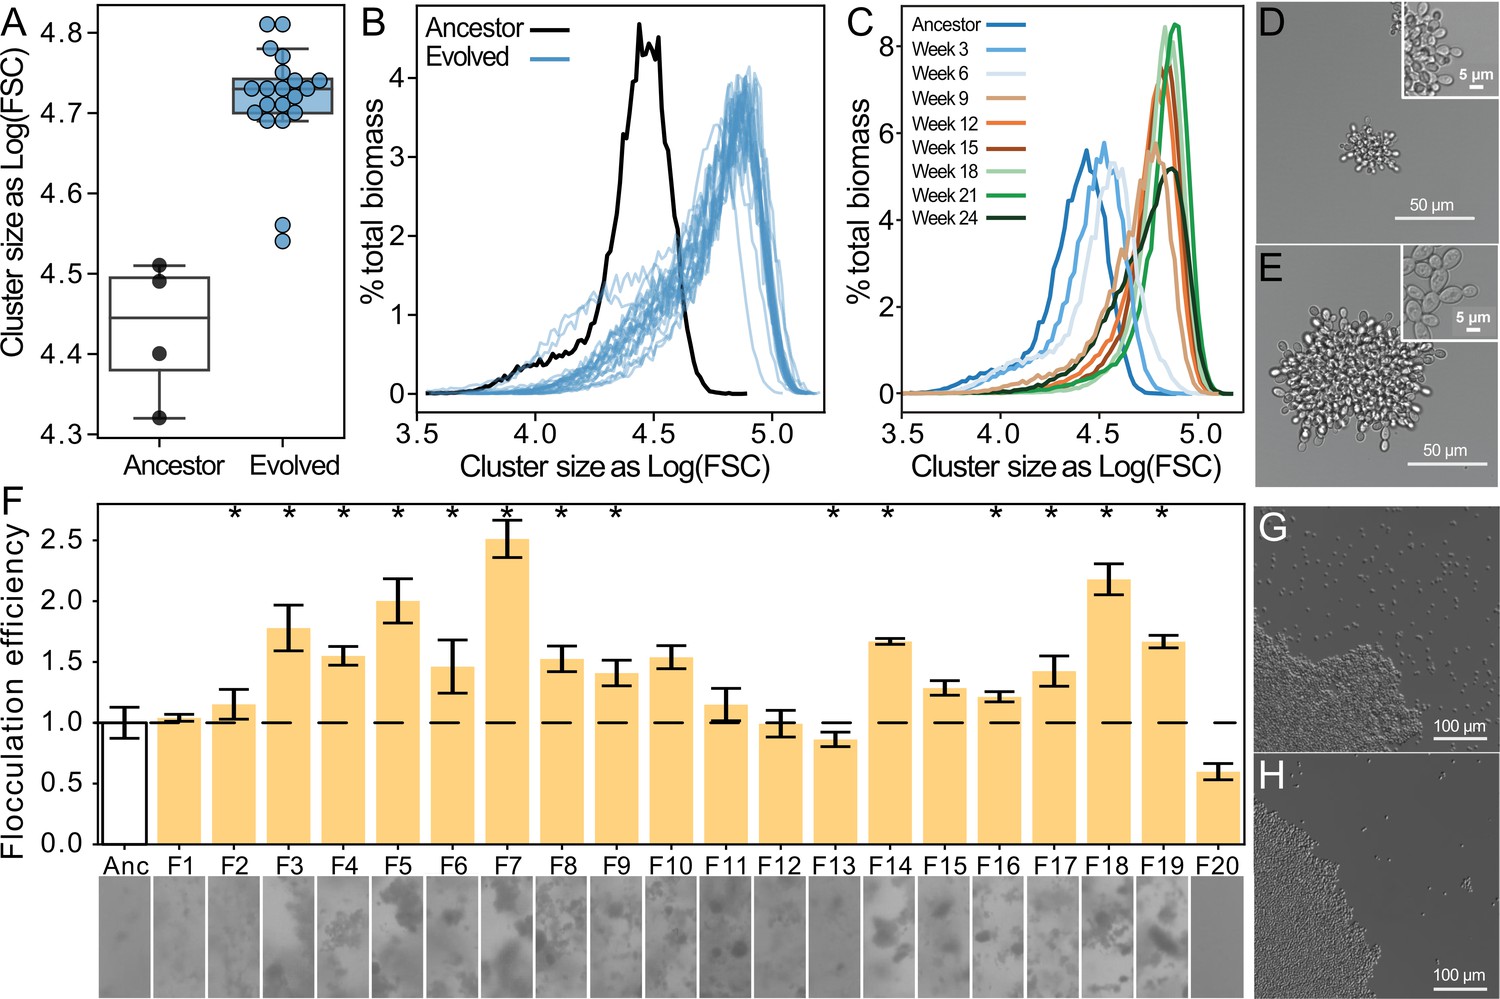
Both floc and snowflake yeast evolved to form larger groups.
(A, B) Snowflake yeast increased their settling rate by evolving larger cluster size. Shown in (C) is the size distribution of a representative snowflake population (S8) every three weeks for the duration of the experiment. Relative to their ancestor (D), evolved snowflake yeast (E) are larger but retain a similar pattern of cellular attachment (insets). (F) We estimated the flocculation efficiency of ancestral and evolved floc by measuring the coefficient of variation in pixel intensity within cuvettes of a well-mixed population taken from shaking incubation (data on top, images from each population on the bottom). Flocculation efficiency was significantly higher in 13/20 evolved populations (significance at the overall α=0.05 level denoted by asterisks). Shown are the mean and standard deviation of four biological replicates normalized to the mean of the ancestor. Representative images of ancestral (G) and evolved (H) floc yeast (genotype F4), showing fewer planktonic cells in the evolved isolate with higher flocculation efficiency.
Figure 2—figure supplement 1

Size distributions for evolved snowflake isolates.
Size distributions of evolved isolates of individual snowflake populations. Overlay shown in Figure 2B.
Figure 2—figure supplement 2

Flocculation efficiency is not dependent upon cell concentration of cultures.
(A) Culture densities (cells/mL) of stationary phase cultures of ancestor and evolved floc populations. (B) There is not a strong correlation between culture density and flocculation efficiency. (C) Histograms of pixel values from floc populations with the highest flocculation efficiencies (population F7 and F18, see Figure 2G). Pixel opacity does not saturate at either high or low pixel values, demonstrating that our method has a broad enough dynamic range to measure the opacity of both cells in a planktonic phase as well as large, optically dense clusters.
Figure 2—figure supplement 3

Clonal and aggregative yeast model system.
(A) Snowflake yeast were constructed by deleting a gene responsible for mother-daughter cell separation following division, ACE2, resulting in clonal clusters, shown by fluorescently tagged clusters that are remain all green or all red during co-culture. Images adapted from Pentz et al., 2020. (B) Floc yeast were constructed by inserting a gene that confers strong flocculation, FLO1, resulting in chimeric clusters where fluorescently tagged cells will randomly aggregate, creating chimeric green and red clusters. (C, D) Simple schematics representing snowflake and flocculating yeast life cycles.
Figure 2—figure supplement 4

Sensitivity analysis of biomass-transformation algorithm to bin sizes.
(A) Size distributions of ancestor and evolved snowflake yeast (data from Figure 2B) biomass-transformed with different bin sizes. (B) Mean cluster size of new size distributions is robust to a range of bin sizes.
Figure 3
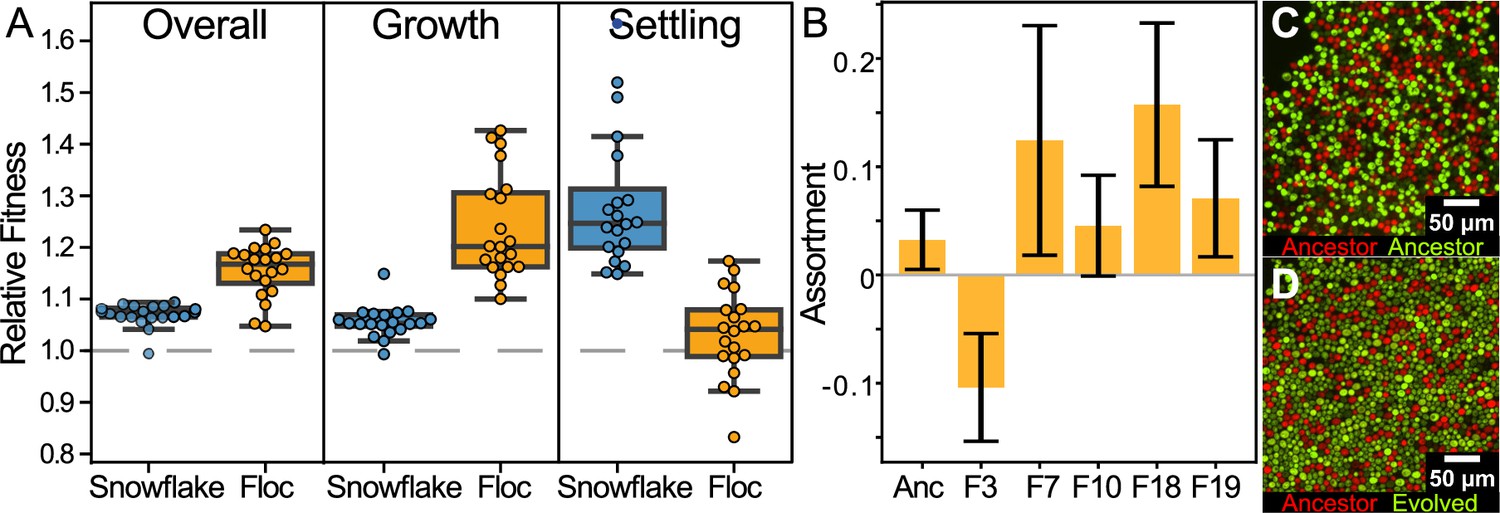
Examining fitness during growth and group-dependent competition.
(A) When competing against their ancestors, both snowflake and floc yeast increased fitness in our experimental regime (first panel). Floc yeast had a 15% average fitness increase over three days with daily selection for settling, while snowflake yeast had a 7% increase. However, snowflake and floc yeast evolved distinct differences in their fitness during the growth and settling selection phases of our experiment. Floc yeast obtained a 30% fitness advantage during growth, but showed no detectable increase in fitness during settling selection. Alternatively, snowflake yeast had a 28% fitness advantage during settling but only a 6% advantage during growth. Data points show the mean of four biological replicates for each evolved isolate. (B) When competing against their ancestor, representative floc isolates formed groups with low genetic assortment. This may explain the decoupling between dramatically increased group sedimentation rate (Figure 1B), and the negligible increase in fitness during settling selection. Shown are the mean and standard deviation of three and six biological replicates for the evolved isolates and ancestor, respectively. Representative flocs are shown in (C&D), with the ancestor competing against itself, or a RFP-labeled ancestor competing against an GFP-labeled 24-week evolved isolate (genotype F10).
Figure 4 with 2 supplements
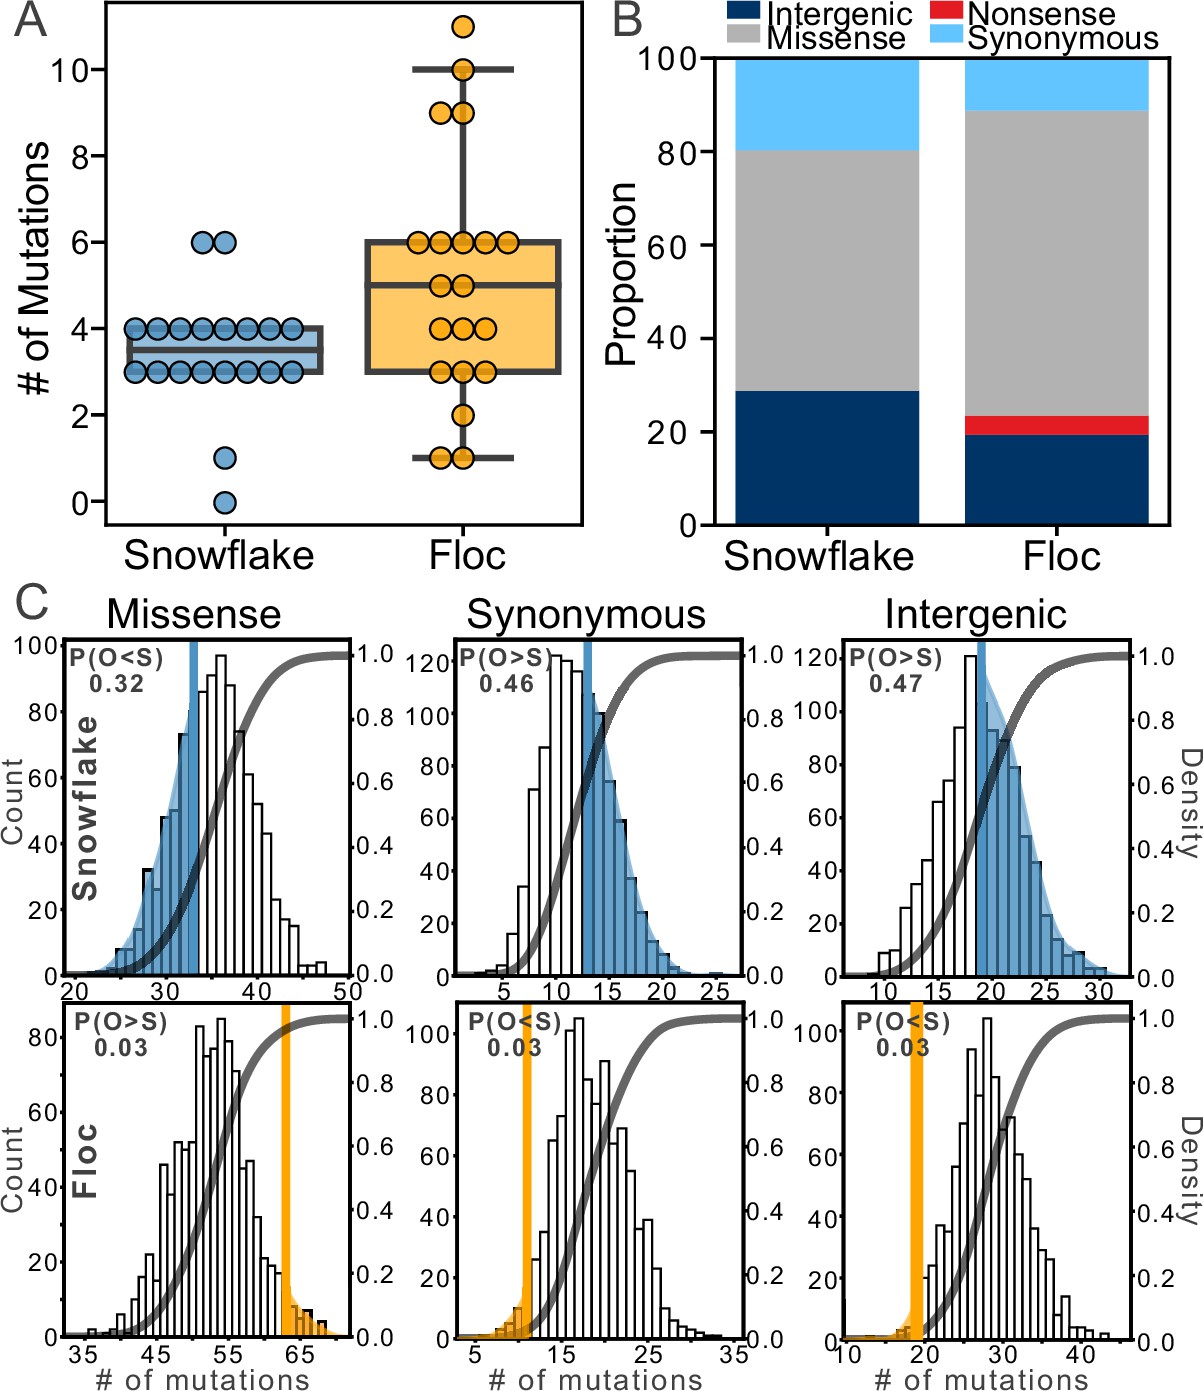
Examining mutations for signatures of selection.
After 24 weeks of evolution, floc yeast accumulated more mutations on average than snowflake yeast (5 vs 3, respectively, A). We categorized these mutations into four broad classes (B), then compared the number of each type of mutation to expectations based on a simulation of neutral evolution (C). We cannot distinguish the overall pattern of mutations in snowflake yeast from neutral expectations. In contrast, floc yeast showed strong evidence of selection, with more missense mutations and fewer synonymous and intergenic mutations than expected. The number in the upper left-hand corner of each subplot reports the shaded area of each distribution, which is the proportion of simulated runs in that observed a result at least as extreme as the observed number of mutations of that type we identified, pooling across all 20 floc and snowflake genotypes.
Figure 4—figure supplement 1

Number of doublings per day in snowflake and floc yeast over the course of our 24-week selection experiment.
To assay the number of generations floc and snowflake yeast experienced over the duration of our selection experiment, we measured the number of doublings per day, quantified as the log2(density after 24 hr/density post-selection) every three weeks. On average, both snowflake and floc yeast experienced 4–5 doublings per day. Thus, over the course of 24 weeks, both snowflake and floc yeast underwent ~700 generations. Error bars represent standard deviation of three biological replicates.
Figure 4—figure supplement 2

Growth adaptation control for floc.
To determine if adaptation to growth on galactose increases flocculation as a pleiotropic side effect, we evolved five populations of floc for eight weeks with daily growth rate selection on YPG. These evolved a~20% increase in fitness during growth (one-way ANOVA; F5,12=59.45, p<0.0001, pairwise differences assessed with Tukey’s post-hoc HSD with α=0.05), but a~40% reduction in flocculation efficiency (one-way ANOVA; F5,18=27.26, p<0.0001, pairwise differences assessed with Tukey’s post-doc HSD with α=0.05), demonstrating that adaptation to faster growth alone does not drive increased flocculation. Shown is the mean and standard deviation of 3 and 4 biological replicates for fitness during growth and flocculation efficiency, respectively, normalized to the mean of the ancestor.
Figure 5 with 1 supplement
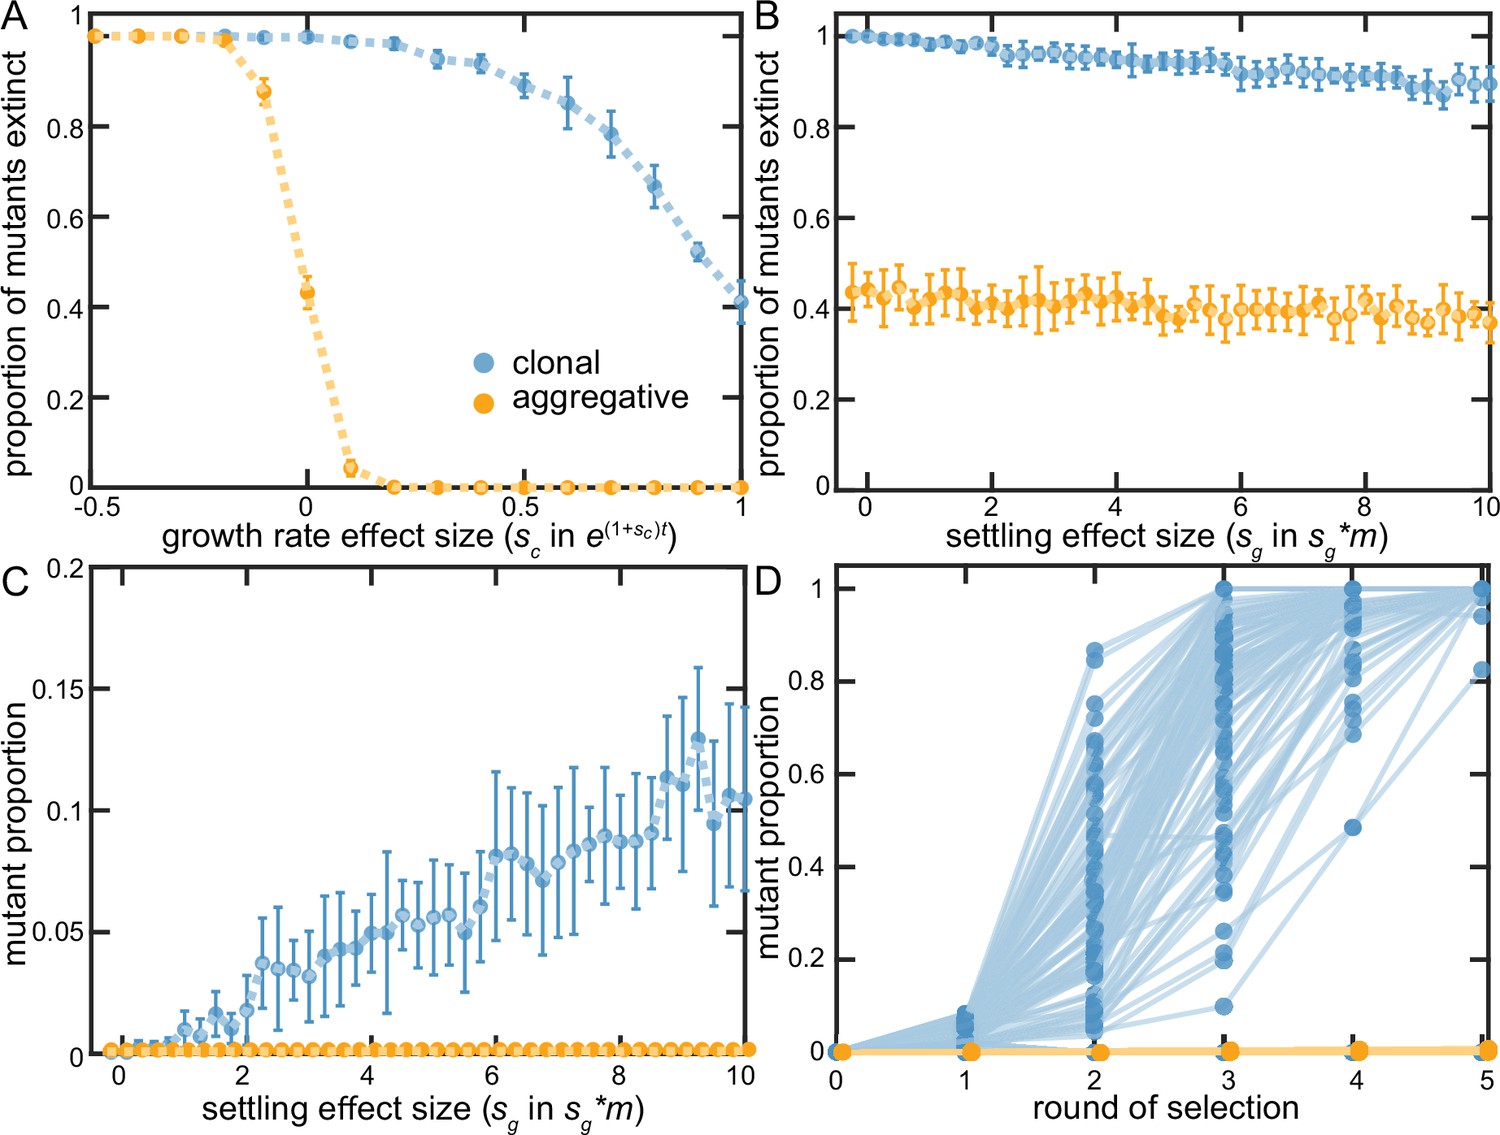
Examining clonal vs. aggregative development in a simple model.
We examined the ability of organisms that develop clonally or aggregatively to fix mutations that increase growth rate (A) or group survival (B–D). Aggregative organisms readily fixed growth beneficial mutations (A), but were unable to act upon group-beneficial mutations (B&C). In contrast, clonally-developing organisms were capable of fixing mutations that improve both growth and the survival of their group, though they faced far more stochastic loss of each type of beneficial mutation than floc. B-D show that clonal development stochastically loses even strongly group beneficial mutants a majority of the time due to sampling error (in D, sg = 10), but when these mutations persist beyond the first two rounds of selection, they rapidly fix. Note that 88% of the beneficial mutants within the clonal lineages went extinct in D.
Figure 5—figure supplement 1

Fixation of beneficial mutations in floc and snowflake yeast under different bottleneck sizes.
We ran our model under different parameters of the bottleneck size (dictated by the dilution factor each day during size-based selection), X. We reran the simulations for Figure 5 with X=50 (a 2-fold smaller bottleneck han in our original model), and with a far less restrictrive bottleneck of X=1000. Variation in bottleneck size had little substantial effect on our overall model results. One notable change is that the proportion of sg mutants that go extinct in aggregative life cycles decreases for X=1000 as compared to X=100 (B, C, F, G, J, and K). This is because the odds of having multiple mutants in the same group has now increased, and they can greatly increase the probability that their group survives. This same effect causes sg mutants to spread faster in both life cycles (D, H, and L).
Author response image 1

Tables
Table 1
Strains used in this study.
| Strain | Relevant Genotype | Reference |
|---|---|---|
| Snowflake | Δace2::HYGMX / Δace2::HYGMX | Pentz et al., 2020 |
| Floc | Δura3::KAN-GAL1p::FLO1 / Δura3::KAN-GAL1p::FLO1 | Pentz et al., 2020 |
| Snowflake-GFP | Δlys2::TEF2p-yeGFP / Δlys2::TEF2p-yeGFP | Pentz et al., 2020 |
| Floc-GFP | Δlys2::TEF2p-yeGFP / Δlys2::TEF2p-yeGFP | Pentz et al., 2020 |
Additional files
-
Supplementary file 1
List of mutations found in evolved snowflake yeast isolates.
- https://cdn.elifesciences.org/articles/84336/elife-84336-supp1-v1.xlsx
-
Supplementary file 2
List of mutations found in evolved floc yeast isolates.
- https://cdn.elifesciences.org/articles/84336/elife-84336-supp2-v1.xlsx
-
MDAR checklist
- https://cdn.elifesciences.org/articles/84336/elife-84336-mdarchecklist1-v1.docx
Download links
A two-part list of links to download the article, or parts of the article, in various formats.
Downloads (link to download the article as PDF)
Open citations (links to open the citations from this article in various online reference manager services)
Cite this article (links to download the citations from this article in formats compatible with various reference manager tools)
Evolutionary consequences of nascent multicellular life cycles
eLife 12:e84336.
https://doi.org/10.7554/eLife.84336


