FUS regulates RAN translation through modulating the G-quadruplex structure of GGGGCC repeat RNA in C9orf72-linked ALS/FTD
- Department of Neurology, Kindai University Faculty of Medicine, Japan
- Department of Neurology, Kyoto Prefectural University of Medicine, Japan
- Department of Neurotherapeutics, Osaka University Graduate School of Medicine, Japan
- Department of Degenerative Neurological Diseases, National Institute of Neuroscience, National Center of Neurology and Psychiatry, Japan
- Department of Neurology and Neurological Science, Tokyo Medical and Dental University, Japan
- School of Life Science and Technology, Tokyo Institute of Technology, Japan
- Laboratory of Molecular Biophysics, Institute for Protein Research, Osaka University, Japan
- Department of Regulatory Bioorganic Chemistry, The Institute of Scientific and28 Industrial Research, Osaka University, Japan
- Research Center for Micro-nano Technology, Hosei University, Japan
- Department of Neuroscience, Mayo Clinic, United States
- Department of Psychiatry, Osaka University Graduate School of Medicine, Japan
- Department of Chemistry, Keio University, Japan
- Department of Neurology, Clinical Neuroscience Branch, Brain Research Institute, Niigata University, Japan
- Life Science Research Institute, Kindai University, Japan
- Department of Neurology, Osaka University Graduate School of Medicine, Japan
- Cell Biology Center, Institute of Innovative Research, Tokyo Institute of Technology, Japan
Figures
Figure 1 with 2 supplements
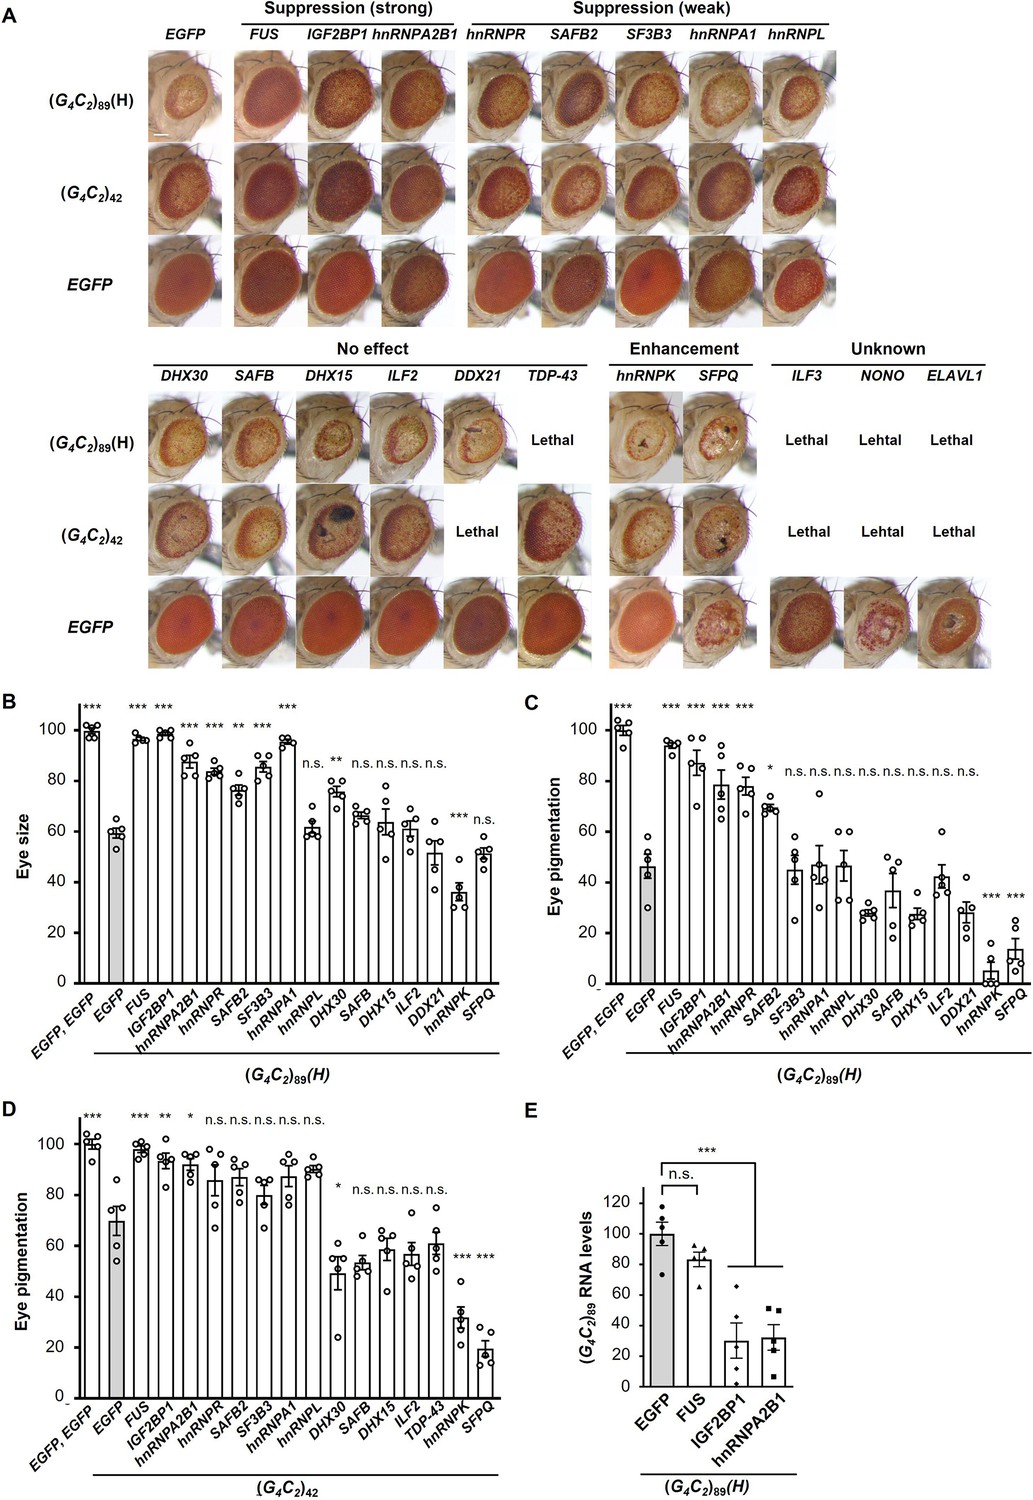
Screening for RNA-binding proteins (RBPs) that suppress G4C2 repeat-induced toxicity in C9-ALS/FTD flies.
(A) Light microscopic images of the eyes in flies expressing both (G4C2)42 or 89 and the indicated RBPs using the GMR-Gal4 driver. Coexpression of FUS, IGF2BP1, or hnRNPA2B suppressed eye degeneration in both (G4C2)42 and (G4C2)89 flies, indicated by ‘Suppression (strong).’ Coexpression of hnRNPR, SAFB2, SF3B3, hnRNPA1, or hnRNPL suppressed eye degeneration in either (G4C2)42 or (G4C2)89 flies, indicated by ‘Suppression (weak)’ (see also Figure 1—source data 2). Scale bar: 100 μm. (B) Quantification of eye size in (G4C2)89 flies coexpressing the indicated RBPs (n = 5). (C, D) Quantification of eye pigmentation in (G4C2)89 flies (C) or (G4C2)42 flies (D) coexpressing the indicated RBPs (n = 5). (E) Expression levels of (G4C2)89 RNA in flies expressing both (G4C2)89 and the indicated RBPs using the GMR-Gal4 driver (five independent experiments, n = 25 flies per genotype). The (G4C2)89(H) fly line expresses (G4C2)89 RNA at a high level (see also Figure 1—figure supplement 1). In (B–E), data are presented as the mean ± SEM; p<0.0001, as assessed by one-way ANOVA; n.s., not significant, *p<0.05, **p<0.01, and ***p<0.001, as assessed by Tukey’s post hoc analysis. The detailed statistical information is summarized in Figure 1—source data 3.
-
Figure 1—source data 1
RNA-binding proteins and their cDNA accession numbers screened in the genetic analyses in Figure 1.
- https://cdn.elifesciences.org/articles/84338/elife-84338-fig1-data1-v1.xlsx
-
Figure 1—source data 2
Summary of the genetic analyses in Figure 1.
- https://cdn.elifesciences.org/articles/84338/elife-84338-fig1-data2-v1.xlsx
-
Figure 1—source data 3
Statistical data related to Figure 1B–E.
- https://cdn.elifesciences.org/articles/84338/elife-84338-fig1-data3-v1.xlsx
Figure 1—figure supplement 1
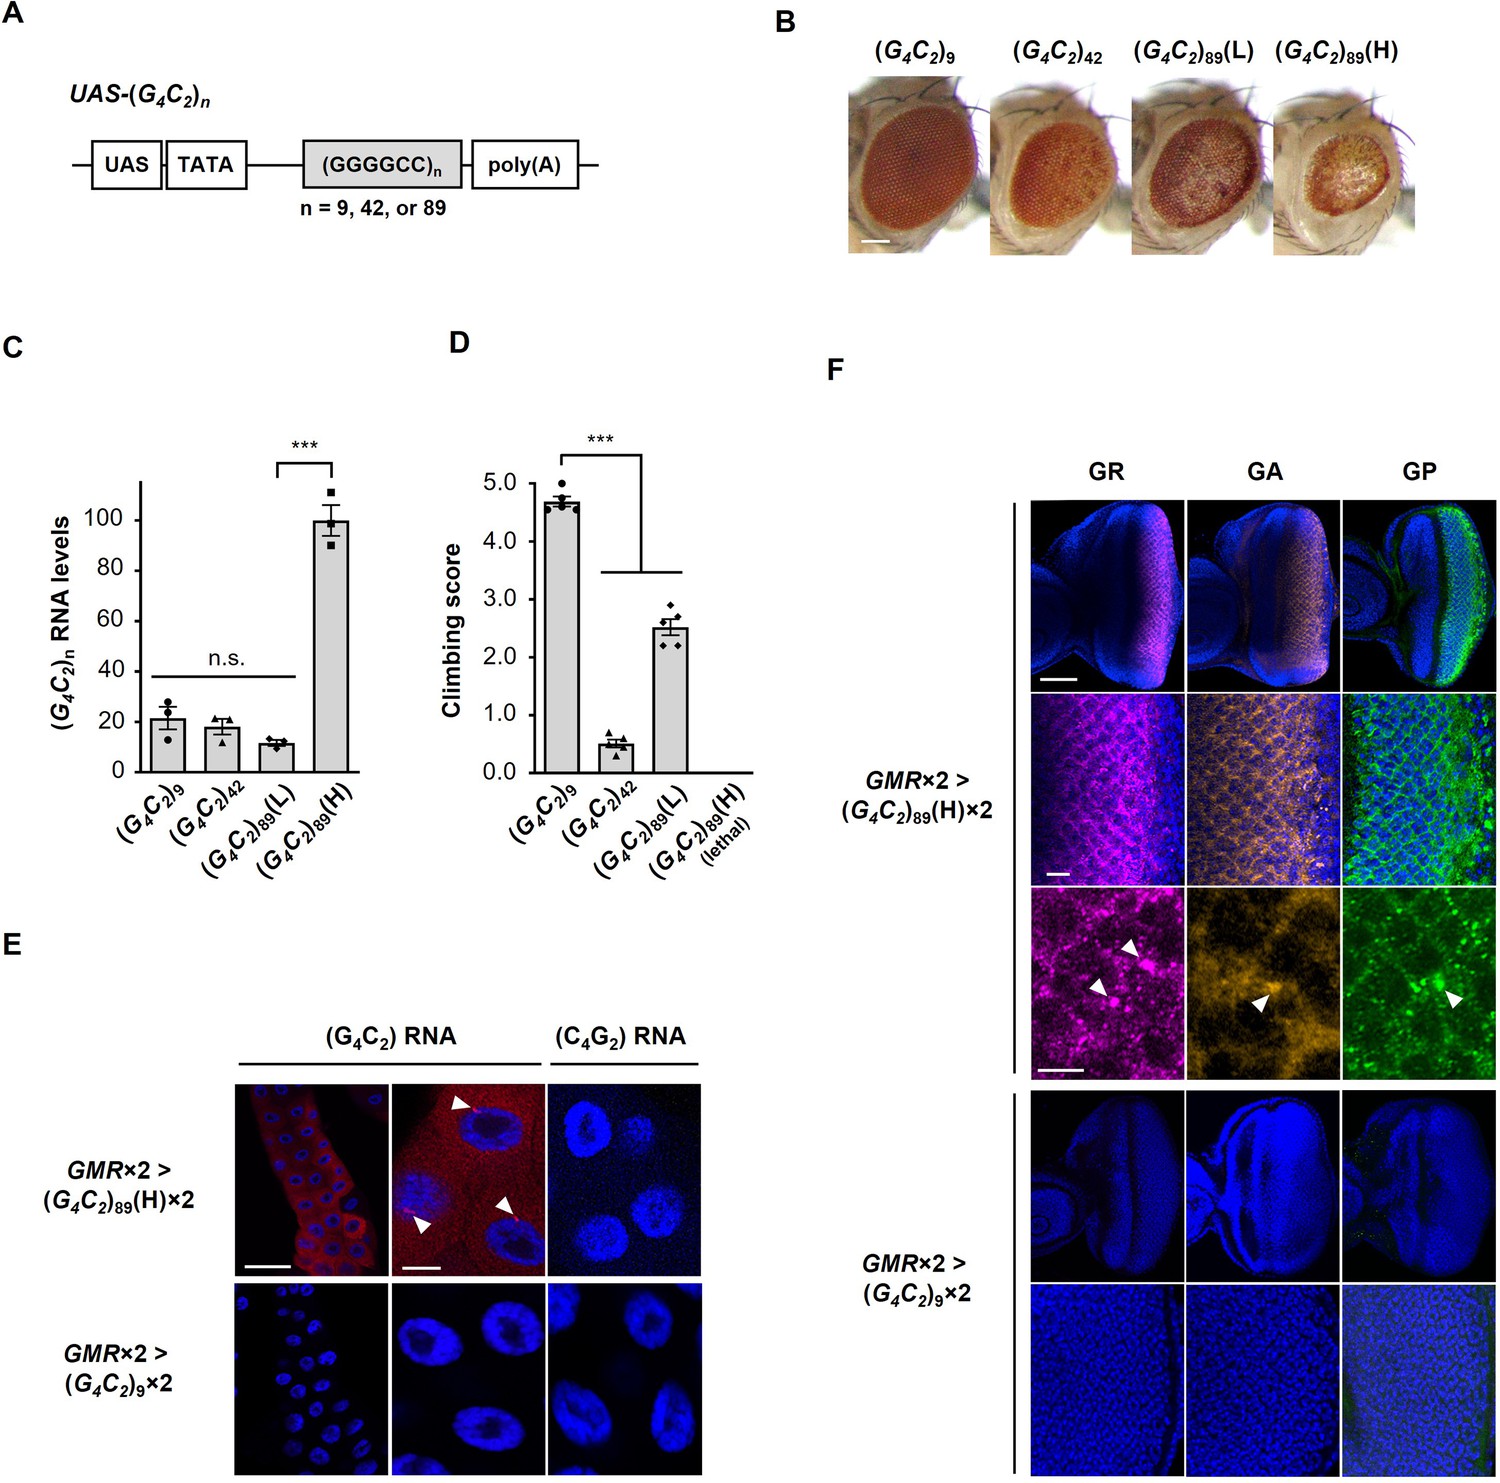
Characterization of C9-ALS/FTD flies.
(A) (G4C2)n constructs used in this study. These constructs do not include an ATG start codon downstream of the UAS sequence, and were expressed in a tissue-specific manner using the GAL4-UAS system. (B) Light microscopic images of the eyes in flies expressing (G4C2)n using the GMR-Gal4 driver. Scale bar: 100 μm. (C) Expression levels of (G4C2)n RNAs in flies expressing (G4C2)n using the GMR-Gal4 driver. Strong eye degeneration with decreased eye size and loss of pigmentation was observed in (G4C2)42 or 89 flies, but not in (G4C2)9 flies. Eye degeneration was confirmed in (G4C2)42 and two (G4C2)89 independent fly lines. Degree of eye degeneration in two (G4C2)89 fly lines was expression-level dependent [(L) vs. (H) in (G4C2)89] (three independent experiments, n = 15 flies per each genotype). Expression of G4C2 repeat RNA of the sense transcripts but not that of the antisense transcripts was confirmed. (D) Climbing ability at 1 d of age in flies expressing (G4C2)n using the elav-Gal4 driver. Flies expressing (G4C2)89(H) in neurons showed lethality. Decreasing climbing ability was observed in (G4C2)42 or 89 flies compared with (G4C2)9 flies (five independent experiments, n = 100 flies per each genotype). (E) Fluorescence in situ hybridization (FISH) analyses of G4C2 repeat RNA in the salivary glands of fly larvae with two copies of GMR-Gal4 and (G4C2)9 or 89 (red: G4C2 RNA; yellow: G2C4 RNA; blue [DAPI]: nuclei). RNA foci formation (arrowheads) of the sense transcripts but not that of the antisense transcripts was confirmed. RNA foci were observed in (G4C2)89 flies, but not in (G4C2)9 flies. Scale bars: 100 μm (low magnification) or 20 μm (high magnification). (F) Immunohistochemical analyses of dipeptide repeat proteins (DPRs) stained with anti-DPR antibodies in the eye imaginal discs of fly larvae with two copies of GMR-Gal4 and (G4C2)9 or 89 (magenta: poly(GR); orange: poly(GA); green: poly(GP); blue [DAPI]: nuclei). Expression and cytoplasmic aggregation (arrowheads) of three DPRs in (G4C2)89 flies, but not in (G4C2)9 flies, were confirmed. Scale bars: 50 μm (low magnification), 10 μm (middle magnification), and 5 μm (high magnification). In (B–F), L: low-expression line; H: high-expression line. In (C, D), data are presented as the mean ± SEM; p<0.0001, as assessed by one-way ANOVA; n.s., not significant, and ***p<0.001, as assessed by Tukey’s post hoc analysis. The detailed statistical information is summarized in Figure 1—figure supplement 1—source data 2.
-
Figure 1—figure supplement 1—source data 1
The artificial sequence inserted in the pUAST vector for generation of (G4C2)n flies.
- https://cdn.elifesciences.org/articles/84338/elife-84338-fig1-figsupp1-data1-v1.xlsx
-
Figure 1—figure supplement 1—source data 2
Statistical data related to Figure 1—figure supplement 1C and D.
- https://cdn.elifesciences.org/articles/84338/elife-84338-fig1-figsupp1-data2-v1.xlsx
Figure 1—figure supplement 2

Coexpression of FUS suppresses G4C2 repeat-induced toxicity in flies expressing (G4C2)89.
(A) Light microscopic images of the eyes in flies expressing both (G4C2)42 or 89 and FUS using the GMR-Gal4 driver. FUS-2 and FUS-3 are different strains from that in Figure 1. Scale bar: 100 μm. (B) Quantification of the eye size in (G4C2)89 flies of the indicated genotypes (n = 10). (C, D) Quantification of eye pigmentation in (G4C2)89 flies (C) or (G4C2)42 flies (D) of the indicated genotypes (n = 10). In (B–D), data are presented as the mean ± SEM; p<0.0001, as assessed by one-way ANOVA; ***p<0.001, as assessed by Tukey’s post hoc analysis. The detailed statistical information is summarized in Figure 1—figure supplement 2—source data 1.
-
Figure 1—figure supplement 2—source data 1
Statistical data related to Figure 1—figure supplement 2B–D.
- https://cdn.elifesciences.org/articles/84338/elife-84338-fig1-figsupp2-data1-v1.xlsx
Figure 2 with 1 supplement

FUS suppresses G4C2 repeat-induced toxicity via its RNA-binding activity.
(A) Light microscopic images of the eyes in flies expressing both (G4C2)89 and either FUS or FUS-RRMmut using the GMR-Gal4 driver. Scale bar: 100 μm. (B) Quantification of eye size in the flies of the indicated genotypes (n = 10). (C) Quantification of eye pigmentation in the flies of the indicated genotypes (n = 10). (D) Egg-to-adult viability in flies expressing both (G4C2)42 and either FUS or FUS-RRMmut using the GMR-Gal4 driver (>500 flies per genotype). (E) Climbing ability in flies expressing both (G4C2)42 and FUS using the elav-GeneSwitch driver (five independent experiments, n = 100 flies per each genotype). In (B–E), data are presented as the mean ± SEM. In (B, C), p<0.0001, as assessed by one-way ANOVA; n.s., not significant, and ***p<0.001, as assessed by Tukey’s post hoc analysis. In (D), n.s., not significant and ***p<0.001, as assessed by Tukey’s multiple-comparison test using wholly significant difference. In (E), n.s., not significant, *p<0.05, **p<0.01, and ***p<0.001, as assessed by two-way repeated-measures ANOVA with Tukey’s post hoc analysis. The detailed statistical information is summarized in Figure 2—source data 1.
-
Figure 2—source data 1
Statistical data related to Figure 2B–E.
- https://cdn.elifesciences.org/articles/84338/elife-84338-fig2-data1-v1.xlsx
Figure 2—figure supplement 1

Western blot analysis showing expression levels of FUS and FUS-RRMmut proteins.
(A) Western blot analysis of the FUS and FUS-RRMmut proteins in the heads of adult flies expressing EGFP, FUS, or FUS-RRMmut using the GMR-Gal4 driver, with an anti-FUS antibody. The arrowhead indicates bands from the FUS and FUS-RRMmut proteins, whereas the asterisk indicates bands resulting from nonspecific antibody binding. (B) Quantification of the FUS and FUS-RRMmut proteins from the western blot analysis in (A) (n = 3). In (B), data are presented as the mean ± SEM; n.s., not significant, as assessed by the unpaired t-test. The detailed statistical information is summarized in Figure 2—figure supplement 1—source data 1.
-
Figure 2—figure supplement 1—source data 1
Statistical data related to Figure 2—figure supplement 1B.
- https://cdn.elifesciences.org/articles/84338/elife-84338-fig2-figsupp1-data1-v1.xlsx
-
Figure 2—figure supplement 1—source data 2
Source data related to Figure 2—figure supplement 1A.
- https://cdn.elifesciences.org/articles/84338/elife-84338-fig2-figsupp1-data2-v1.zip
Figure 3 with 2 supplements
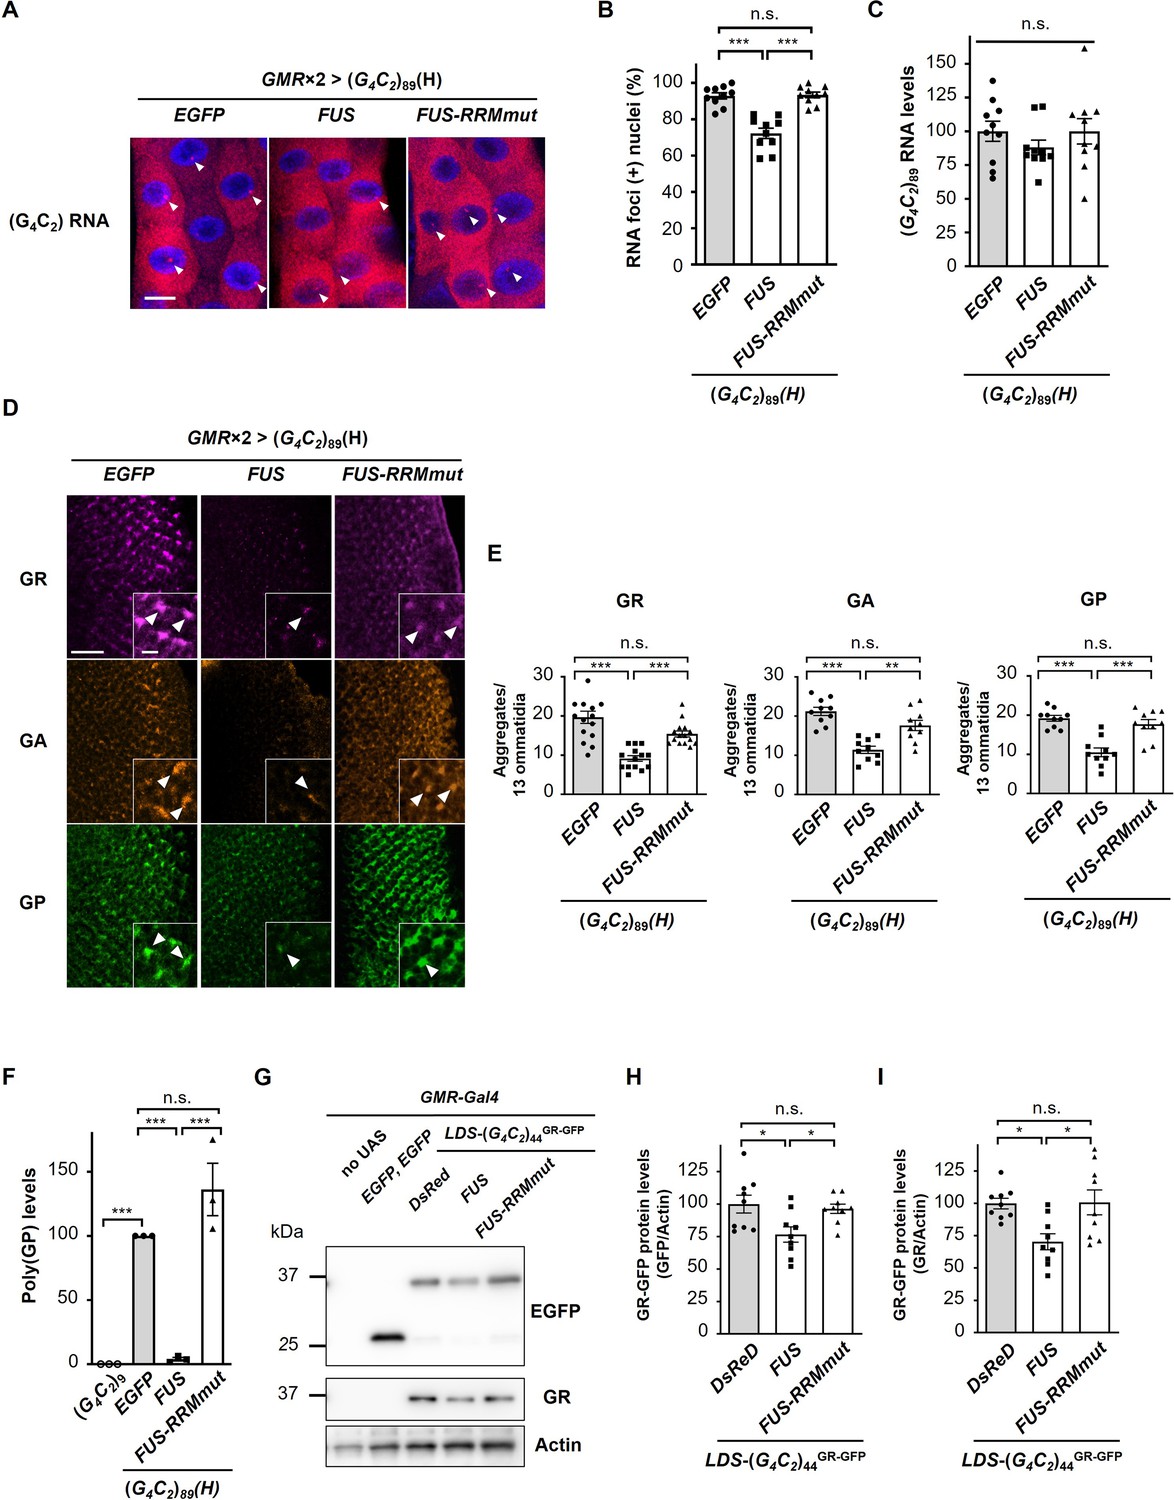
FUS suppresses RNA foci formation and RAN translation from G4C2 repeat RNA.
(A) Fluorescence in situ hybridization (FISH) analyses of G4C2 repeat RNA in the salivary glands of fly larvae expressing both (G4C2)89 and either FUS or FUS-RRMmut using two copies of the GMR-Gal4 driver (red: G4C2 RNA; blue [DAPI]: nuclei). Arrowheads indicate RNA foci. Scale bar: 20 μm. (B) Quantification of the number of nuclei containing RNA foci from the FISH analyses in (A) (n = 10). (C) Expression levels of (G4C2)89 RNA in fly larvae expressing both (G4C2)89 and either FUS or FUS-RRMmut using the GMR-Gal4 driver (10 independent experiments, n = 50 flies per each genotype). (D) Immunohistochemical analyses of dipeptide repeat proteins (DPRs) stained with anti-DPR antibodies in the eye imaginal discs of fly larvae expressing both (G4C2)89 and either FUS or FUS-RRMmut using two copies of the GMR-Gal4 driver (magenta: poly(GR); orange: poly(GA); green: poly(GP)). Arrowheads indicate cytoplasmic aggregates. Scale bars: 20 μm (low magnification) or 5 μm (high magnification). (E) Quantification of the number of DPR aggregates from the immunohistochemical analyses in (D) (n = 14 or 15 [GR], or 10 [GA or GP]). (F) Immunoassay to determine poly(GP) levels in flies expressing both (G4C2)89 and either FUS or FUS-RRMmut using the GMR-Gal4 driver (three independent experiments, n = 30 flies per each genotype). (G) Western blot analysis of the heads of adult flies expressing both LDS-(G4C2)44GR-GFP and any of DsRed, FUS or FUS-RRMmut using the GMR-Gal4 driver, using either an anti-GFP (upper panel) or anti-GR antibody (middle panel). (H, I) Quantification of GR-GFP protein levels from the western blot analysis in (G) (nine independent experiments, n = 90 flies per each genotype). In (B, C, E, F, H, I), data are presented as the mean ± SEM. In (B, E, F), p<0.0001, as assessed by one-way ANOVA; n.s., not significant, *p<0.05, **p<0.01, and ***p<0.001, as assessed by Tukey’s post hoc analysis. In (C), p=0.452, as assessed by one-way ANOVA; n.s., not significant, as assessed by Tukey’s post hoc analysis. In (H), p=0.0148, as assessed by one-way ANOVA; n.s., not significant and *p<0.05, as assessed by Tukey’s post hoc analysis. In (I), p=0.0072, as assessed by one-way ANOVA; n.s., not significant and *p<0.05, as assessed by Tukey’s post hoc analysis. The detailed statistical information is summarized in Figure 3—source data 1.
-
Figure 3—source data 1
Statistical data related to Figure 3B, C, E, F, H and I.
- https://cdn.elifesciences.org/articles/84338/elife-84338-fig3-data1-v1.xlsx
-
Figure 3—source data 2
Source data related to Figure 3G.
- https://cdn.elifesciences.org/articles/84338/elife-84338-fig3-data2-v1.zip
Figure 3—figure supplement 1

Schema of the LDS-(G4C2)44GR-GFP construct.
Schema of the LDS-(G4C2)44GR-GFP construct containing the (G4C2)44 sequence and 114 nucleotides of the 5′-flanking region of intron 1 of the human C9orf72 G4C2 repeat sequence. A GFP tag in the GR frame was introduced downstream of the (G4C2)44 repeat sequence.
Figure 3—figure supplement 2

Overexpression of FUS does not suppress eye degeneration in dipeptide repeat protein (DPR)-only flies expressing DPRs translated from non-G4C2 RNAs.
Light microscopic images of the eyes in DPR-only flies coexpressing either the poly(GR) or poly(GA) protein, and either FUS or FUS-RRMmut using the GMR-Gal4 driver. Overexpression of FUS did not suppress the eye degeneration in flies expressing either (GR)36 or (GR)100. Overexpression of FUS also caused mild eye degeneration in flies expressing EGFP, (GA)36, or (GA)100, likely due to FUS toxicity.
Figure 4 with 1 supplement
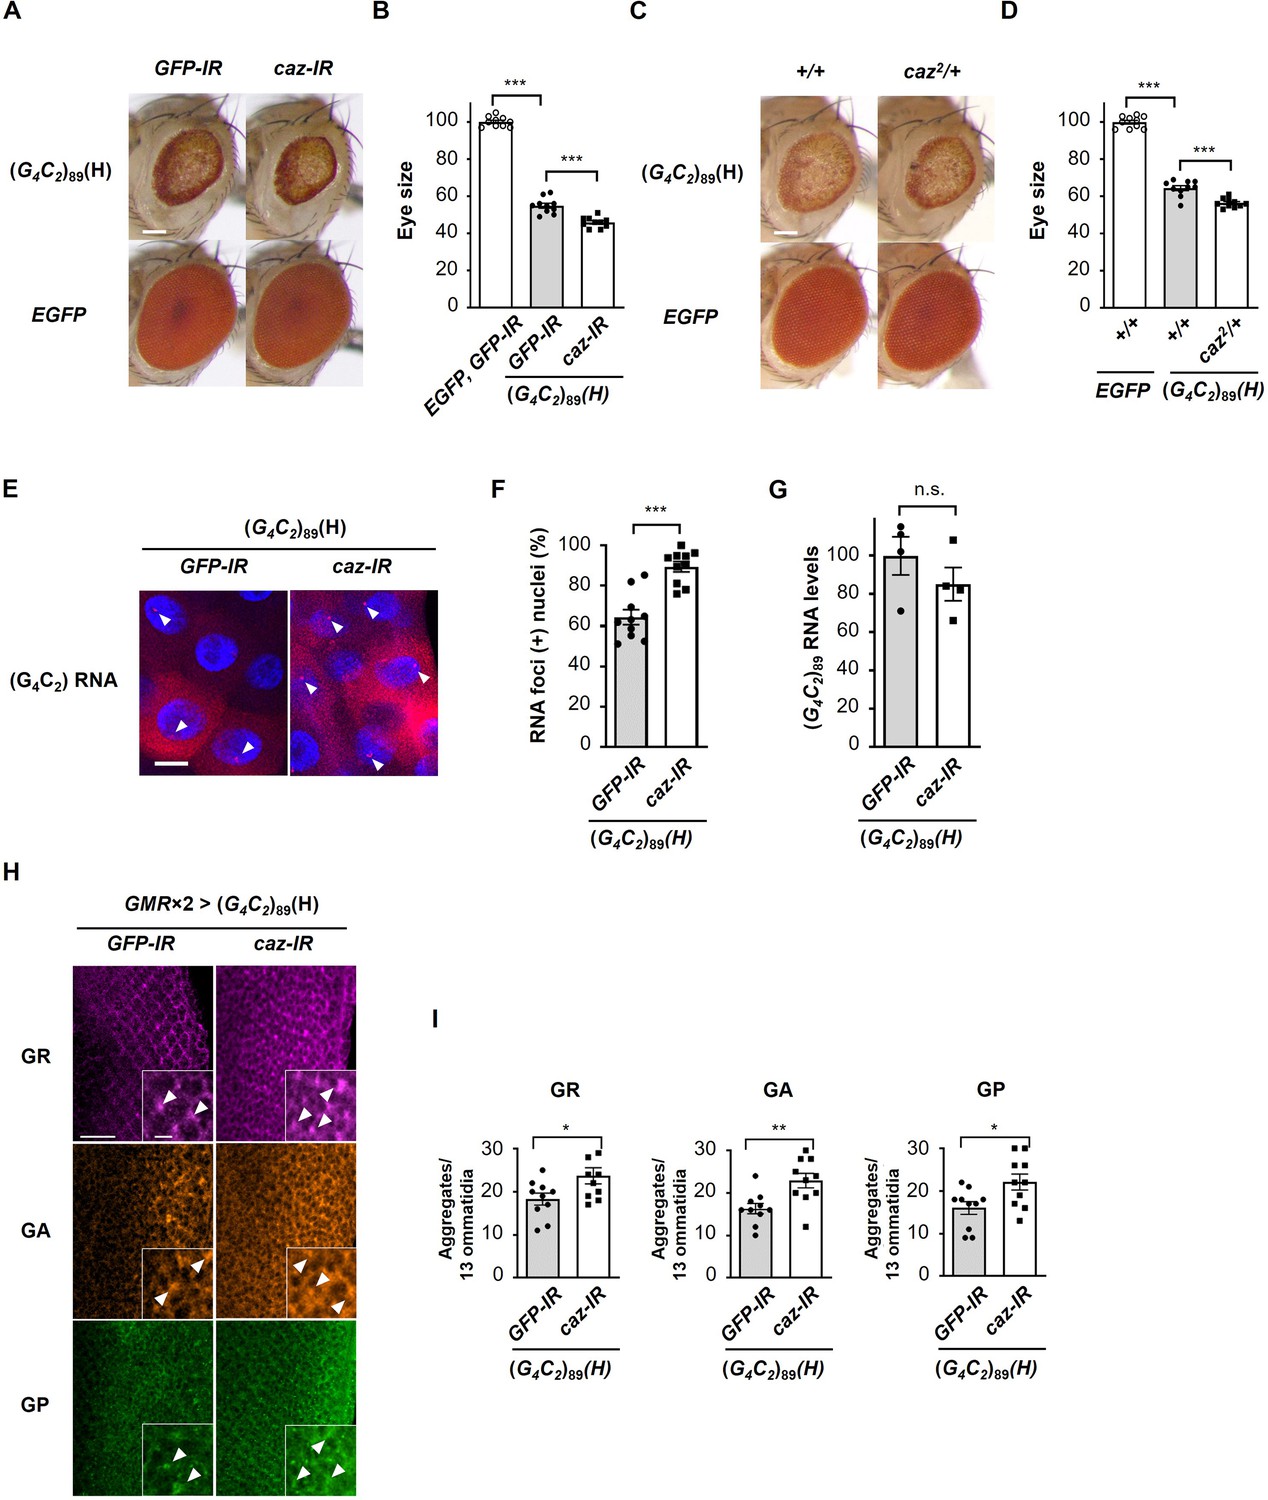
Reduction of endogenous caz expression enhances G4C2 repeat-induced toxicity, RNA foci formation, and dipeptide repeat protein (DPR) aggregation.
(A) Light microscopic images of the eyes in flies expressing (G4C2)89 using the GMR-Gal4 driver, with knockdown of caz. Scale bar: 100 μm. (B) Quantification of eye size in flies of the indicated genotypes shown in (A) (n = 10). (C) Light microscopic images of the eyes in flies expressing (G4C2)89 using the GMR-Gal4 driver, with a hemizygous deletion of caz. Scale bar: 100 μm. (D) Quantification of eye size in the flies of the indicated genotypes shown in (C) (n = 10). (E) Fluorescence in situ hybridization (FISH) analyses of G4C2 repeat RNA in the salivary glands of fly larvae expressing (G4C2)89 using the GMR-Gal4 driver, with knockdown of caz (red: G4C2 RNA; blue [DAPI]: nuclei). Arrowheads indicate RNA foci. Scale bar: 20 μm. (F) Quantification of the number of nuclei containing RNA foci from the FISH analyses in (E) (n = 10). (G) Expression levels of (G4C2)89 RNA in fly larvae expressing (G4C2)89 using the GMR-Gal4 driver, with knockdown of caz (four independent experiments, n = 20 flies per each genotype). (H) Immunohistochemical analyses of DPRs stained with anti-DPR antibodies in the eye imaginal discs of fly larvae expressing (G4C2)89 using two copies of the GMR-Gal4 driver, with the knockdown of caz. (magenta: poly(GR); orange: poly(GA); green: poly(GP)). Arrowheads indicate cytoplasmic aggregates. Scale bars: 20 μm (low magnification) or 5 μm (high magnification). (I) Quantification of the number of DPR aggregates from the immunohistochemical analyses in (H) (n = 10). In (B, D, F, G, I), data are presented as the mean ± SEM. In (B, D), p<0.0001, as assessed by one-way ANOVA; ***p<0.001, as assessed by Tukey’s post hoc analysis. In (F, G, I), n.s., not significant, *p<0.05, **p< 0.01, and ***p<0.001, as assessed by the unpaired t-test. The detailed statistical information is summarized in Figure 4—source data 1.
-
Figure 4—source data 1
Statistical data related to Figure 4B, D, F, G and I.
- https://cdn.elifesciences.org/articles/84338/elife-84338-fig4-data1-v1.xlsx
Figure 4—figure supplement 1
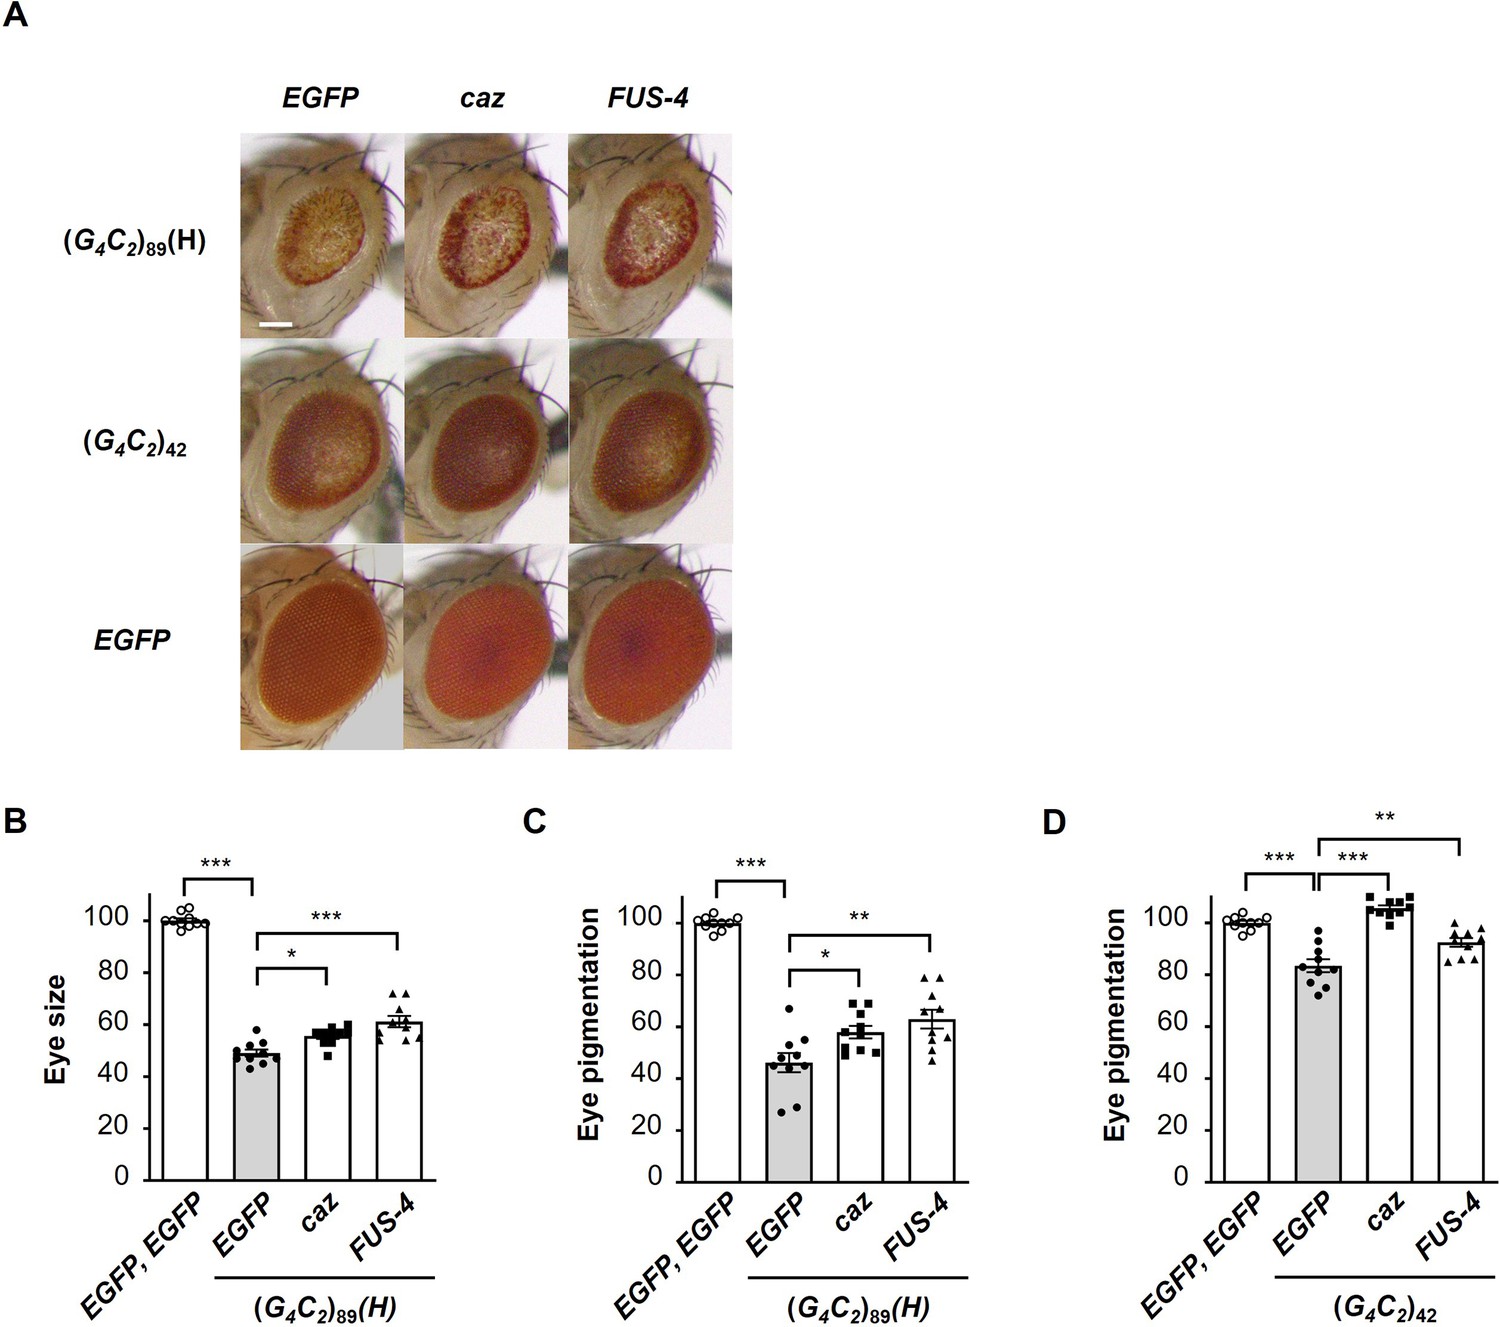
Endogenous caz is a functional homologue of FUS for the suppression of G4C2 repeat-induced toxicity.
(A) Light microscopic images of the eyes in flies expressing both (G4C2)42 or 89 and either caz (FLAG-caz) or FUS-4 (FLAG-FUS) using the GMR-Gal4 driver. FUS-4 is a different strain from those used in Figure 1 and Figure 1—figure supplement 2. Scale bar: 100 μm. (B) Quantification of the eye size in (G4C2)89 flies of the indicated genotypes (n = 10). (C, D) Quantification of eye pigmentation in (G4C2)89 flies (C) or (G4C2)42 flies (D) of the indicated genotypes (n = 10). In (B–D), data are presented as the mean ± SEM; p<0.0001, as assessed by one-way ANOVA; n.s., not significant, *p<0.05, **p<0.01, and ***p<0.001, as assessed by Tukey’s post hoc analysis. The detailed statistical information is summarized in Figure 4—figure supplement 1—source data 1.
-
Figure 4—figure supplement 1—source data 1
Statistical data related to Figure 4—figure supplement 1B–D.
- https://cdn.elifesciences.org/articles/84338/elife-84338-fig4-figsupp1-data1-v1.xlsx
Figure 5 with 2 supplements
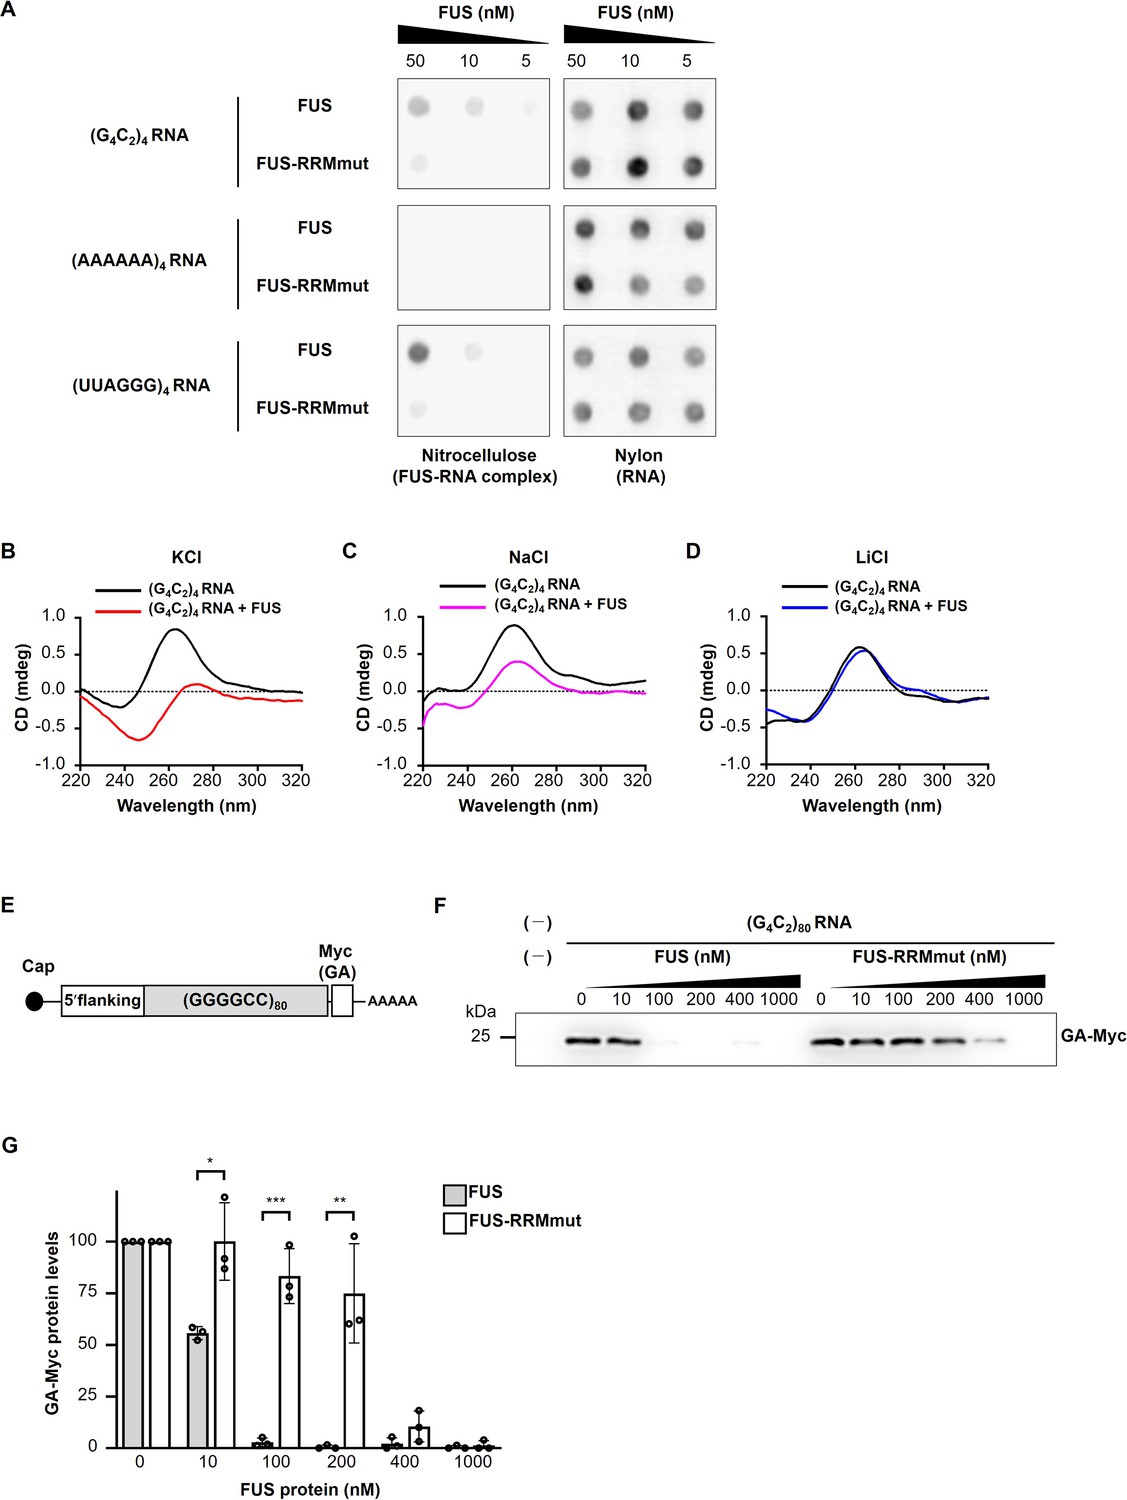
FUS directly binds to and modulates the G-quadruplex structure of G4C2 repeat RNA, resulting in the suppression of RAN translation in vitro.
(A) Analysis of the binding of His-tagged FUS proteins to biotinylated (G4C2)4 RNA by the filter binding assay. The nitrocellulose membrane (left) traps RNA-bound FUS proteins, whereas unbound RNAs are recovered on the nylon membrane (right), and then the RNAs trapped on each of the membranes was probed with streptavidin-horseradish peroxidase (HRP). Biotinylated (AAAAAA)4 and (UUAGGG)4 were used as negative and positive controls, respectively. (B–D) CD spectra of (G4C2)4 RNA incubated with or without FUS in the presence of 150 mM KCl (B), NaCl (C), or LiCl (D). The CD spectrum of FUS alone was subtracted from that of (G4C2)4 RNA incubated with FUS. The original data are shown in Figure 5—figure supplement 2B–2D. (E) Schema of the template RNA containing the (G4C2)80 sequence and 113 nucleotides of the 5′-flanking region of intron 1 of the human C9orf72 G4C2 repeat sequence. A Myc tag in the GA frame was introduced downstream of the (G4C2)80 repeat sequence. (F) Western blot analysis of samples from in vitro translation using rabbit reticulocyte lysate in the presence or absence of increasing concentrations of FUS or FUS-RRMmut. The GA-Myc fusion protein was detected by western blotting using the anti-Myc antibody. (G) Quantification of the GA-Myc fusion protein in (F) (n = 3). In (G), data are presented as the mean ± SEM; *p<0.05, **p<0.01, and ***p<0.001, as assessed by the unpaired t-test. The detailed statistical information is summarized in Figure 5—source data 1.
-
Figure 5—source data 1
Statistical data related to Figure 5G.
- https://cdn.elifesciences.org/articles/84338/elife-84338-fig5-data1-v1.xlsx
-
Figure 5—source data 2
Source data related to Figure 5F.
- https://cdn.elifesciences.org/articles/84338/elife-84338-fig5-data2-v1.zip
Figure 5—figure supplement 1

FUS colocalizes with G4C2 RNA foci.
Combined fluorescence in situ hybridization (FISH) and immunohistochemical analyses of G4C2 repeat RNA and FUS in the salivary glands of flies expressing both (G4C2)89 and FUS using two copies of the GMR-Gal4 driver. Arrowheads indicate colocalization of FUS with RNA foci. Scale bar: 10 μm (low magnification) and 5 μm (high magnification).
Figure 5—figure supplement 2
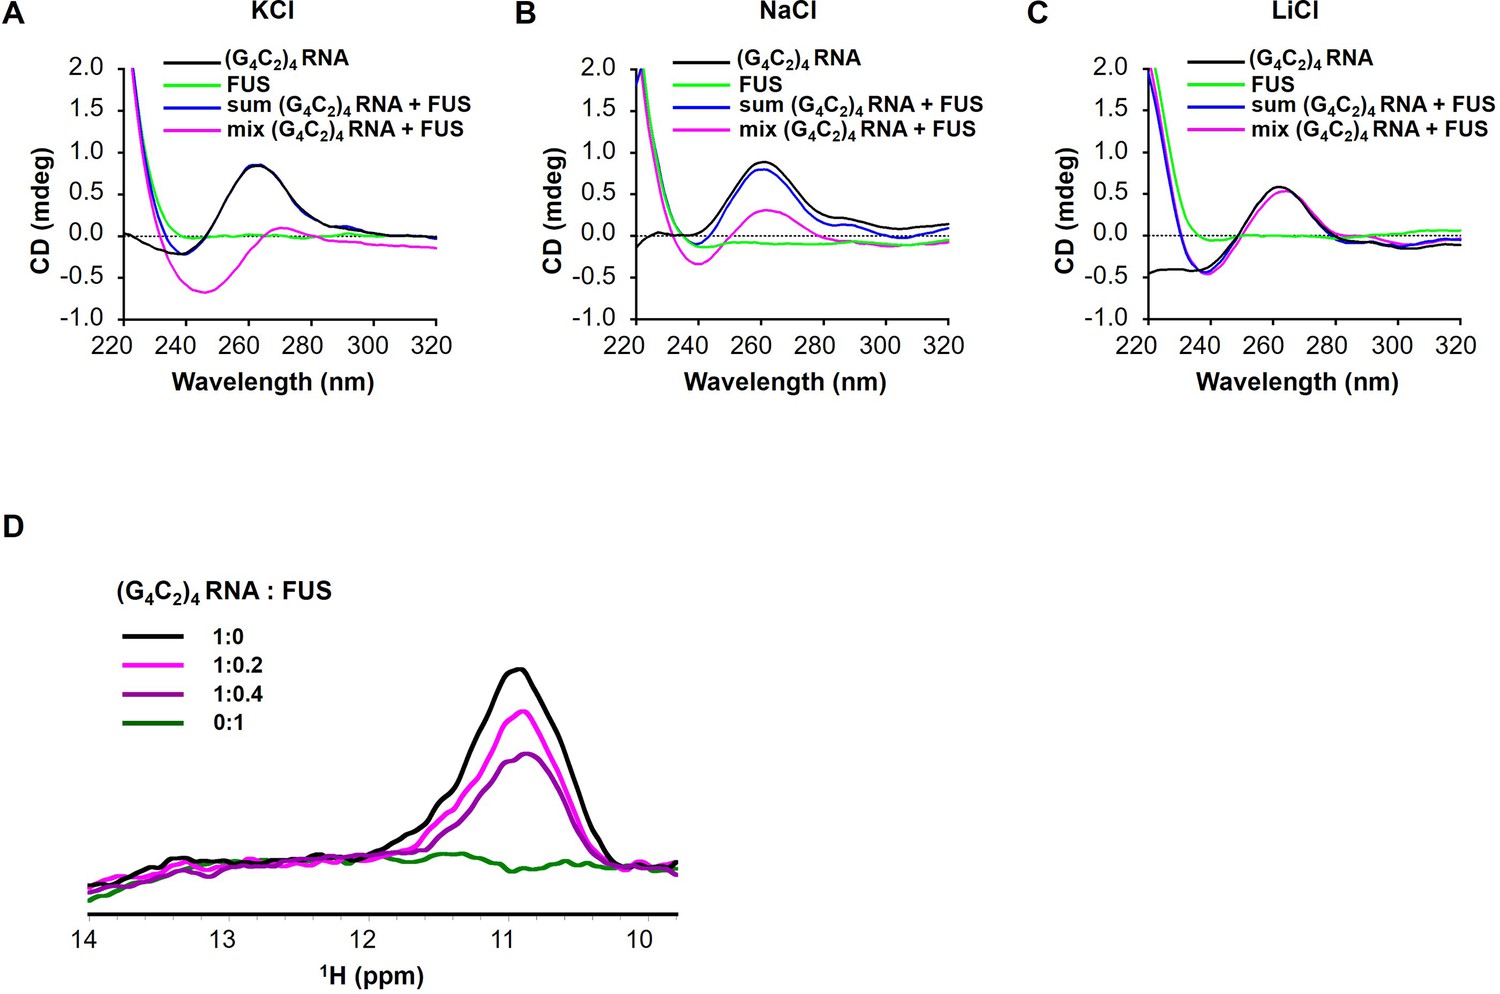
FUS modulates the G-quadruplex structure of G4C2 repeat RNA.
(A–C) CD spectra of (G4C2)4 RNA incubated with or without FUS in the presence of 150 mM KCl (A), NaCl (B), or LiCl (C). CD spectra of (G4C2)4 RNA alone (black), FUS alone (green), sum of (G4C2)4 RNA and FUS (blue), and the spectra of their coincubation (magenta) are shown. FUS interacts with (G4C2)4 RNA under KCl or NaCl buffer conditions. (D) Imino proton NMR spectra of (G4C2)4 RNA incubated with increasing amounts of FUS in the presence of 150 mM KCl.
Figure 6
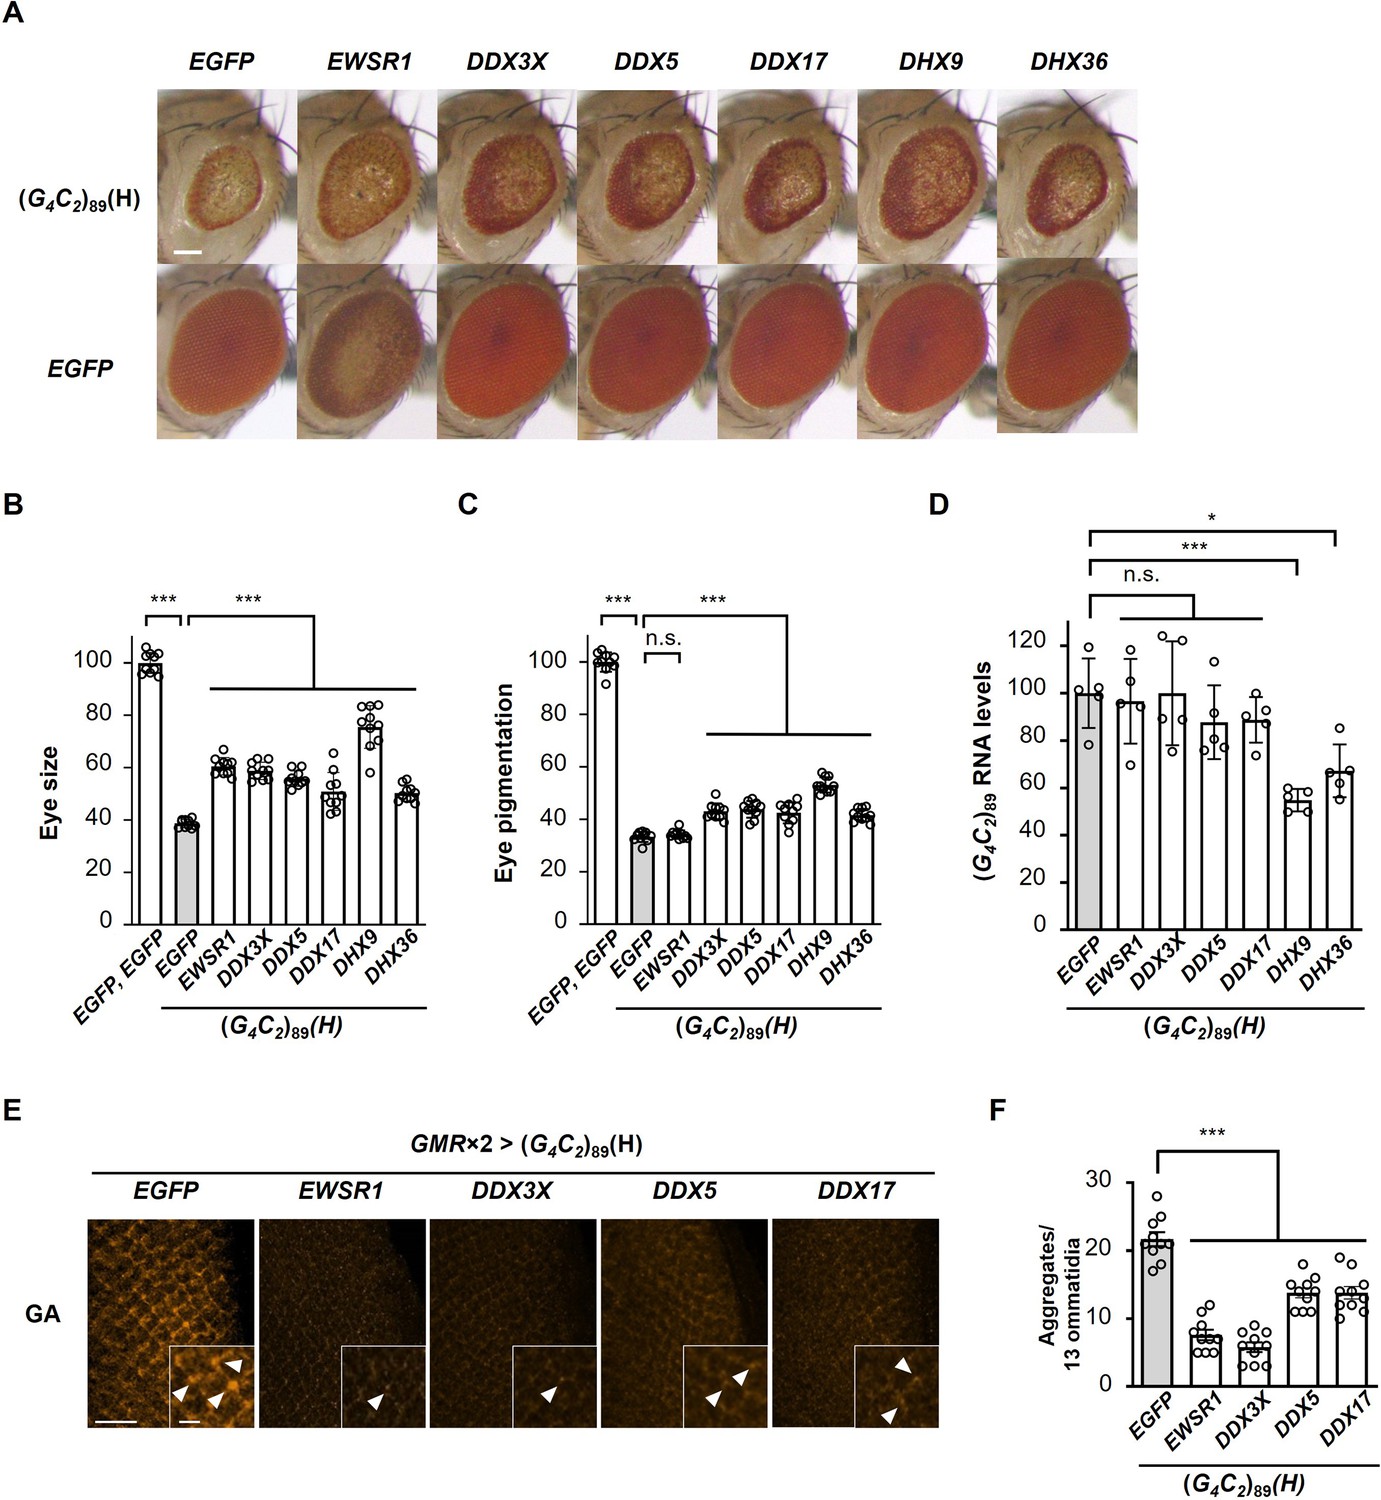
Identification of G-quadruplex-targeting RNA-binding proteins (RBPs) that suppress G4C2 repeat-induced toxicity in C9-ALS/FTD flies.
(A) Light microscopic images of eyes in flies expressing both (G4C2)89 and the indicated G-quadruplex-targeting RBPs using the GMR-Gal4 driver. Scale bar: 100 μm. (B) Quantification of eye size in the flies of the indicated genotypes (n = 10). (C) Quantification of eye pigmentation in the flies of the indicated genotypes (n = 10). (D) Expression levels of (G4C2)89 RNA in flies expressing both (G4C2)89 and the indicated G-quadruplex-targeting RBPs using the GMR-Gal4 driver (five independent experiments, n = 25 flies per each genotype). (E) Immunohistochemical analyses of poly(GA) stained with anti-GA antibody in the eye imaginal discs of fly larvae expressing both (G4C2)89 and the indicated G-quadruplex-targeting RBPs using two copies of the GMR-Gal4 driver (orange: poly(GA)). Arrowheads indicate cytoplasmic aggregates. Scale bars: 20 μm (low magnification) or 5 μm (high magnification). (F) Quantification of the number of poly(GA) aggregates from the immunohistochemical analyses in (E) (n = 10). In (B, C, D, F), data are presented as the mean ± SEM; p<0.0001, as assessed by one-way ANOVA; n.s., not significant, *p<0.05 and ***p<0.001, as assessed by Tukey’s post hoc analysis. The detailed statistical information is summarized in Figure 6—source data 2.
-
Figure 6—source data 1
RNA-binding proteins and their cDNA accession numbers screened in the genetic analyses in Figure 6.
- https://cdn.elifesciences.org/articles/84338/elife-84338-fig6-data1-v1.xlsx
-
Figure 6—source data 2
Statistical data related to Figure 6B–D, F.
- https://cdn.elifesciences.org/articles/84338/elife-84338-fig6-data2-v1.xlsx
Tables
Table 1
Association (ka) and dissociation (kd) rate and dissociation constants (KD) between FUS and (G4C2)4 RNA in different buffers as assessed by surface plasmon resonance (SPR) analysis.
| Buffer | ka (M–1s–1) × 106 | kd (s–1) × 10–3 | KD (M) |
|---|---|---|---|
| KCl | 1.4 | 22 | 1.5 × 10⁻⁸ |
| NaCl | 0.41 | 54 | 1.3 × 10⁻⁷ |
| LiCl | 0.0018 | 25 | 1.4 × 10⁻⁵ |
Key resources table
| Reagent type (species) or resource | Designation | Source or reference | Identifiers | Additional information |
|---|---|---|---|---|
| Strain, strain background (Drosophila melanogaster) | UAS-(G4C2)n, UAS-FUS-2, UAS-FUS-RRMmut | This paper | N/A | See ‘Generation of constructs and transgenic flies’ |
| Strain, strain background (D. melanogaster) | UAS-RBP (FUS-3; IGF2BP1; hnRNPA2B1; hnRNPR; SAFB2; SF3B3; hnRNPA1; hnRNPL; DHX30; SAFB; DHX15; ILF2; DDX21; hnRNPK; SFPQ; ILF3; NONO; ELAVL1; DDX3X; DDX5; DDX17; DHX9; DHX36) | This paper | N/A | See ‘Generation of constructs and transgenic flies’ |
| Strain, strain background (D. melanogaster) | UAS-LDS-(G4C2)44GR-GFP | Goodman et al., 2019 (PMID::31110321) | FLYB: FBtp0135960 | |
| Strain, strain background (D. melanogaster) | UAS-FUS | Ishiguro et al., 2017 (PMID::28343865) | FLYB: FBtp0117594 | |
| Strain, strain background (D. melanogaster) | UAS-FUS-4 (UAS-FLAG-FUS) | Wang et al., 2011 (PMID::21881207) | FLYB: FBtp0070284 | |
| Strain, strain background (D. melanogaster) | UAS-caz (UAS-FLAG-caz) | Wang et al., 2011 (PMID:21881207) | FLYB: FBtp0070279 | |
| Strain, strain background (D. melanogaster) | caz2 | Frickenhaus et al., 2015 (PMID::25772687) | FLYB: FBal0323133 | |
| Strain, strain background (D. melanogaster) | UAS-TDP-43 | Ishiguro et al., 2017 (PMID::28343865) | FLYB: FBtp0117592 | |
| Strain, strain background (D. melanogaster) | GMR-GAL4 driver | Yamaguchi et al., 1999 (PMID:10597285) | FLYB: FBtp0010074 | |
| Strain, strain background (D. melanogaster) | Elav-GAL4 driver: P{w[+mC]=GAL4-elav.L}2/CyO | Bloomington Drosophila Stock Center | BDSC: 8765; FLYB: FBst0008765 | |
| Strain, strain background (D. melanogaster) | Elav-GeneSwitch GAL4 driver: y(1) w[*]; P{w[+mC]=elav-Switch.O}GSG301 | Bloomington Drosophila Stock Center | BDSC: 43642; FLYB: FBst0043642 | |
| Strain, strain background (D. melanogaster) | UAS-EGFP: w[*]; P{w[+mC]=UAS-2xEGFP}AH2 | Bloomington Drosophila Stock Center | BDSC: 6874; FLYB: FBst0006874 | |
| Strain, strain background (D. melanogaster) | UAS-DsRed: w[*]; P{w[+mC]=UAS-AUG-DsRed}A | Bloomington Drosophila Stock Center | BDSC: 6282; FLYB: FBst0006282 | |
| Strain, strain background (D. melanogaster) | UAS-EWSR1: w[1118]; P{w[+mC]=UAS-EWSR1.C}26M | Bloomington Drosophila Stock Center | BDSC: 79592; FLYB: FBst00079592 | |
| Strain, strain background (D. melanogaster) | UAS-(GR)36: w[1118]; P{{y[+t7.7] w[+mC]=UAS-poly-GR.PO-36}attP40 | Bloomington Drosophila Stock Center | BDSC: 58692; FLYB: FBst00058692 | |
| Strain, strain background (D. melanogaster) | UAS-(GA)36: w[1118]; P{{y[+t7.7] w[+mC]=UAS-poly-GA.PO-36}attP40 | Bloomington Drosophila Stock Center | BDSC: 58693; FLYB: FBst00058693 | |
| Strain, strain background (D. melanogaster) | UAS-(GR)100: w[1118]; P{{y[+t7.7] w[+mC]=UAS-poly-GR.PO-100}attP40 | Bloomington Drosophila Stock Center | BDSC: 58696; FLYB: FBst00058696 | |
| Strain, strain background (D. melanogaster) | UAS-(GA)100: w[1118]; P{{y[+t7.7] w[+mC]=UAS-poly-GA.PO-100}attP40 | Bloomington Drosophila Stock Center | BDSC: 58697; FLYB: FBst00058697 | |
| Strain, strain background (D. melanogaster) | RNAi of GFP: w[1118]; P{w[+mC]=UAS-GFP.dsRNA.R}142 | Bloomington Drosophila Stock Center | BDSC: 9330; FLYB: FBst0009330 | |
| Strain, strain background (D. melanogaster) | RNAi of caz: P{KK107486}VIE-260B | Vienna Drosophila Resource Center | VDRC: v100291; FLYB: FBst0472165 | |
| Antibody | Rat monoclonal anti-poly(GR) antibody (5A2) | Millipore | Car# MABN778; RRID:AB_2728664 | IHC(1:1000), WB(1:1000) |
| Antibody | Mouse monoclonal anti-poly(GA) antibody (5E9) | Millipore | Car# MABN889; RRID:AB_2728663 | IHC(1:1000) |
| Antibody | Rabbit polyclonal anti-poly(GA) antibody | Cosmo Bio | Cat# CAC-TIP-C9-P01 | IHC(1:1000) |
| Antibody | Rabbit polyclonal anti-poly(GP) antibody | Novus Biologicals | Cat# NBP2-25018; RRID:AB_2893239 | IHC(1:1000) |
| Antibody | Rabbit polyclonal anti-FUS antibody | Bethyl Laboratories | Cat# A300-302A; RRID:AB_309445 | IHC(1:1000), WB(1:1000) |
| Antibody | Mouse monoclonal anti-EGFP antibody | Clontech | Cat# 632569 | WB(1:1000) |
| Antibody | Mouse monoclonal anti-actin antibody (AC-40) | Sigma-Aldrich | Cat# A4700; RRID:AB_476730 | WB(1:1000) |
| Antibody | Mouse monoclonal anti-c-Myc antibody (9E10) | Wako | Cat# 017-21876 | WB(1:3000) |
| Recombinant DNA reagent | pcDNA5/FRT-C9orf72 intron1-(G4C2)80 (plasmid) | This paper | See ‘RNA synthesis for in vitro translation’ | |
| Sequence-based reagent | (G4C2)n_F(1) | This paper | PCR primers | ATGAATGGGAGCAGTGGTGG |
| Sequence-based reagent | (G4C2)n_R(1) | This paper | PCR primers | TGTTGAGAGTCAGCAGTAGCC |
| Sequence-based reagent | (G4C2)n_F(2) | This paper | PCR primers | CCCAATCCATATGACTAGTAGATCC |
| Sequence-based reagent | (G4C2)n_R(2) | This paper | PCR primers | TGTAGGTAGTTTGTCCAATTATGTCA |
| Sequence-based reagent | gal4_F | Li et al., 2008 (PMID:18449188) | PCR primers | TTGAAATCGCGTCGAAGGA |
| Sequence-based reagent | gal4_R | Li et al., 2008 (PMID:18449188) | PCR primers | GGCTCCAATGGCTAATATGCA |
| Peptide, recombinant protein | His-FUS | This paper | N/A | See ‘Filter binding assay’ |
| Peptide, recombinant protein | His-FUS-RRMmut | This paper | N/A | See ‘Filter binding assay’ |
| Peptide, recombinant protein | FUS (not tagged) | This paper | N/A | See ‘Preparation of recombinant FUS protein’ |
| Peptide, recombinant protein | FUS-RRMmut (not tagged) | This paper | N/A | See ‘Preparation of recombinant FUS protein’ |
| Commercial assay or kit | In-Fusion Cloning system | TaKaRa Bio | Cat# Z9645N | |
| Commercial assay or kit | EZ-Tn5<KAN-2>Insertion Kit | Epicentre | Cat# EZI011RK | |
| Commercial assay or kit | QuantiTect Reverse Transcription Kit | QIAGEN | Cat# 205314 | |
| Commercial assay or kit | mMESSAGE mMACHINE T7 Transcription Kit | Thermo Fisher Scientific | Cat# AM1344 | |
| Commercial assay or kit | Flexi Rabbit Reticulocyte Lysate System | Promega | Cat# L4540 | |
| Chemical compound, drug | RU486 (mifepristone) | Wako | M3321; CAS: 84371-65-3 | |
| Chemical compound, drug | Formula 4-24 Instant Drosophila medium | Wako | Cat# 534-20571 | |
| Software, algorithm | ZEN imaging software | Zeiss | RRID:SCR_013672; https://www.zeiss.com/microscopy/en/products/software/zeiss-zen.html | |
| Software, algorithm | ImageJ | Schneider et al., 2012 (PMID:22930834) | RRID:SCR_003070; https://imagej.nih.gov/ij/ | |
| Software, algorithm | GraphPad Prism version 8.4.3 | GraphPad Software Inc. | RRID:SCR_002798; https://www.graphpad.com |
Additional files
-
Supplementary file 1
Full genotypes of the fly lines and their cultured temperatures.
- https://cdn.elifesciences.org/articles/84338/elife-84338-supp1-v1.xlsx
-
MDAR checklist
- https://cdn.elifesciences.org/articles/84338/elife-84338-mdarchecklist1-v1.docx
Download links
A two-part list of links to download the article, or parts of the article, in various formats.
Downloads (link to download the article as PDF)
Open citations (links to open the citations from this article in various online reference manager services)
Cite this article (links to download the citations from this article in formats compatible with various reference manager tools)
FUS regulates RAN translation through modulating the G-quadruplex structure of GGGGCC repeat RNA in C9orf72-linked ALS/FTD
eLife 12:RP84338.
https://doi.org/10.7554/eLife.84338.3


