Opto-RhoGEFs, an optimized optogenetic toolbox to reversibly control Rho GTPase activity on a global to subcellular scale, enabling precise control over vascular endothelial barrier strength
- Swammerdam Institute for Life Sciences, Section of Molecular Cytology, van Leeuwenhoek Centre for Advanced Microscopy, University of Amsterdam, Netherlands
- Molecular Cell Biology Lab at Dept. Molecular Hematology, Sanquin Research and Landsteiner Laboratory, Netherlands
Figures
Figure 1 with 1 supplement
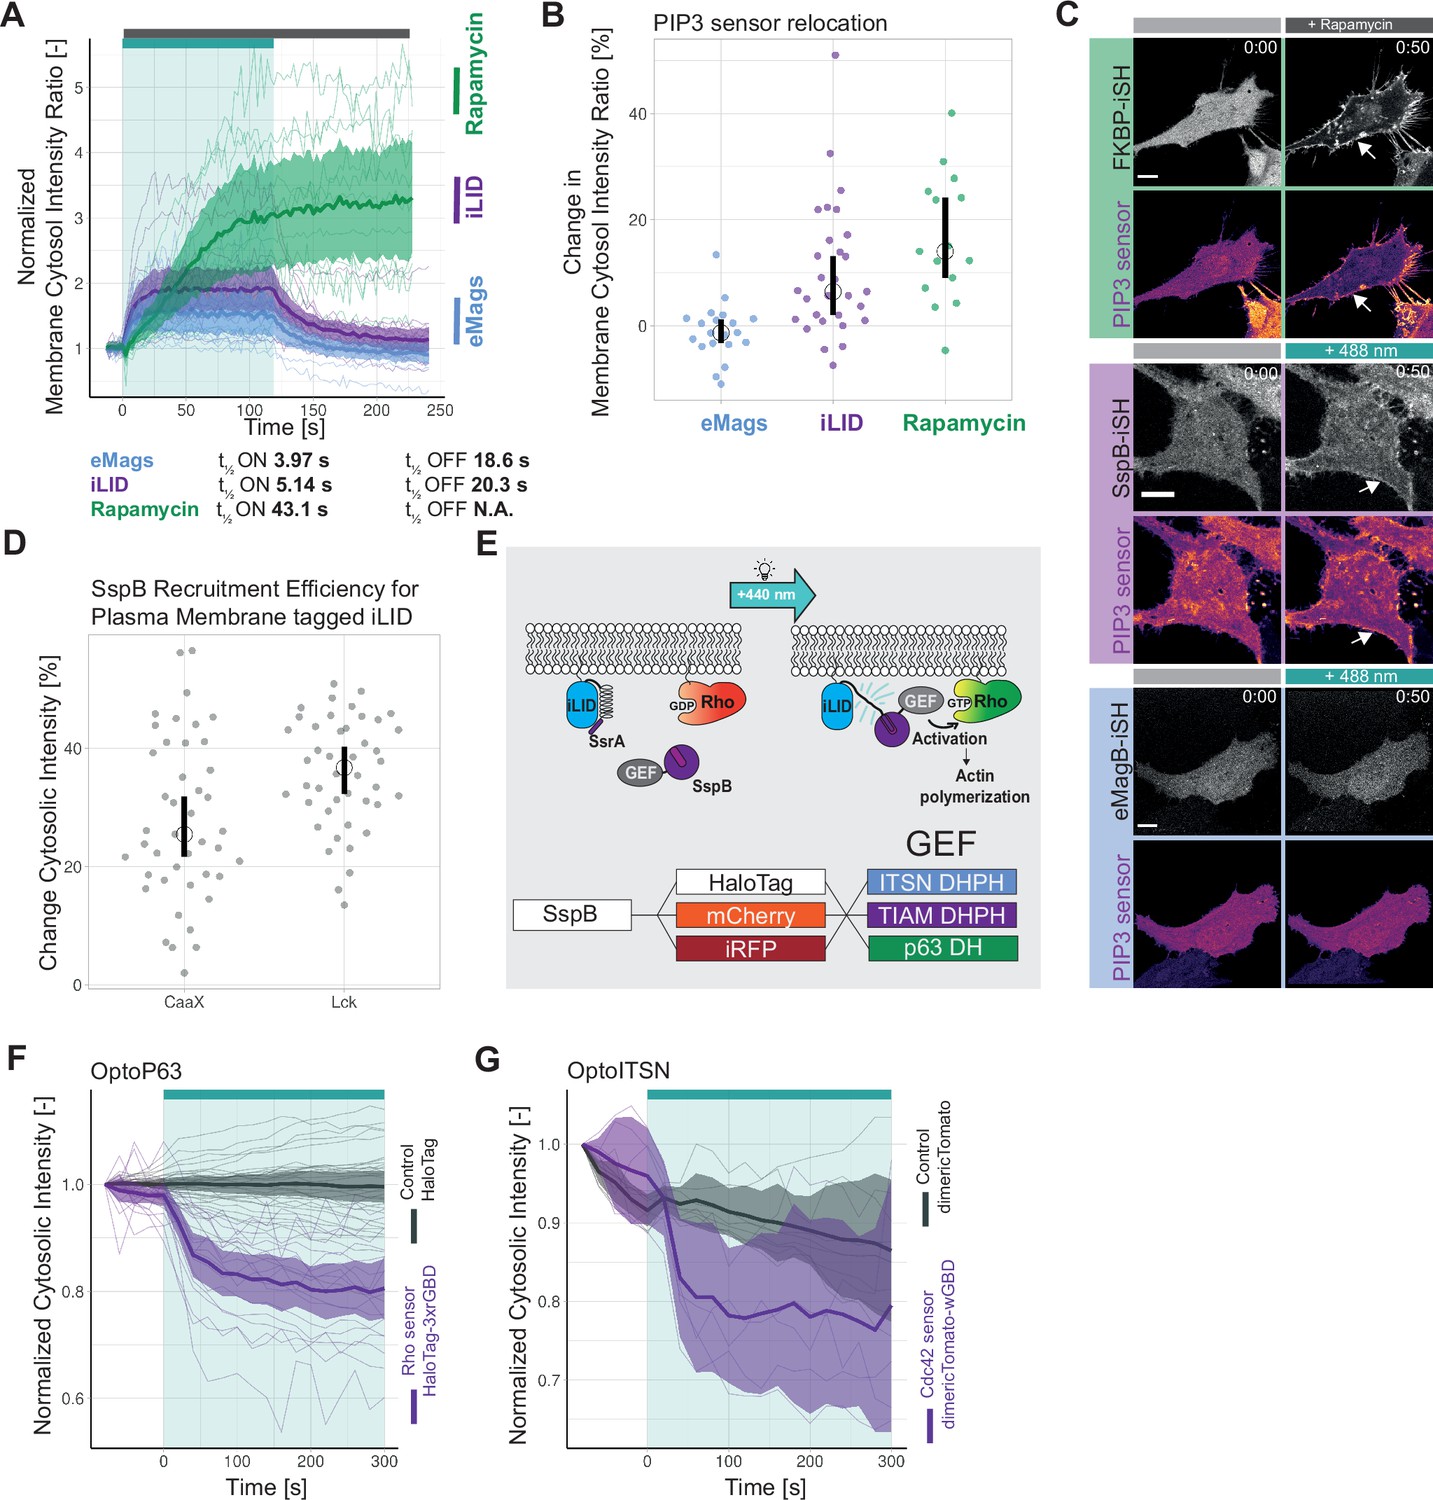
Optimization of an optogenetic recruitment tool.
(A) Normalized membrane to cytosol intensity ratio for the rapamycin system (green) HeLa cells expressing Lck-FRB-T2098L-mTurquoise-IRES-sYFP2xNES-FKBP12, for the improved light-induced dimer (iLID) system (purple) expressing Venus-iLID-CaaX and SspB-mScarlet-I and for the enhanced Magnets (eMags) system (blue) expressing eMagA-EGFP-CaaX and eMagB-tagRFP stimulated with either 100 nM rapamycin (indicated by gray bar) or 488 nm laser light (indicated by cyan bar). The thin lines represent measurements of single cells, the thick lines represent the mean, and the ribbon represents the 95% confidence interval. The number of cells per condition is: iLID n=17, eMags n=12, rapamycin n=11. The data is from two biological replicates based on independent transfections. (B) Change in membrane to cytosol intensity ratio as percentage for the localization of the PIP3 sensor. All Hela cells were expressing the PIP3 location sensor mCherry-Akt-PH and for the iLID system (purple) Venus-iLID-CaaX, iSH-iRFP-SspB, for the eMags system (blue) eMagA-eGFP-CaaX and eMagB-iSH-iRFP670 and for the rapamycin system (green) Lck-FRB-mTurquoise2 and mNeonGreen-FKBP12-iSH. Stimulated with either 100 nM rapamycin or 488 nm laser light each frame. Comparing the ratio of membrane over cytosol intensity of the PIP3 sensor for 0 s pre-activation and 50 s of activation. Each dot represents an individual cell. The median of the data is shown as a black circle and the 95% confidence interval for each median, determined by bootstrapping, is indicated by the bar. The number of cells per condition is: iLID = 29, eMags = 20, rapamycin = 15. (C) Representative confocal images for the in B described conditions: HeLa cells expressing the eMag, iLID and rapamycin recruitment system and the PIP3 biosensorThe PIP3 sensor intensity is depicted with the mpl-inferno look up table, where brighter colors represent higher fluorescent intensities. Scale bars: 10 µm. (D) Change in cytosolic intensity in percentage for HeLa cells expressing SspB-mScarlet-I and either Lck-mTurquoise2-iLID or Venus-iLID-CaaX measured 20 s after stimulation with 1 pulse of 440 nm laser light at 20% for 1 s. Images acquired at a spinning disk microscope. Each dot represents an individual cell. The median of the data is shown as a black circle and the 95% confidence interval for each median, determined by bootstrapping, is indicated by the bar. The number of cells per condition is: CaaX = 43, Lck = 44. The data is from three biological replicates based on independent transfections. (E) Schematic of the light-induced heterodimerization of iLID. Upon photo-activation the Ja helix in the iLID unfolds, SsrA becomes available for binding by SspB which is recruited from the cytosol to the location of SsrA, which is localized at the plasma membrane. The guanine-nucleotide exchange factor (GEF) fused to the SspB activates the Rho GPTase at the plasma membrane, which is binding GTP and thereby activates its signaling cascade. That results in the remodeling of the actin cytoskeleton and change in cell morphology. The combination of fluorescent markers and GEFs fused to SspB in this study is indicated in the bottom. (F) Normalized cytosolic intensity for the HaloTag-3xrGBD Rho sensor (purple) or control HaloTag (gray) stained with JF635 nm upon the photo-activation (indicated by cyan bar) of SspB-mCherry-p63RhoGEF(DH), expressed in HeLa cells together with Lck-mTurquoise2-iLID. Thin lines represent individual cells, thick lines represent the mean, and ribbons represent their 95% confidence interval. The number of cells per condition: Rho sensor HaloTag-3xrGBD = 18, Control HaloTag = 30. The data is from two biological replicates based on independent transfections. (G) Normalized cytosolic intensity for the dimericTomato-wGBD Cdc42 sensor (purple) or control dimericTomato (gray) upon the photo-activation (indicated by cyan bar) of SspB-HaloTag-ITSN1(DHPH) stained with JF635 nm, expressed in HeLa cells together with Lck-mTurquoise2-iLID. Thin lines represent individual cells, thick lines represent the mean, and ribbons represent their 95% confidence interval. The number of cells per condition: Cdc42 sensor dimericTomato-wGBD=6, Control dimericTomato = 7. The data is from two biological replicates based on independent transfections.
Figure 1—figure supplement 1
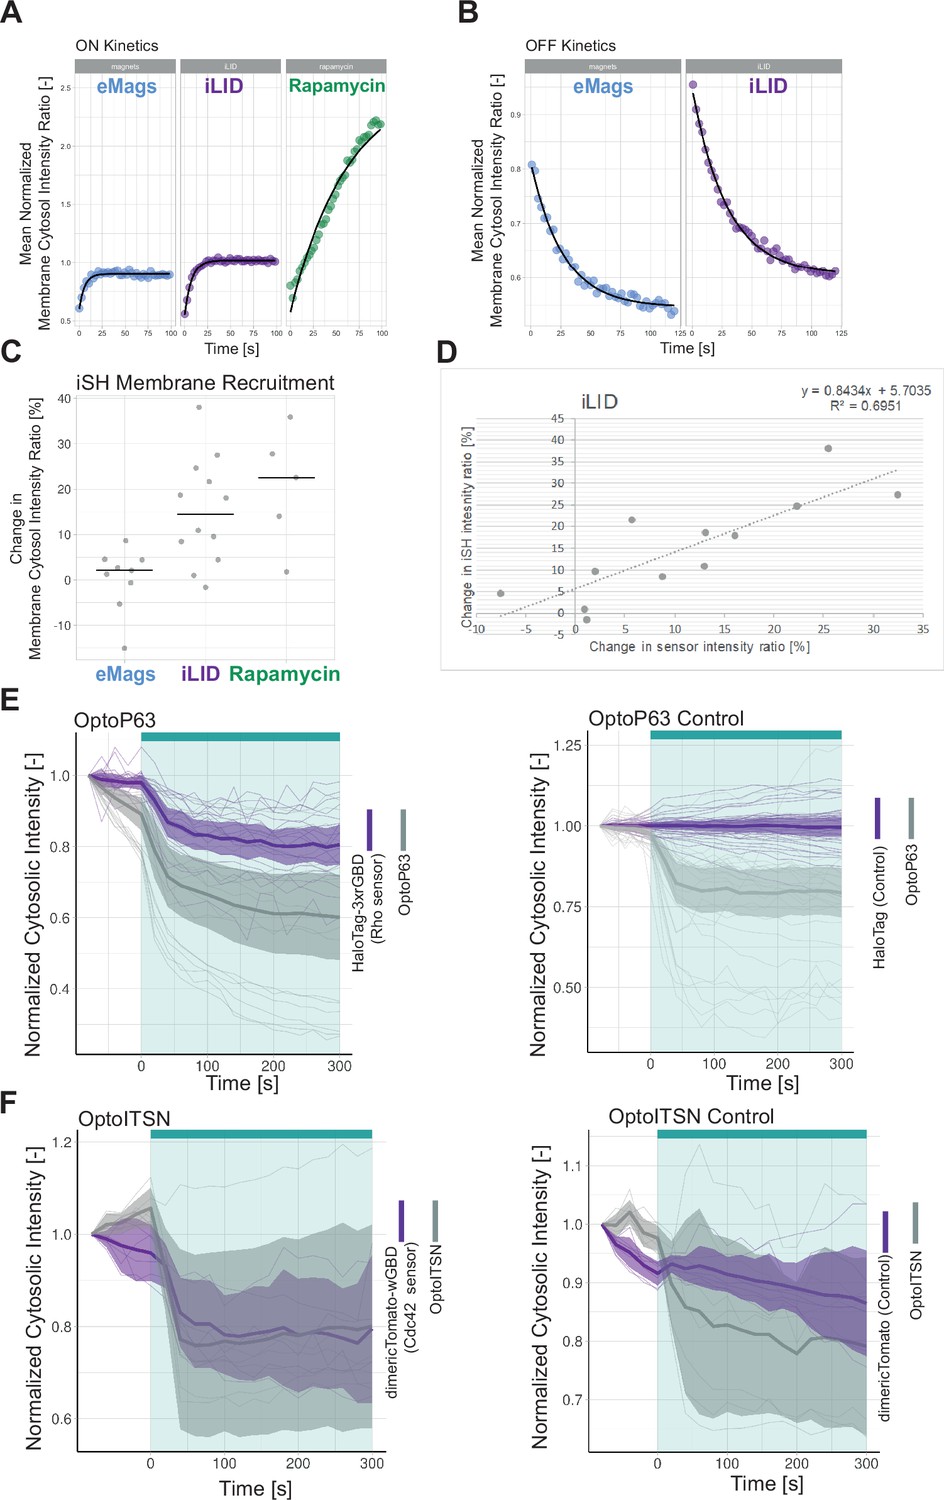
Optogenetic tool setup.
(A) Curve fitting to determine t½ ON kinetics shown in Figure 1A for the mean normalized membrane to cytosol intensity ratio, where dots represent the mean values shown in Figure 1A, blue = eMags (enhanced Magnets), purple = iLID (improved light-induced dimer), green = rapamycin. The result of the curve fitting is shown as a black line. In the shown time range cells were activated with 488 nm laser light at 1% laser power every 2.5 s or stimulated with 100 nM rapamycin at time point 0 s. (B) Curve fitting to determine t½ OFF kinetics for the normalized membrane to cytosol intensity ratio, where dots represent the mean values shown in Figure 1A, blue = eMags, purple = iLID. The result of the curve fitting is shown as a black line. Time point 0 s is set to the first frame after photo-activation. (C) Change in membrane to cytosol intensity ratio as percentage for the localization of iSH, localization of the PIP3 sensor is presented in Figure 1B. All Hela cells were expressing the PIP3 location sensor mCherry-Akt-PH and for the iLID system Venus-iLID-CaaX, iSH-iRFP-SspB, for the eMags system eMagA-eGFP-CaaX and eMagB-iSH-iRFP670, and for the rapamycin system Lck-FRB-mTurquoise2 and mNeonGreen-FKBP12-iSH. Stimulated with either 100 nM rapamycin or 488 nm laser light each frame. Comparing the ratio of membrane over cytosol intensity of the iSH for 0 s pre-activation and 50 s of activation. Each dot represents an individual cell. The median of the data is shown as a black bar. The number of cells per condition is: iLID = 29, eMags = 20, rapamycin = 15. (D) Plot of the correlation between change in iSH intensity ratio and change in PIP3 sensor intensity ratio for the data shown in Figure 1B, C. The general linear model (top right corner) was fit to the data and is indicated as a dashed line. (E) Left: Normalized cytosolic intensity for the HaloTag-3xrGBD Rho sensor (purple) stained with JF635 nm dye and of the corresponding SspB-mCherry-p63RhoGEF(DH) (gray) intensity, upon photo-activation (indicated by cyan bar) expressed in HeLa cells together with Lck-mTurquoise2-iLID. Showing the SspB-mCherry-p63RhoGEF(DH) recruitment for Figure 1F. Thin lines represent individual cells, thick lines represent the mean values, and ribbons represent their 95% confidence interval. The number of analyzed cells is 18. The data is from two biological replicates based on independent transfections. Right: The same settings and conditions apply except that the cells expressed the HaloTag as a control instead of HaloTag-3xrGBD Rho sensor. The number of analyzed cells is 30. (F) Left: Normalized cytosolic intensity for the dimericTomato-wGBD Cdc42 sensor (purple) and of the corresponding SspB-HaloTag-ITSN1(DHPH) (gray), stained with JF635 nm dye, intensity, upon the photo-activation (indicated by cyan bar) expressed in HeLa cells together with Lck-mTurquoise2-iLID. Showing the SspB-HaloTag-ITSN1(DHPH) recruitment for Figure 1G. Thin lines represent individual cells, thick lines represent the mean values, and ribbons represent their 95% confidence interval. The number of analyzed cells is 6. The data is from two biological replicates based on independent transfections. Right: The same settings and conditions apply, except that the cells expressed the dimericTomato as a control instead of the dimericTomato-wGBD Cdc42 sensor. The number of analyzed cells is 30.
Figure 2 with 4 supplements
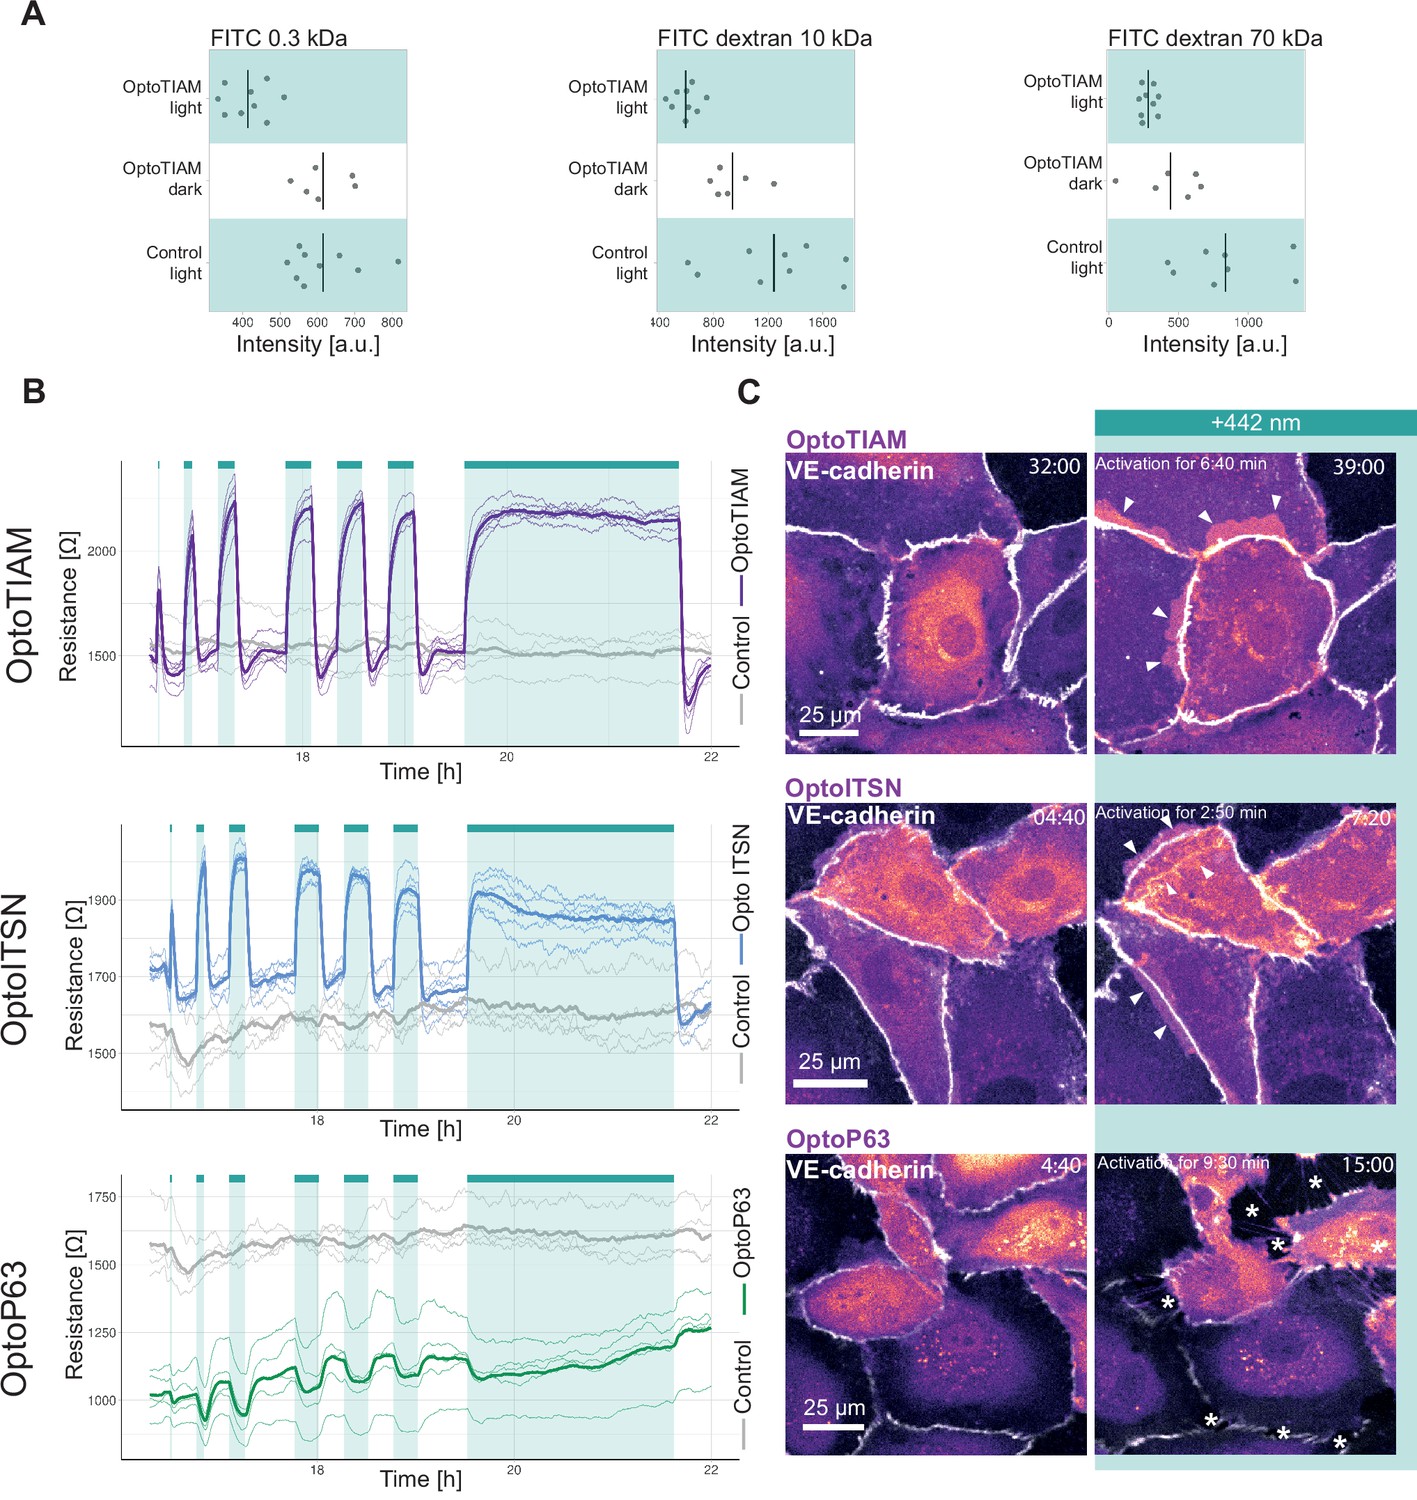
Photo-activation of optogenetically recruitable RhoGEFs (Opto-RhoGEFs) controls permeability and vascular barrier strength.
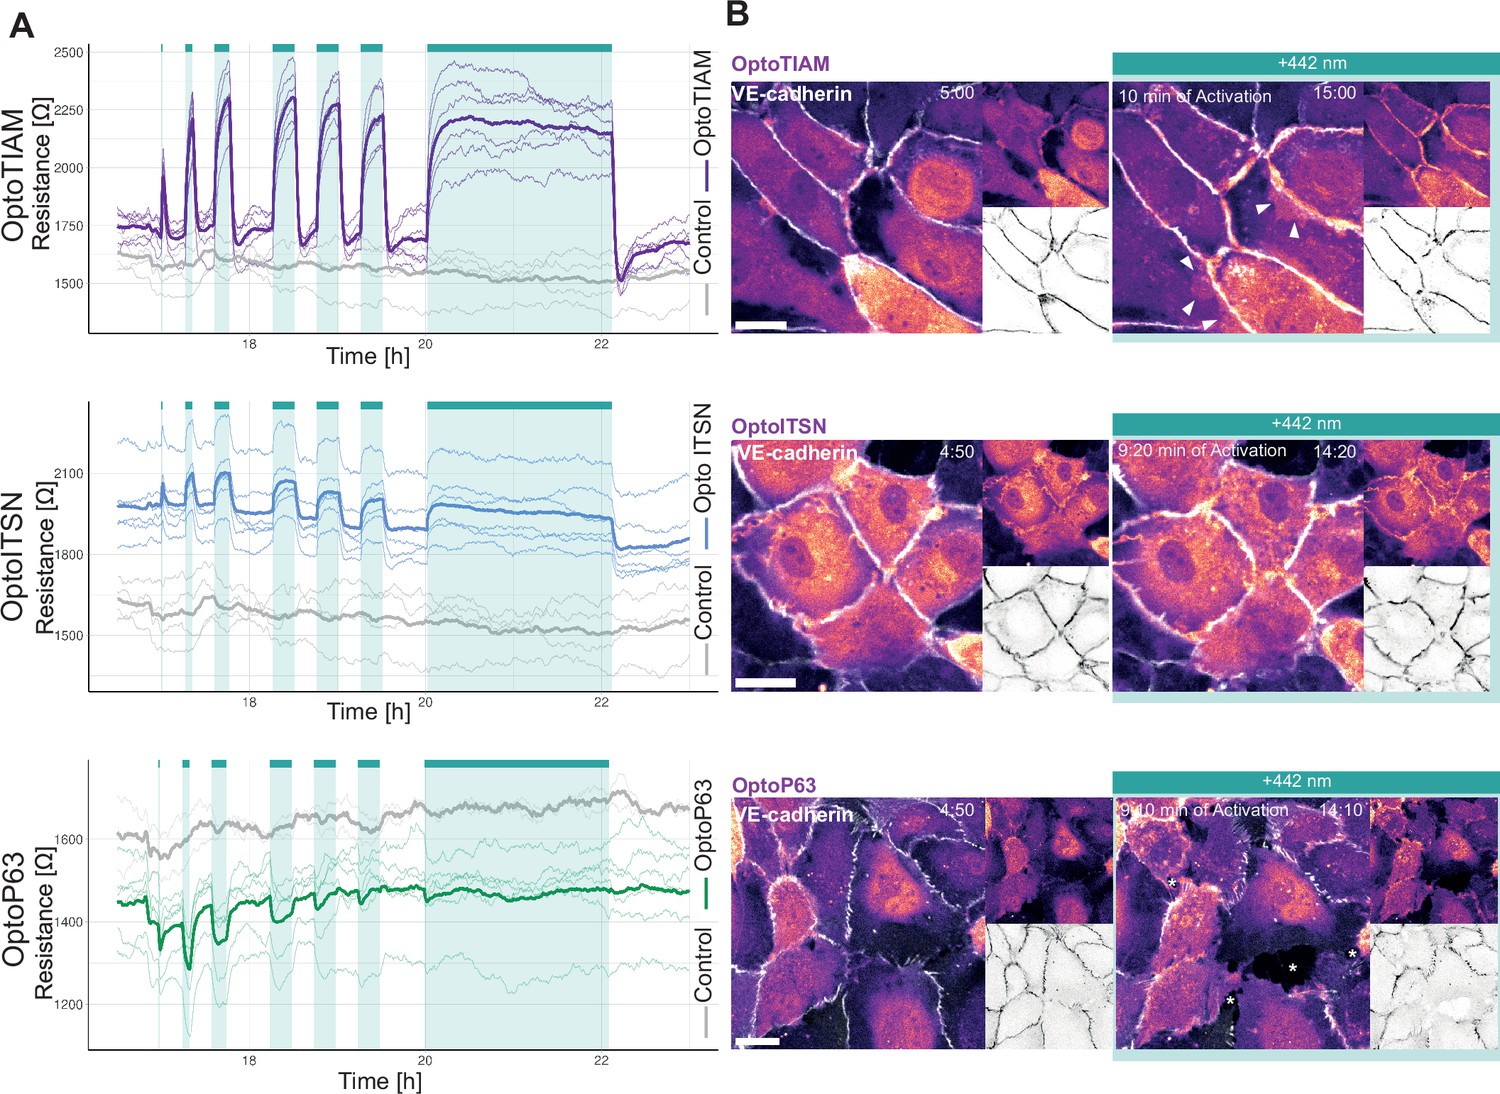
(A) Fluorescence intensity measured in a transwell assay for a monolayer of blood outgrowth endothelial cells (BOECs) stably expressing Lck-mTurquoise2-iLID, solely as a control, and SspB-HaloTag-TIAM1(DHPH) treated with FITC 0.3 kDa, FITC dextran 10 kDa, and FITC dextran 70 kDa. Photo-activated with blue LED light for 10 min as indicated by cyan background in the graph or kept in the dark indicated by white background. Dots represent individual transwell dishes. The black bar indicates the mean. The number of transwell dishes per condition is: Control Lck-iLID=9, OptoTIAM dark = 6, OptoTIAM light = 9. The data is from three experiments. (B) Resistance of a monolayer of BOECs stably expressing Lck-mTurquoise2-iLID, solely as a control (gray), and either SspB-HaloTag-TIAM1(DHPH)(purple)/ITSN1(DHPH) (blue) or p63RhoGEF(DH) (green) measured with electrical cell-substrate impedance sensing (ECIS) at 4000 Hz, representing paracellular permeability, every 10 s. Cyan bars indicated photo-activation with blue LED light (1 min, 5 min, 10 min, 3×15 min, 120 min). Thin lines represent the average value from one well of an 8W10E PET ECIS array. Thick lines represent the mean. The number of wells per condition was: OptoTIAM = 6, OptoITSN = 6, OptoP63=6, control = 4. (C) Representative zoom-ins from confocal microscopy images of a BOEC monolayer stably expressing Lck-mTurquoise2-iLID (not shown) and either SspB-HaloTag-TIAM1(DHPH)/ ITSN1(DHPH) or p63RhoGEF(DH) stained with JF552 nm dye (LUT = mpl-magma, bright colors indicating higher intensity). Additionally, VE-cadherin was stained with the live labeling antibody Alexa Fluor 647 Mouse Anti-Human CD144 (white). Scale bars: 25 µm. Times are min:s from the start of the recording. Cyan bar indicates 442 nm photo-activation. Arrows indicate overlap and protrusions. Asterisks indicate holes in monolayer. Whole field of view is shown in Figure 2—figure supplement 2.
Figure 2—figure supplement 1
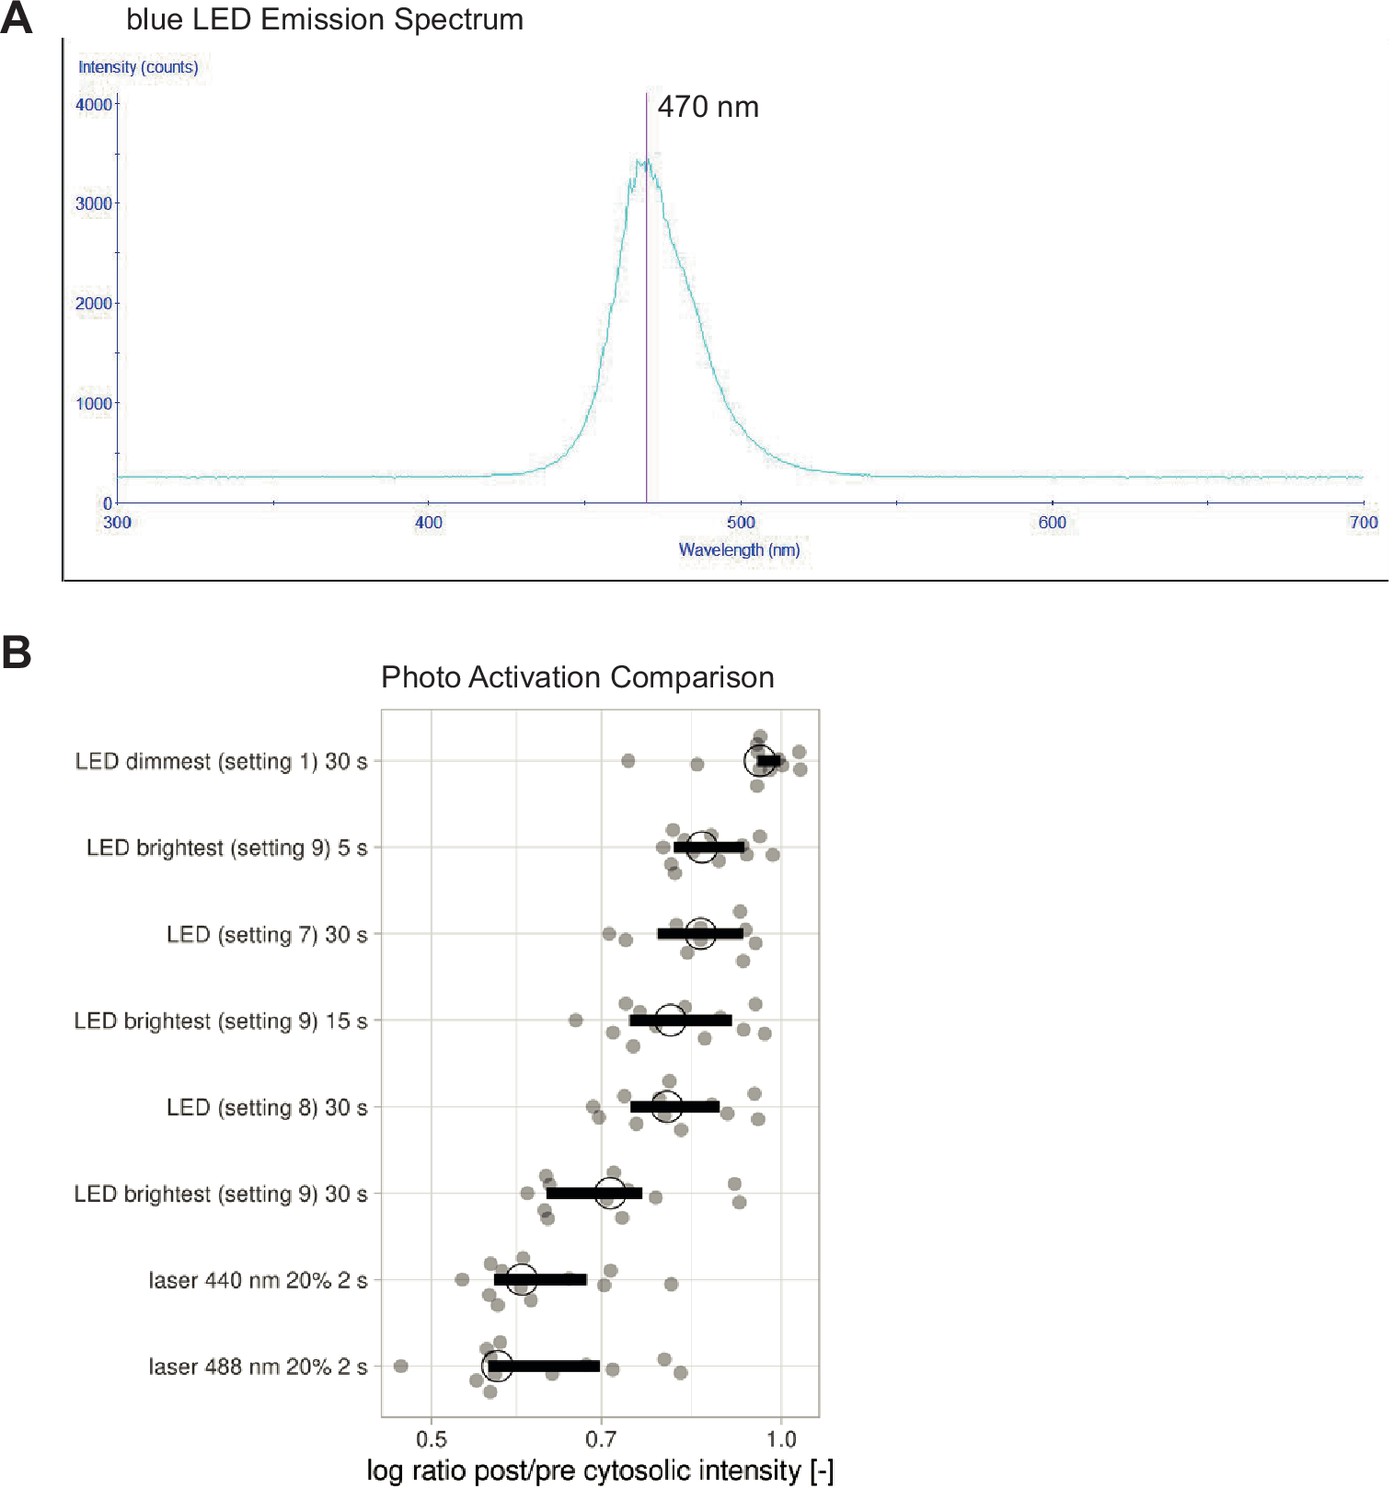
Photo-activation with blue LED.
(A) Emission spectrum of the LEDs in the blue setting. Red line indicates peak emission wavelength of 470 nm. (B) Recruitment efficiency as the log ratio of post- over pre-activation cytosolic intensity for HeLa cells expressing Lck-mTurquoise2-iLID and SspB-mScarlet-I activated with either blue LED light or laser light for the indicated time. Each dot represents an individual cell. The median of the data is shown as a black circle and the 95% confidence interval for each median, determined by bootstrapping, is indicated by the bar. The number of cells is 13; the same cells were imaged for the different photo-activation settings.
Figure 2—figure supplement 2
Global photo-activation of endothelial cell monolayer.
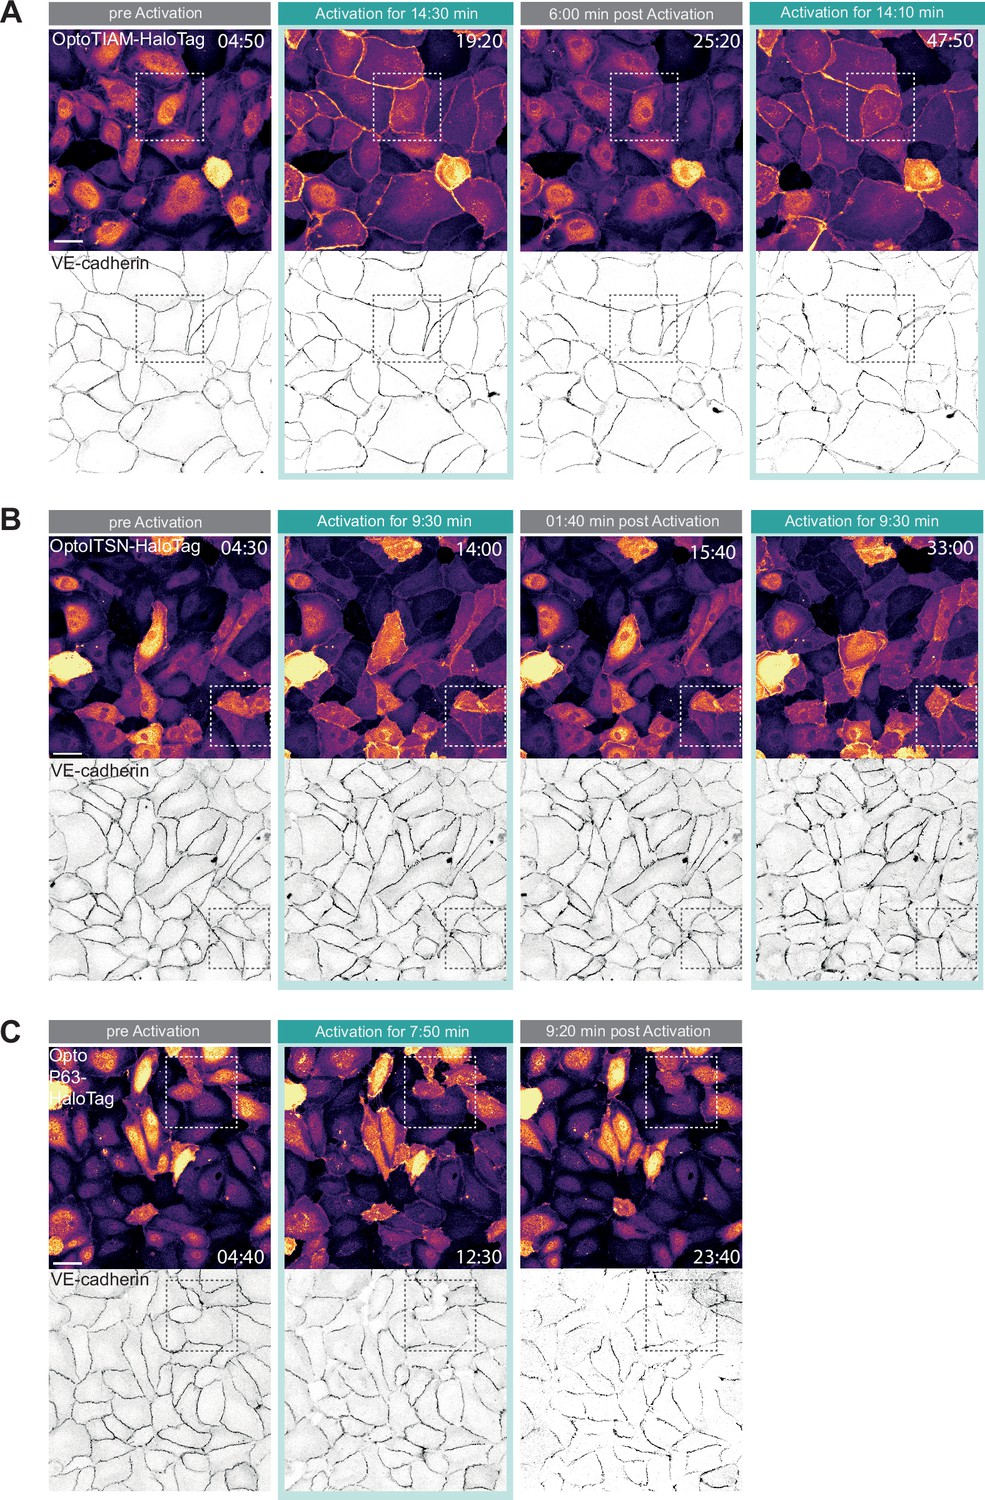
(A) Whole field of view confocal microscopy images of a blood outgrowth endothelial cell (BOEC) monolayer stably expressing Lck-mTurquoise2-iLID (not shown) and either SspB-HaloTag-TIAM1(DHPH), ITSN1(DHPH), or p63RhoGEF(DH) stained with JF552 nm dye (LUT = mpl-inferno, brighter colors indicating higher intensity). Additionally, VE-cadherin was stained with the live labeling antibody Alexa Fluor 647 Mouse Anti-Human CD144 (gray inverted). Monolayer was photo-activated with 442 nm laser light twice for 15 min with a 15 min dark recovery phase in-between. Scale bars: 50 µm. Times are min:s from the start of the recording. Cyan bar indicates 442 nm photo-activation. Dashed box indicated the zoom-in shown in Figure 2C. (B) The same settings and conditions apply as in A but BOECs are expressing SspB-HaloTag-ITSN1(DHPH) and were photo-activated twice for 10 min with 10 min dark recovery in-between. (C) The same settings and conditions apply as in 2A but BOECs are expressing SspB-HaloTag-p63RhoGEF(DH) and were photo-activated once for 10 min with 10 min dark recovery afterward.
Figure 2—figure supplement 3
Replicate electrical cell-substrate impedance sensing (ECIS) assay and time-lapse microscopy.
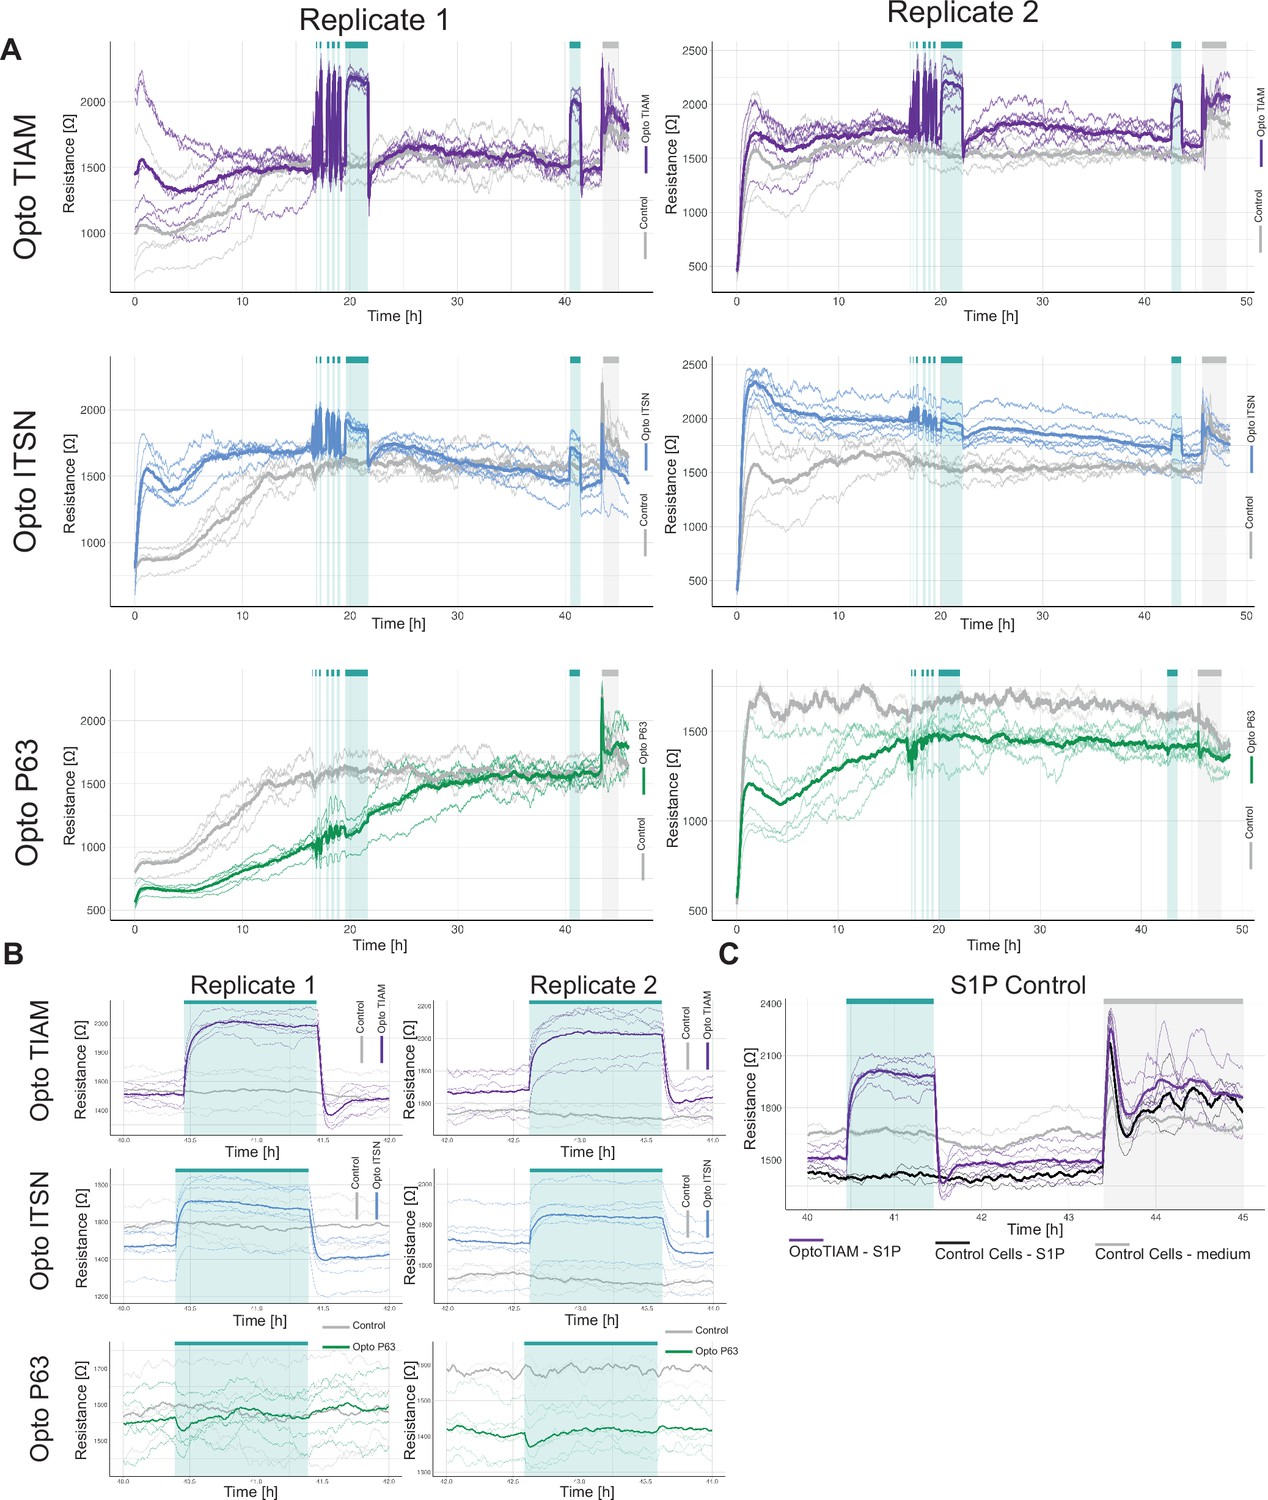
(A) Replicate for the resistance of a monolayer of blood outgrowth endothelial cells (BOECs) stably expressing Lck-mTurquoise2-iLID, solely as a control (gray), and either SspB-HaloTag-TIAM1(DHPH)(purple)/ITSN1(DHPH) (blue) or p63RhoGEF(DH) (green) measured with ECIS at 4000 Hz every 10 s. Cyan bars indicated photo-activation with blue LED light (1 min, 5 min, 10 min, 3×15 min, 120 min). Thin lines represent the average value from one well of an 8W10E ECIS array. Thick lines represent the mean. The number of wells per condition is: OptoTIAM = 6, OptoITSN = 6, OptoP63=6, control = 4 and 2. (B) Representative zoom-ins from confocal microscopy images of a BOEC monolayer stably expressing Lck-mTurquoise2-iLID (not shown) and either SspB-HaloTag-TIAM1(DHPH)/ITSN1(DHPH) or p63RhoGEF(DH) stained with JF552 nm dye (LUT = mpl-magma, bright colors indicating higher intensity). Additionally, VE-cadherin was stained with the live labeling antibody Alexa Fluor 647 Mouse Anti-Human CD144 (white in merge, gray inverted in single channel). Scale bars: 25 µm. Times are min:s from the start of the recording. Cyan bar indicates 442 nm photo-activation. Arrows indicate overlap and protrusions. Asterisks indicate holes in monolayer.
Figure 2—figure supplement 4
Overview of entire time course electrical cell-substrate impedance sensing (ECIS) assay.
(A) ECIS experiment overview of the resistance of a monolayer of blood outgrowth endothelial cells (BOECs) stably expressing Lck-mTurquoise2-iLID, solely as a control (gray), and either SspB-HaloTag-TIAM1(DHPH)(purple)/ITSN1(DHPH) (blue) or p63RhoGEF(DH) (green) measured with ECIS at 4000 Hz every 10 s. Cyan bars indicated photo-activation with blue LED light (1 min, 5 min, 10 min, 3×15 min, 120 min, 60 min). Gray bar indicates sphingosine-1-phosphate (S1P) stimulation. Thin lines represent the average value from one well of an 8W10E ECIS array. Thick lines represent the mean. The number of wells per condition is: OptoTIAM = 6, OptoITSN = 6, OptoP63=6, control = 4. The experiment was performed twice on different days. (B) Zoom-in on the 1 hr photo-activation on the second day after seeding. The same settings and conditions apply as in A. (C) Zoom-in on S1P stimulation for BOECs stably expressing Lck-mTurquoise2-iLID, solely as a control (gray), and either SspB-HaloTag-TIAM1(DHPH) (purple) for replicate 1. Cells were stimulated with 650 nM S1P in medium, OptoTIAM-S1P (purple) n=6, and Control-cells-S1P n=2 (black), as a control for the stimulation, cells were treated with medium only: Control-cells-medium (gray) n=2.
Figure 3 with 2 supplements
Role of junctions in optogenetically recruitable RhoGEF (Opto-RhoGEF)-induced changes in vascular barrier strength.
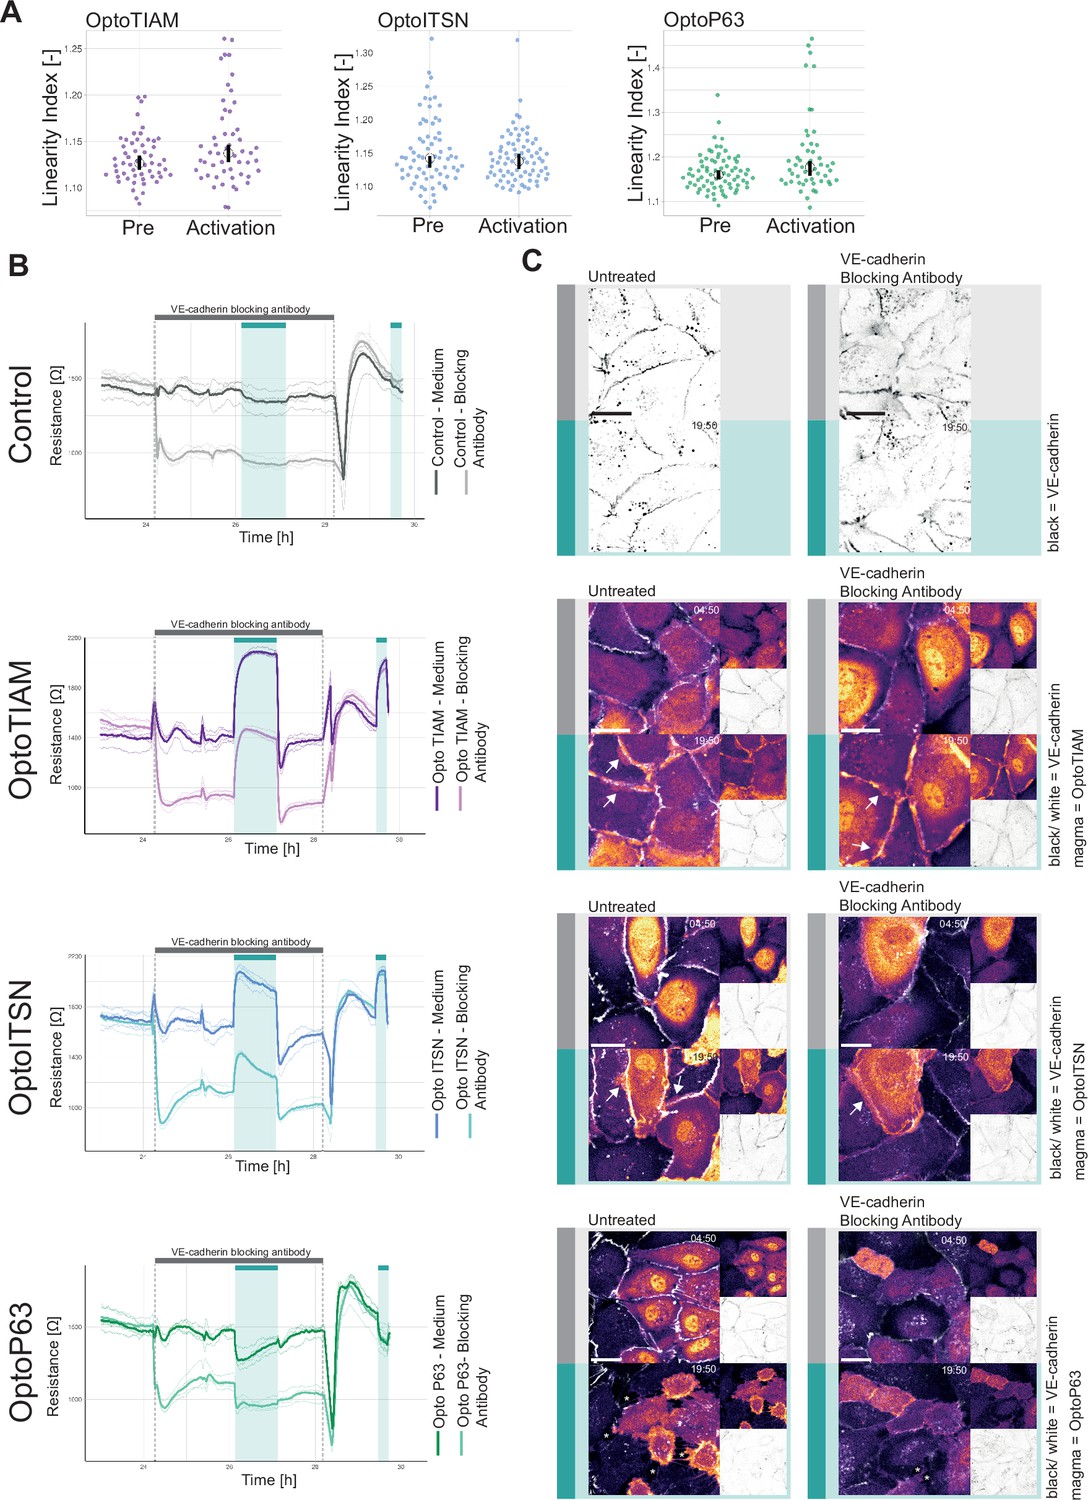
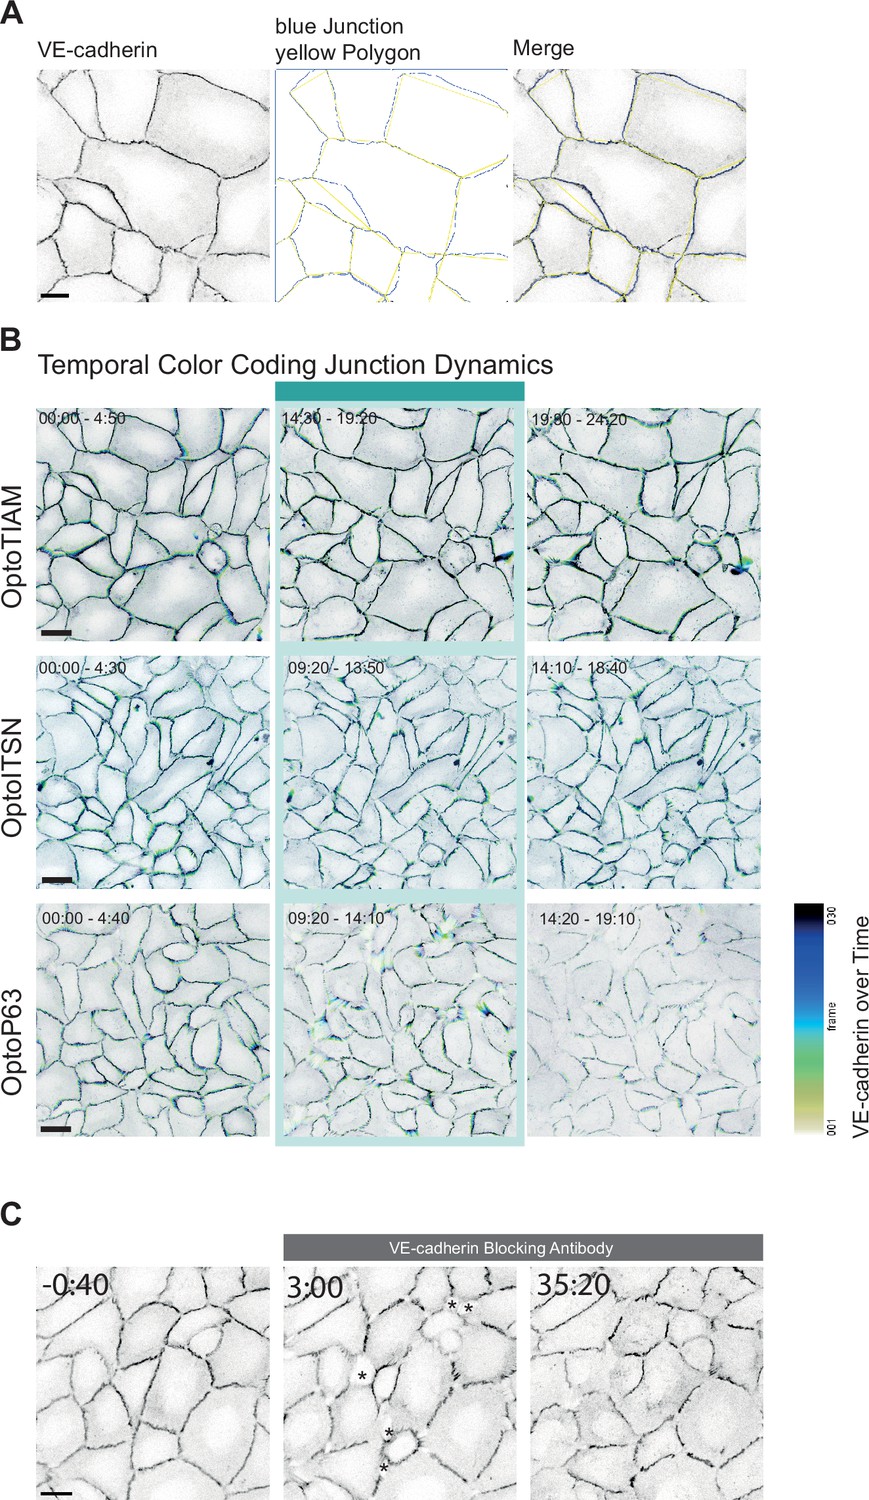
(A) Linearity index for a blood outgrowth endothelial cell (BOEC) monolayer stably expressing Lck-mTurquoise2-iLID and either SspB-HaloTag-TIAM1(DHPH) (purple)/ITSN1(DHPH) (blue) or p63RhoGEF(DH) (green) for the frame before photo-activation (pre) and the last frame of photo-activation (Activation). Images of the junctions are in Figure 2—figure supplement 2 and example of linearity index analysis in Figure 3—figure supplement 1A. Each dot represents an individual cell. The median of the data is shown as a black circle and the 95% confidence interval for each median, determined by bootstrapping, is indicated by the bar. The number of cells is: OptoTIAM pre = 55, OptoTIAM Activation = 52, OptoITSN pre = 71, OptoITSN Activation = 76, OptoP63 pre = 74, OptoP63 Activation = 51. The data is from two independent experiments. (B) Resistance of a monolayer of BOECs stably expressing Lck-mTurquoise2-iLID, solely as a control (gray), and either SspB-HaloTag-TIAM1(DHPH)(purple)/ITSN1(DHPH) (blue) or p63RhoGEF(DH) (green) measured with electrical cell-substrate impedance sensing (ECIS) at 4000 Hz, representing paracellular permeability, every 10 s. Cyan bars indicated photo-activation with blue LED light (60 min, 15 min). Gray bar with dashed lines indicates the addition of VE-cadherin blocking antibody in medium (darker color line) or medium as a control (lighter color line). At the end of the gray bar the medium is replaced for all conditions. Thin lines represent the average value from one well of an 8W10E PET ECIS array. Thick lines represent the mean. Four wells were measured for each condition. (C) Representative zoom-ins from confocal microscopy images of a BOEC monolayer stably expressing Lck-mTurquoise2-iLID (not shown) and either SspB-HaloTag-TIAM1(DHPH)/ITSN1(DHPH) or p63RhoGEF(DH) stained with JF552 nm dye (LUT = mpl-magma, bright colors indicating higher intensity). Additionally, VE-cadherin was stained with the live labeling antibody Alexa Fluor 647 Mouse Anti-Human CD144 (white in merge, gray inverted in single channel). Left panel shows untreated cells, right panel shows cells treated with the VE-cadherin blocking antibody. Scale bars: 25 µm. Times are min:s from the start of the recording. Gray bar indicates the condition before photo-activation. Cyan bar indicates 442 nm photo-activation. Arrows indicate overlap and protrusions. Asterisks indicate holes in monolayer.
Figure 3—figure supplement 1
Junction analysis.
(A) Left panel: Confocal microscopy image of a blood outgrowth endothelial cell (BOEC) monolayer stably expressing Lck-mTurquoise2-iLID (not shown) and SspB-HaloTag-TIAM1(DHPH) (not shown), additionally, VE-cadherin was stained with the live labeling antibody Alexa Fluor 647 Mouse Anti-Human CD144 (gray inverted), shown for the last frame before photo-activation (pre in Figure 3A). Middle panel: Blue lines represent the Tissue Analyzer created junction outlines. Yellow lines represent the hand-drawn polygon to measure the junction linearity index. Right panel: Shows a merge of the microscopy image and the lines used for the linearity index measurements. Scale bar: 25 µm. (B) Temporal color coding for confocal microscopy images of VE-cadherin stained with the live labeling antibody Alexa Fluor 647 Mouse Anti-Human CD144, for a monolayer of BOECs stably expressing Lck-mTurquoise2-iLID (not shown) and either SspB-HaloTag-TIAM1(DHPH)/ITSN1(DHPH) or p63RhoGEF(DH) (not shown). For the time period, as indicated in the image, before photo-activation (left panel), during photo-activation indicated with cyan bar (middle panel) and after photo-activation (right panel). Color code indicates time shown in look up table. Times are min:s from the start of the recording. Scale bars:50 µm. These images are also shown in Figure 2—figure supplement 2 and in Figure 2C. (C) Confocal microscopy image of a BOEC monolayer stably expressing Lck-mTurquoise2-iLID (not shown) and SspB-HaloTag-TIAM1(DHPH) (not shown), additionally, VE-cadherin was stained with the live labeling antibody Alexa Fluor 647 Mouse Anti-Human CD144 (gray inverted). Cells were treated with VE-cadherin blocking antibody at time point zero, indicated by gray bar. Times are min:s starting from the treatment. Scale bar: 25 µm. Asterisks indicate holes in monolayer.
Figure 3—figure supplement 2
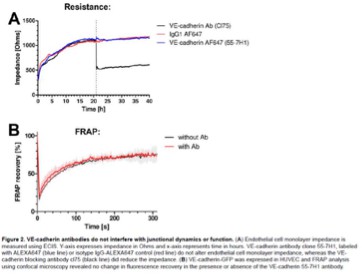
Replicate electrical cell-substrate impedance sensing (ECIS) assay in the presence of the VE-cadherin blocking antibody.
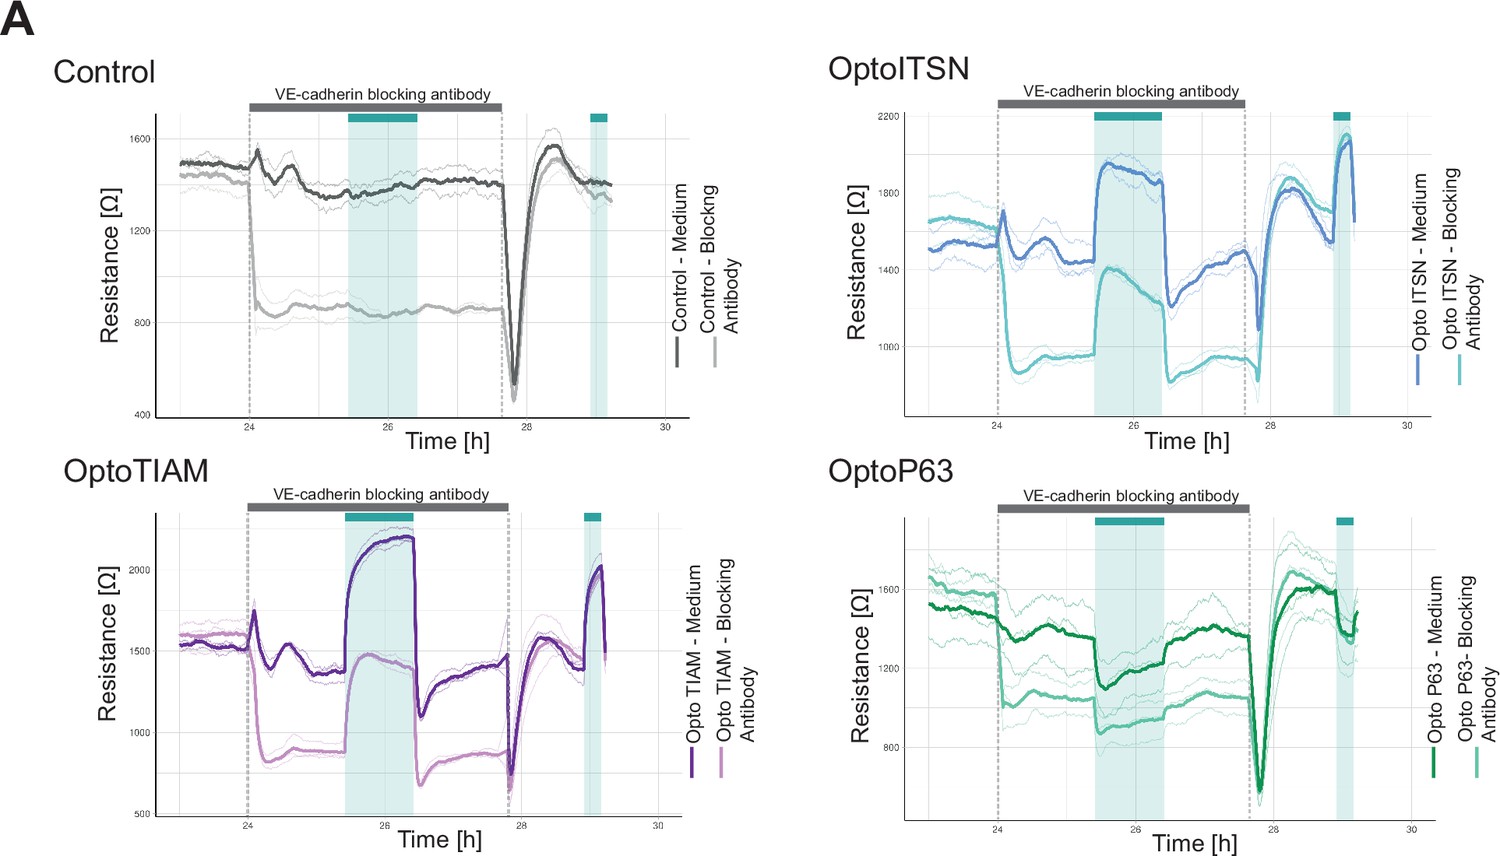
(A) Replicate for the resistance of a monolayer of blood outgrowth endothelial cells (BOECs) stably expressing Lck-mTurquoise2-iLID, solely as a control (gray), and either SspB-HaloTag-TIAM1(DHPH)(purple)/ITSN1(DHPH) (blue) or p63RhoGEF(DH) (green) measured with ECIS at 4000 Hz every 10 s. Cyan bars indicated photo-activation with blue LED light (60 min, 15 min). Gray bar with dashed lines indicates the addition of VE-cadherin blocking antibody in medium (darker color line) or medium as a control (lighter color line). At the end of the gray bar the medium is replaced for all conditions. Thin lines represent the average value from one well of an 8W10E PET ECIS array. Thick lines represent the mean. Three wells were measured for each condition.
Figure 4 with 2 supplements
Characterization of global photo-activation of blood outgrowth endothelial cells (BOECs) expressing optogenetically recruitable RhoGEFs (Opto-RhoGEFs).
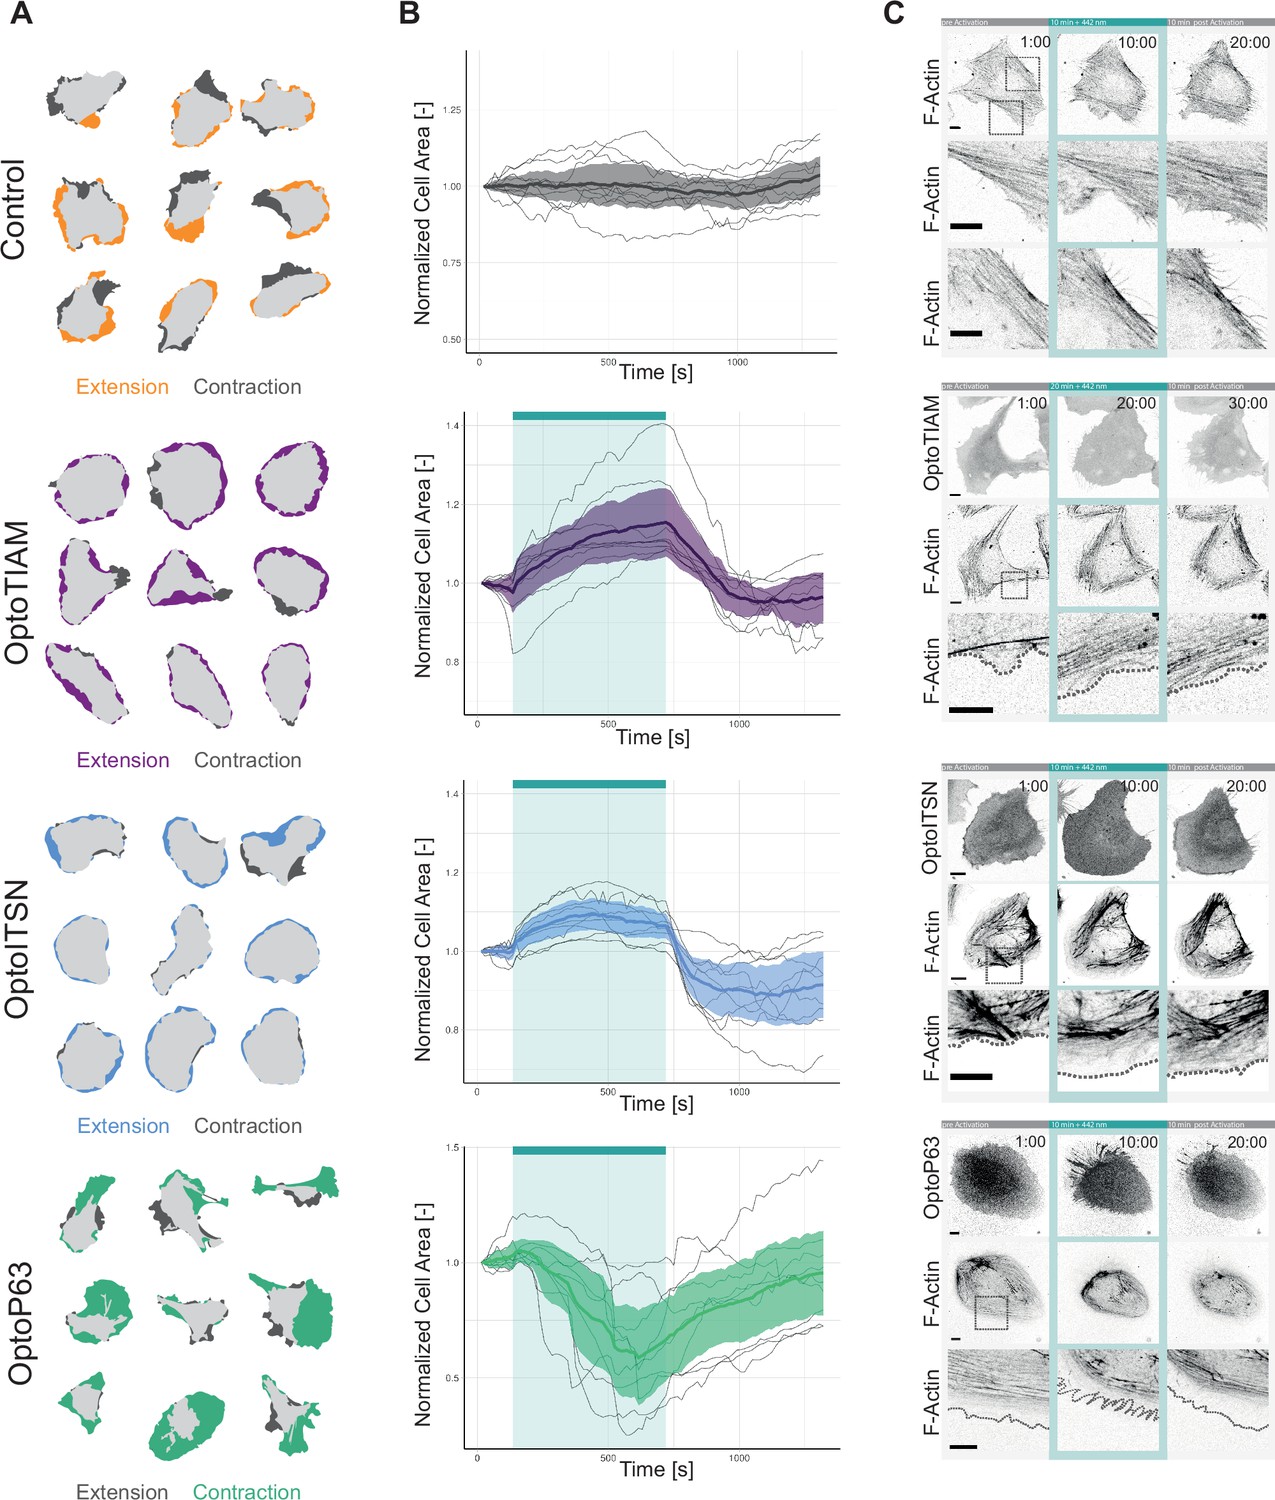
(A) Cell area change during 10 min photo-activation with a 442 nm laser line for BOECs stably expressing Lck-mTurquoise2-iLID, solely as control, and either SspB-HaloTag-TIAM1(DHPH)/ ITSN1(DHPH) or p63RhoGEF(DH). The images show an overlay of the cell area before and after the photo-activation and colors indicate either contraction or extension. (B) Normalized cell area over time for the cells depicted in A. Control = gray, OptoTIAM=purple, OptoITSN=blue, OptoP63=green. The cyan bar indicates photo-activation with 442 nm laser light. Thin lines represent individual cells, thick lines represent the mean values, and ribbons represent their 95% confidence interval. The number of analyzed cells is: Control = 9, OptoTIAM=9, OptoITSN=9, OptoP63=9. The data is from two independent experiments and at least three independent photo-activations. (C) Representative confocal microscopy images of BOECs stably expressing Lck-mTurquoise2-iLID (not shown), solely as control, and either SspB-HaloTag-TIAM1(DHPH)/ITSN1(DHPH) or p63RhoGEF(DH) stained with JF552 nm dye. Additionally, stained for F-actin with SiR-actin. Scale bars: 10 µm. Times are min:s from the start of the recording. Cyan bar indicates 442 nm photo-activation. Gray box indicates zoom. Gray dashed line indicates cell edge.
Figure 4—figure supplement 1
Global photo-activation.
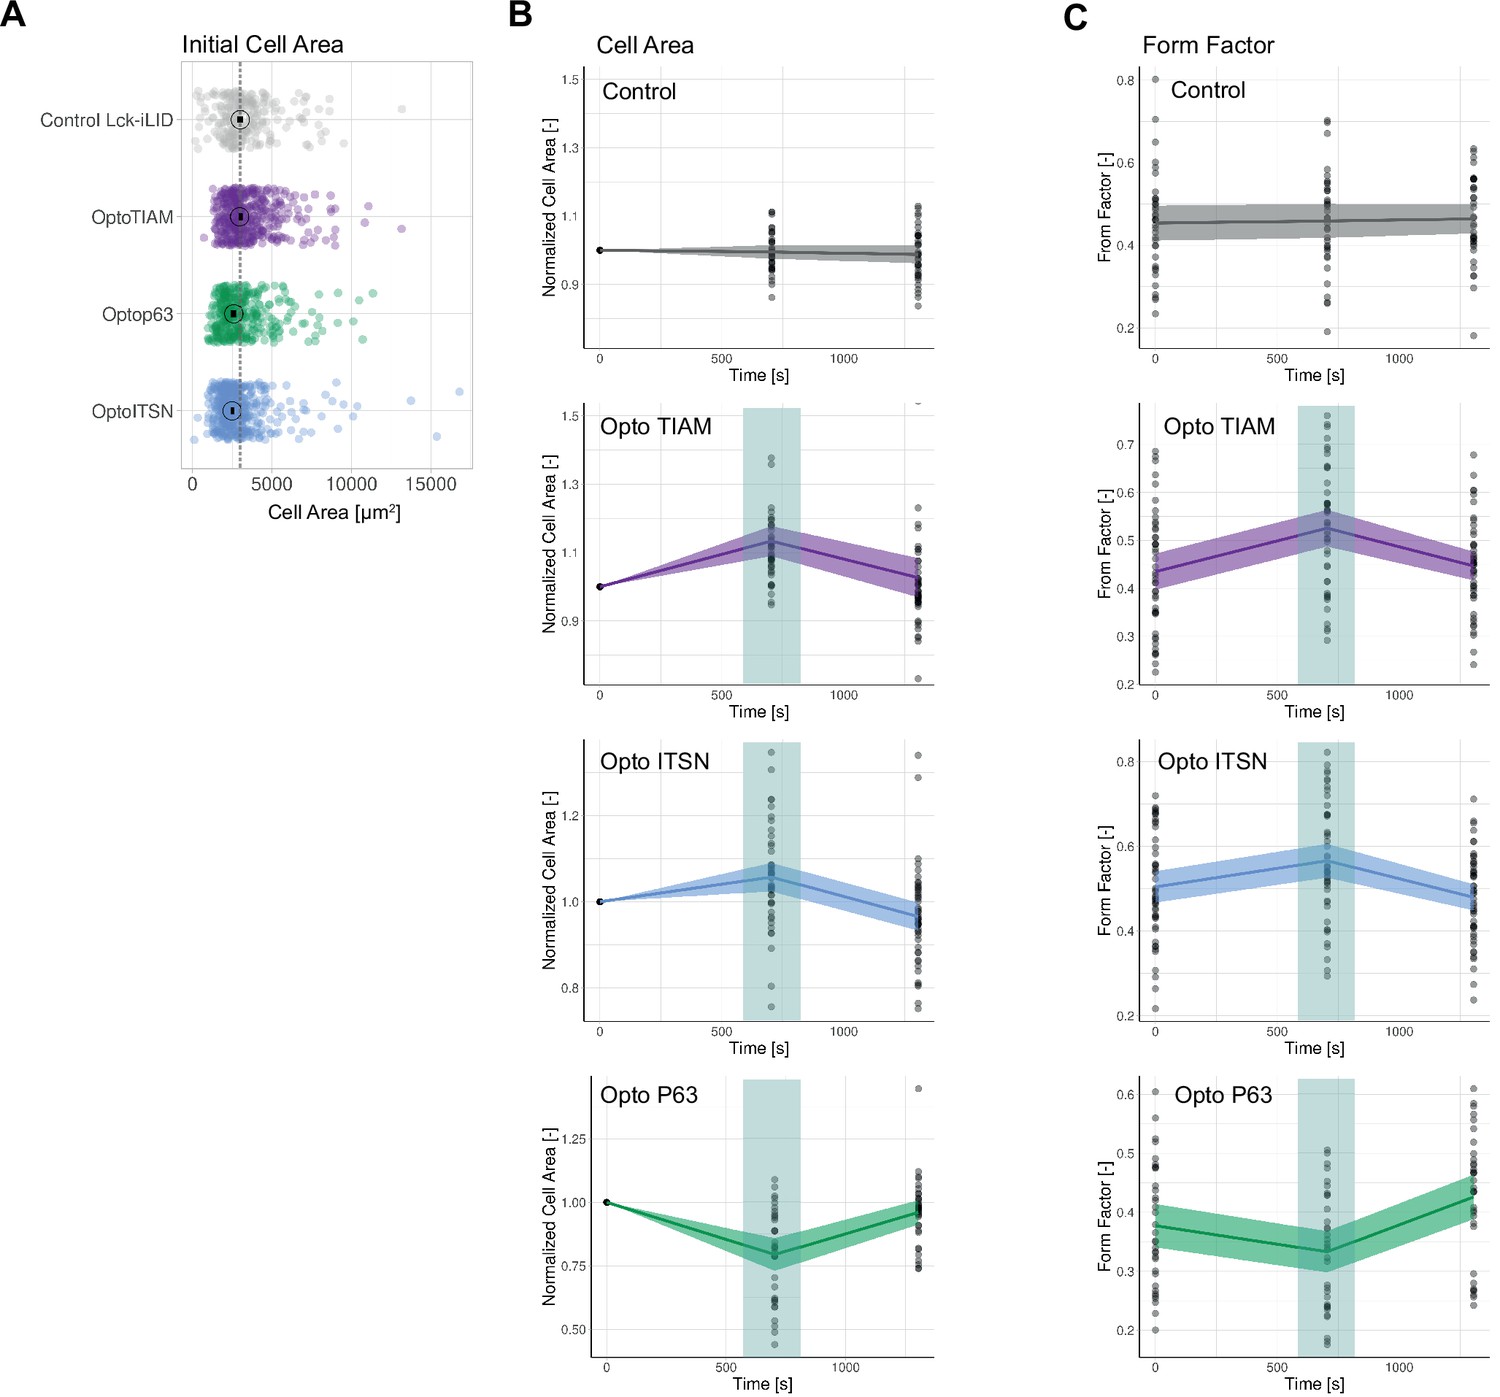
(A) Initial cell area for blood outgrowth endothelial cells (BOECs) stably expressing Lck-mTurquoise2-iLID, solely as control, and either SspB-HaloTag-TIAM1(DHPH)/ITSN1(DHPH) or p63RhoGEF(DH). Each dot represents an individual cell. The median of the data is shown as a black circle and the 95% confidence interval for each median, determined by bootstrapping, is indicated by the bar. The dashed line represents the median of the control condition. The number of cells per condition is: Control Lck-iLID=257, OptoITSN = 467, Optop63=389, OptoTIAM = 458. The data is from two independent experiments. (B) Cell area for BOECs stably expressing Lck-mTurquoise2-iLID, solely as control, and either SspB-HaloTag-TIAM1(DHPH)/ITSN1(DHPH) or p63RhoGEF(DH) before activation (t=0 s) at the end of 10 min activation (t=705) and 10 min after this activation (t=1305). Including the cell shown in Figure 4A and B. Dots represent individual cells, thick lines represent the mean values, and ribbons represent their 95% confidence interval. The number of analyzed cells is: Control = 36, OptoTIAM=45, OptoITSN=48, Opto-P63=34. The data is from two independent experiments with at least four individual photo-activations. (C) Form factor in B described dataset and conditions.
Figure 4—figure supplement 2

Cell-cell overlap.
(A) Normalized mean resistance and cell size for a 10 min photo-activation, indicated with cyan bar, of blood outgrowth endothelial cells (BOECs) expressing Lck-mTurquoise2-iLID and either SspB-HaloTag-TIAM1(DHPH)(purple)/ITSN1(DHPH) (blue) or p63RhoGEF(DH) (green). Resistance measured with electrical cell-substrate impedance sensing (ECIS) (darker color) and cell size measured in confocal microscopy images (lighter color). The same data is also presented in Figure 2B and Figure 4B. (B) Plot of the correlation between normalized mean resistance and normalized mean cell size for the curves shown in A. The general linear model (top right corner) was fit to the data and is indicated as a dashed line. (C) Confocal microscopy images from a time-lapse of a BOEC monolayer stably expressing Lck-mTurquoise2-iLID (not shown) and SspB-HaloTag-TIAM1(DHPH) (upper panel, LUT = mpl-magma, brighter colors represent higher intensity), additionally, PECAM was stained with a live labeling antibody Alexa Fluor 647 Mouse Anti-Human CD31 (lower panel, inverted gray). Purple dashed line indicates higher intensity PECAM areas marking cell-cell overlap. Arrows indicate higher intensity in the OptoTIAM channel in cell-cell overlap areas. Time is min:s from the start of photo-activation. The cyan bar indicates photo-activation with 442 nm laser light for 15 min. Scale bar: 25 µm. (D, E, F) Confocal microscopy images from a time-lapse of a BOEC monolayer stably expressing Lck-mTurquoise2-iLID (not shown) and SspB-HaloTag-TIAM1(DHPH) (upper panel, LUT = mpl-magma, brighter colors represent higher intensity), additionally, VE-cadherin was stained with the live labeling antibody Alexa Fluor 647 Mouse Anti-Human CD144 (lower panel, inverted gray). Arrows indicate higher intensity in the OptoTIAM channel in cell-cell overlap areas. Time is min: s from the start of photo-activation. The cyan bar indicates photo-activation with 442 nm laser light. Scale bar: 25 µm. Cell E is also shown in Figure 2C. (G) Normalized cell area over time for a subconfluent monolayer of BOEC stably expressing Lck-mTurquoise2-iLID and SspB-HaloTag-TIAM1(DHPH), photo-activated with 442 nm laser light in the time period indicated with the cyan bar. (H) Zoom-in on the corresponding confocal microscopy images measured in G. Images show BOECs, in a subconfluent monolayer, stably expressing Lck-mTurquoise2-iLID (not shown) and SspB-HaloTag-TIAM1(DHPH) (upper panel, LUT = mpl-magma, brighter colors represent higher intensity), additionally, VE-cadherin was stained with the live labeling antibody Alexa Fluor 647 Mouse Anti-Human CD144 (lower panel, inverted gray). Asterisks indicate holes in the monolayer. White arrows indicate overlap. Black arrows indicate newly formed adherens junctions. Time is min:s from the start of the recording. The cyan bar indicates photo-activation with 442 nm laser light. Scale bar: 25 µm. (I) Wide-field microscopy images of a mosaic BOEC monolayer with one population stably expressing SspB-HaloTag-TIAM1(DHPH) (not shown) and Lck-mTurquoise2-iLID, and the other population stably expressing the membrane marker mScarlet-CaaX. The cell-cell overlap is represented by the merge (top panel) of the Lck-mTurquoise2-iLID (magenta) and mScarlet-CaaX (green) channel and as a binary image (bottom panel) representing the cell area of Lck-mTurquoise2-iLID (purple) and mScarlet-CaaX (gray) cells, where the overlap is colored white. Cells were photo-activated with 442 nm excitation light as indicated by the cyan bar. Arrows indicate cell-cell overlap. (J) Quantification of the cell-cell overlap are for the in (I) presented experiment, by measuring the white indicated area that contains CFP as well as RFP signal. Thin lines represent individual cells, thick line represents the mean values, and ribbons represent the 95% confidence interval. The number of analyzed cells is 10 for three individual photo-activations.
Figure 5 with 1 supplement
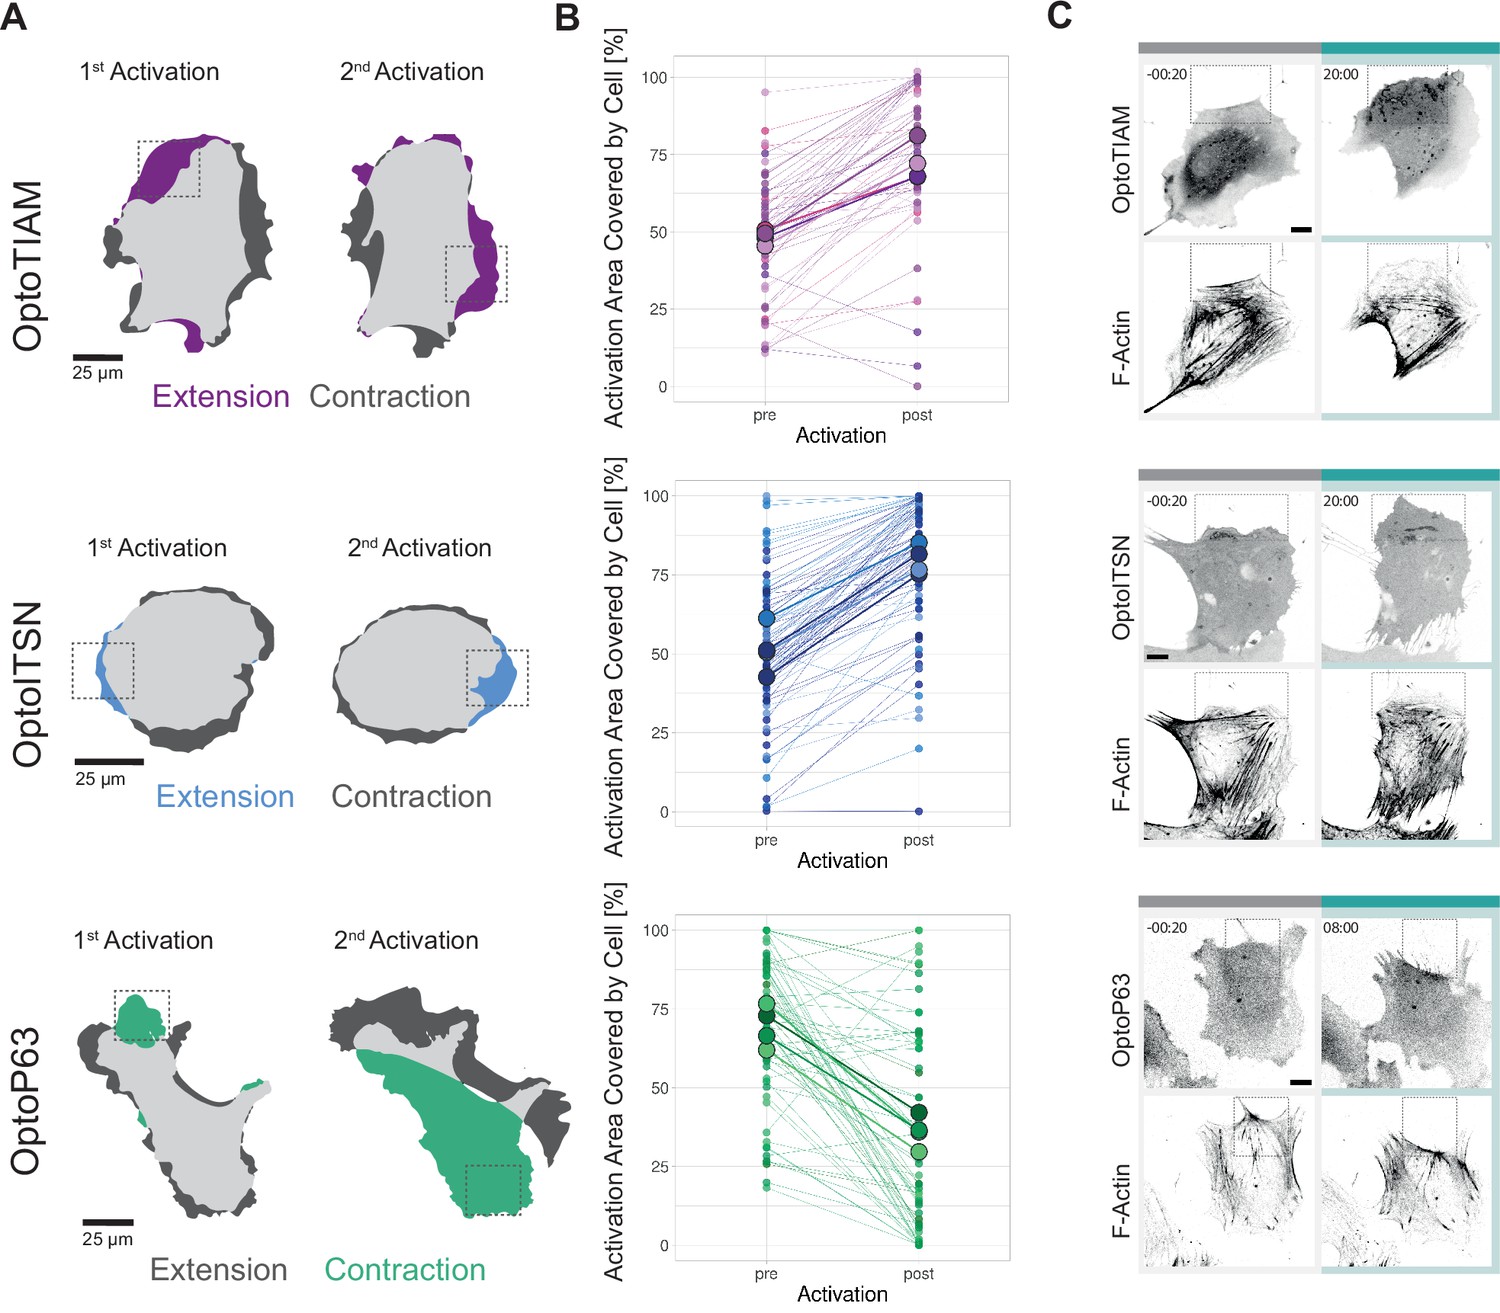
Characterization of local photo-activation of blood outgrowth endothelial cells (BOECs) expressing optogenetically recruitable RhoGEFs (Opto-RhoGEFs).
(A) Cell area change during two 10 min local photo-activations with 442 nm laser line for BOECs stably expressing Lck-mTurquoise2-iLID and either SspB-HaloTag-TIAM1(DHPH)/ITSN1(DHPH) or p63RhoGEF(DH). The images show an overlay of the cell area before and after the activation and colors indicate either contraction or extension. The gray dashed box indicates the area of activation. (B) Activation area covered by cell, pre- and post-10 min activation with 442 nm laser line, for BOECs stably expressing Lck-mTurquoise2-iLID and either SspB-HaloTag-TIAM1(DHPH)(purple)/ITSN1(DHPH) (blue) or p63RhoGEF(DH) (green). Small dots represent individual activation areas, which are connected by lines. Larger dots represent the mean of each replicate indicated by different colors. The number of activation areas for OptoTIAM=53, for OptoITSN=85, OptoP63=61. (C) Representative confocal microscopy images of BOECs stably expressing Lck-mTurquoise2-iLID (not shown) and either SspB-HaloTag-TIAM1(DHPH)/ITSN1(DHPH) or p63RhoGEF(DH) stained with JF552 nm dye. Additionally, stained for F-actin with SiR-actin. Scale bars: 10 µm. Times are min:s from the start of the photo-activation. Cyan bar indicates 442 nm photo-activation and gray box indicates area of activation.
Figure 5—figure supplement 1

Local photo-activation.
(A) Activation area covered by cell before and after 10 min without local photo-activation for control blood outgrowth endothelial cells (BOECs) stably expressing Lck-mTurquoise2-iLID. Small dots represent individual areas, which are connected by lines. Larger dots represent the mean of each replicate indicated by different colors. The number of areas is: control = 76. (B) Activation area covered by cell, pre- and post-10 min activation with 442 nm light, for BOECs stably expressing Lck-mTurquoise2-iLID and either SspB-HaloTag-TIAM1(DHPH)(purple), -ITSN1(DHPH) (blue), or -p63RhoGEF(DH) (green), shown in Figure 5B. Separated for first and second 10 min activation on the same cell but on opposite sides of the cell. Small dots represent individual activation areas, which are connected by lines. Larger dots represent the mean. The number of activation areas for OptoTIAM=53, for OptoITSN=85, OptoP63=61. (C) Stills from a confocal time-lapse of a BOEC stably expressing Lck-mTurquoise2-iLID (not shown) and SspB-HaloTag-TIAM1(DHPH) (gray) stained with JF552 nm dye, locally photo-activated with 442 nm laser light in the blue area. Scale bars: 25 µm. Times are min:s from the start of the recording.
Author response image 1
Videos
Animation 1
Zoom-in from a confocal microscopy time-lapse of a blood outgrowth endothelial cell (BOEC) monolayer stably expressing Lck-mTurquoise2-iLID (not shown) and SspB-HaloTag-TIAM1(DHPH) stained with JF552 nm dye (LUT = mpl-magma, bright colors indicating higher intensity).
Additionally, VE-cadherin was stained with the live labeling antibody Alexa Fluor 647 Mouse Anti-Human CD144 (white). Cells were photo-activated with a 442 nm laser as indicated. Times are min:s from the start of the recording.
Animation 2
Zoom-in from a confocal microscopy time-lapse of a blood outgrowth endothelial cell (BOEC) monolayer stably expressing Lck-mTurquoise2-iLID (not shown) and SspB-HaloTag-ITSN1(DHPH) stained with JF552 nm dye (LUT = mpl-magma, bright colors indicating higher intensity).
Additionally, VE-cadherin was stained with the live labeling antibody Alexa Fluor 647 Mouse Anti-Human CD144 (white). Cells were photo-activated with a 442 nm laser as indicated. Times are min:s from the start of the recording.
Animation 3
Zoom-in from a confocal microscopy time-lapse of a blood outgrowth endothelial cell (BOEC) monolayer stably expressing Lck-mTurquoise2-iLID (not shown) and SspB-HaloTag-p63RhoGEF(DH) stained with JF552 nm dye (LUT = mpl-magma, bright colors indicating higher intensity).
Additionally, VE-cadherin was stained with the live labeling antibody Alexa Fluor 647 Mouse Anti-Human CD144 (white). Cells were photo-activated with a 442 nm laser as indicated. Times are min:s from the start of the recording.
Animation 4
Whole field of view confocal microscopy time-lapse of a blood outgrowth endothelial cell (BOEC) monolayer stably expressing Lck-mTurquoise2-iLID (not shown) and SspB-HaloTag-TIAM1(DHPH) stained with JF552 nm dye (LUT = mpl-magma, bright colors indicating higher intensity).
Additionally, VE-cadherin was stained with the live labeling antibody Alexa Fluor 647 Mouse Anti-Human CD144 (white). Cells were photo-activated with a 442 nm laser as indicated. Times are min:s from the start of the recording.
Animation 5
Whole field of view confocal microscopy time-lapse of a blood outgrowth endothelial cell (BOEC) monolayer stably expressing Lck-mTurquoise2-iLID (not shown) and SspB-HaloTag-ITSN1(DHPH) stained with JF552 nm dye (LUT = mpl-magma, bright colors indicating higher intensity).
Additionally, VE-cadherin was stained with the live labeling antibody Alexa Fluor 647 Mouse Anti-Human CD144 (white). Cells were photo-activated with a 442 nm laser as indicated. Times are min:s from the start of the recording.
Animation 6
Whole field of view confocal microscopy time-lapse of a blood outgrowth endothelial cell (BOEC) monolayer stably expressing Lck-mTurquoise2-iLID (not shown) and SspB-HaloTag-p63RhoGEF(DH) stained with JF552 nm dye (LUT = mpl-magma, bright colors indicating higher intensity).
Additionally, VE-cadherin was stained with the live labeling antibody Alexa Fluor 647 Mouse Anti-Human CD144 (white). Cells were photo-activated with a 442 nm laser as indicated. Times are min:s from the start of the recording.
Animation 7
Confocal microscopy time-lapse of a blood outgrowth endothelial cell (BOEC) monolayer stably expressing Lck-mTurquoise2-iLID (not shown) and SspB-HaloTag-TIAM1(DHPH) (not shown), additionally, VE-cadherin was stained with the live labeling antibody Alexa Fluor 647 Mouse Anti-Human CD144 (gray inverted).
Cells were treated with VE-cadherin blocking antibody as indicated. Times are min:s from the start of the recording.
Animation 8
Whole field of view confocal microscopy time-lapse of a blood outgrowth endothelial cell (BOEC) monolayer stably expressing Lck-mTurquoise2-iLID (cyan).
Additionally, VE-cadherin was stained with the live labeling antibody Alexa Fluor 647 Mouse Anti-Human CD144 (gray inverted). Cells were photo-activated with a 442 nm laser as indicated. Times are min:s from the start of the recording.
Animation 9
Whole field of view confocal microscopy time-lapse of a blood outgrowth endothelial cell (BOEC) monolayer stably expressing Lck-mTurquoise2-iLID (cyan) and treated with the VE-cadherin blocking antibody.
Additionally, VE-cadherin was stained with the live labeling antibody Alexa Fluor 647 Mouse Anti-Human CD144 (gray inverted). Cells were photo-activated with a 442 nm laser as indicated. Times are min:s from the start of the recording.
Animation 10
Whole field of view confocal microscopy time-lapse of a blood outgrowth endothelial cell (BOEC) monolayer stably expressing Lck-mTurquoise2-iLID (not shown) and SspB-HaloTag-TIAM1(DHPH) stained with JF552 nm dye (LUT = mpl-magma, bright colors indicating higher intensity).
Additionally, VE-cadherin was stained with the live labeling antibody Alexa Fluor 647 Mouse Anti-Human CD144 (gray inverted). Cells were photo-activated with a 442 nm laser as indicated. Times are min:s from the start of the recording.
Animation 11
Whole field of view confocal microscopy time-lapse of a blood outgrowth endothelial cell (BOEC) monolayer stably expressing Lck-mTurquoise2-iLID (not shown) and SspB-HaloTag-TIAM1(DHPH) stained with JF552 nm dye (LUT = mpl-magma, bright colors indicating higher intensity) and treated with the VE-cadherin blocking antibody.
Additionally, VE-cadherin was stained with the live labeling antibody Alexa Fluor 647 Mouse Anti-Human CD144 (gray inverted). Cells were photo-activated with a 442 nm laser as indicated. Times are min:s from the start of the recording.
Animation 12
Whole field of view confocal microscopy time-lapse of a blood outgrowth endothelial cell (BOEC) monolayer stably expressing Lck-mTurquoise2-iLID (not shown) and SspB-HaloTag-ITSN1(DHPH) stained with JF552 nm dye (LUT = mpl-magma, bright colors indicating higher intensity).
Additionally, VE-cadherin was stained with the live labeling antibody Alexa Fluor 647 Mouse Anti-Human CD144 (gray inverted). Cells were photo-activated with a 442 nm laser as indicated. Times are min:s from the start of the recording.
Animation 13
Whole field of view confocal microscopy time-lapse of a blood outgrowth endothelial cell (BOEC) monolayer stably expressing Lck-mTurquoise2-iLID (not shown) and SspB-HaloTag-ITSN1(DHPH) stained with JF552 nm dye (LUT = mpl-magma, bright colors indicating higher intensity) and treated with the VE-cadherin blocking antibody.
Additionally, VE-cadherin was stained with the live labeling antibody Alexa Fluor 647 Mouse Anti-Human CD144 (gray inverted). Cells were photo-activated with a 442 nm laser as indicated. Times are min:s from the start of the recording.
Animation 14
Whole field of view confocal microscopy time-lapse of a blood outgrowth endothelial cell (BOEC) monolayer stably expressing Lck-mTurquoise2-iLID (not shown) and SspB-HaloTag-p63RhoGEF(DH) stained with JF552 nm dye (LUT = mpl-magma, bright colors indicating higher intensity).
Additionally, VE-cadherin was stained with the live labeling antibody Alexa Fluor 647 Mouse Anti-Human CD144 (gray inverted). Cells were photo-activated with a 442 nm laser as indicated. Times are min:s from the start of the recording.
Animation 15
Whole field of view confocal microscopy time-lapse of a blood outgrowth endothelial cell (BOEC) monolayer stably expressing Lck-mTurquoise2-iLID (not shown) and SspB-HaloTag-p63RhoGEF(DH) stained with JF552 nm dye (LUT = mpl-magma, bright colors indicating higher intensity) and treated with the VE-cadherin blocking antibody.
Additionally, VE-cadherin was stained with the live labeling antibody Alexa Fluor 647 Mouse Anti-Human CD144 (gray inverted). Cells were photo-activated with a 442 nm laser as indicated. Times are min:s from the start of the recording.
Animation 16
Confocal microscopy time-lapse of a blood outgrowth endothelial cell (BOEC) stably expressing Lck-mTurquoise2-iLID (not shown), solely as control.
Additionally, stained for F-actin with SiR-actin. Cell was photo-activated with a 442 nm laser line as indicated. Times are min:s from the start of the recording.
Animation 17
Confocal microscopy time-lapse of a blood outgrowth endothelial cell (BOEC) stably expressing Lck-mTurquoise2-iLID (not shown) and SspB-HaloTag-TIAM1(DHPH) stained with JF552 nm dye (left).
Additionally, stained for F-actin with SiR-actin (right). Cell was photo-activated with a 442 nm laser line as indicated. Times are min:s from the start of the recording.
Animation 18
Confocal microscopy time-lapse of a blood outgrowth endothelial cell (BOEC) stably expressing Lck-mTurquoise2-iLID (not shown) and SspB-HaloTag-ITSN1(DHPH) stained with JF552 nm dye (left).
Additionally, stained for F-actin with SiR-actin (right). Cell was photo-activated with a 442 nm laser line as indicated. Times are min:s from the start of the recording.
Animation 19
Confocal microscopy time-lapse of a blood outgrowth endothelial cell (BOEC) stably expressing Lck-mTurquoise2-iLID (not shown) and SspB-HaloTag-p63RhoGEF(DH) stained with JF552 nm dye (left).
Additionally, stained for F-actin with SiR-actin (right). Cell was photo-activated with a 442 nm laser line as indicated. Times are min:s from the start of the recording.
Animation 20
Confocal time-lapse of a blood outgrowth endothelial cell (BOEC) monolayer stably expressing Lck-mTurquoise2-iLID (not shown) and SspB-HaloTag-TIAM1(DHPH) (left, LUT = mpl-magma, brighter colors represent higher intensity), additionally, PECAM was stained with a live labeling antibody Alexa Fluor 647 Mouse Anti-Human CD31 (right, inverted gray).
Cells were photo-activated with 442 nm laser light as indicated. Times are min:s from the start of the recording.
Animation 21
Whole field of view confocal microscopy time-lapse of blood outgrowth endothelial cells (BOECs), growing in a subconfluent monolayer, stably expressing Lck-mTurquoise2-iLID (not shown) and SspB-HaloTag-TIAM1(DHPH) (left, LUT = mpl-magma, brighter colors represent higher intensity), additionally, VE-cadherin was stained with the live labeling antibody Alexa Fluor 647 Mouse Anti-Human CD144 (right, inverted gray).
Cells were photo-activated with 442 nm laser light as indicated. Time is min:s from the start of the recording.
Animation 22
Wide-field microscopy time-lapse of a mosaic blood outgrowth endothelial cell (BOEC) monolayer with one population stably expressing SspB-HaloTag-TIAM1(DHPH) (first panel, LUT = mpl-magma, brighter colors represent higher intensity) and Lck-mTurquoise2-iLID (second panel), and the other population stably expressing the membrane marker mScarlet-CaaX (third panel).
The cell-cell overlap is represented by the merge (forth panel) of the Lck-mTurquoise2-iLID (magenta) and mScarlet-CaaX (green) channel. Cells were photo-activated with 442 nm excitation light as indicated. Time is min:s from the start of the recording.
Animation 23
Confocal time-lapse of a blood outgrowth endothelial cell (BOEC) stably expressing Lck-mTurquoise2-iLID (not shown) and SspB-HaloTag-TIAM1(DHPH) (gray inverted) stained with JF552 nm dye, two times locally photo-activated for 10 min with a 442 nm laser, as indicated by the cyan dashed box.
Times are min:s from the start of the recording.
Animation 24
Confocal time-lapse of a blood outgrowth endothelial cell (BOEC) stably expressing Lck-mTurquoise2-iLID (not shown) and SspB-HaloTag-ITSN1(DHPH) (gray inverted), stained with JF552 nm dye, two times locally photo-activated for 10 min with a 442 nm laser, as indicated by the cyan dashed box.
Times are min:s from the start of the recording.
Animation 25
Confocal time-lapse of a blood outgrowth endothelial cell (BOEC) stably expressing Lck-mTurquoise2-iLID (not shown) and SspB-HaloTag-p63RhoGEF(DH) (gray inverted), stained with JF552 nm dye, two times locally photo-activated for 10 min with a 442 nm laser, as indicated by the cyan dashed box.
Times are min:s from the start of the recording.
Animation 26
Confocal time-lapse of a blood outgrowth endothelial cell (BOEC) stably expressing Lck-mTurquoise2-iLID (not shown) and SspB-HaloTag-TIAM1(DHPH) (left) stained with JF552 nm dye.
Additionally, stained for F-actin with SiR-actin (right). The cell was locally photo-activated with a 442 nm laser, as indicated by the cyan dashed box. Times are min:s from the start of the recording.
Animation 27
Confocal time-lapse of a blood outgrowth endothelial cell (BOEC) stably expressing Lck-mTurquoise2-iLID (not shown) and SspB-HaloTag-ITSN1(DHPH) (left) stained with JF552 nm dye.
Additionally, stained for F-actin with SiR-actin (right). The cell was locally photo-activated with a 442 nm laser, as indicated by the cyan dashed box. Times are min:s from the start of the recording.
Animation 28
Confocal time-lapse of a blood outgrowth endothelial cell (BOEC) stably expressing Lck-mTurquoise2-iLID (not shown) and SspB-HaloTag-p63RhoGEF(DH) (left) stained with JF552 nm dye.
Additionally, stained for F-actin with SiR-actin (right). The cell was locally photo-activated with a 442 nm laser line, as indicated by the cyan dashed box. Times are min:s from the start of the recording.
Animation 29
Confocal microscopy time-lapse of a blood outgrowth endothelial cell (BOEC) stably expressing Lck-mTurquoise2-iLID (not shown) and SspB-HaloTag-TIAM1(DHPH) (gray inverted), stained with JF552 nm dye.
The cell was repeatedly, locally photo-activated with a 442 nm laser line, as indicated by cyan area. Times are min:s from the start of the recording.
Animation 30
Confocal microscopy time-lapse of a BOEC stably expressing Lck-mTurquoise2-iLID (not shown) and SspB-HaloTag-TIAM1(DHPH) (gray inverted).
Stained with JF552 nm dye. The cell was repeatedly, locally photo activated with a 442 nm laser line, as indicated by cyan area. Times are min:s from the start of the recording.
Tables
Table 1
PCR primers for insert amplification.
| PCR product/insert | Template | Primer sequence |
|---|---|---|
| iSH | CFP-FKBP-iSH (addgene #20159) | FW 5’ATATTCCGGAtccaagtaccaacaagaccagg-3’ |
| RV 5’ATAT GAATTCcgtgcgctcctcgtg-3’ | ||
| iRFP670 | N1-iRFP670 (addgene #45457) | FW 5'- ATATGAATTCATGGCGCGTAAGGTCGAT-3' |
| RV 5'- ATATGGGCCCGCGTTGGTGGTGGGC-3' | ||
| iLID | Venus-iLID-CaaX (addgene #604110) | FW 5’-ATGGACGAGCTGTACAAGGGT-3’ |
| RV 5’-ATACCTCGAGTTACTTTGTCTTTGACTTCTTTTTCTTCTT-3’ | ||
| HaloTag | HaloTag (Ariana Tkachuk) | FW 5’-ATATACCGGTCGCCACCatggccgagatcggca-3’ |
| RV 5’-ATATTGTACACgccgctgatctccagg-3’ | ||
| Lck-mTurquoise2-iLID SspB-HaloTag-ITSN(DHPH) SspB-HaloTag-RhoGEFp63(DH) | C1-Lck-mTurqoiuse2-iLID C1-SspB-HaloTag-ITSN1(DHPH) C1-SspB-HaloTag-RhoGEFp63(DH) | FW 5'-CTTGGCAGTACATCAAGTGTATCATATGCC-3' |
| RV 5'-CCTCTACAAATGTGGTATGGCTGATTATGATC-3' | ||
| SspB-HaloTag-TIAM1(DHPH) | C1-SspB-HaloTag-TIAM1(DHPH) | FW 5’-ATATGGTACCATGAGCTCCCCGAAACG-3’ |
| RV 5’-ATATGCGGCCGCTCACTGTCTTCTGTGTTTATCTCGC-3’ |
Table 2
Addgene numbers for plasmids created in this study.
| Name | Addgene number |
|---|---|
| iSH-iRFP670-SspB | 176102 |
| C1-Lck-mTq2-iLID | 176125 |
| C1-HaloTag-3xrGBD | 176108 |
| C1-SspB-mCherry-p63DH | 176112 |
| C1-SspB-mCherry-DHPH-ITSN | 176103 |
| C1-SspB-mCherry-DHPH-TIAM | 176104 |
| C1-SspB-HaloTag-DHPH-ITSN1 | 176113 |
| C1-SspB-HaloTag-DHPH-TIAM1 | 176114 |
| C1-SSpB-HaloTag-p63DH | 176116 |
| C1-SspB-iRFP670-DHPH-ITSN1 | 176117 |
| C1-SspB-iRFP670-DHPH-TIAM1 | 176118 |
| C1-SspB-iRFP670-p63DH | 176120 |
| pLV-Lck-mTq2-iLID | 176130 |
| pLV-SspB-HaloTag-TIAM-DHPH | 176127 |
| pLV-SspB-HaloTag-ITSN-DHPH | 176128 |
| pLV-SspB-HaloTag-p63DH | 176129 |
| pEntr1a-SspB-HaloTag-TIAM-DHPH | 176134 |
Additional files
Download links
A two-part list of links to download the article, or parts of the article, in various formats.
Downloads (link to download the article as PDF)
Open citations (links to open the citations from this article in various online reference manager services)
Cite this article (links to download the citations from this article in formats compatible with various reference manager tools)
Opto-RhoGEFs, an optimized optogenetic toolbox to reversibly control Rho GTPase activity on a global to subcellular scale, enabling precise control over vascular endothelial barrier strength
eLife 12:RP84364.
https://doi.org/10.7554/eLife.84364.3


