Metabolic consequences of various fruit-based diets in a generalist insect species
- UMR CBGP (INRAE-IRD-CIRAD, Montpellier SupAgro), Campus International de Baillarguet, France
- Department of Agricultural Biology, Colorado State University, United States
- Université de Strasbourg, INRAE, France
Figures
Figure 1 with 4 supplements
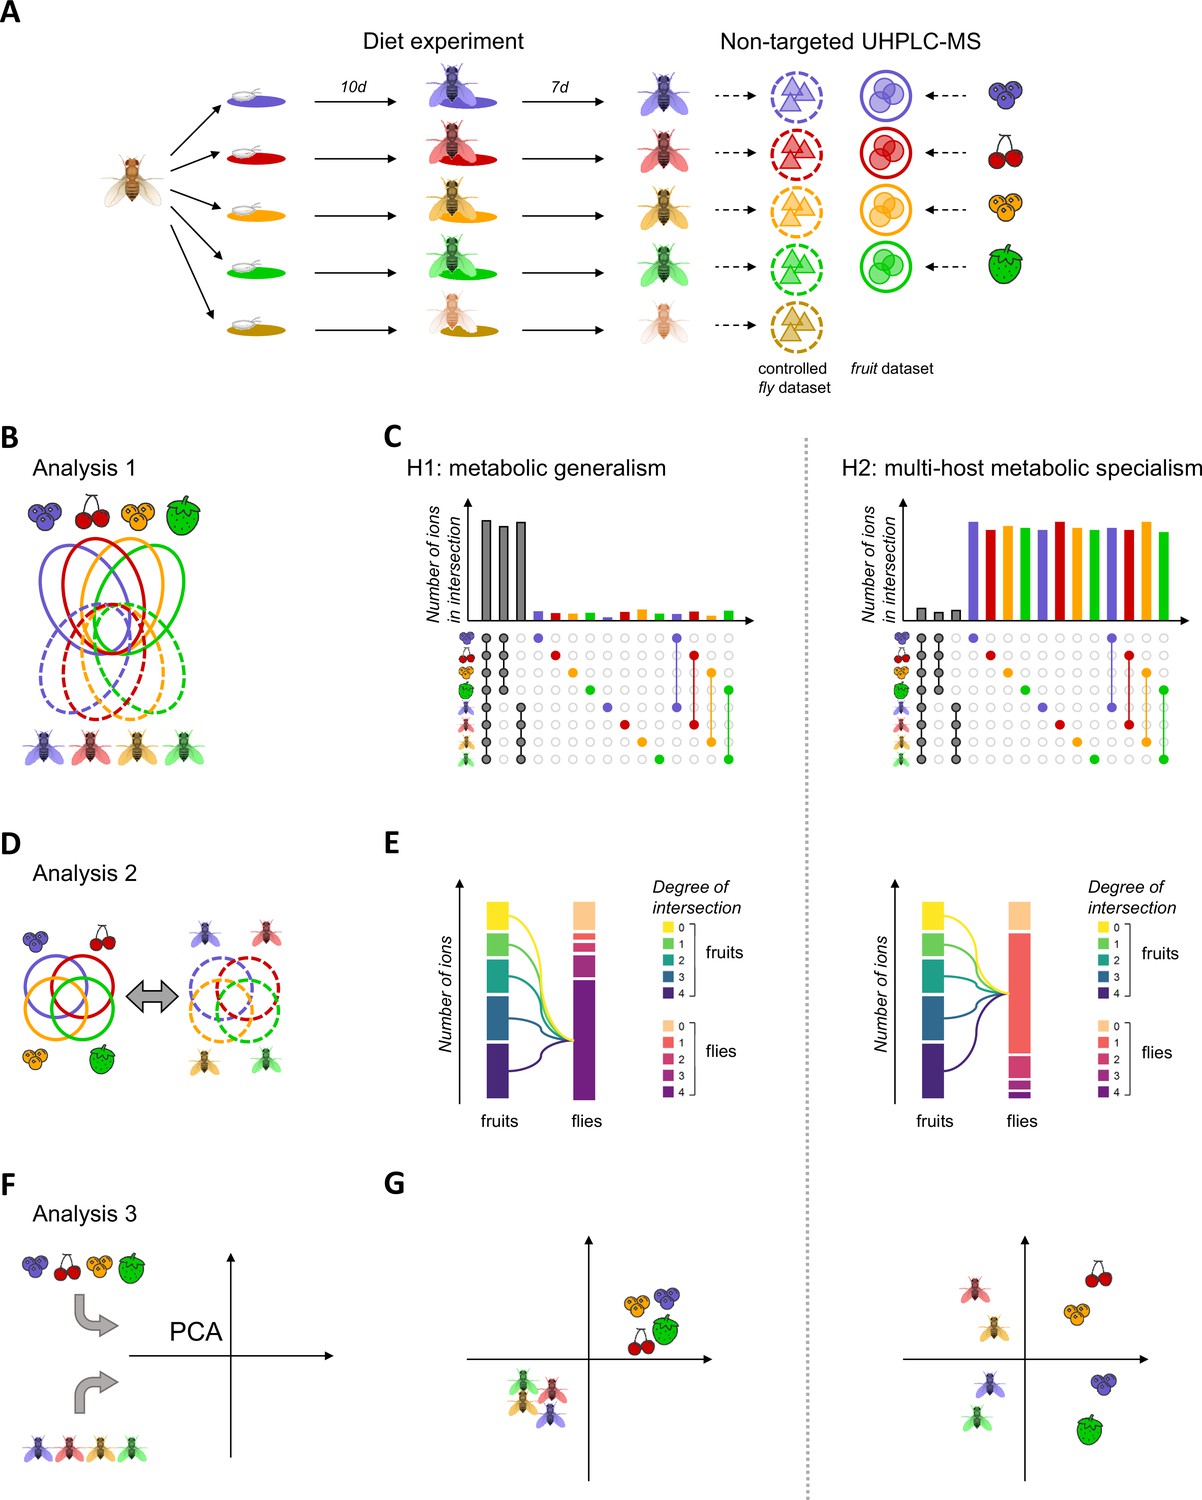
Schematic overview of experimental design, host use analyses, and expectations according to the ‘metabolic generalism’ and ‘multi-host metabolic specialism’ hypotheses.
In order to investigate whether different food sources were treated similarly or differently by a generalist species, we followed a simple experimental procedure (A), where eggs of a single founder population were separately developed on four fruit media and one control ‘German Food’ medium for 10 days and kept on the same fruit for seven days of adult life. Both adult flies and fruit purees were processed to obtain the controlled fly and fruit datasets, with respective ions represented by colored triangles and dots. These datasets were used to perform three analyses (B, D, F) linked to three diverging expectations under our competing hypotheses of ‘metabolic generalism’ and ‘multi-host metabolic specialism’ (C, E, G). First, the comparison of the relative sizes of intersections of the complete dataset (B) should indicate whether ions are mostly shared between intersections of large sizes such as all fruits, all flies, or all samples (C, left) or whether ions are mostly confined to intersections of small size such as discrete categories or fruit-fly pairs (C, right). Second, relationships between intersections between fruits on one hand and between flies on the other (D) should indicate whether common or rare fruit ions are commonly (E, left) or rarely (E, right) found in flies. Third, while a principal component analysis (PCA) of the complete dataset should separate fruit and flies on the first dimension due to their expected dissimilarities, its second dimension should indicate whether differently-fed flies regroup into a single cluster (F, left) or whether they cluster away from each other and close to their fruit on this axis (F, right). Regarding expectations (C, E, G), all left and right panels are consistent with the ‘metabolic generalism’ and ‘multi-host metabolic specialism’ hypotheses, respectively.
Figure 1—figure supplement 1
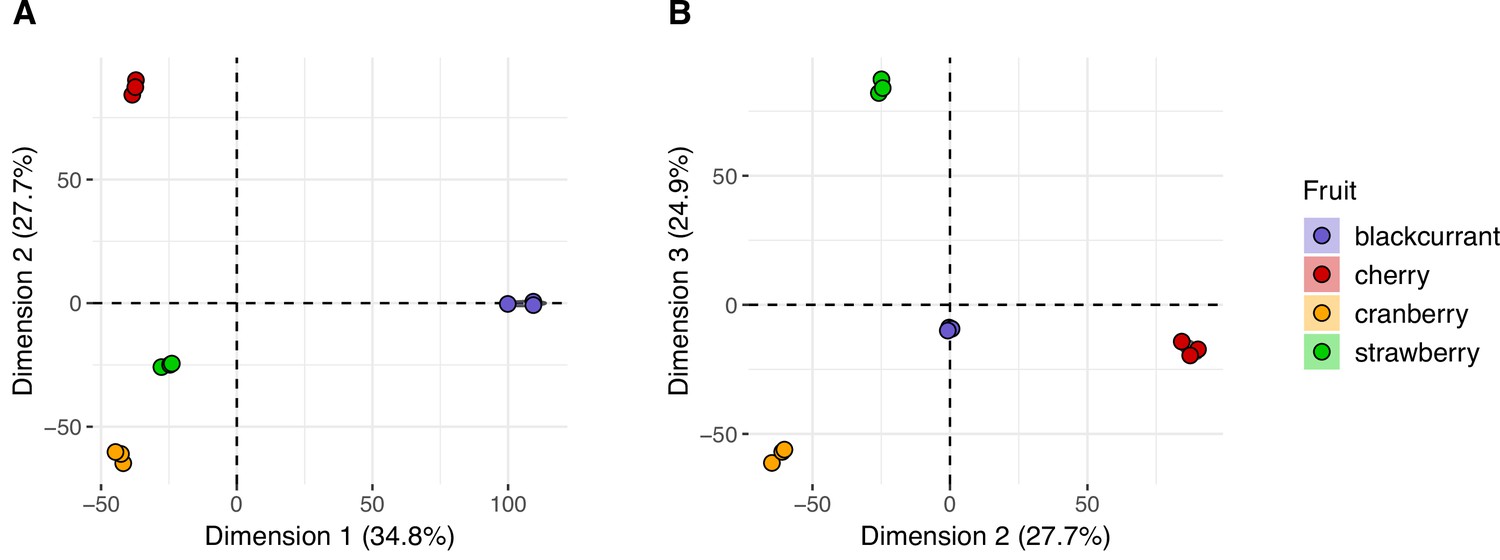
Principal component analysis (PCA) of fruits’ metabolomes.
(A) Dimension 1 vs. dimension 2, and (B) dimension 2 vs. dimension 3. Different fruit samples are represented by colored dots. Eigenvalues of the PCA of fruit metabolomes showed that only three dimensions explained more than 87% of the dataset variance, thus we visually explored only the first three dimensions of the PCA.
Figure 1—figure supplement 2
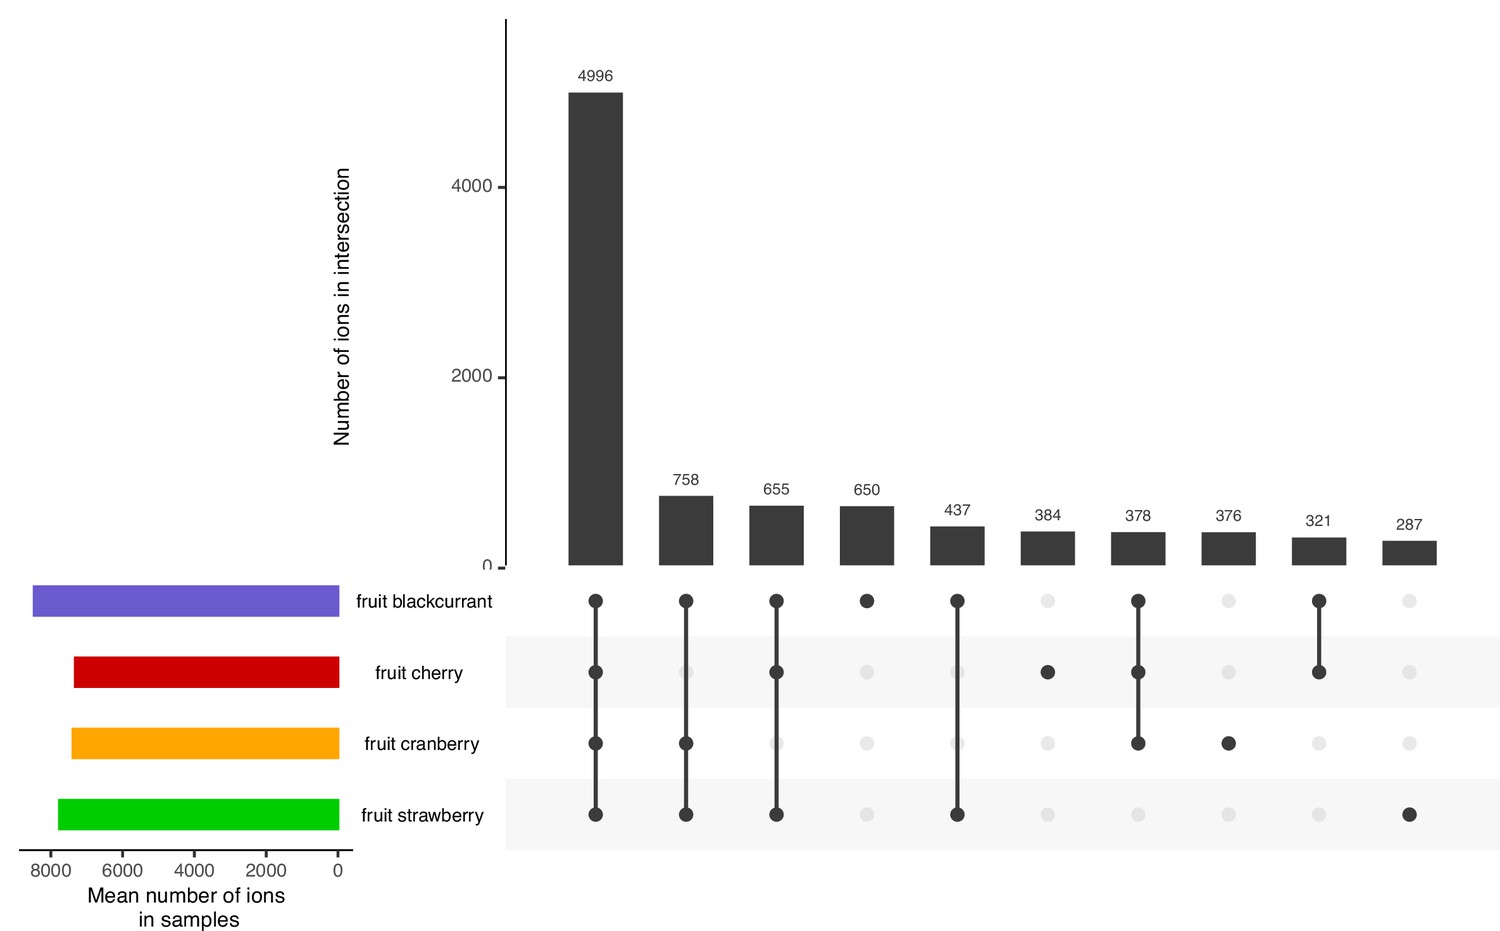
Upset plot of the number of shared ions between all fruits (ten largest intersections).
Figure 1—figure supplement 3
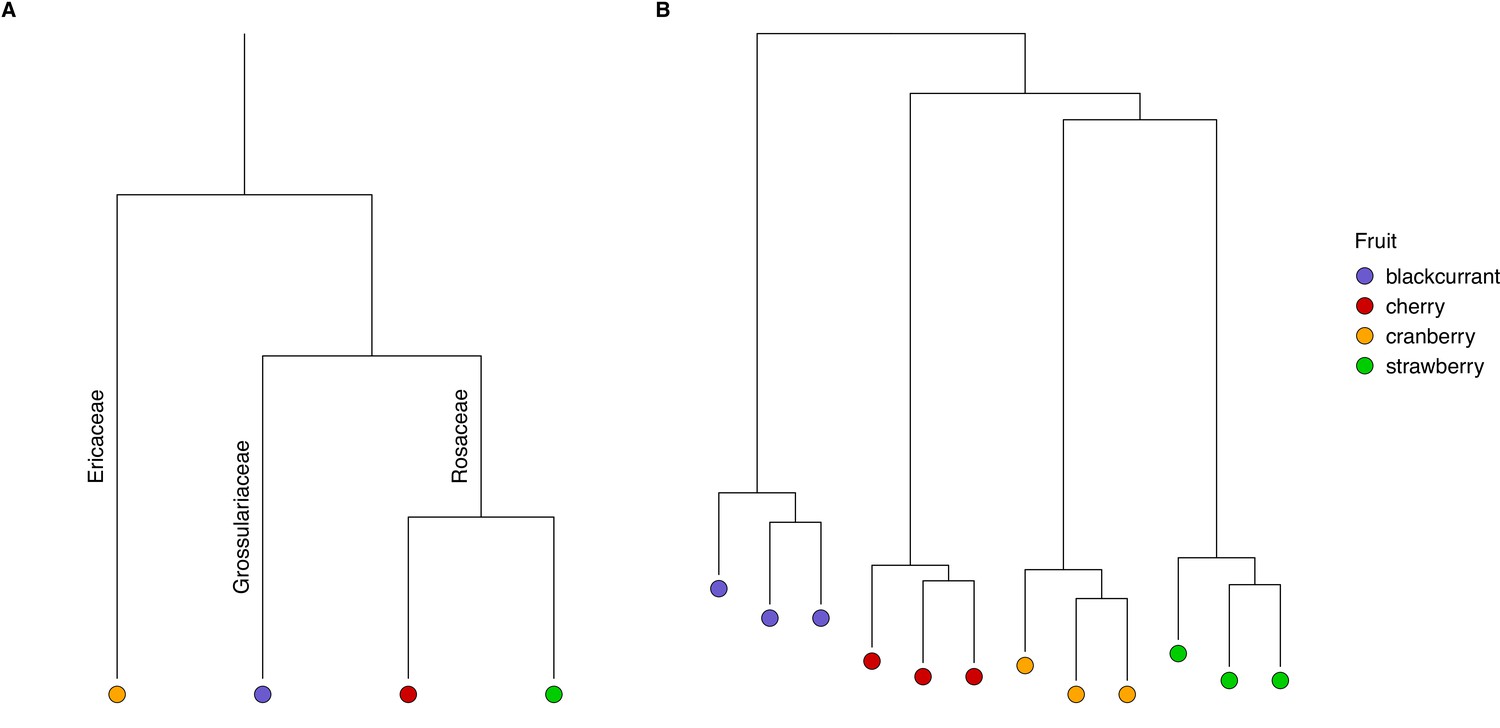
Comparison between the taxonomy of investigated plant species and the biochemical proximity of their fruits.
(A) Phylogenetic dendrogram of investigated plant species, (B) Hierarchical clustering of fruit samples using the fruit dataset.
Figure 1—figure supplement 4
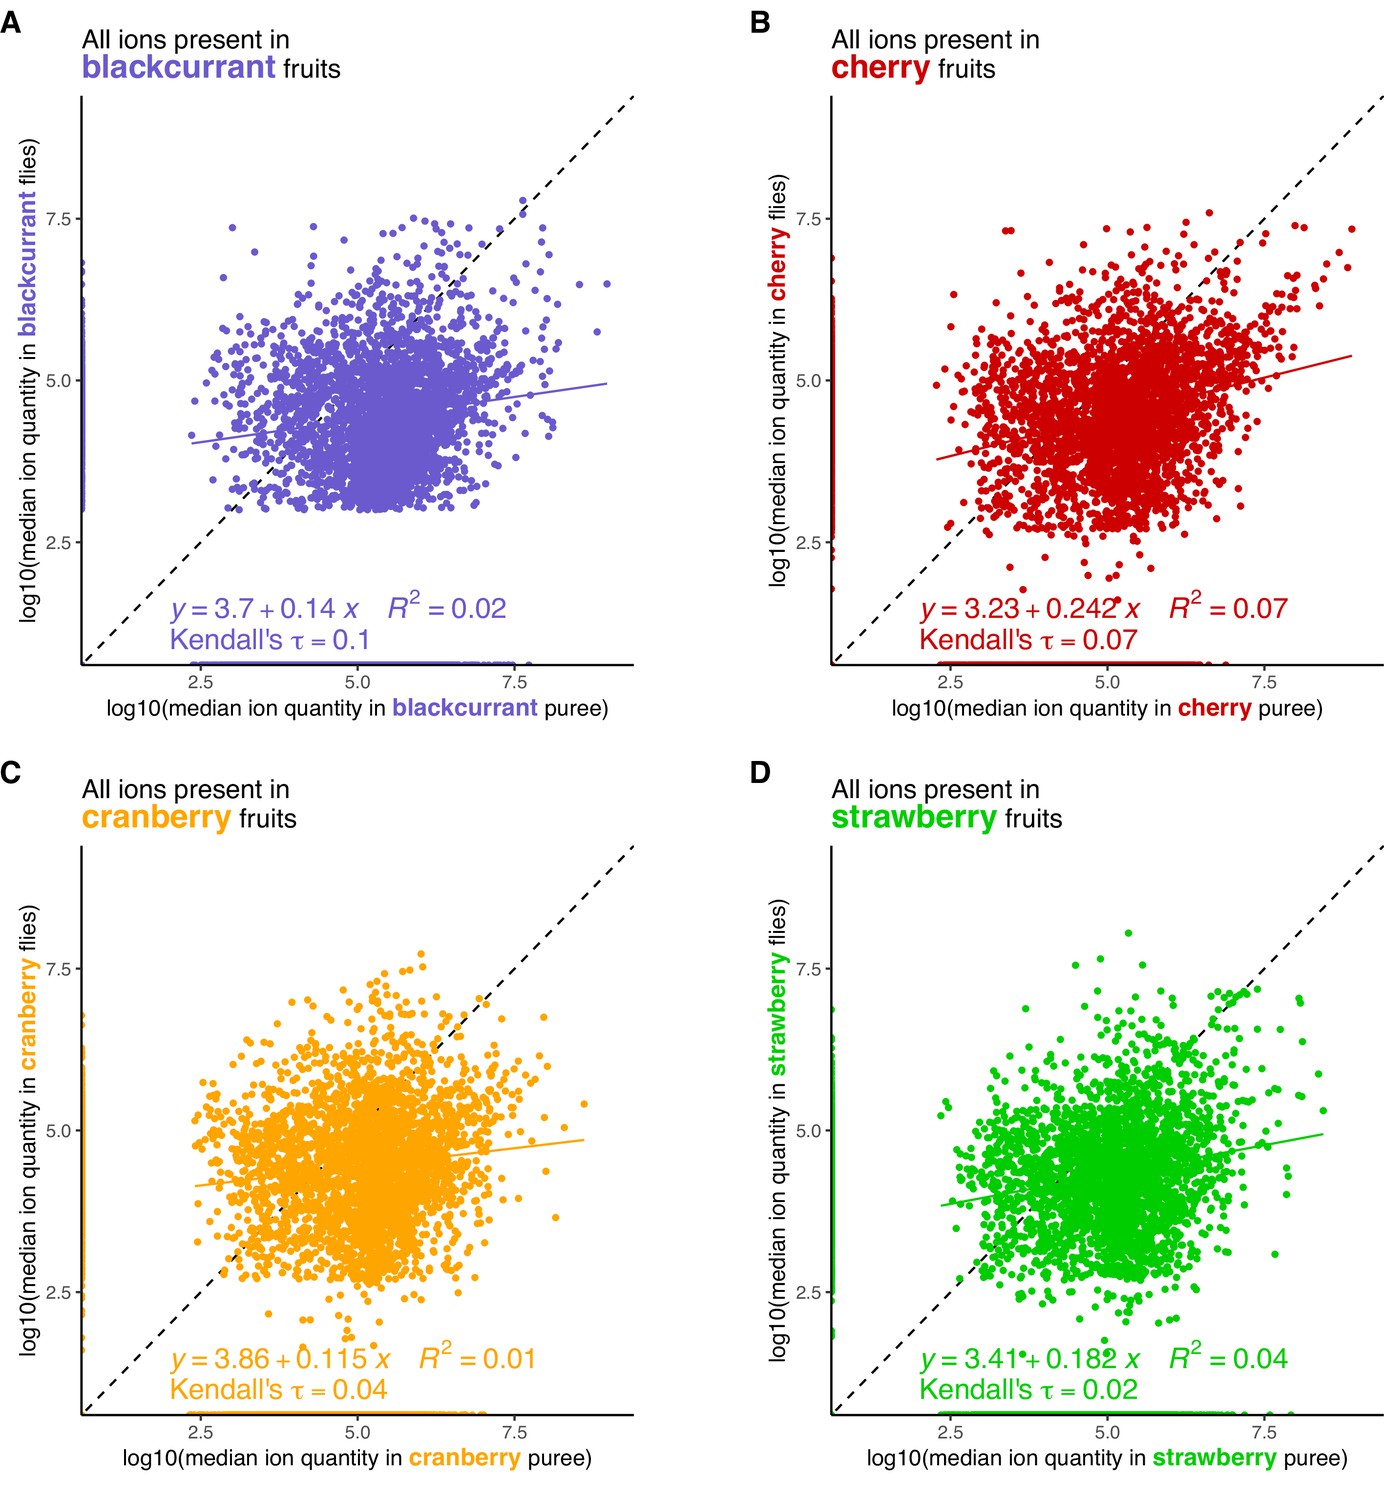
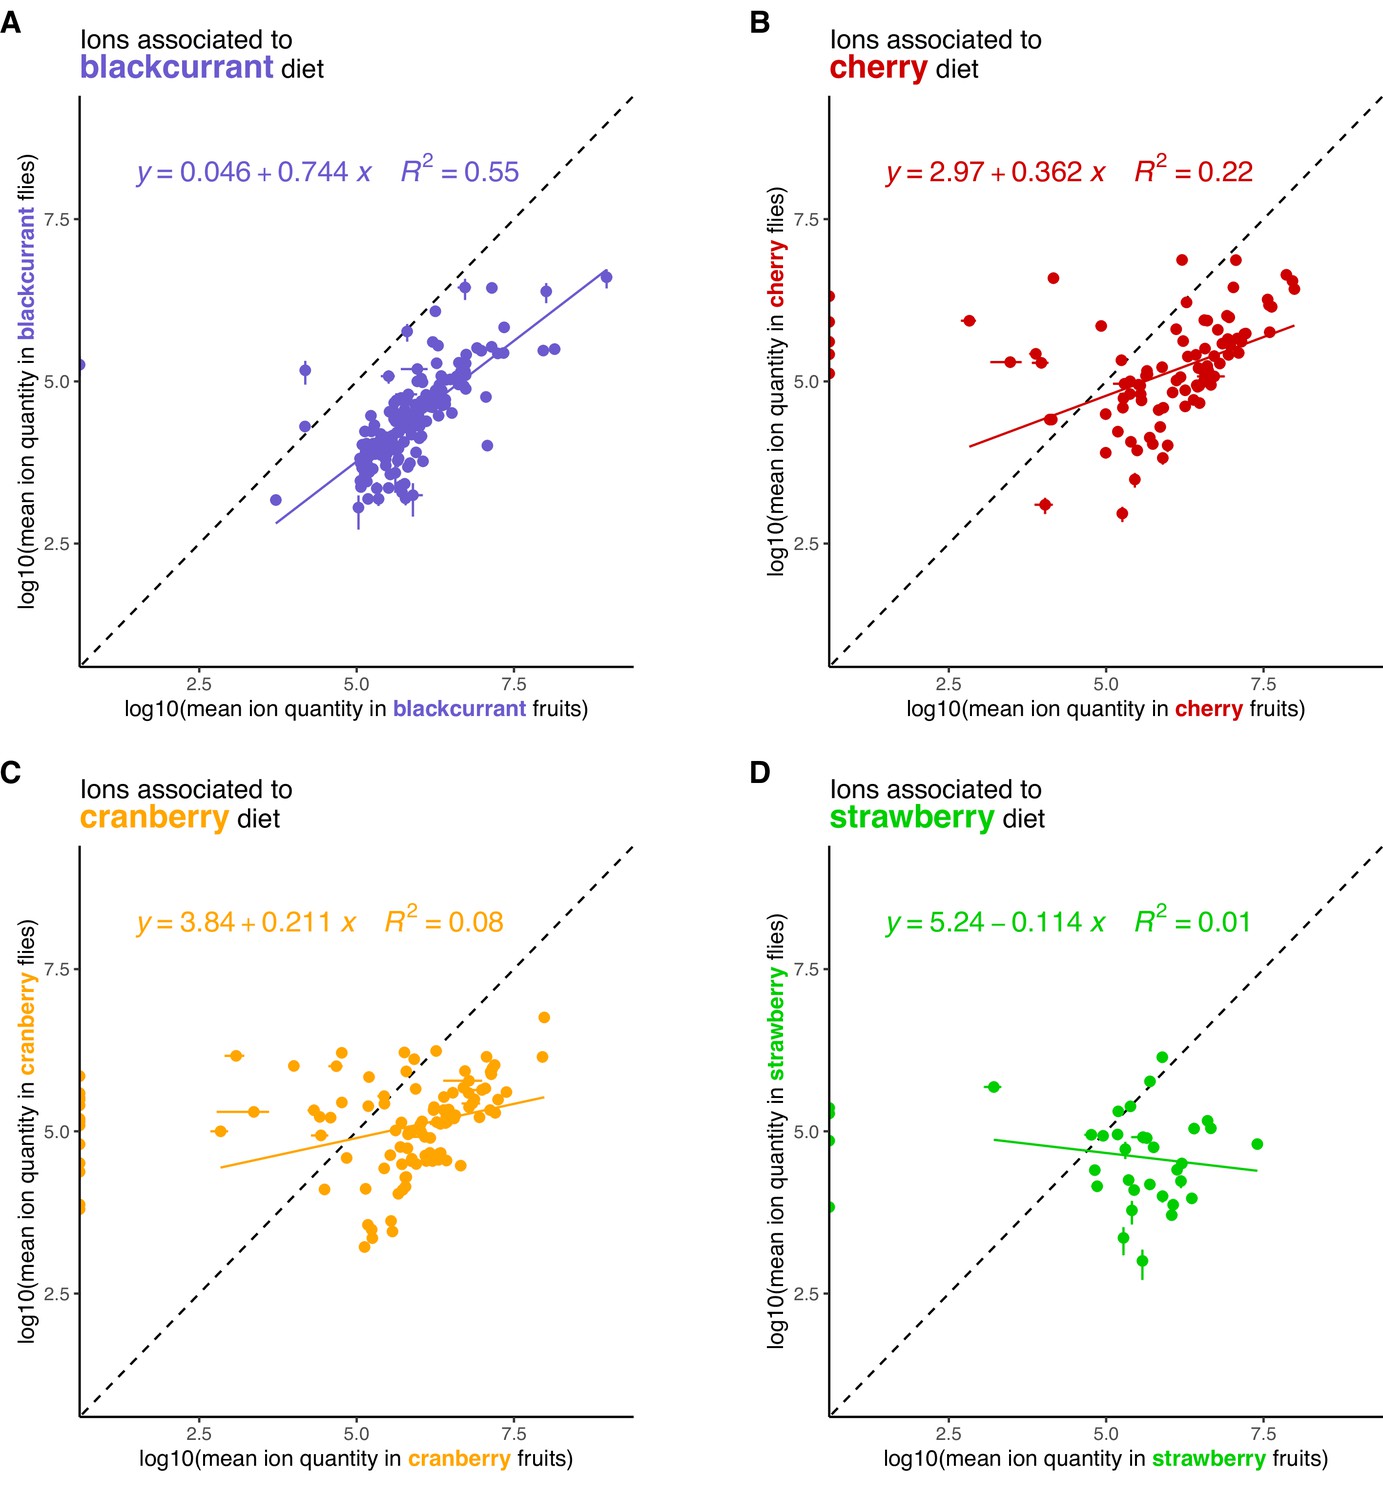
Relation between ion quantity in fruit vs. in flies that developed on the same fruit.
(A) Blackcurrant, (B) Cherry, (C) Cranberry, (D) Strawberry. Linear regression coefficients, R-square, and Kendall’s τ are indicated for each fruit-fly pair.
Figure 2
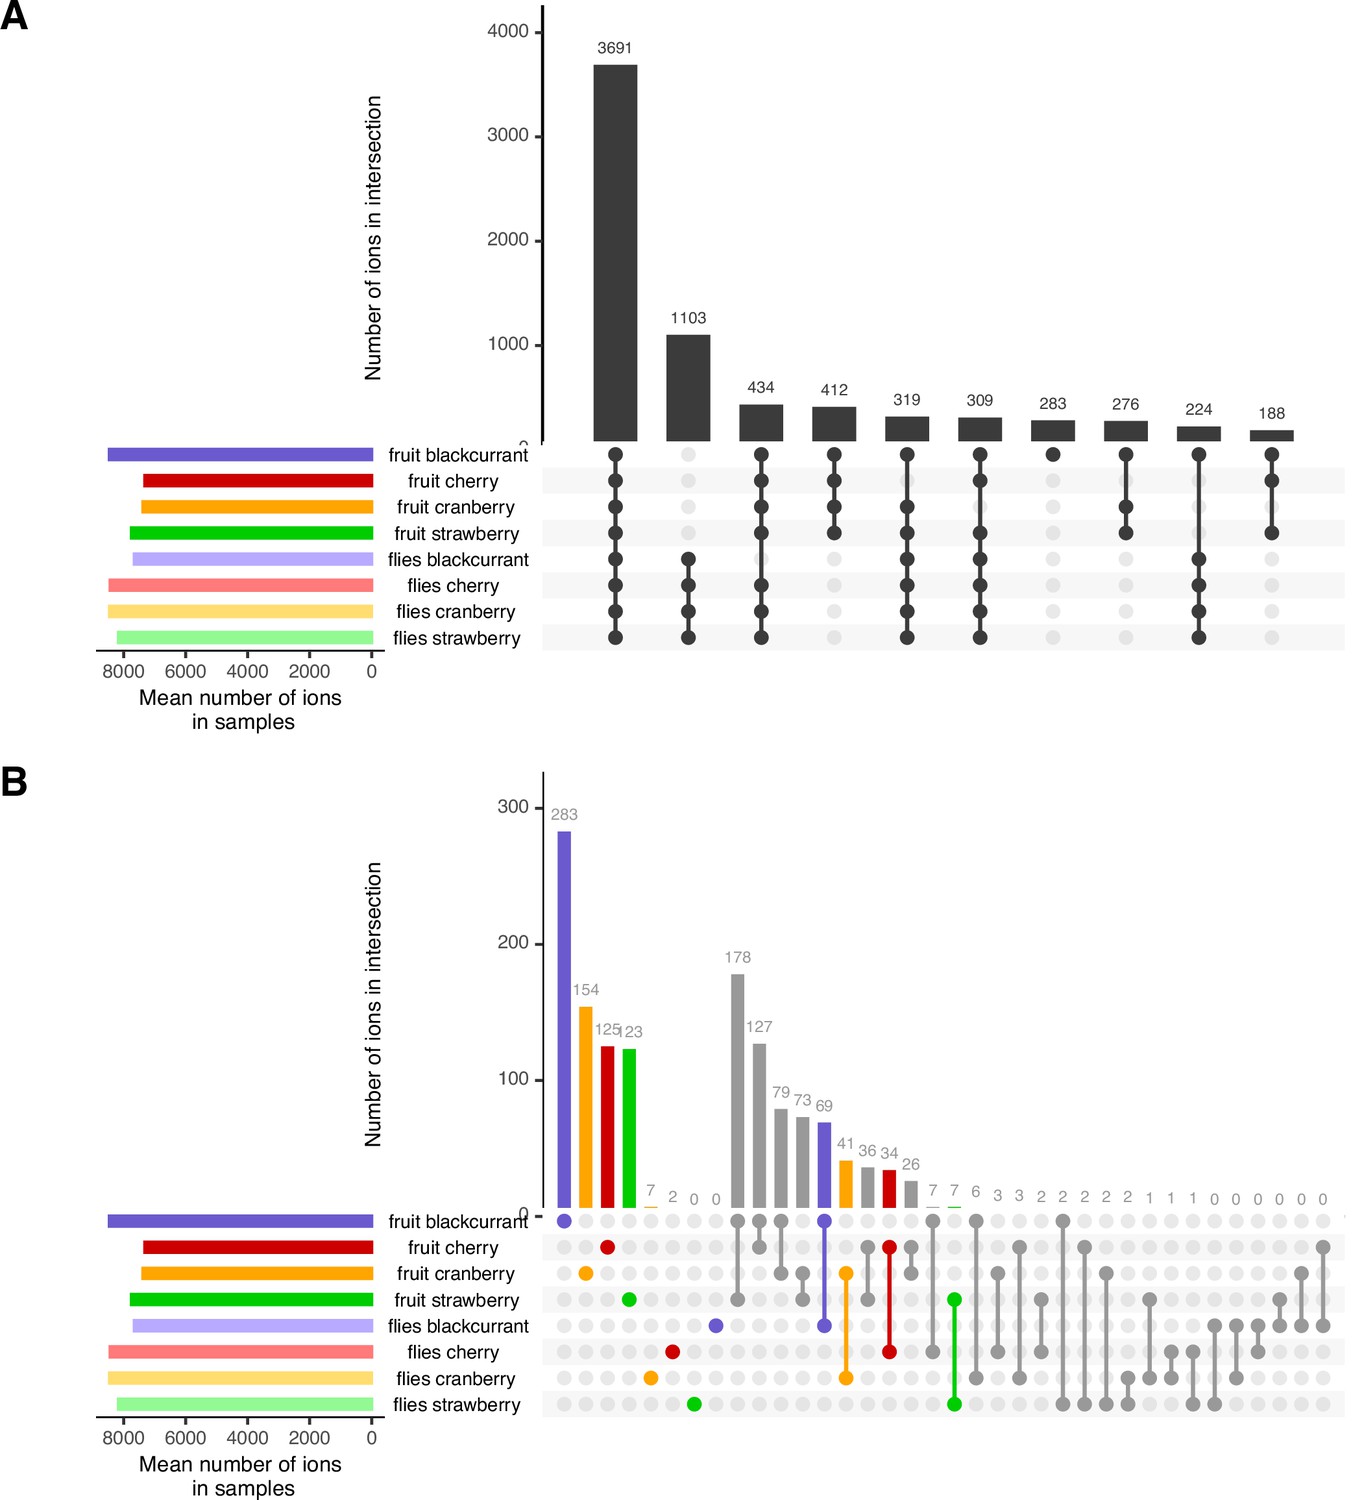
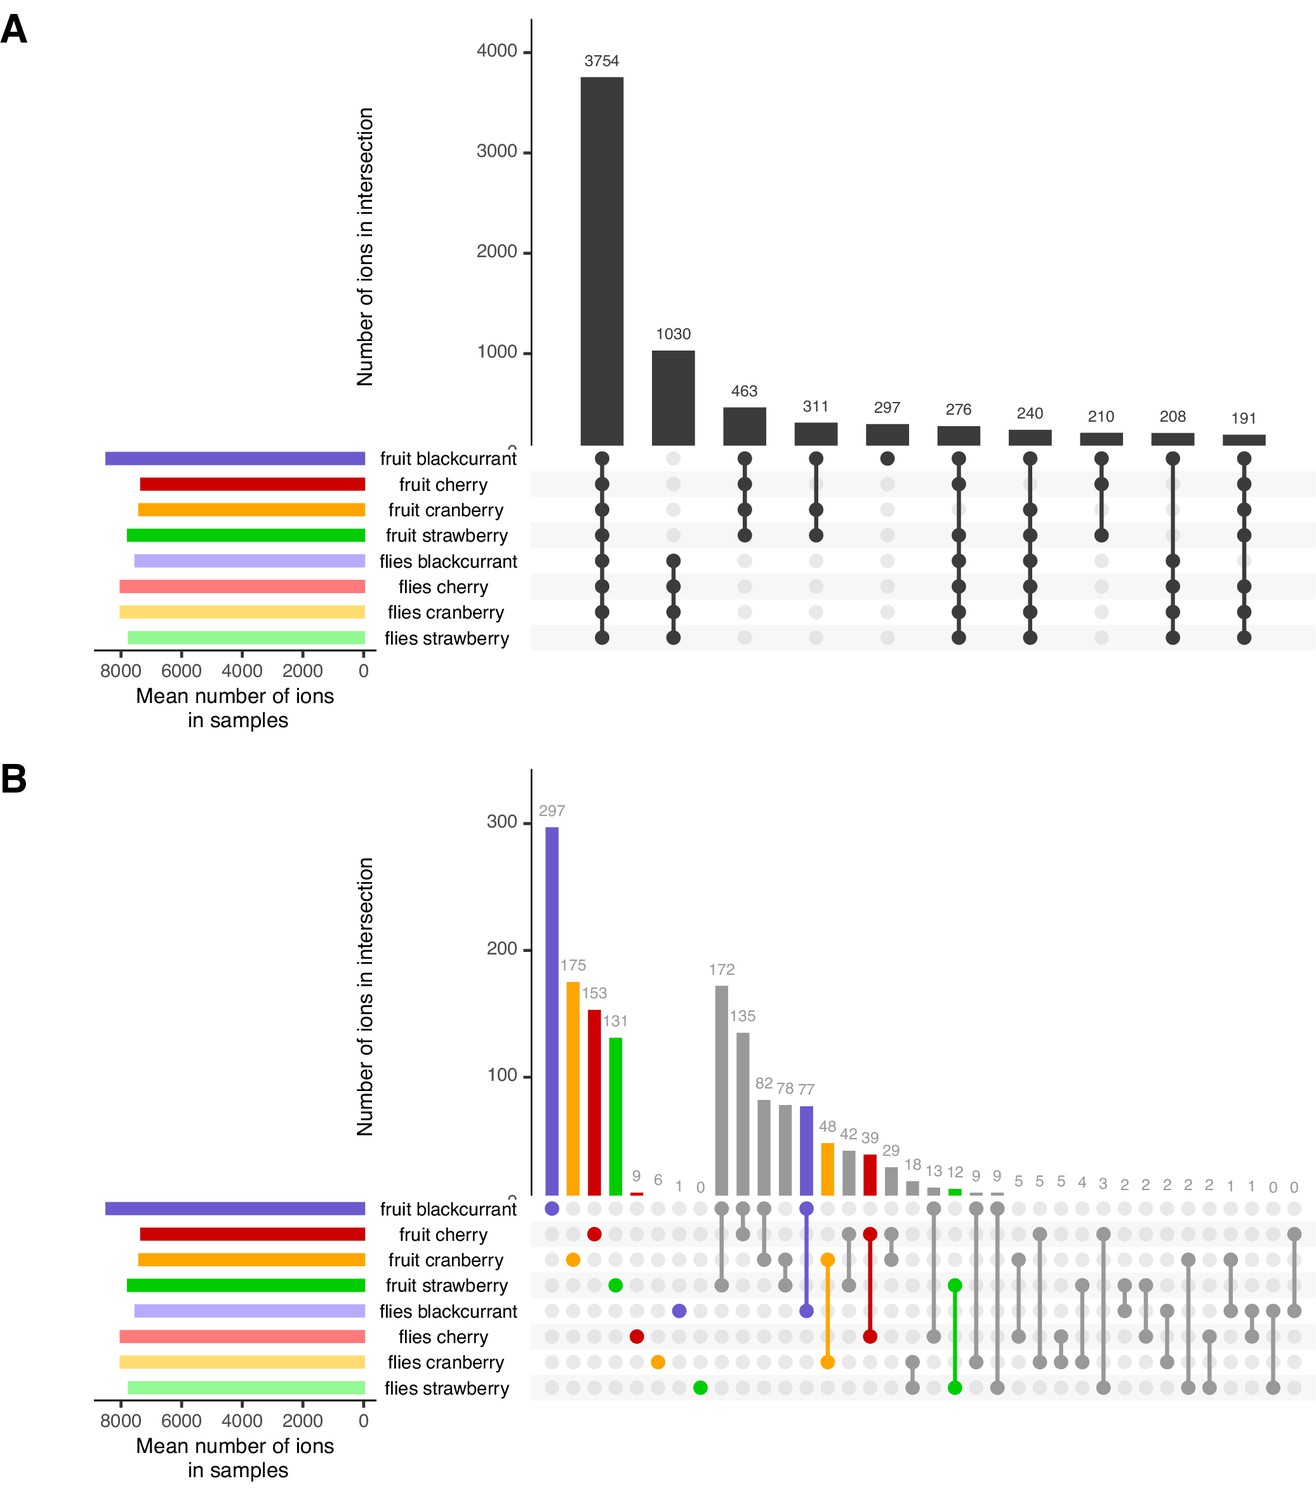
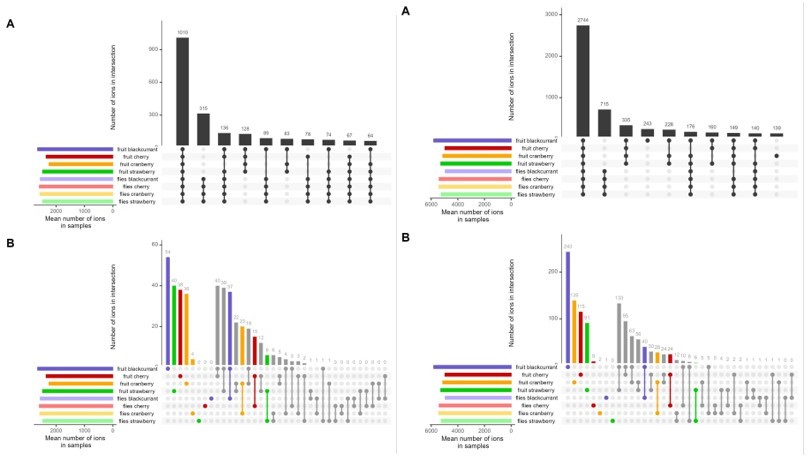
Overall trends of shared ions between all fruits and all flies.
(A) The ten largest intersections between all metabolomes comprise many high-degree intersections, including ions shared between all fruit and all flies’ samples (#1), ions, shared between all flies (#2) and ions shared between all fruits (#3). A notable exception to this pattern is the presence of ions found only in the blackcurrant fruits (#5). (B) A focus on ions unique to particular samples or sample pairs (i.e. intersections of degree 1 and 2, respectively) illustrate that, while ions unique to fruits are found in high numbers, ions unique to diet in flies are largely absent. Ions specific to a given fruit-flies pair are infrequent. See Figure 1C for expectations according to diet generalization hypotheses.
Figure 3 with 1 supplement
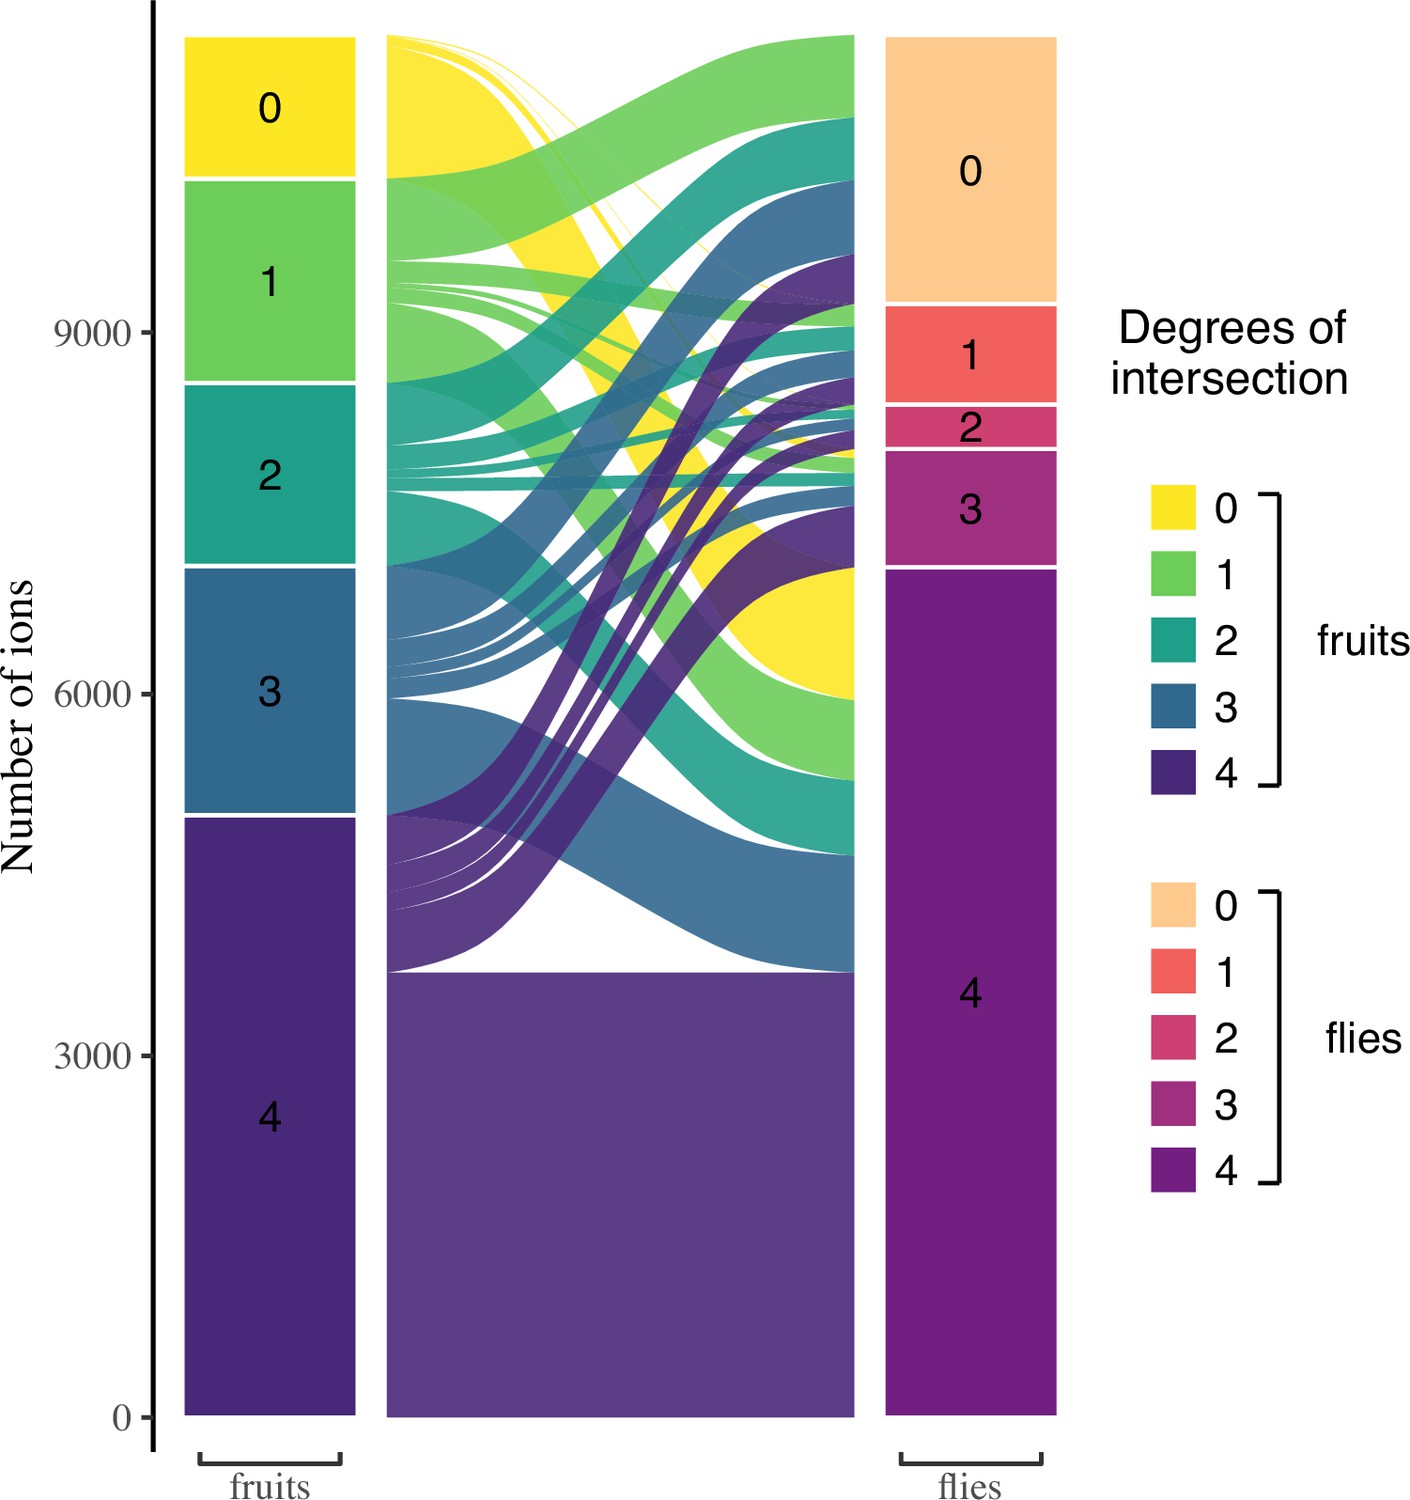
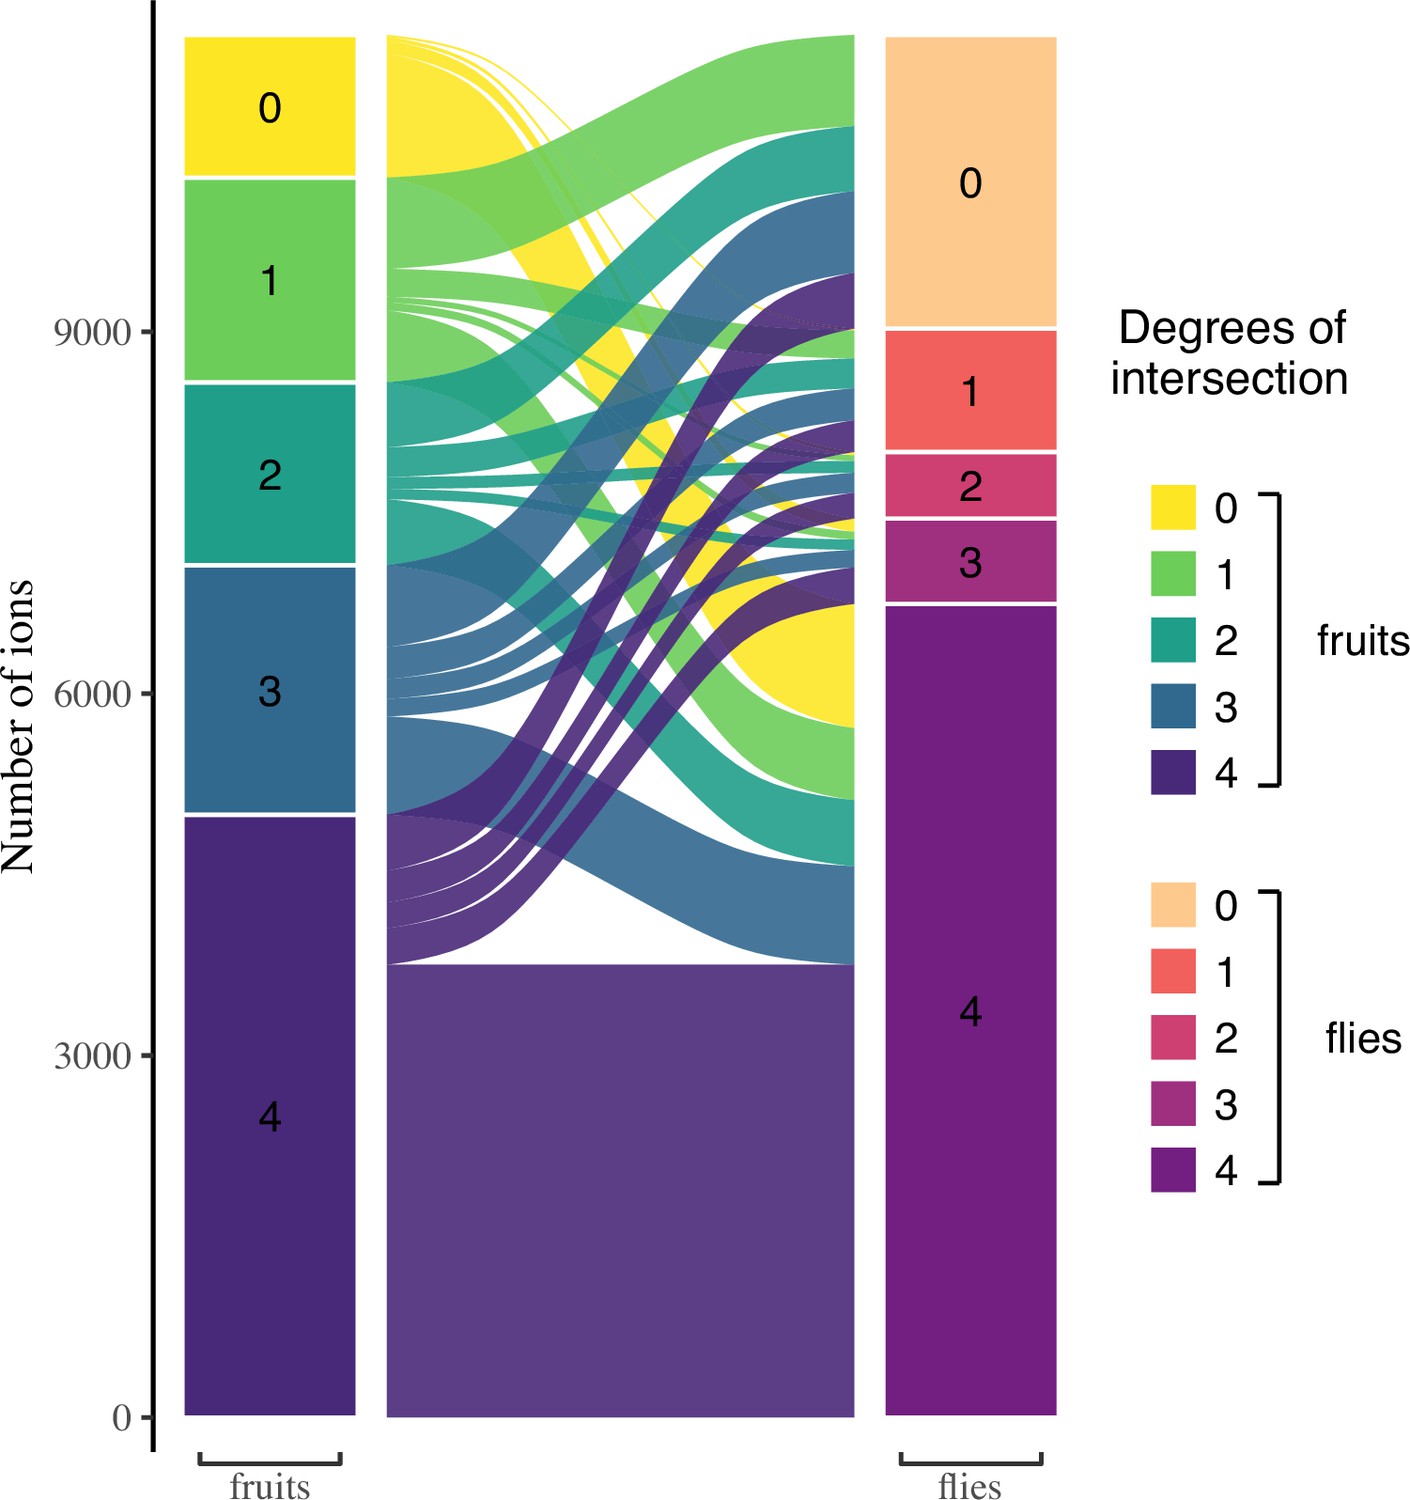
Relationships between ions respectively found in fruits and flies, according to their degree of intersection.
Ions that are shared within fruits or within flies show a higher degree of intersection. Most ions found in flies are found in all flies, but not necessarily in all fruits. It is also noteworthy that almost all ions produced de novo by flies are found in all flies, regardless of their diet. See Figure 1E for expectations according to diet generalization hypotheses.
Figure 3—figure supplement 1
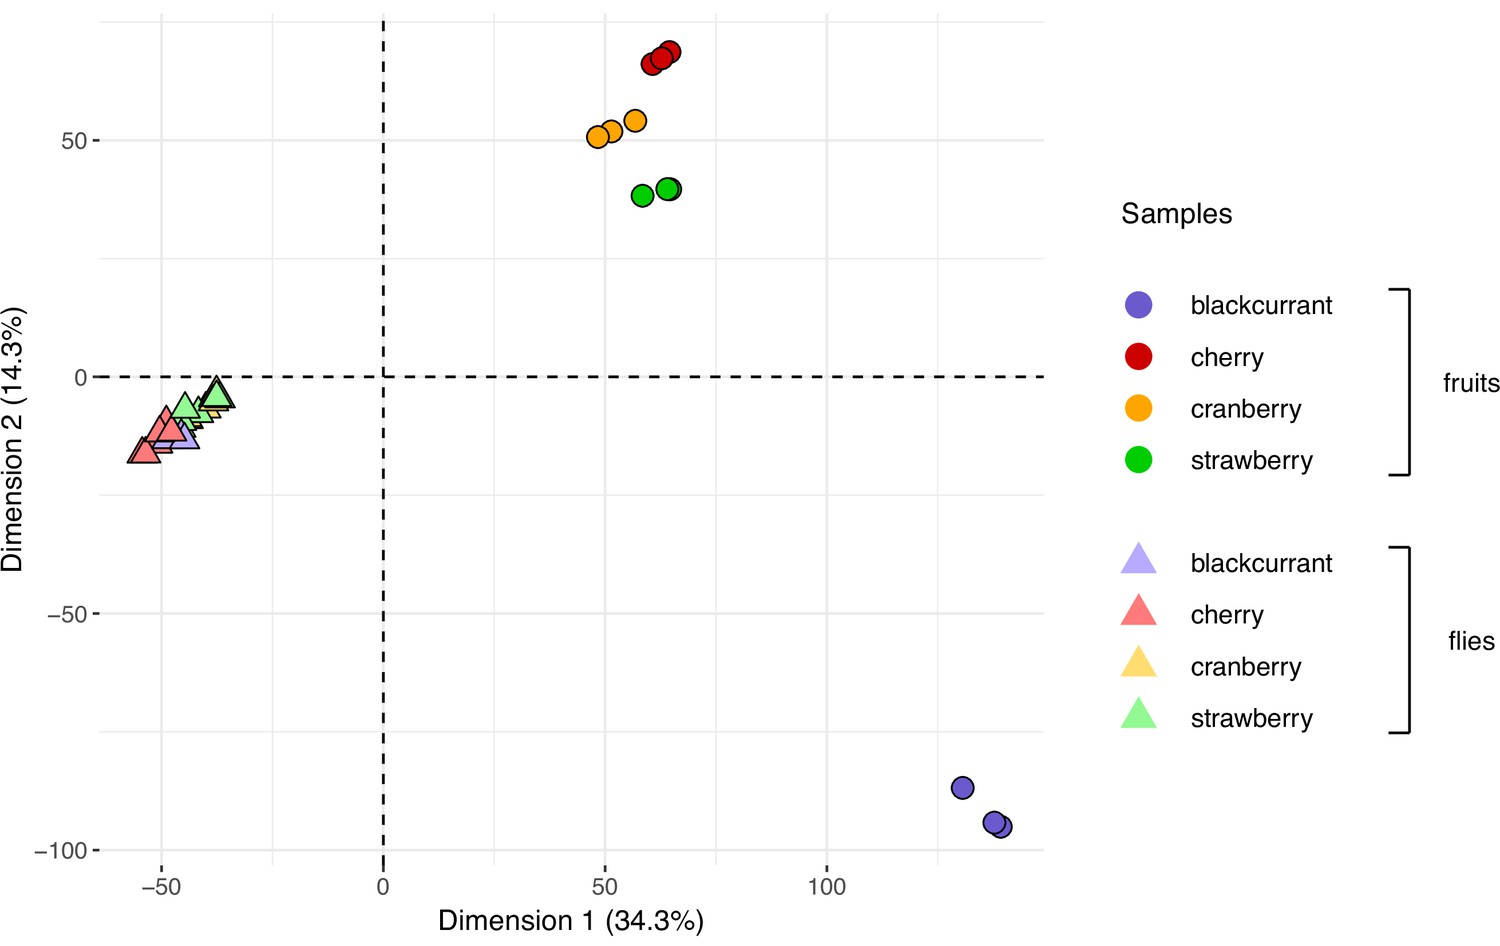
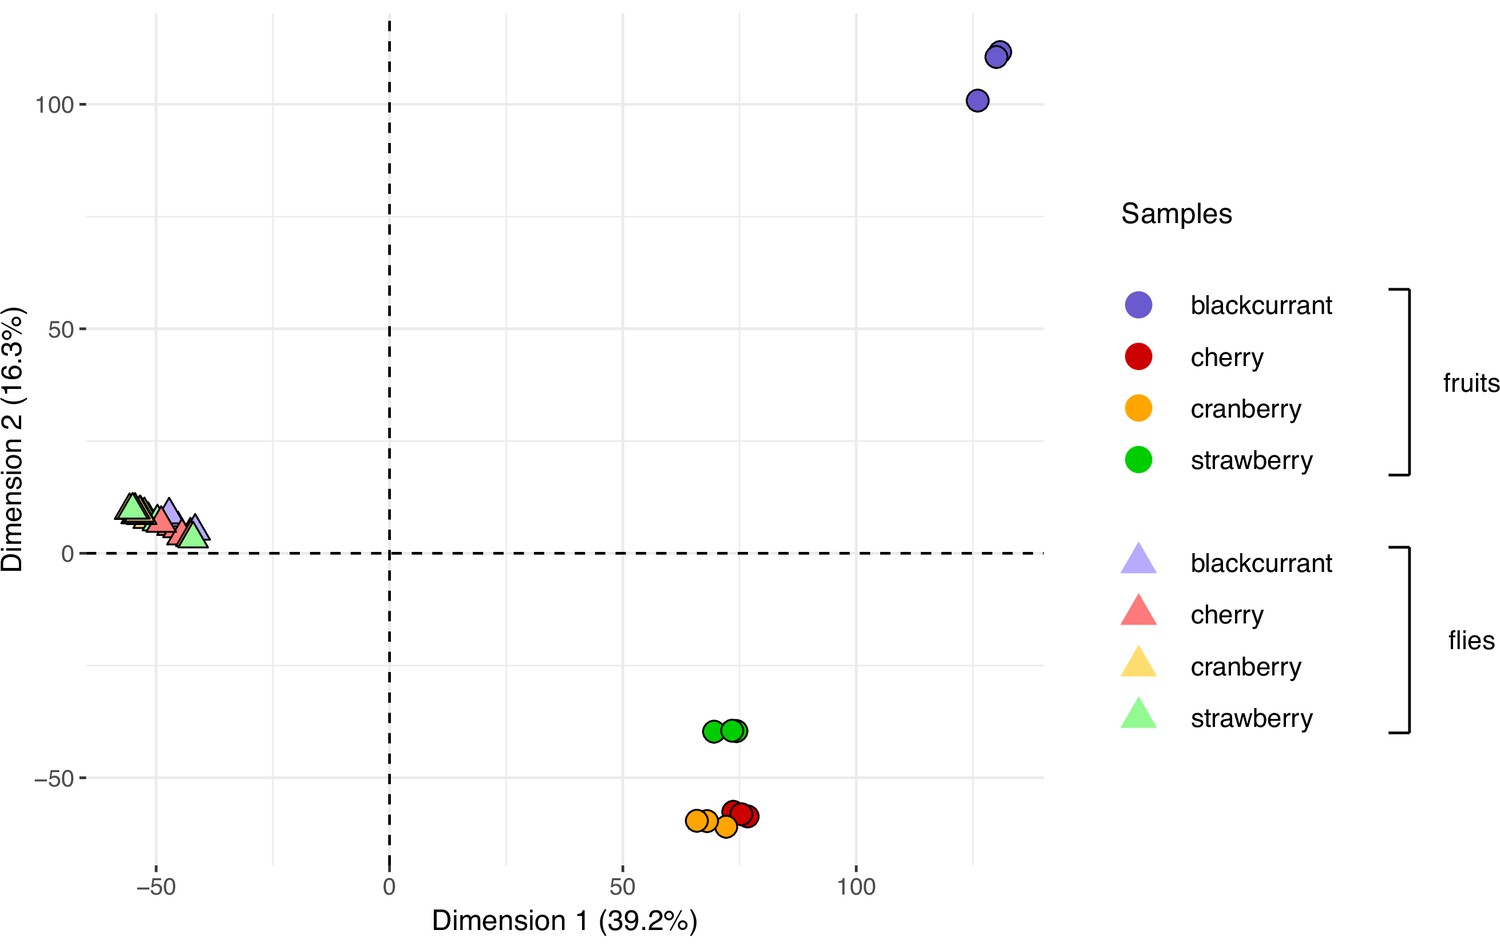
Fruits and flies’ metabolomes cluster separately and do not form pairs.
Fruit and fly samples in this overall principal component analysis (PCA) are represented by dots and triangles, respectively. Colors represent different fruits or diets in the case of flies. All flies’ samples cluster together and away from fruits, regardless of their diets. See Figure 1G for expectations according to diet generalization hypotheses.
Figure 4 with 7 supplements
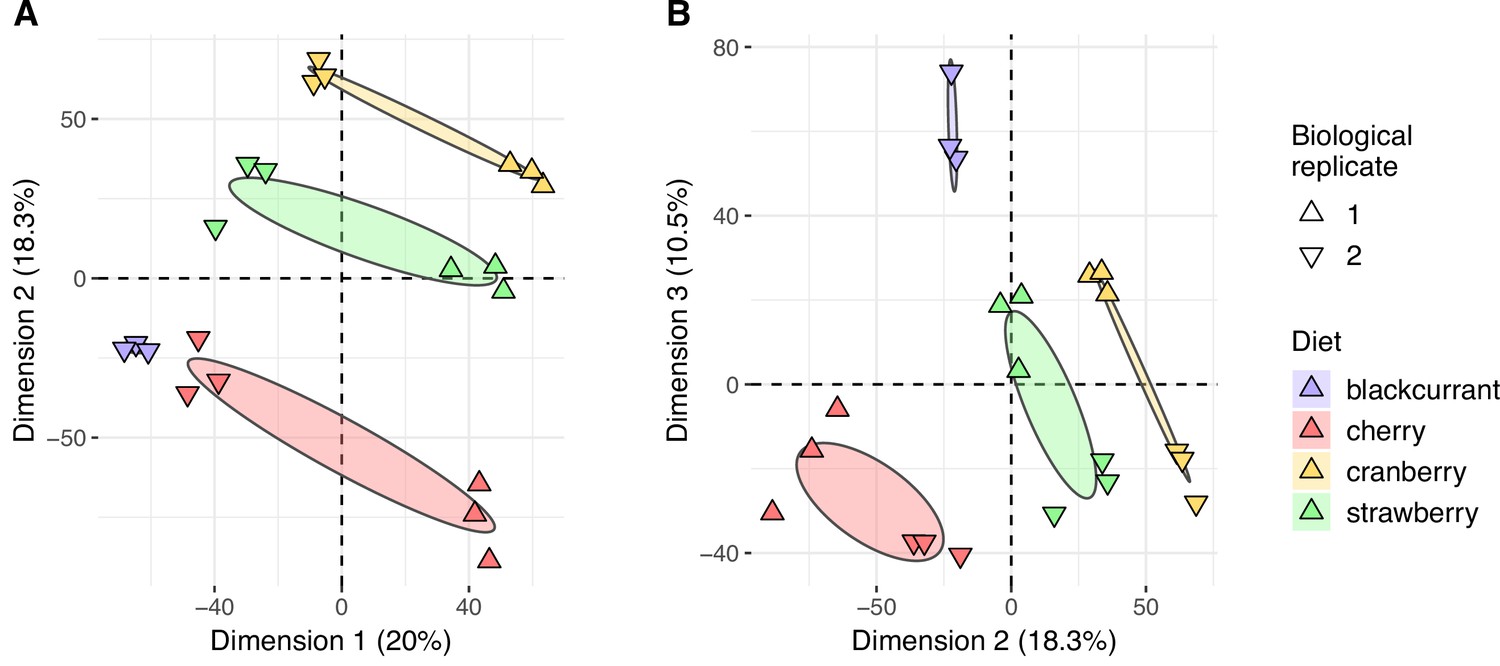
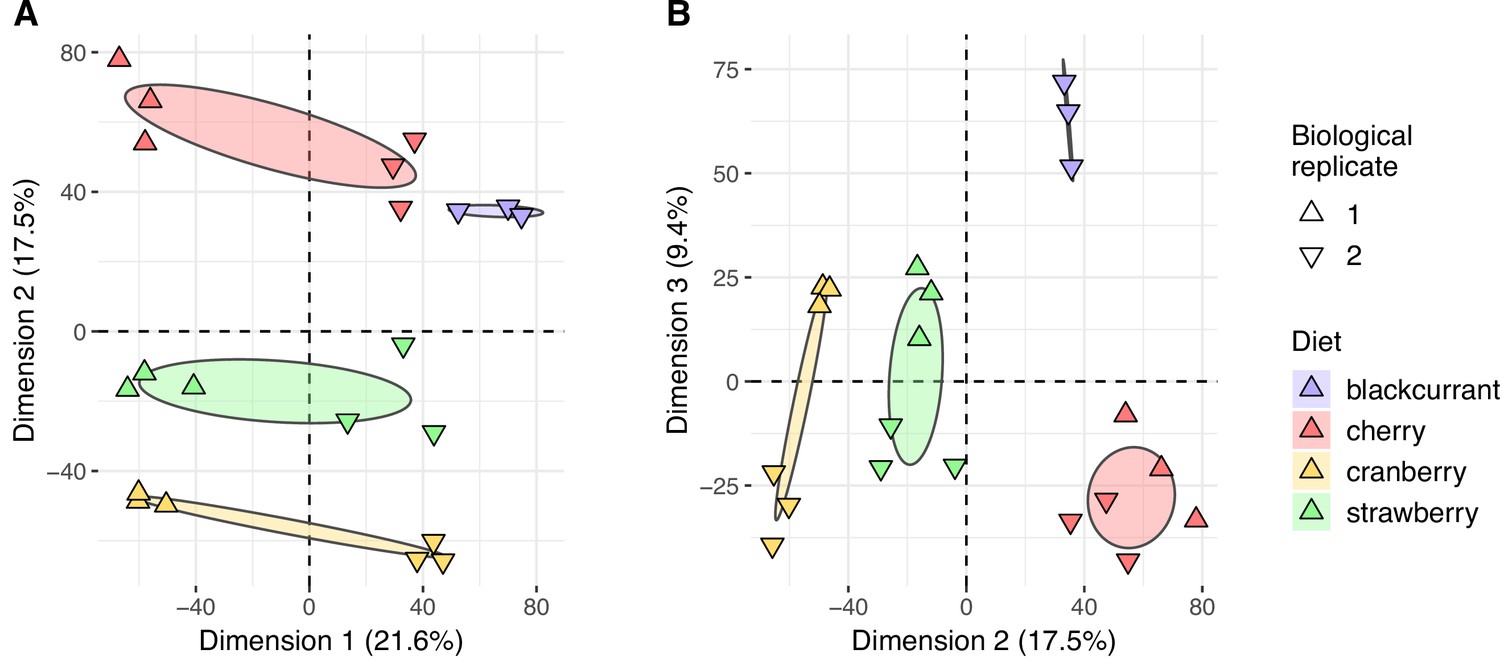
Flies’ metabolomes differ according to diet.
Flies’ samples only were included in this principal component analysis (PCA). Differently oriented triangles indicate biological replicates (fly generations). (A) Dimensions 1 and 2; (B) Dimensions 2 and 3.
Figure 4—figure supplement 1
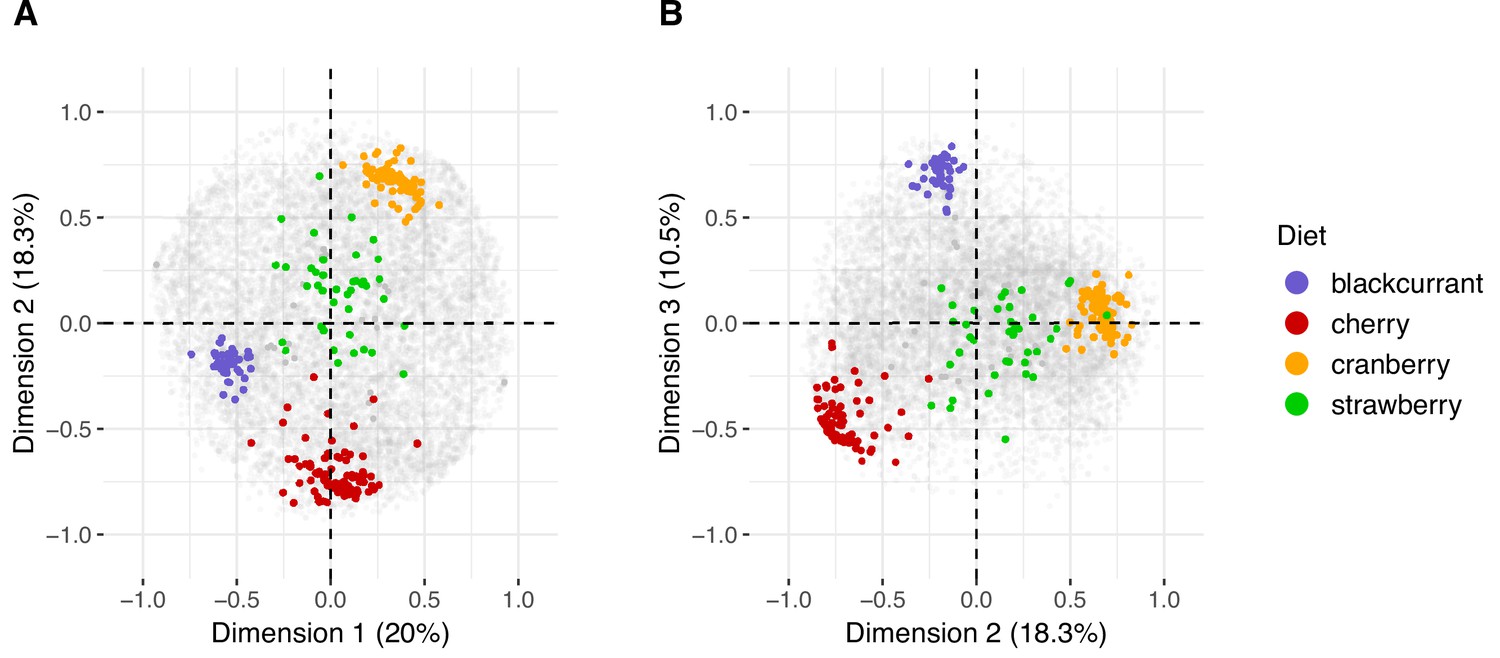
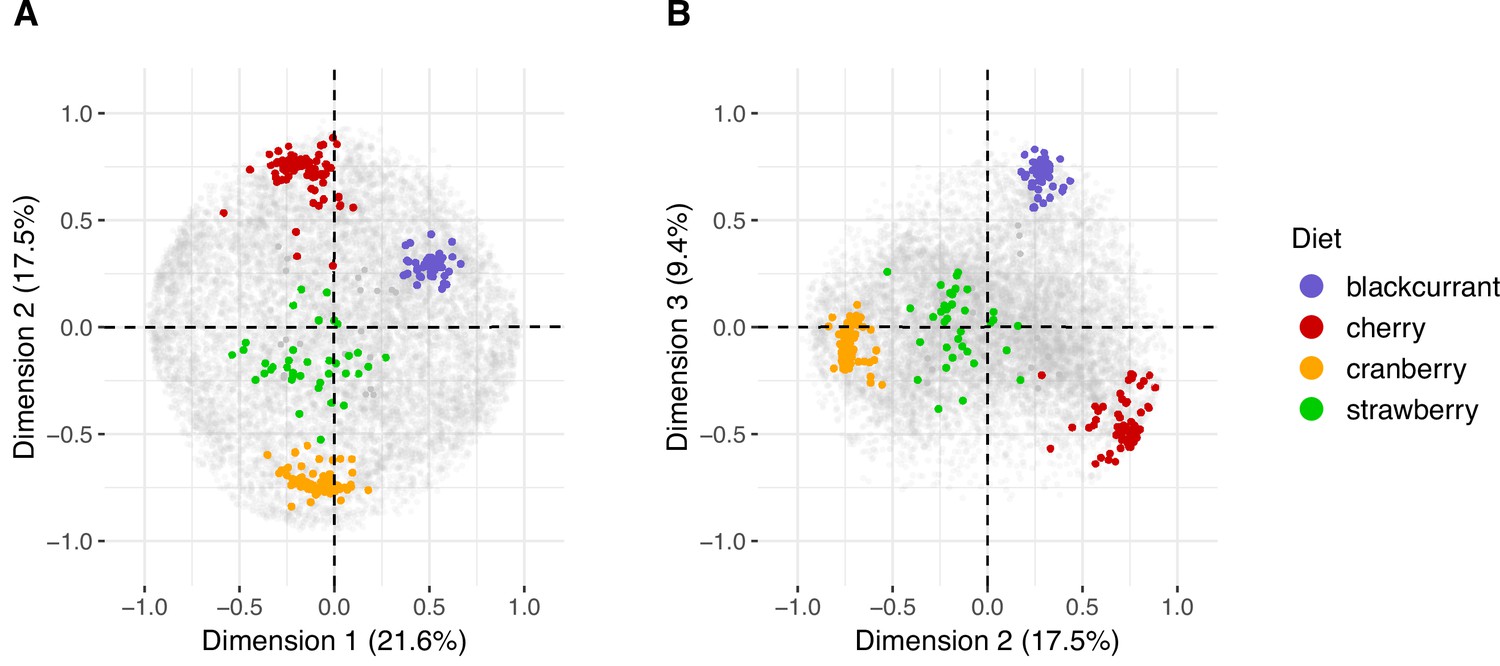
Plots of all individual ions of the principal component analysis of fruit metabolomes.
(A) Dimension 1 vs. dimension 2, and (B) dimension 2 vs. dimension 3. Fruit-specific ions are indicated in color, all other ions are indicated in gray.
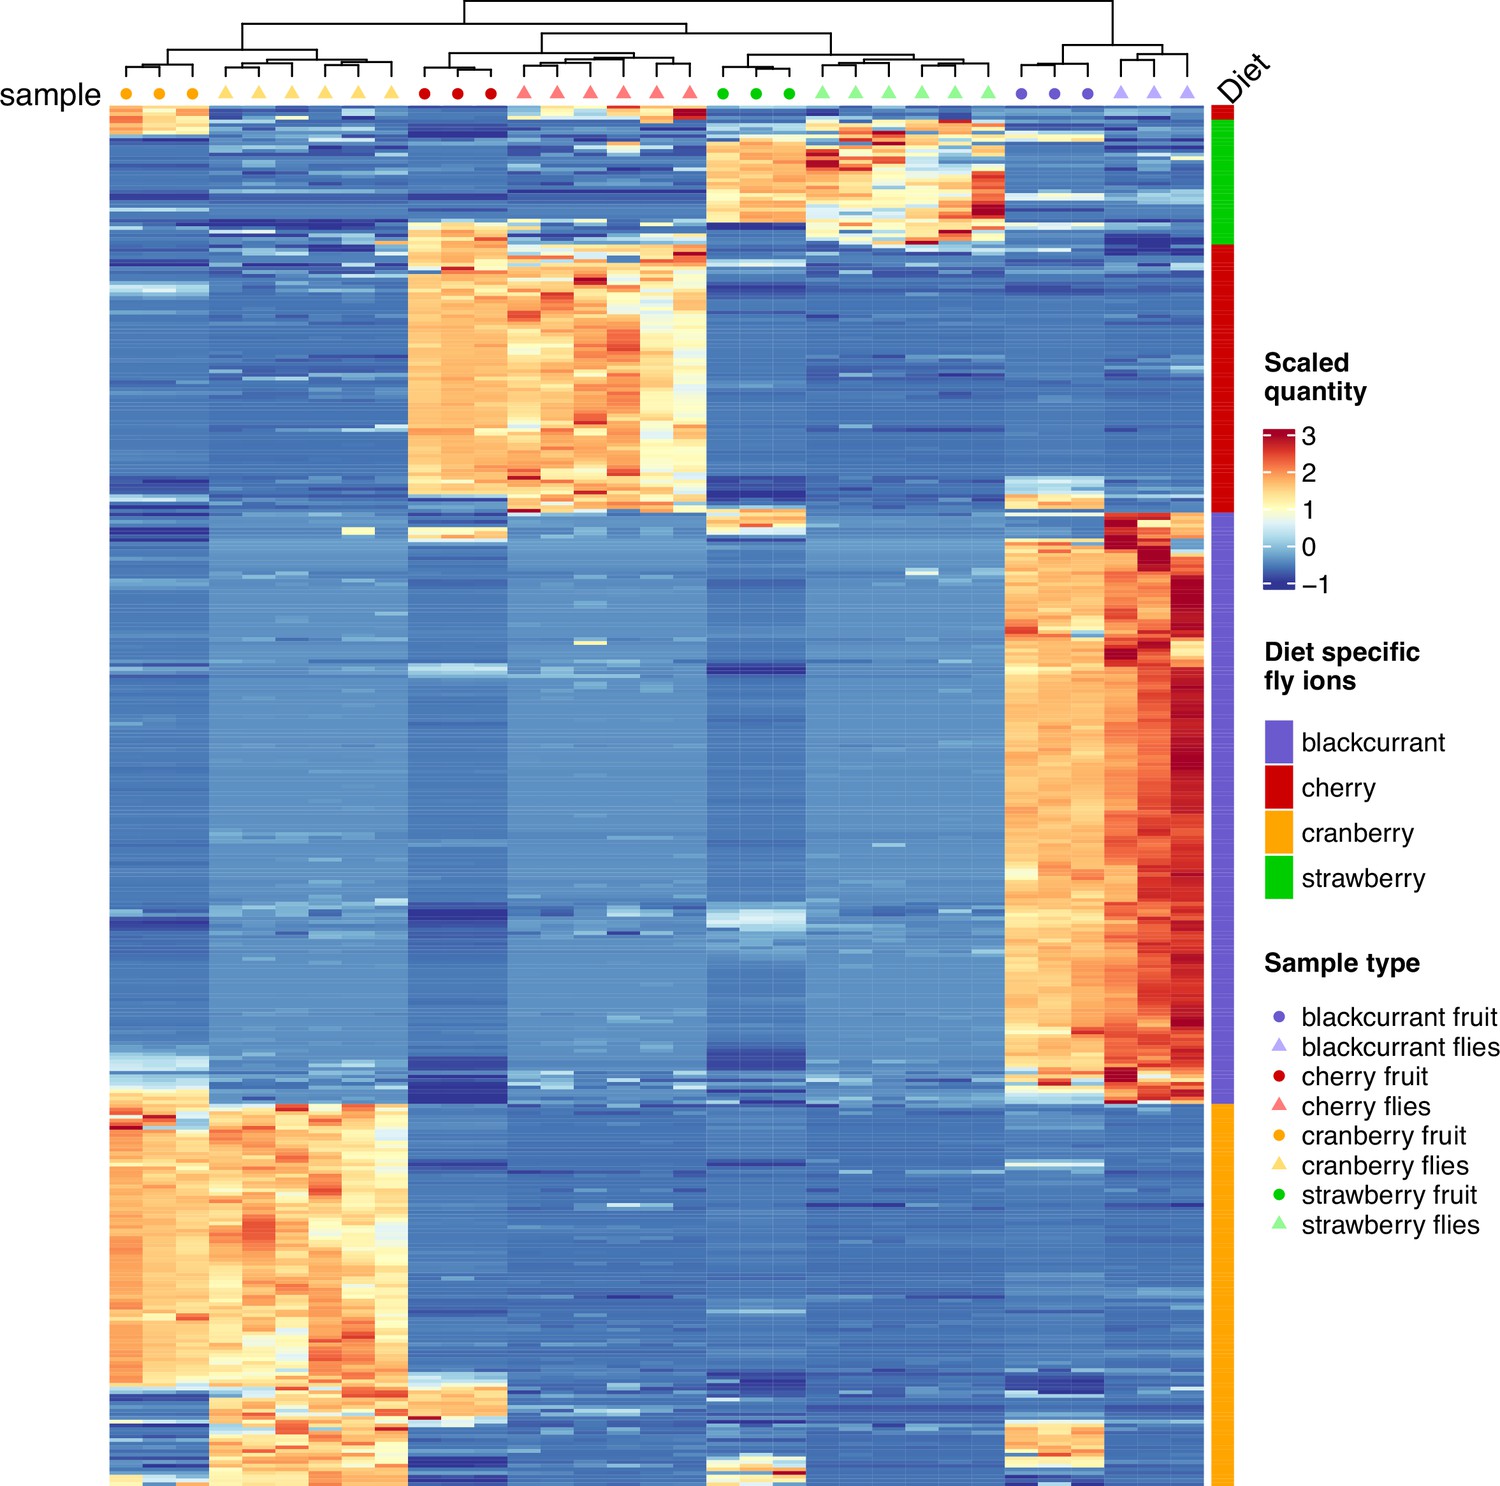
Figure 4—figure supplement 2
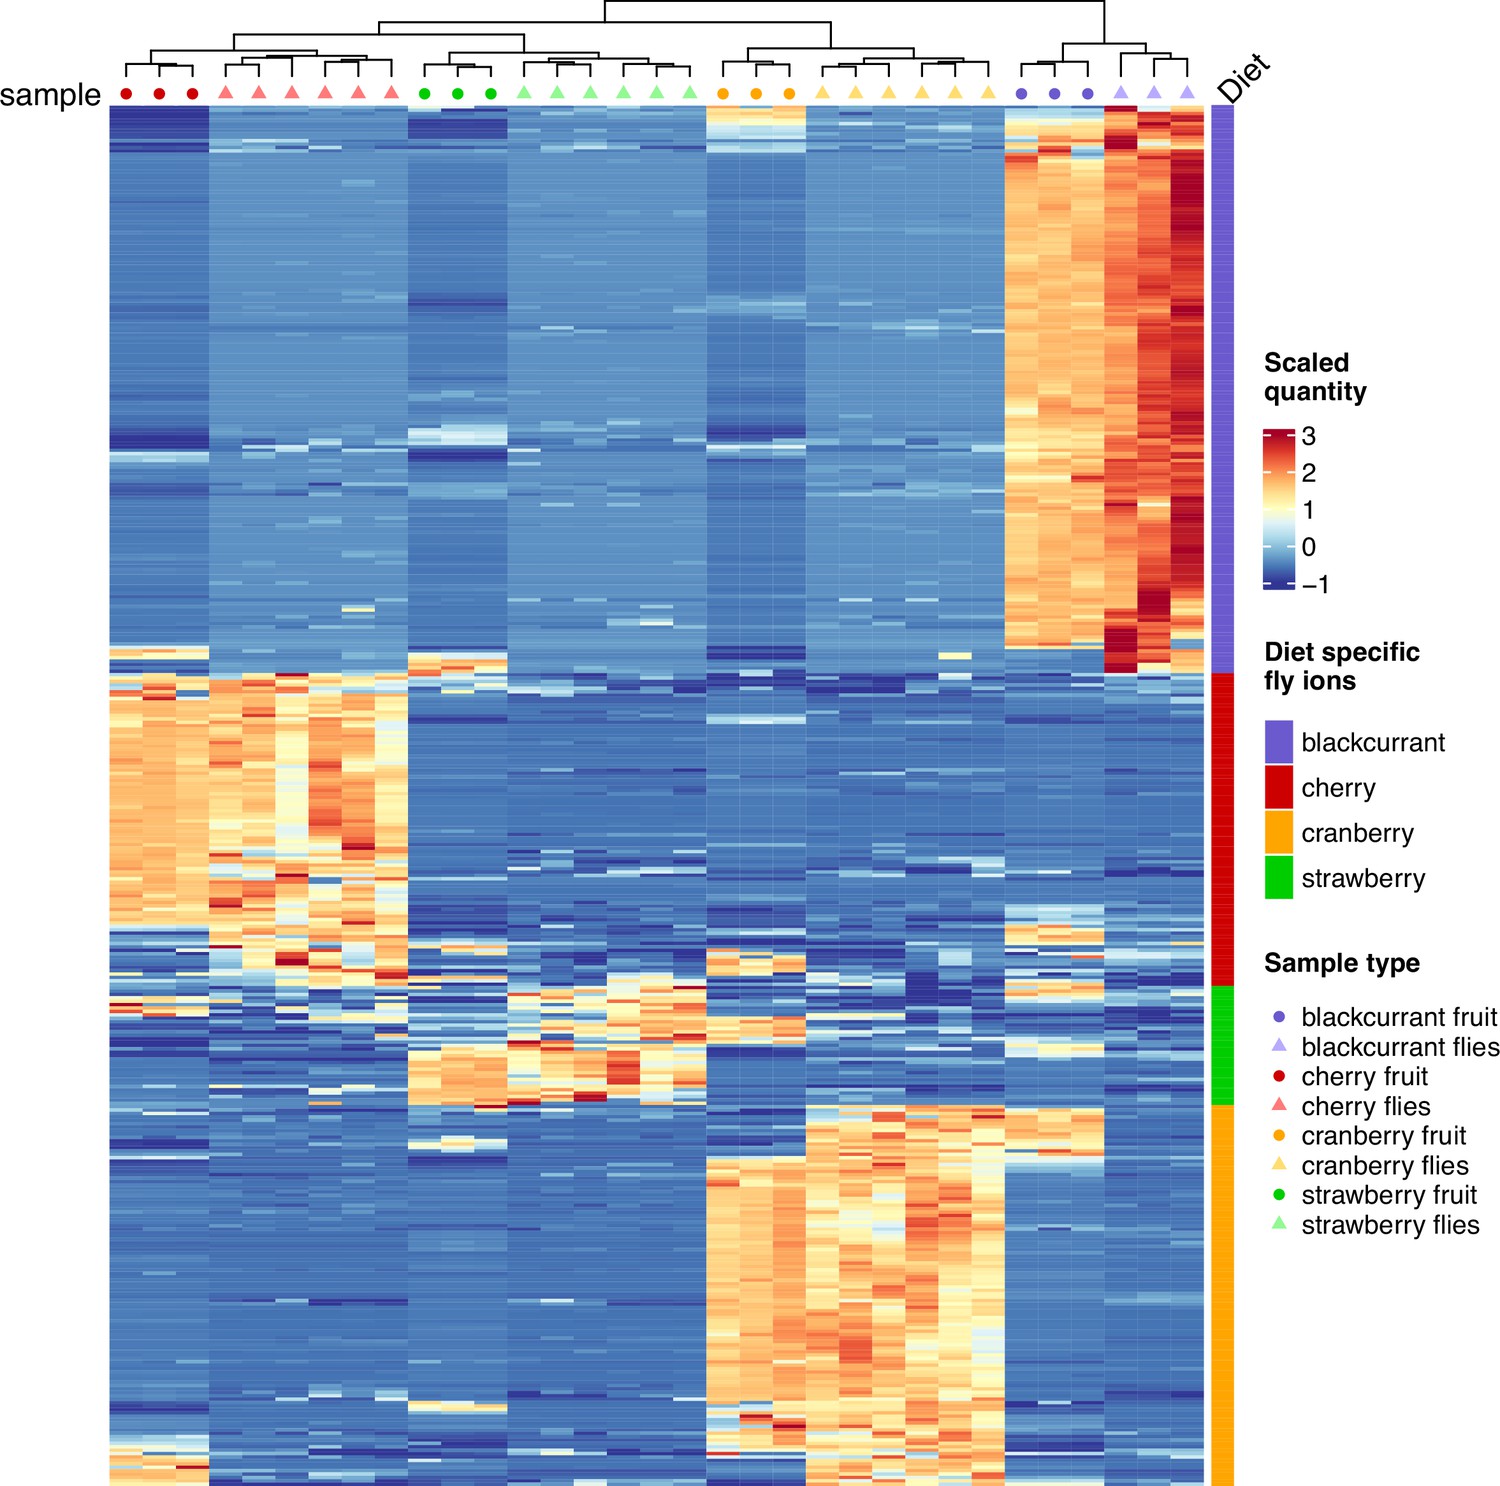
Classification of fruit and fly samples following selection of diet-specific ions through GLM with Elastic Net regularization.
Heatmap scale colors indicate the relative quantity of each ion (row) of the ‘large’ list of diet-specific ions (specificity indicated by discrete colors; see main text for details).
Figure 4—figure supplement 3
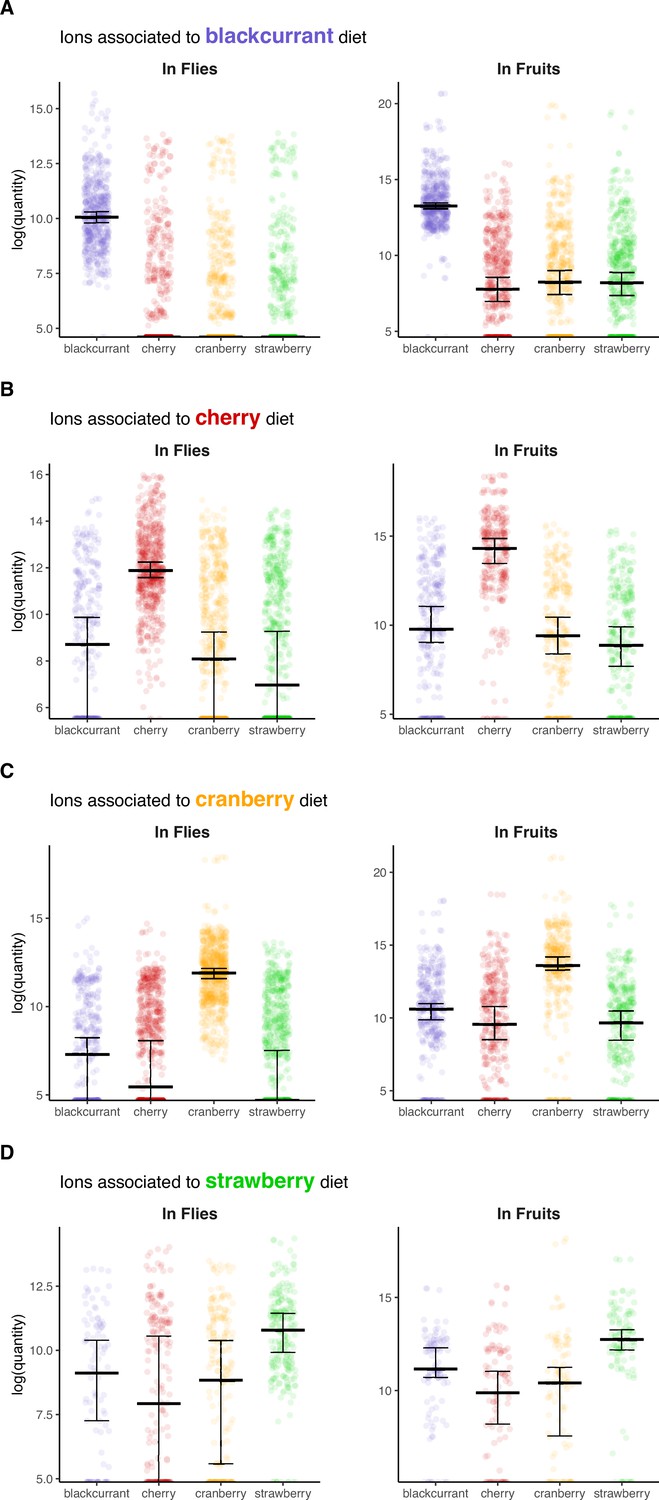
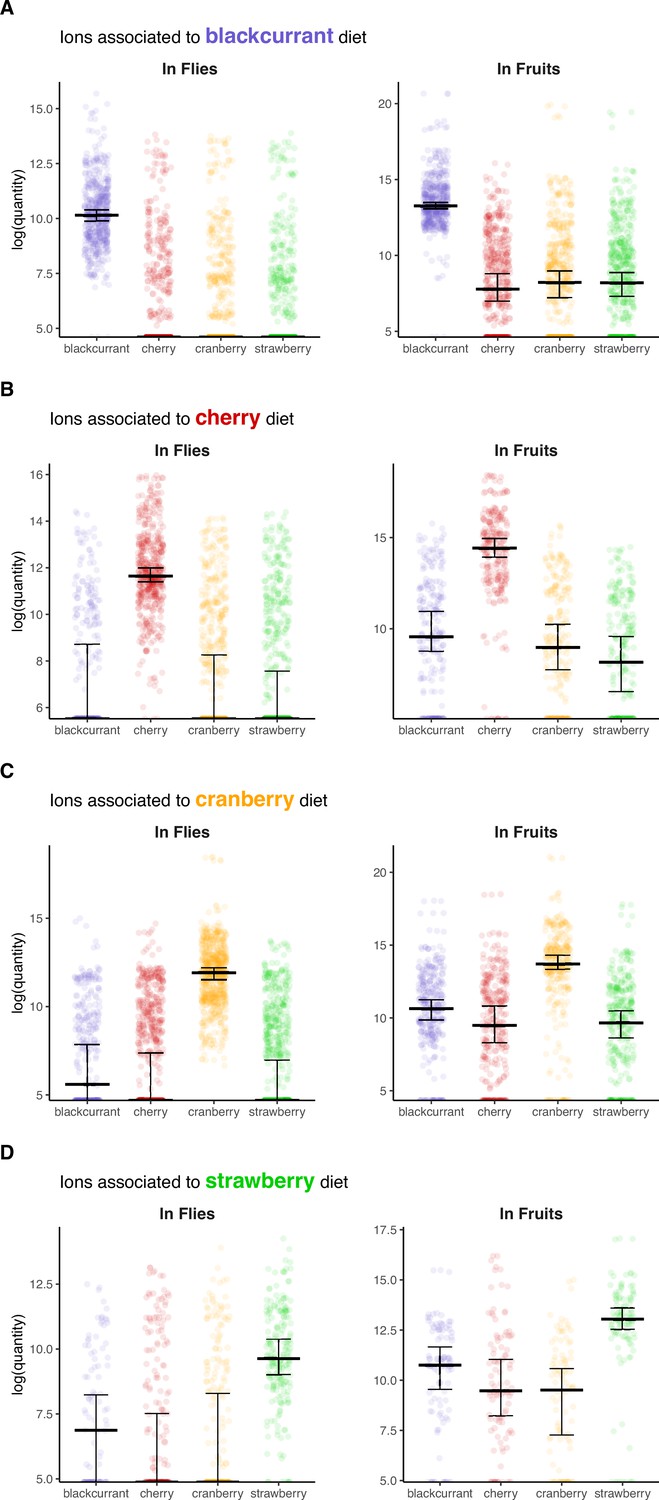
Quantitative levels of diet-specific fly ions in flies and fruits.
(A) Blackcurrant, (B) Cherry, (C) Cranberry, (D) Strawberry. Medians and their confidence intervals are represented by black bars.
Figure 4—figure supplement 4
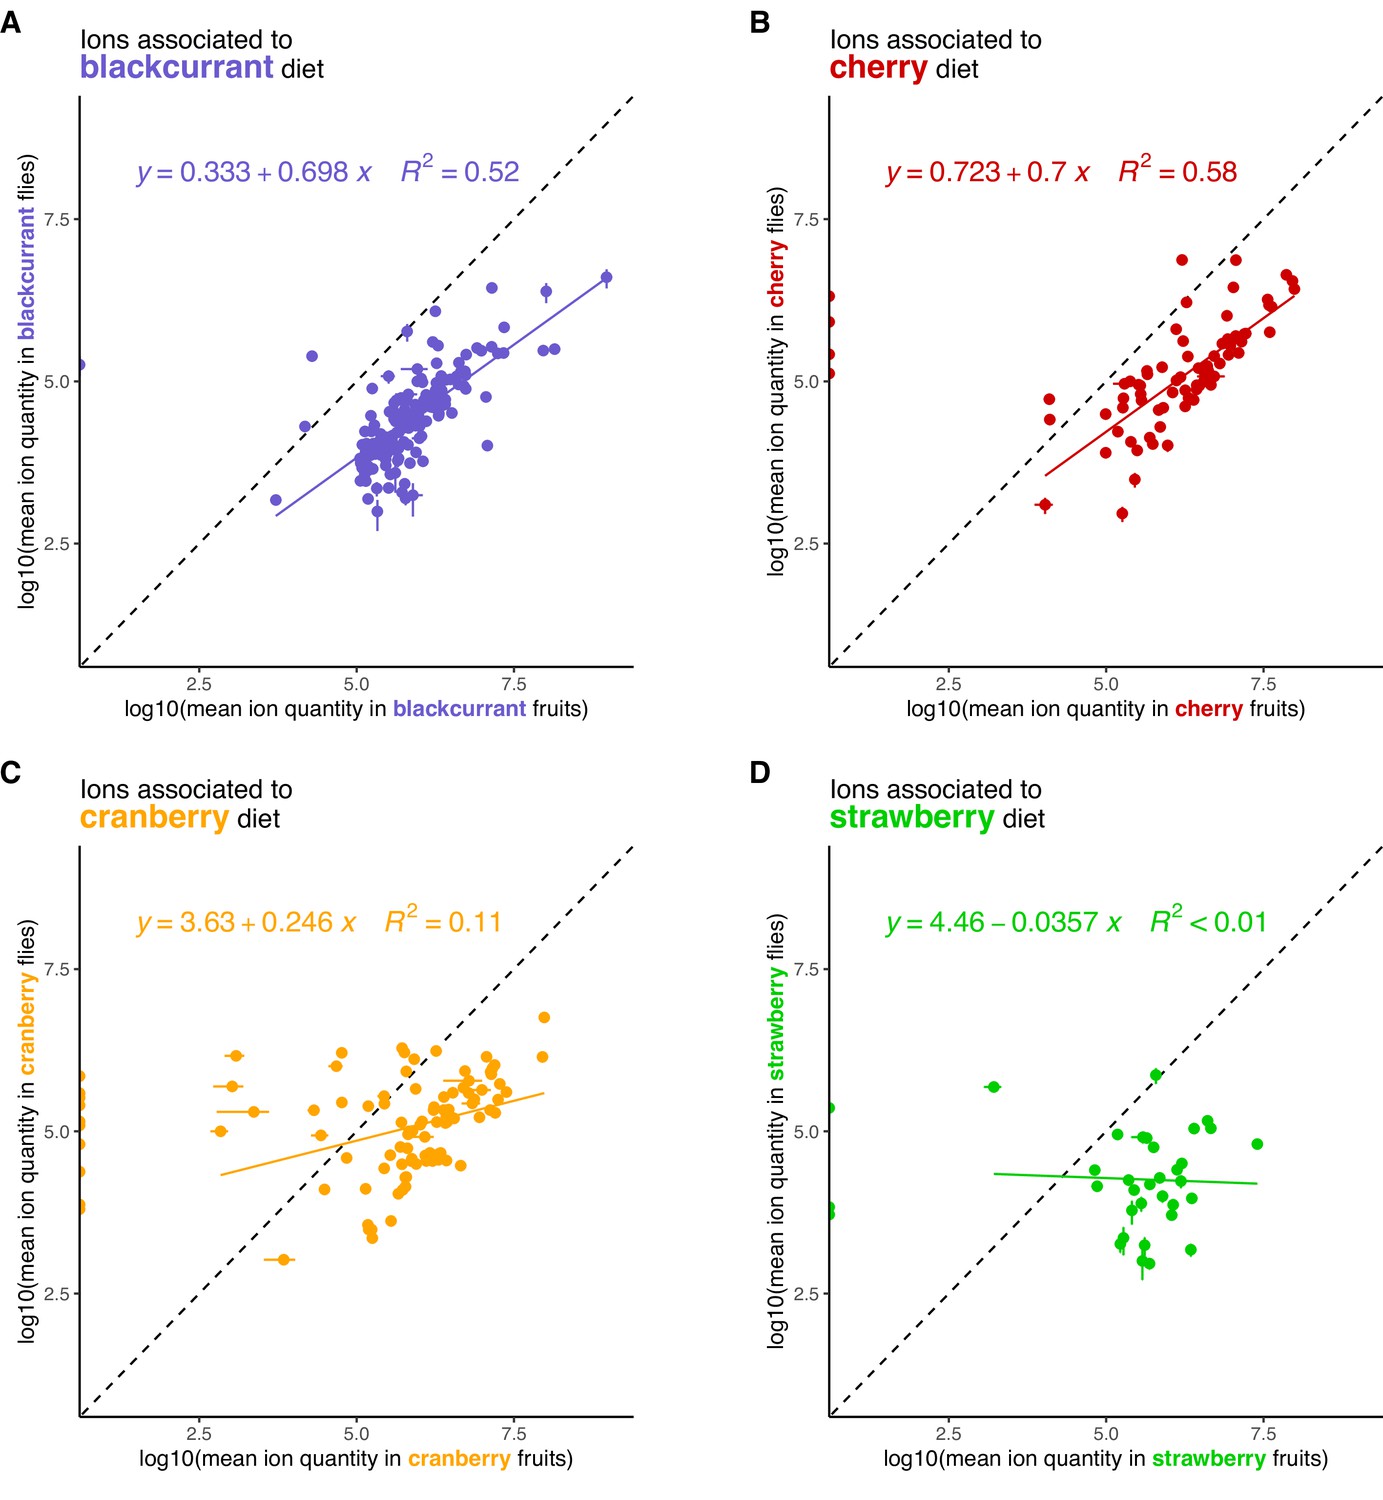
Relationships between the quantities of diet-specific fly ions in fruit and flies of the following fruit-fly pairs.
(A) Blackcurrant, (B) Cherry, (C) Cranberry, (D) Strawberry.
Figure 4—figure supplement 5
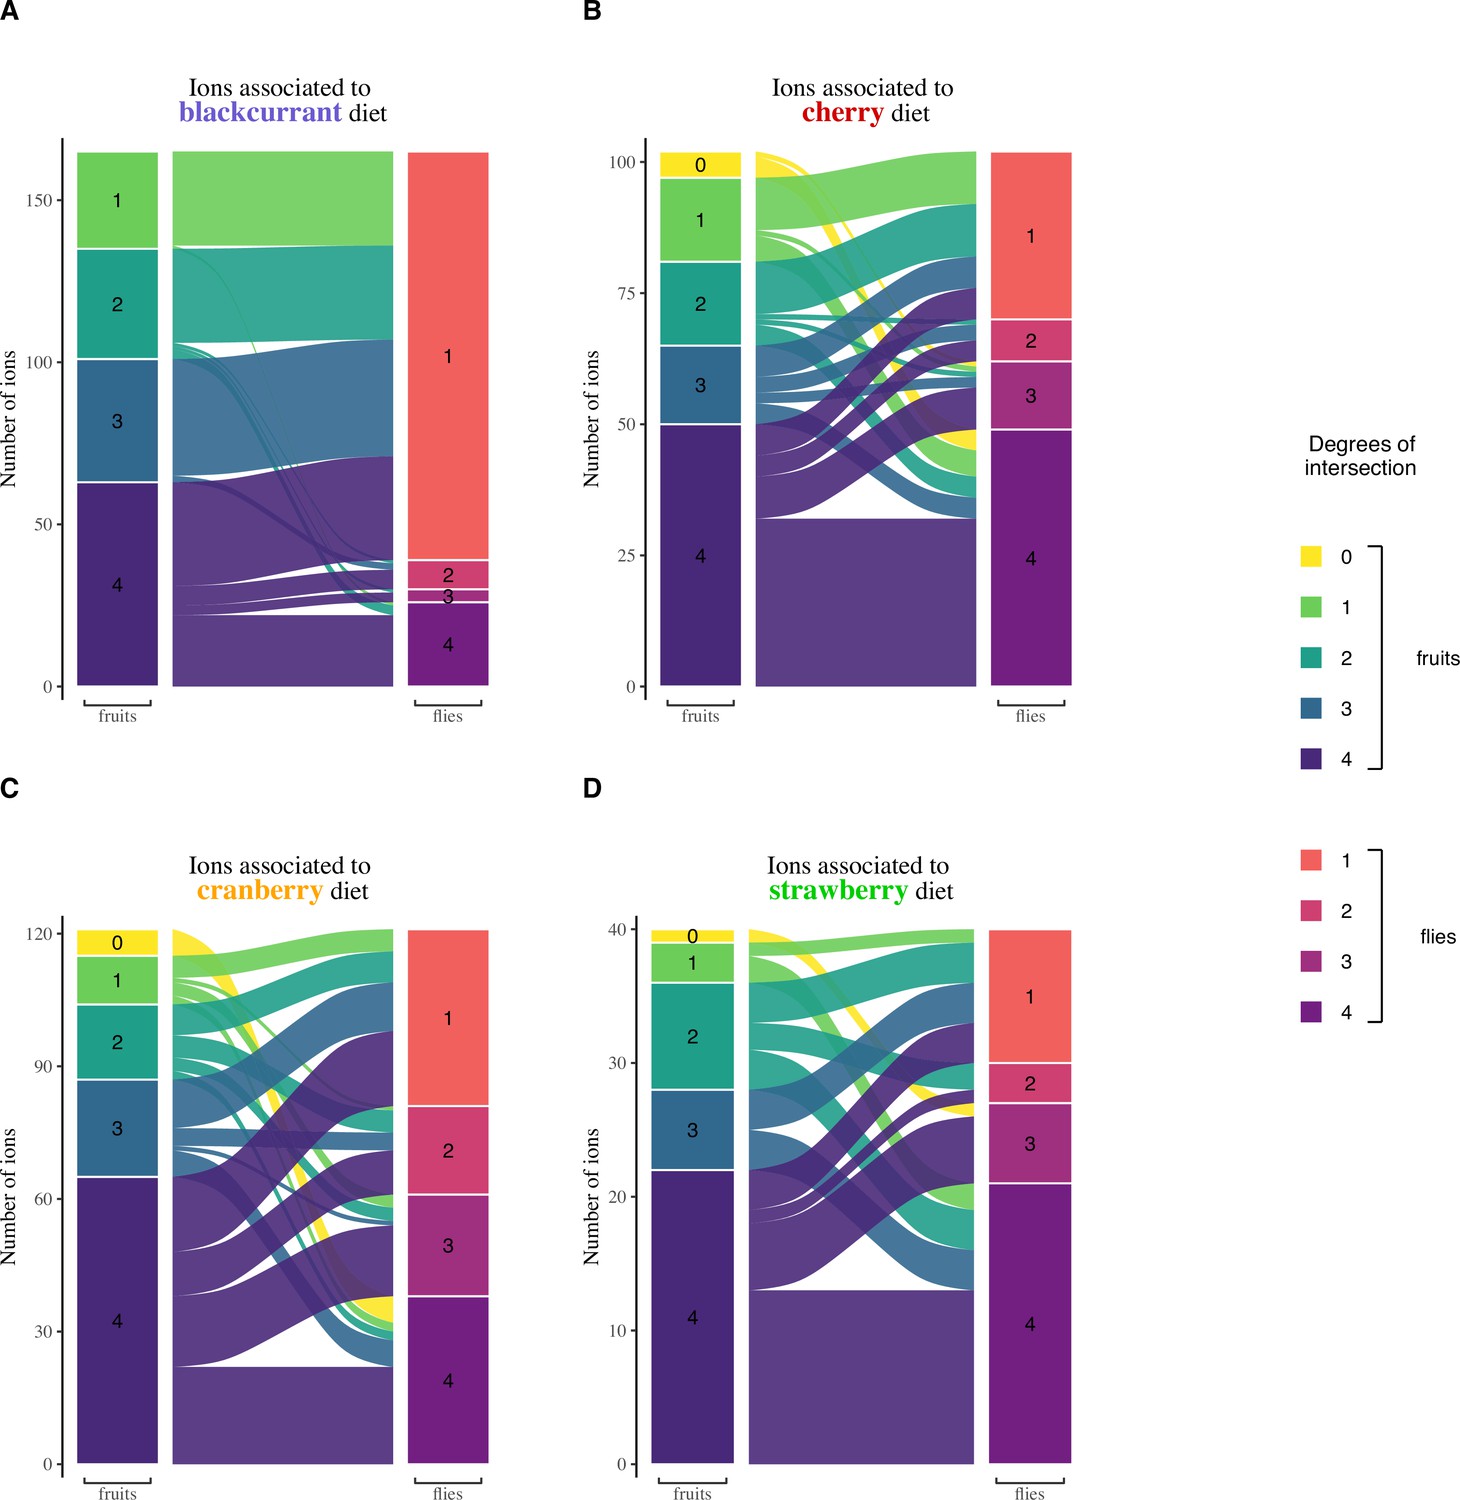
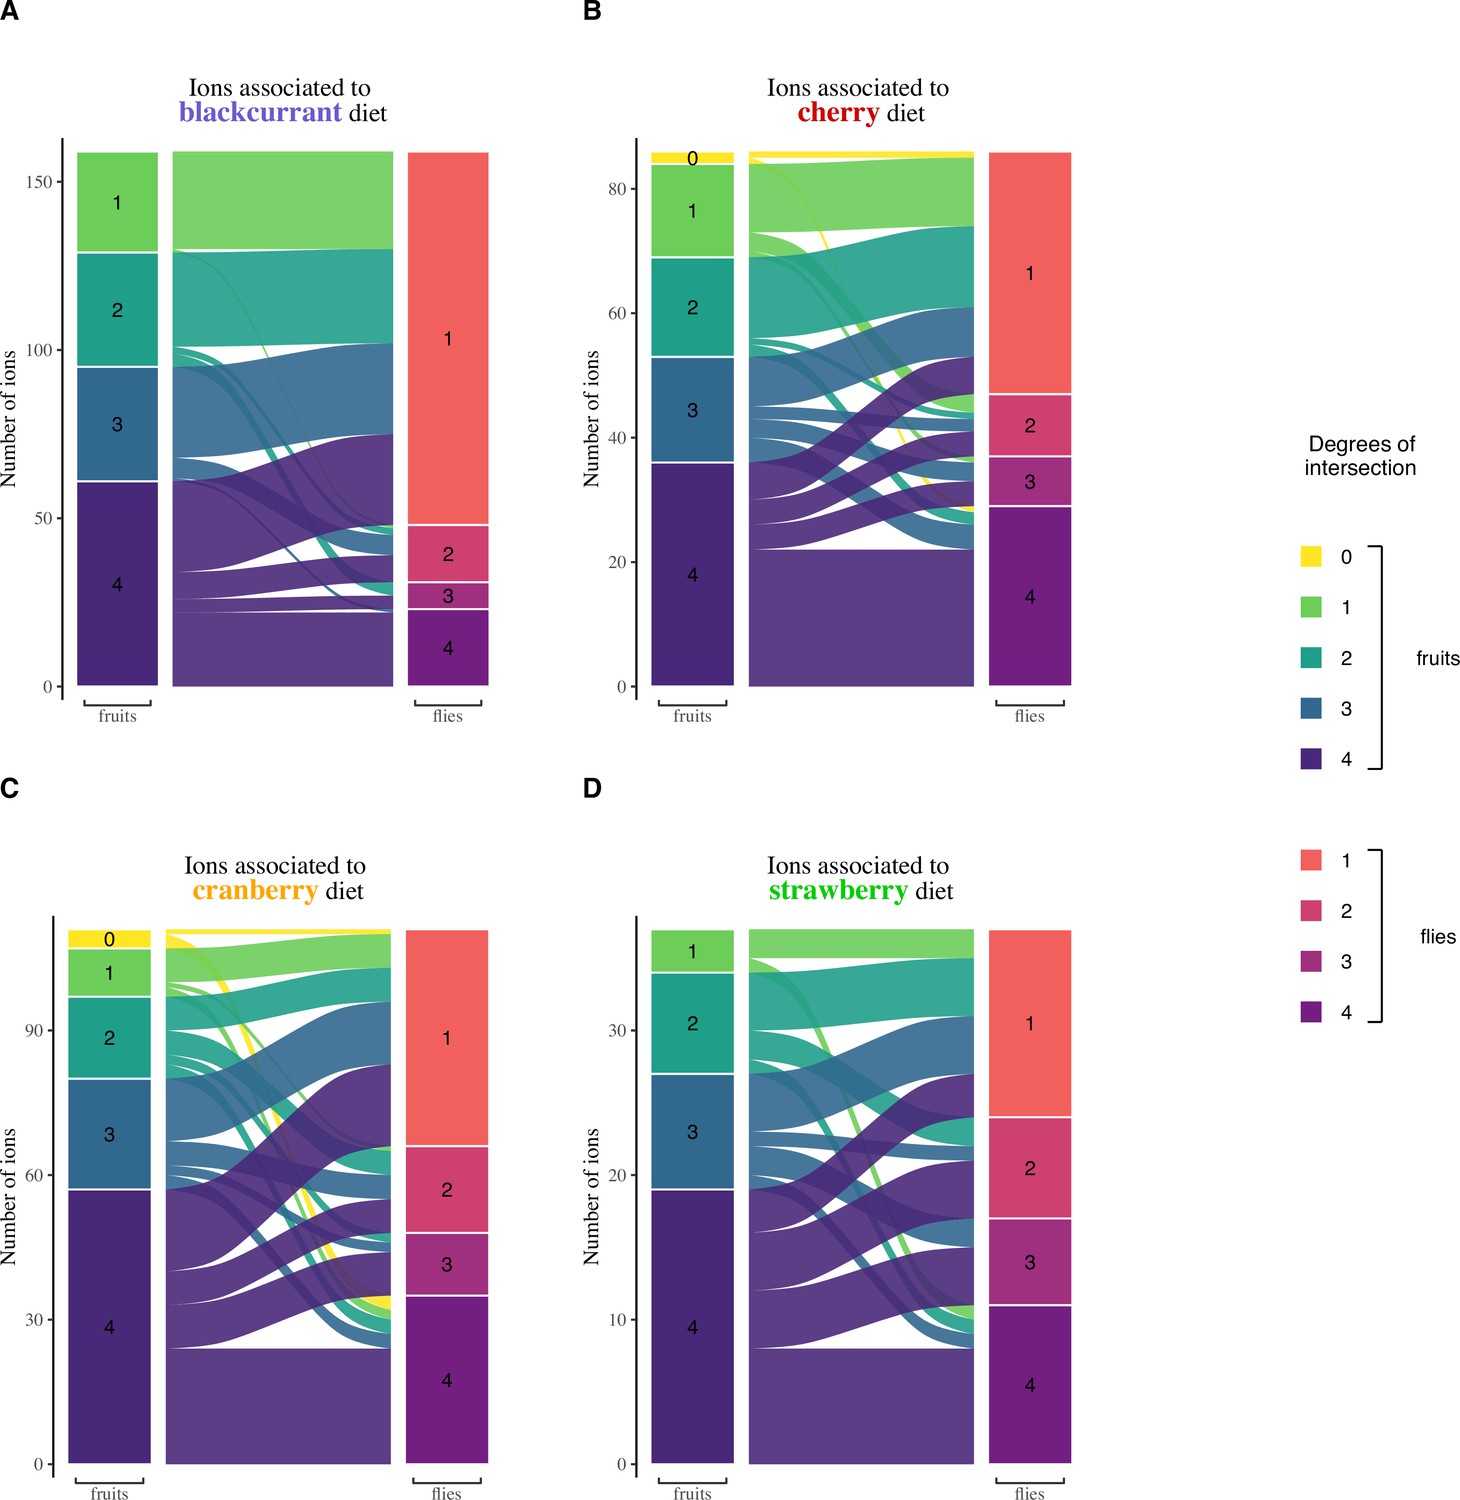
Intersection sizes (in fruits and flies) and relationships of fly ions specific to the following diets.
(A) Blackcurrant, (B) Cherry, (C) Cranberry, (D) Strawberry. Ions that are shared within fruits or within flies show a higher degree of intersection.
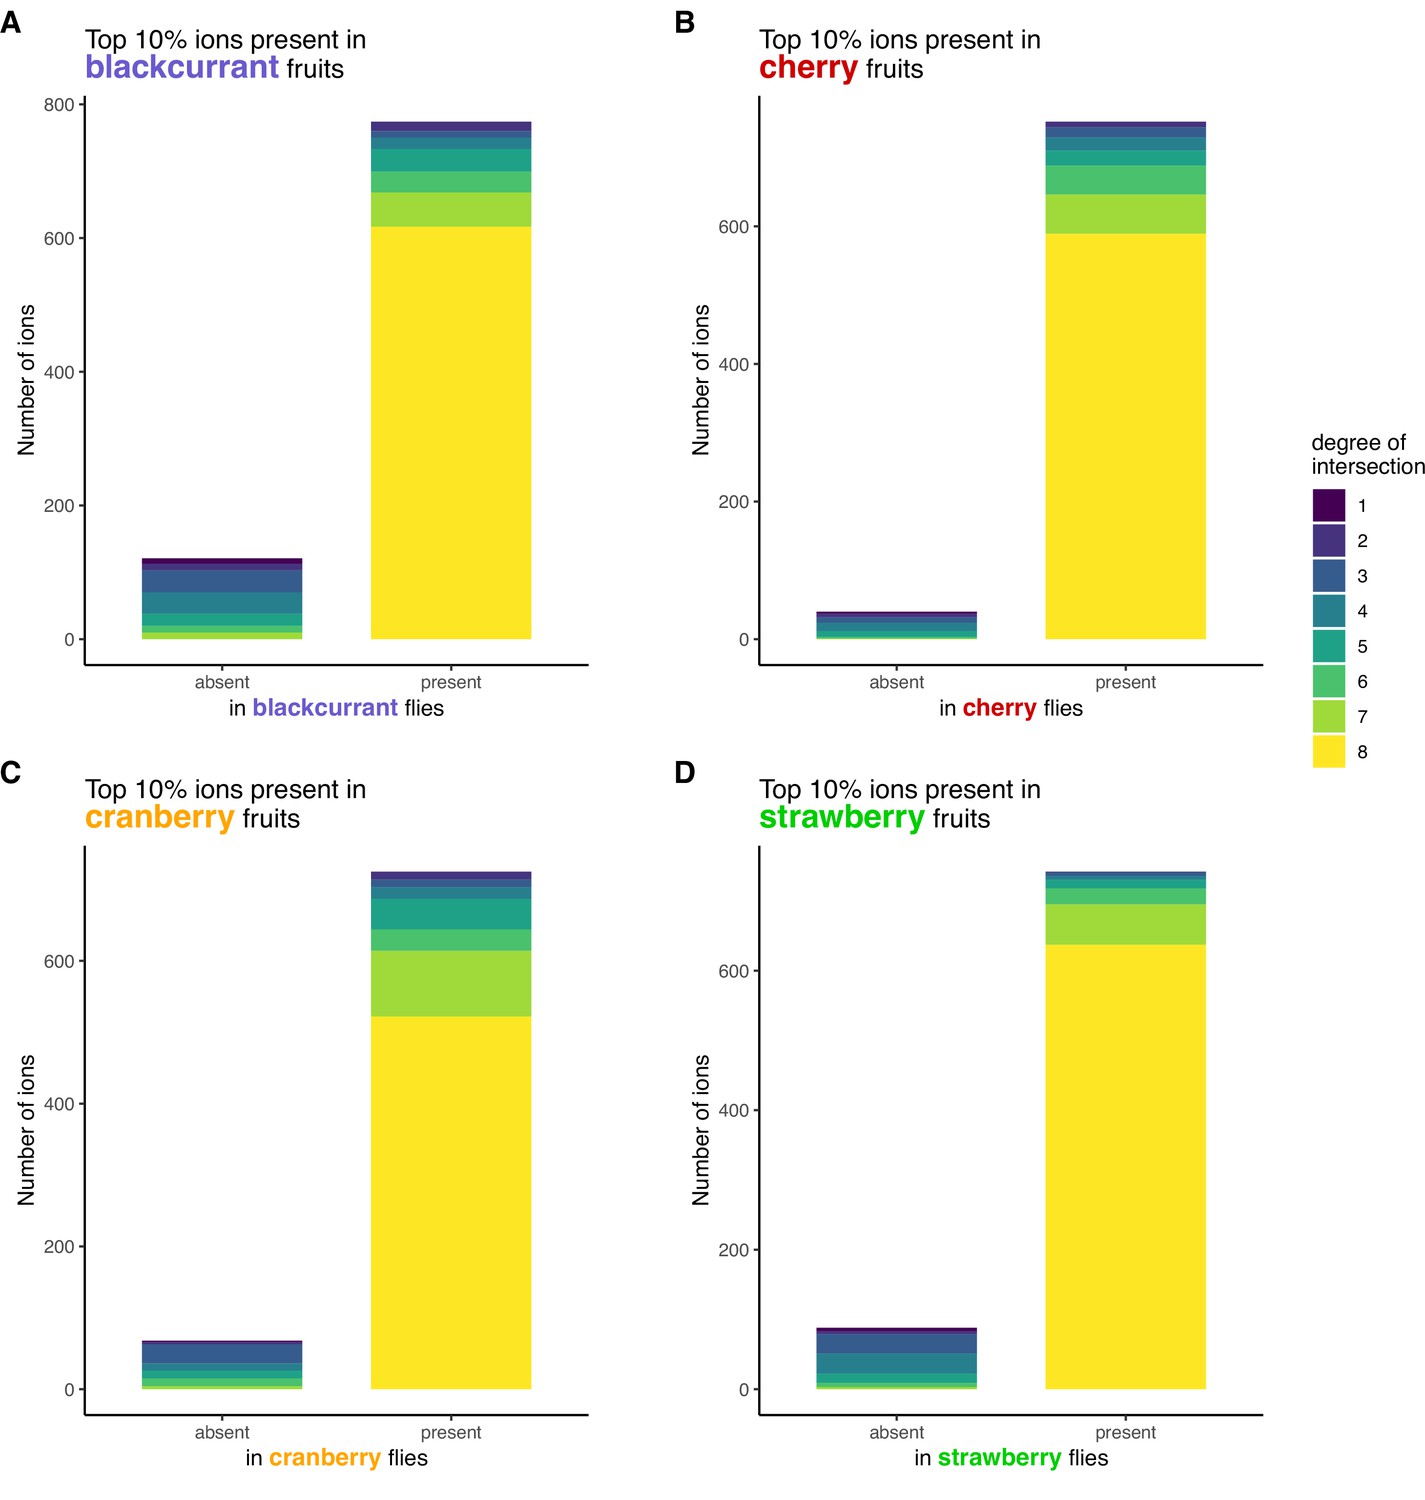
Figure 4—figure supplement 6
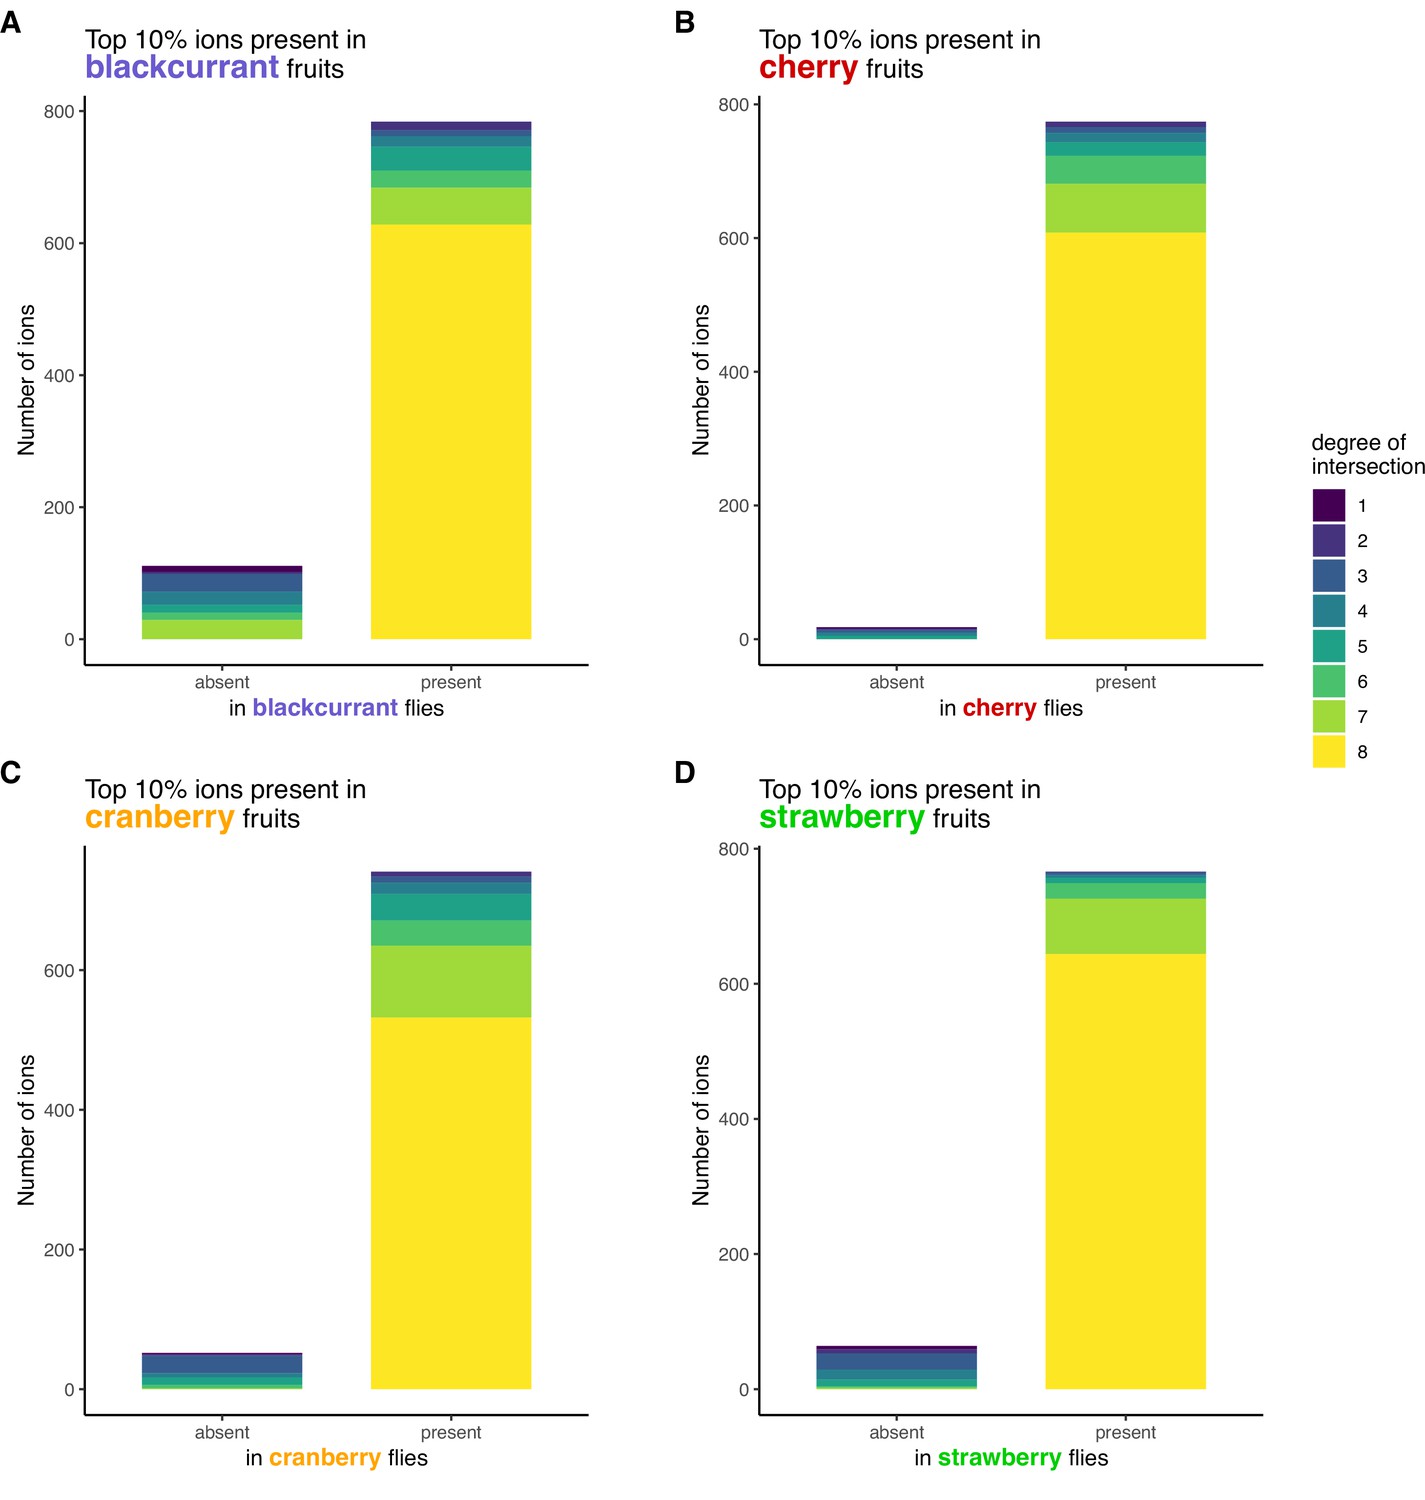
Number and degree of intersection of major fruit ions relative to their presence in the consumer flies.
(A) Blackcurrant, (B) Cherry, (C) Cranberry, (D) Strawberry.
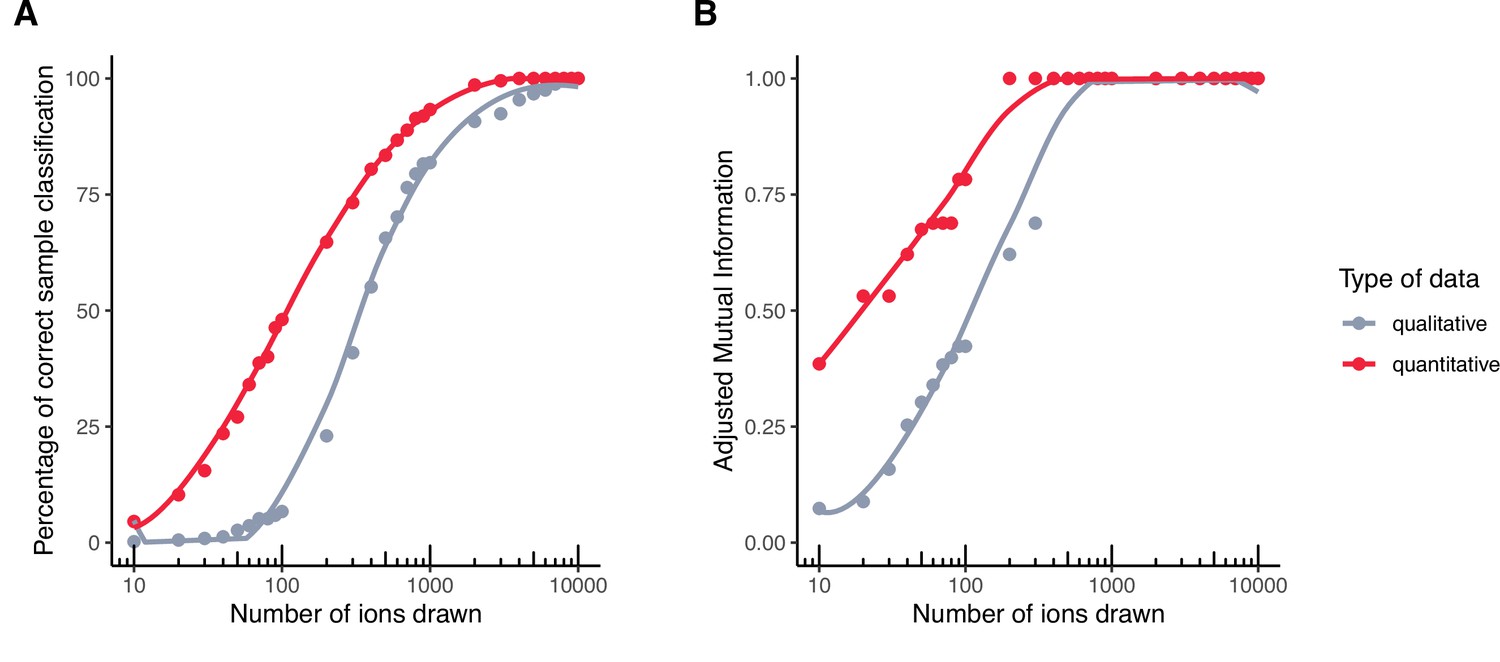
Figure 4—figure supplement 7
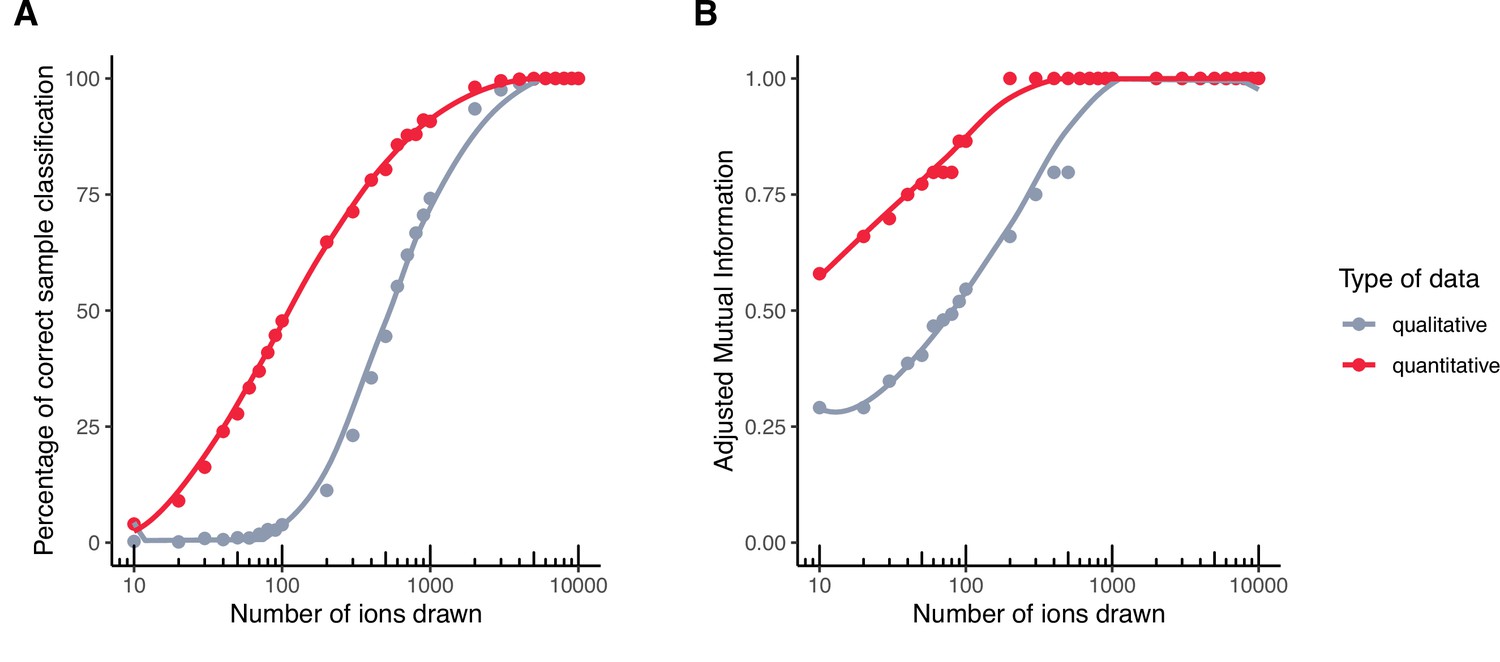
Classification performance of qualitative vs quantitative fly datasets to infer diet.
(A) Percentage of correct classification, and (B) Adjusted mutual information.
Figure 5 with 1 supplement
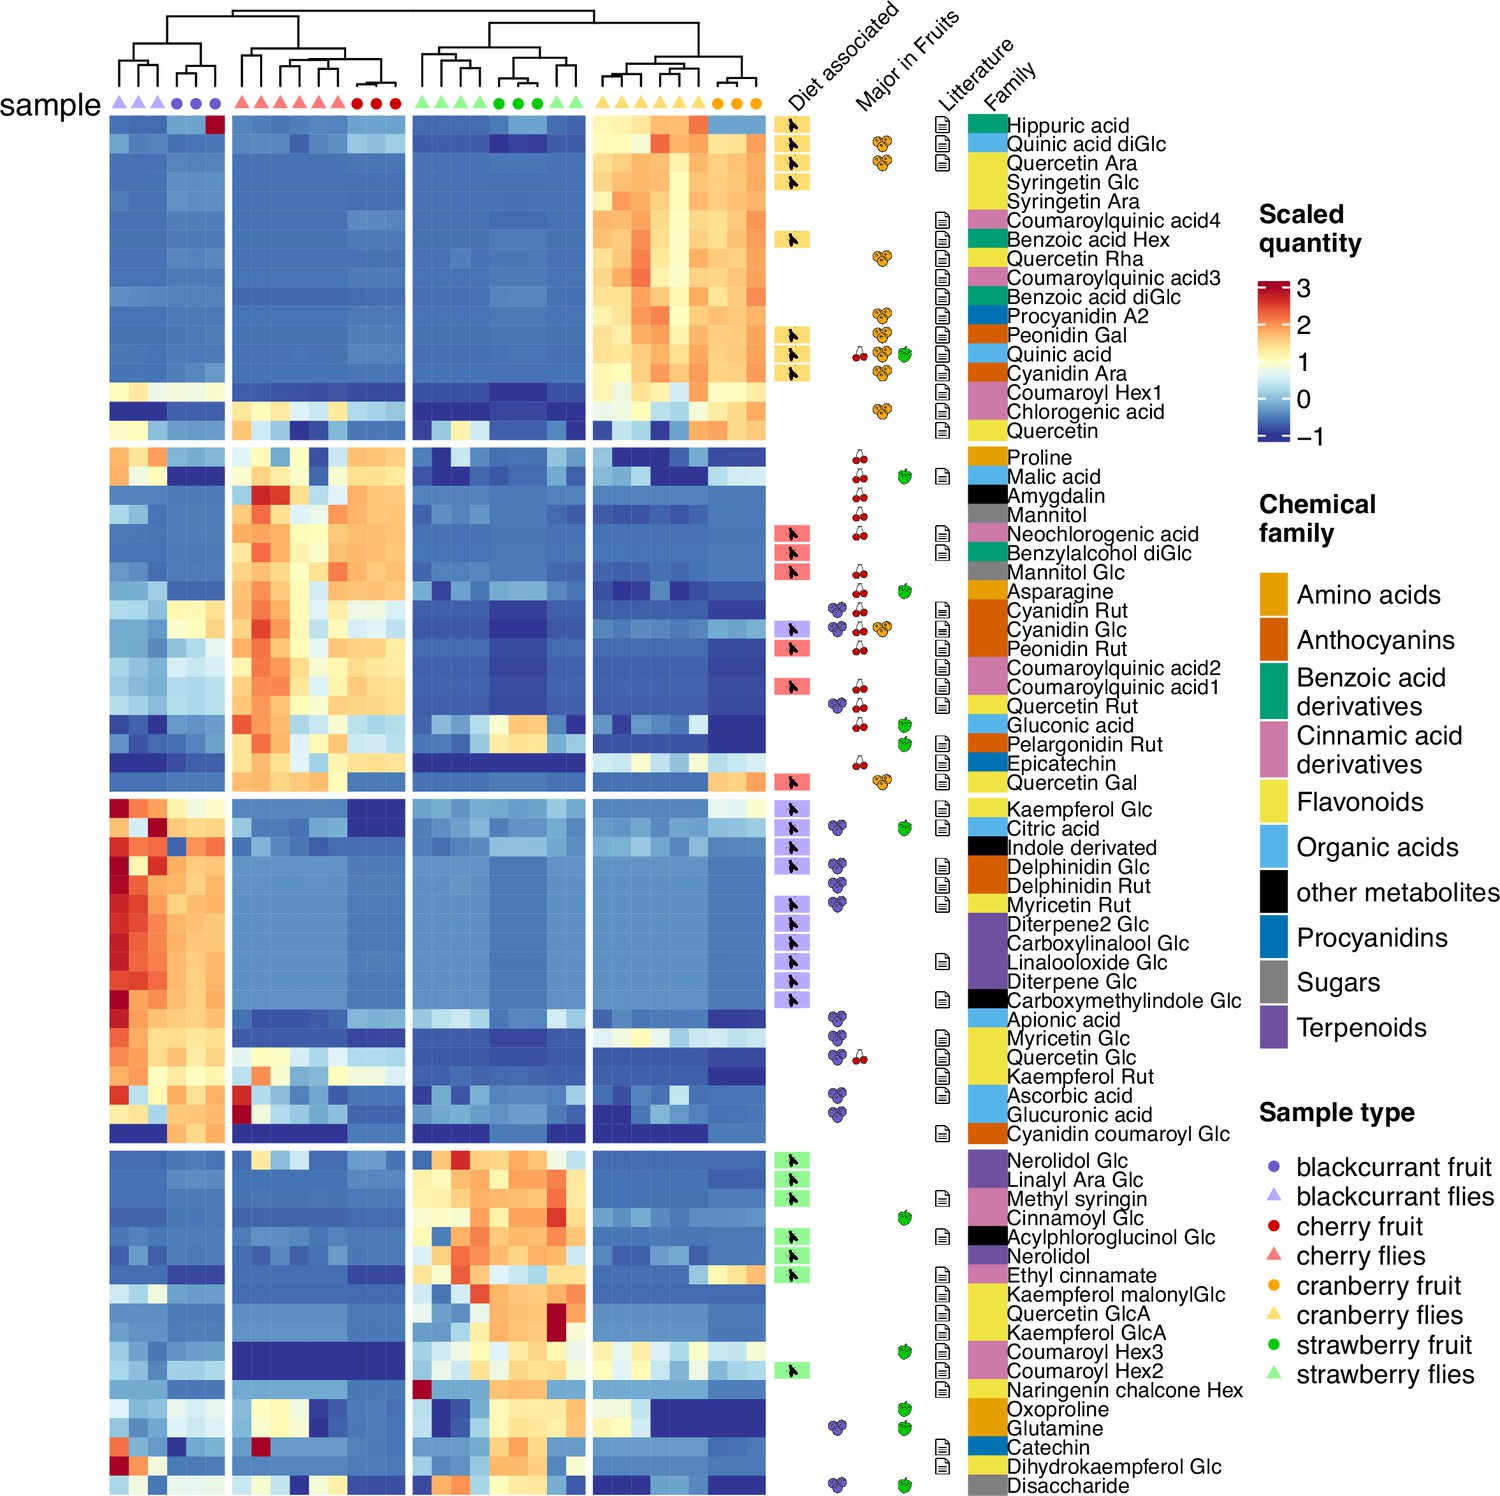
Heatmap of the relative quantity of identified metabolites in each fruit and fly sample.
Heatmap scale colors indicate the relative quantity of each metabolite (row). Additional columns represent diet specificity in flies, major presence (top 50) in fruits, presence in literature in relation to one or several of the investigated fruits, and chemical family of each identified metabolite (see Supplementary file 1 for detailed bibliographic information).
Figure 5—figure supplement 1
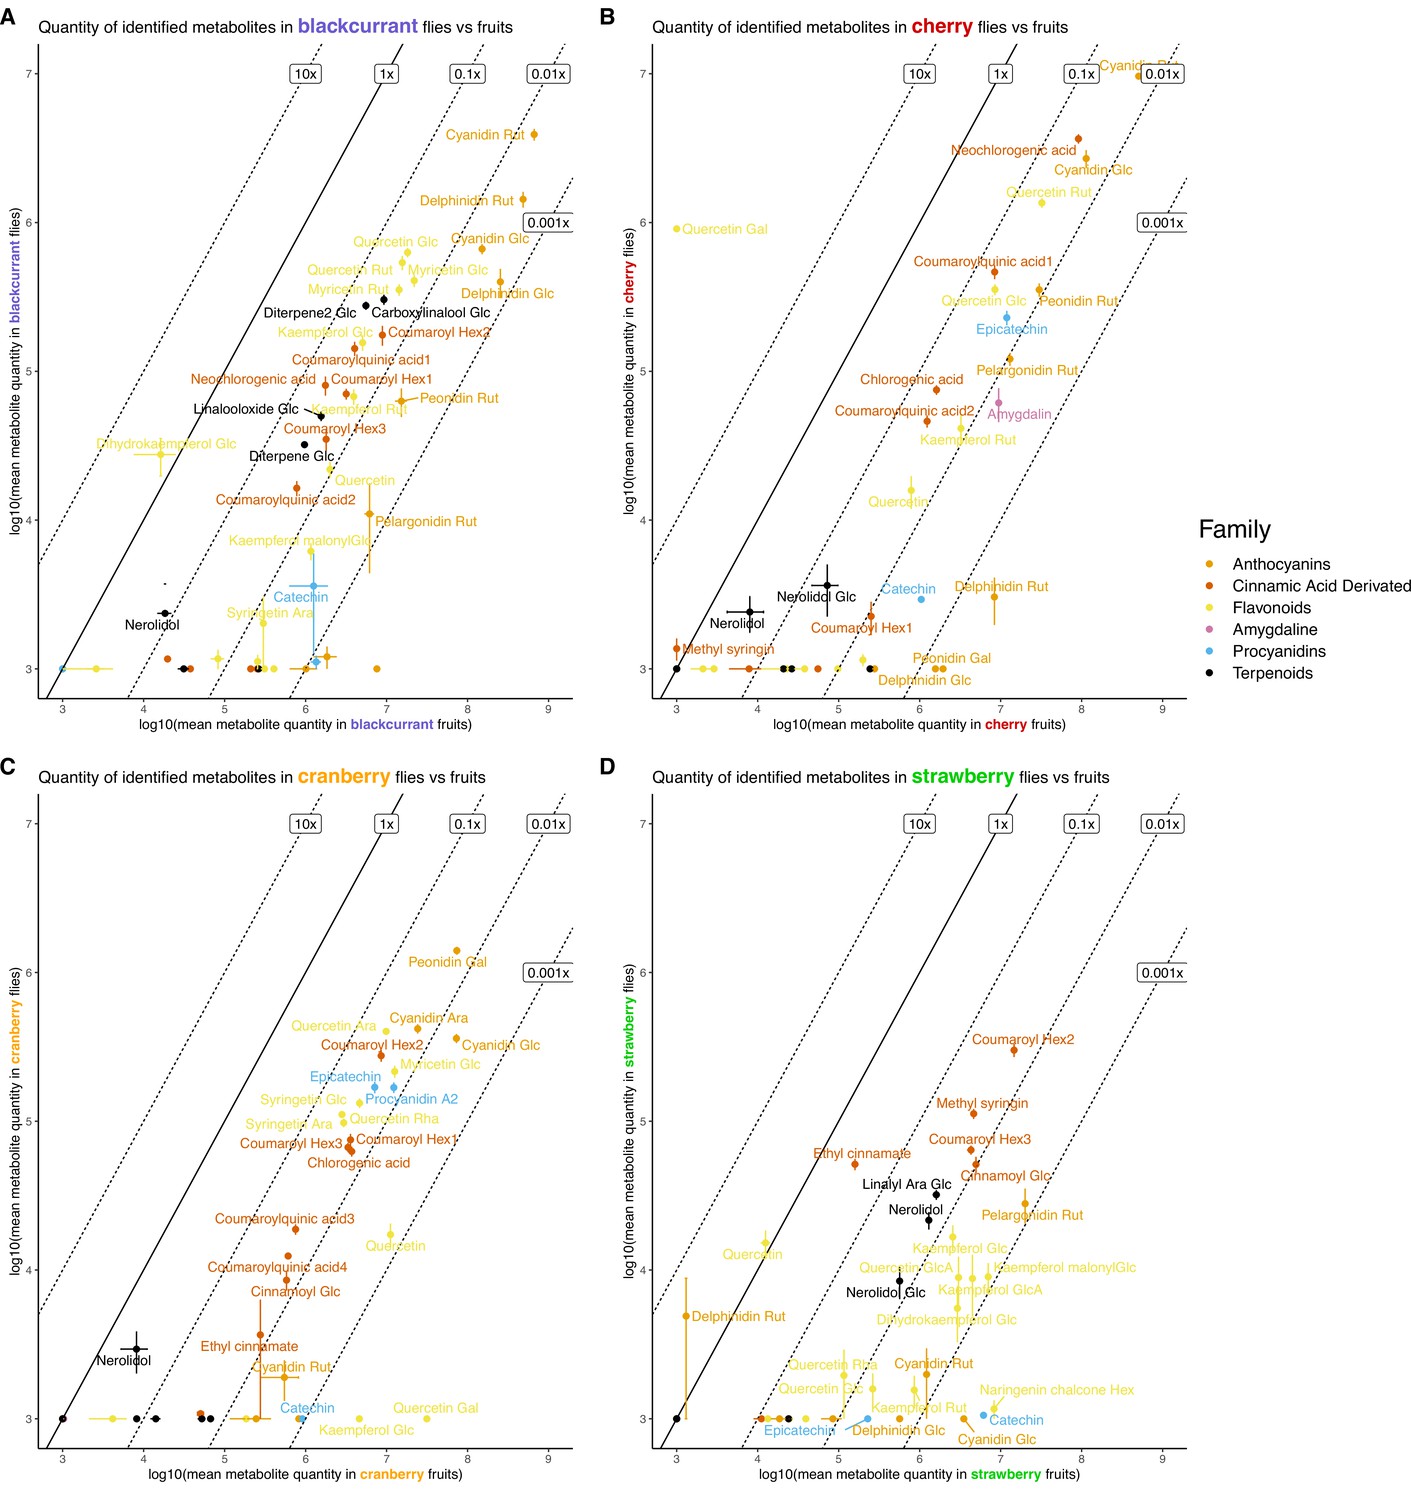
Quantities of identified metabolites in the following fruit-fly pairs.
(A) Blackcurrant, (B) Cherry, (C) Cranberry, (D) Strawberry. Most metabolites are present ten to a hundred times less in flies than in their respective diet.
Appendix 1—figure 1
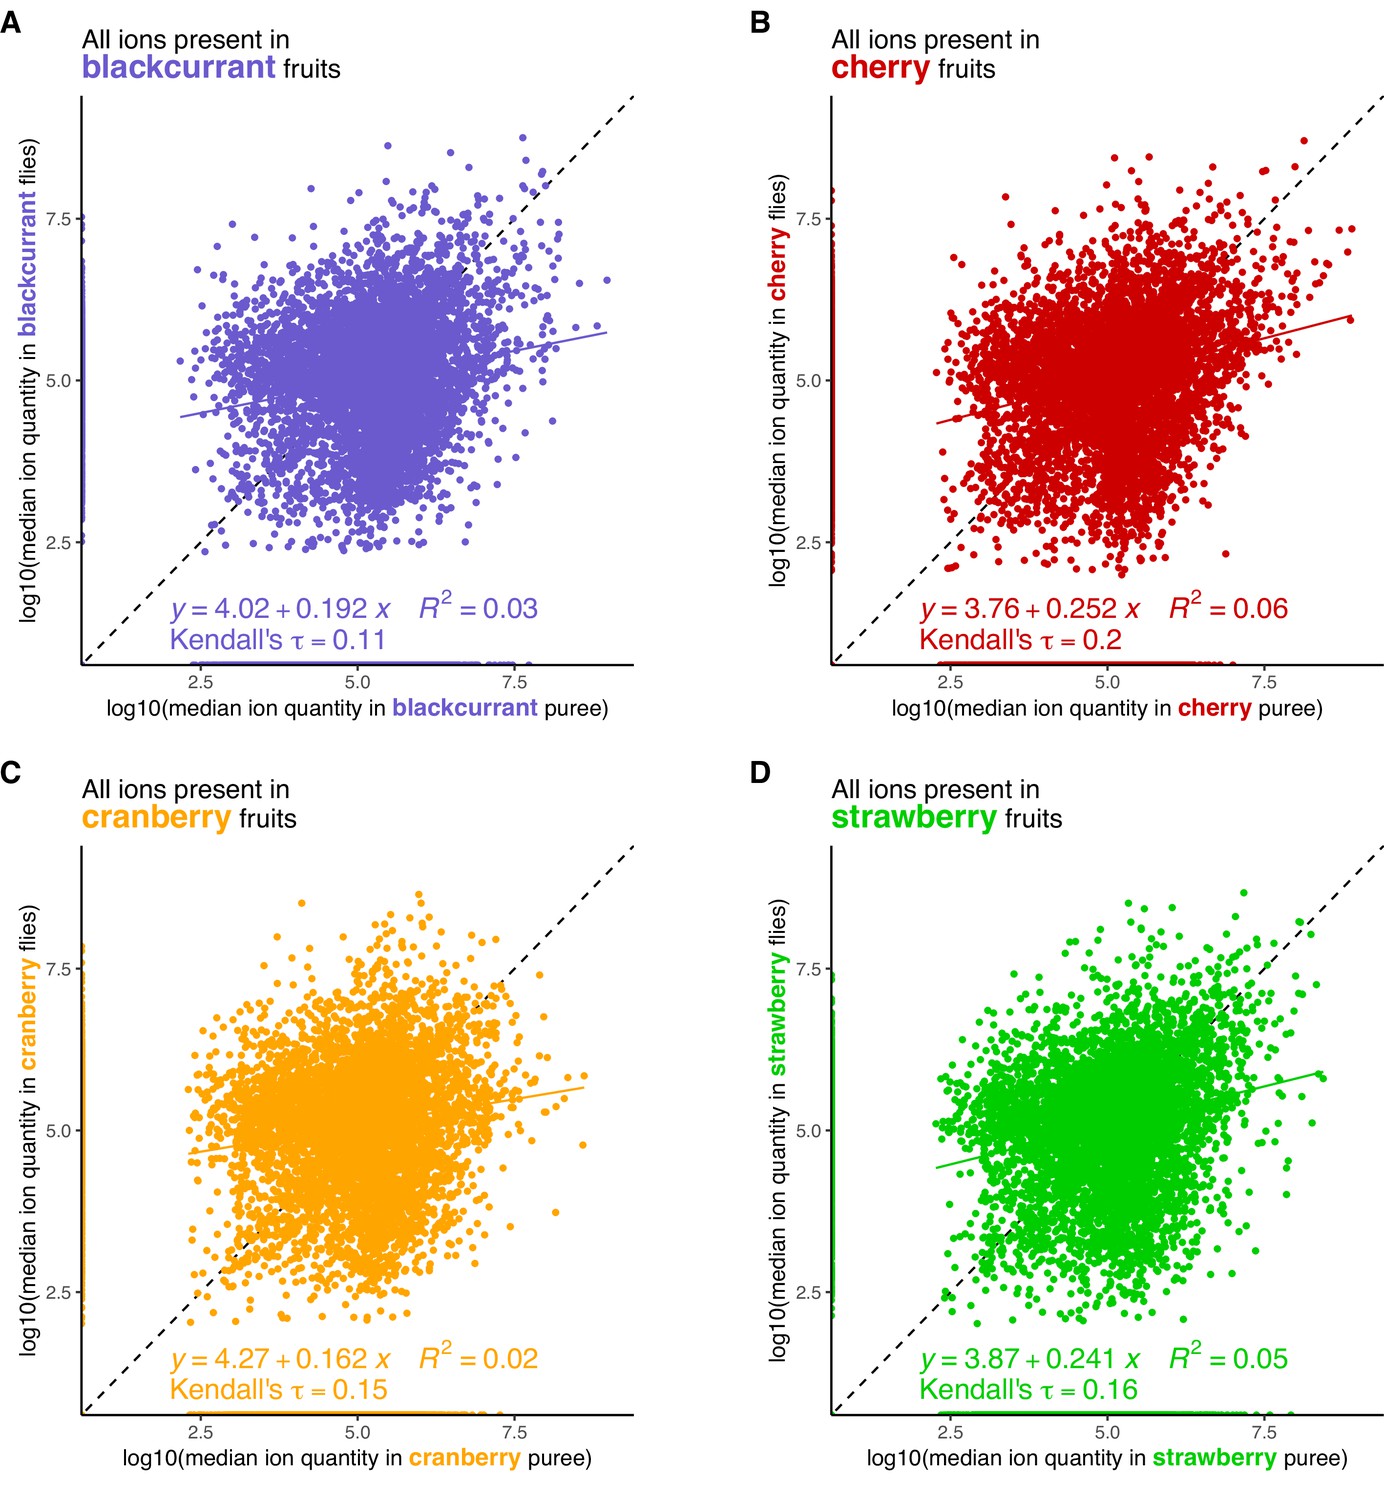
Relation between ion quantity in fruit vs in flies that developed on the same fruit.
(A) Blackcurrant, (B) Cherry, (C) Cranberry, (D) Strawberry. Linear regression coefficients, R-square and Kendall’s τ are indicated for each fruit-fly pair.
Appendix 1—figure 2
Overall trends of shared ions between all fruits and all flies.
(A) The ten largest intersections between all metabolomes comprise many high degree intersections, including ions shared between all fruit and all flies’ samples (#1), ions, shared between all flies (#2) and ions shared between all fruits (#3). A notable exception to this pattern is the presence of ions found only in the blackcurrant fruits (#5). (B) A focus on ions unique to particular samples or sample pairs (i.e. intersections of degree 1 and 2, respectively) illustrate that, while ions unique to fruits are found in high numbers, ions unique to diet in flies are largely absent. Ions specific to a given fruit-flies pair are infrequent. See Figure 1C for expectations according to diet generalization hypotheses.
Appendix 1—figure 3
Relationships between ions respectively found in fruits and flies, according to their degree of intersection.
Ions that are shared within fruits or within flies show a higher degree of intersection. Most ions found in flies are found in all flies, but not necessarily in all fruits. It is also noteworthy that almost all ions produced de novo by flies are found in all flies, regardless of their diet. See Figure 1E for expectations according to diet generalization hypotheses.
Appendix 1—figure 4
Fruits and flies’ metabolomes cluster separately and do not form pairs.
Fruit and fly samples in this overall principal component analysis (PCA) are represented by dots and triangles, respectively. Colors represent different fruits or diets in the case of flies. All flies’ samples cluster together and away from fruits, regardless of their diets. See Figure 1G for expectations according to diet generalization hypotheses.
Appendix 1—figure 5
Flies’ metabolomes differ according to diet.
Flies’ samples only were included in this principal component analysis (PCA). Differently oriented triangles indicate biological replicates (fly generations). (A) Dimensions 1 and 2; (B) Dimensions 2 and 3.
Appendix 1—figure 6
Plots of all individual ions of the principal component analysis of fruit metabolomes.
(A) Dimension 1 vs. dimension 2, and (B) dimension 2 vs. dimension 3. Fruit-specific ions are indicated in color, all other ions are indicated in gray.
Appendix 1—figure 7
Classification of fruit and fly samples following selection of diet-specific ions through GLM with Elastic Net regularization using the raw fly dataset.
Heatmap scale colors indicate the relative quantity of each ion (row) of the ‘large’ list of diet-specific ions (specificity indicated by discrete colors; see main text for details).
Appendix 1—figure 8
Quantitative levels of diet-specific fly ions in flies and fruits.
(A) Blackcurrant, (B) Cherry, (C) Cranberry, (D) Strawberry. Medians and their confidence intervals are represented by black bars.
Appendix 1—figure 9
Relationships between the quantities of diet-specific fly ions in fruit and flies of the following fruit-fly pairs.
(A) Blackcurrant, (B) Cherry, (C) Cranberry, (D) Strawberry.
Appendix 1—figure 10
Intersection sizes (in fruits and flies) and relationships of fly ions specific to the following diets.
(A) Blackcurrant, (B) Cherry, (C) Cranberry, (D) Strawberry. Ions that are shared within fruits or within flies show a higher degree of intersection.
Appendix 1—figure 11
Number and degree of intersection of major fruit ions relative to their presence in the consumer flies.
(A) Blackcurrant, (B) Cherry, (C) Cranberry, (D) Strawberry.
Appendix 1—figure 12
Classification performance of qualitative vs. quantitative fly datasets to infer diet.
(A) Percentage of correct classification, and (B) Adjusted mutual information.
Author response image 1
Left = negative ions; right = positive ions.
Author response image 2

Left = negative ions; right = positive ions.
Author response image 3

Above = negative ions; below = positive ions.
Tables
Appendix 1—table 1
Figure names for each analysis performed on raw and controlled fly dataset.
| Analysis | Raw fly dataset | Controlled fly dataset |
|---|---|---|
| Relation between ion quantity in fruit vs. in flies that developed on the same fruit | Appendix 1—figure 1 | Figure 1—figure supplement 4 |
| Overall trends of shared ions between all fruits and all flies | Appendix 1—figure 2 | Figure 2 |
| Relationships between ions respectively found in fruits and flies, according to their degree of intersection | Appendix 1—figure 3 | Figure 3 |
| Fruits and flies’ metabolomes Principal Component Analysis | Appendix 1—figure 4 | Figure 3—figure supplement 1 |
| Flies’ metabolomes Principal Component Analysis | Appendix 1—figure 5 | Figure 4 |
| All individual ions of the Principal Component Analysis of fruit metabolomes | Appendix 1—figure 6 | Figure 4—figure supplement 1 |
| Classification of fruit and fly samples following selection of diet-specific ions through GLM with Elastic Net regularization | Appendix 1—figure 7 | Figure 4—figure supplement 2 |
| Quantitative levels of diet-specific fly ions in flies and fruits | Appendix 1—figure 8 | Figure 4—figure supplement 3 |
| Relationships between the quantities of diet-specific fly ions in fruit and flies of the following fruit-fly pairs | Appendix 1—figure 9 | Figure 4—figure supplement 4 |
| Intersection sizes (in fruits and flies) and relationships of fly ions specific to the following diets | Appendix 1—figure 10 | Figure 4—figure supplement 5 |
| Number and degree of intersection of major fruit ions relative to their presence in the consumer flies | Appendix 1—figure 11 | Figure 4—figure supplement 6 |
| Classification performance of qualitative vs. quantitative fly datasets to infer diet | Appendix 1—figure 12 | Figure 4—figure supplement 7 |
Additional files
-
MDAR checklist
- https://cdn.elifesciences.org/articles/84370/elife-84370-mdarchecklist1-v1.pdf
-
Supplementary file 1
Table of all identified metabolites, their physicial properties, presence in fruits and flies (this study), and previous identifications in fruits.
- https://cdn.elifesciences.org/articles/84370/elife-84370-supp1-v1.xlsx
Download links
A two-part list of links to download the article, or parts of the article, in various formats.
Downloads (link to download the article as PDF)
Open citations (links to open the citations from this article in various online reference manager services)
Cite this article (links to download the citations from this article in formats compatible with various reference manager tools)
Metabolic consequences of various fruit-based diets in a generalist insect species
eLife 12:e84370.
https://doi.org/10.7554/eLife.84370


