Brain-imaging evidence for compression of binary sound sequences in human memory
- Cognitive Neuroimaging Unit, Université Paris-Saclay, INSERM, CEA, CNRS, NeuroSpin center, France
- Institute of Neuroscience, Key Laboratory of Primate Neurobiology, CAS Center for Excellence in Brain Science and Intelligence Technology, Chinese Academy of Sciences, China
- Collège de France, Université Paris Sciences Lettres (PSL), France
Figures
Figure 1
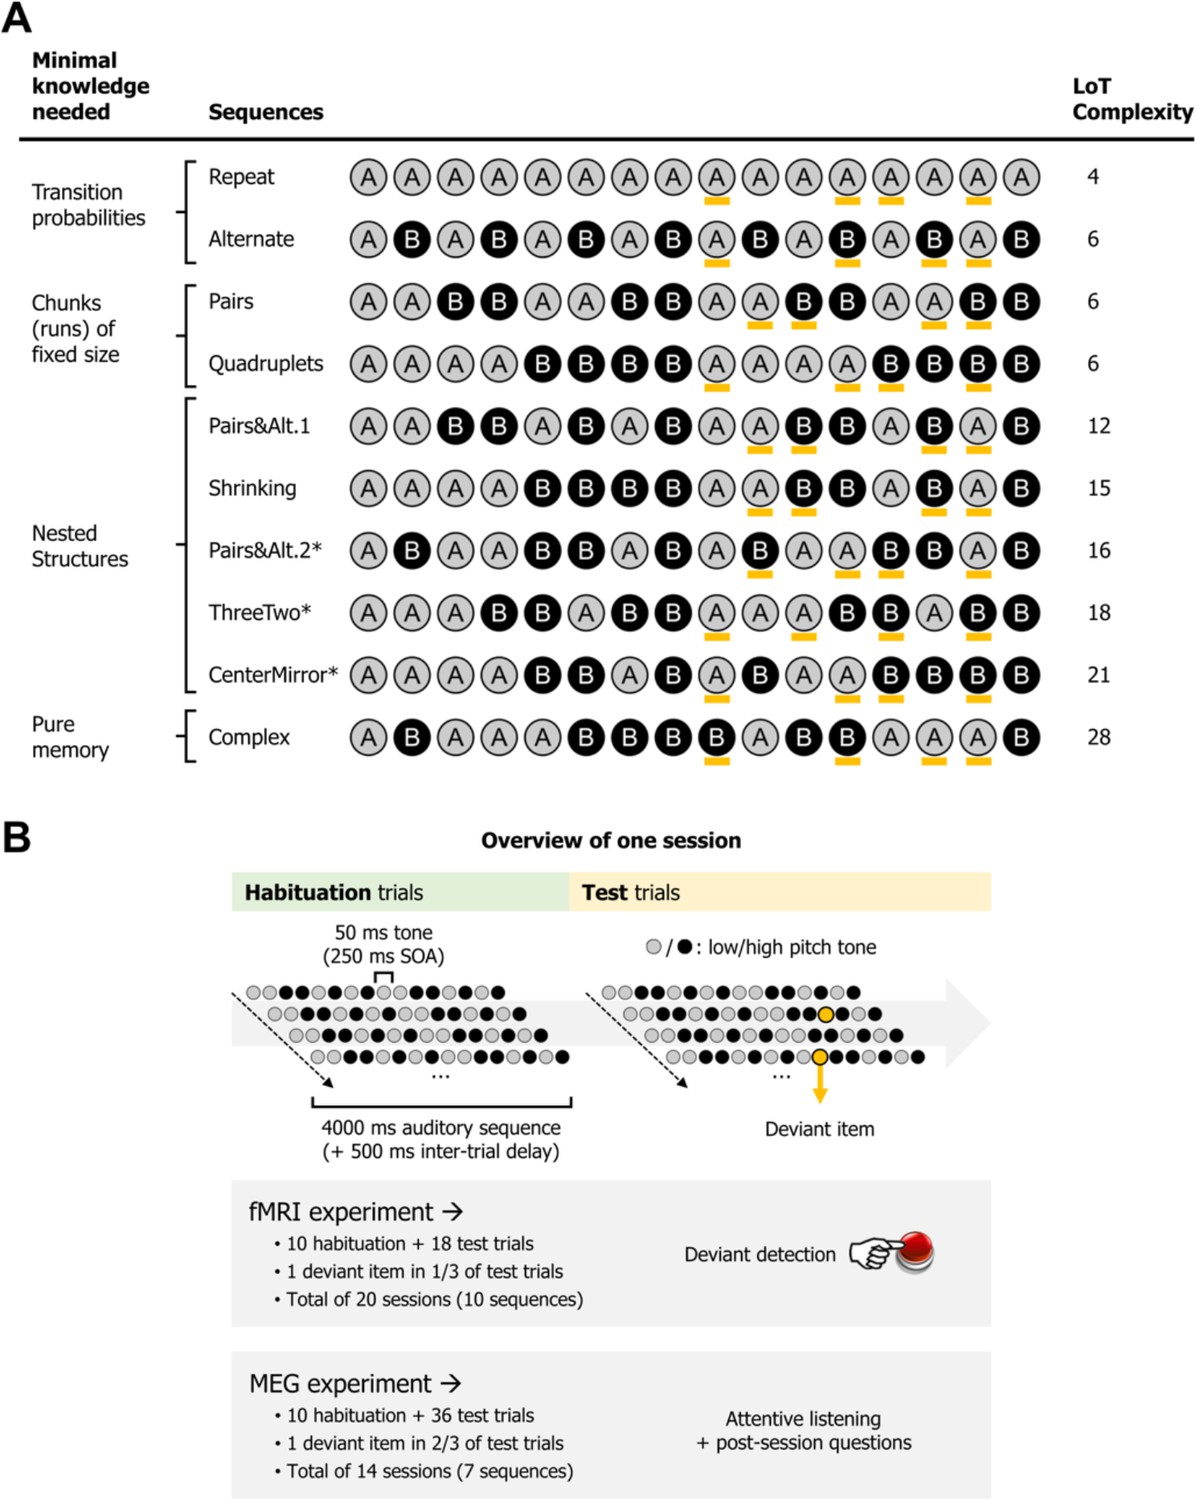
Experimental design.
(A) List of the different 16-item sequences used in the magneto-encephalography (MEG) and fMRI experiments, with associated language of thought (LoT) complexity, and categorized according to the type of knowledge assumed to be required for optimal memory encoding. Orange marks indicate positions in which violations could occur (4 possible positions per sequence, all between positions 9 and 15). *Sequences used only in the fMRI experiment. Sequence description provided by the LoT and the corresponding verbal description are provided in Supplementary file 1. (B) Overview of the presentation paradigm (example with a session the Pairs&Alt.1 sequence), with the respective characteristics of the fMRI experiment and the MEG experiment. One unique sequence was used in any given session. Each sequence was tested twice, in two different sessions (reversing the mapping between A/B items and low/high pitch).
Figure 2 with 1 supplement
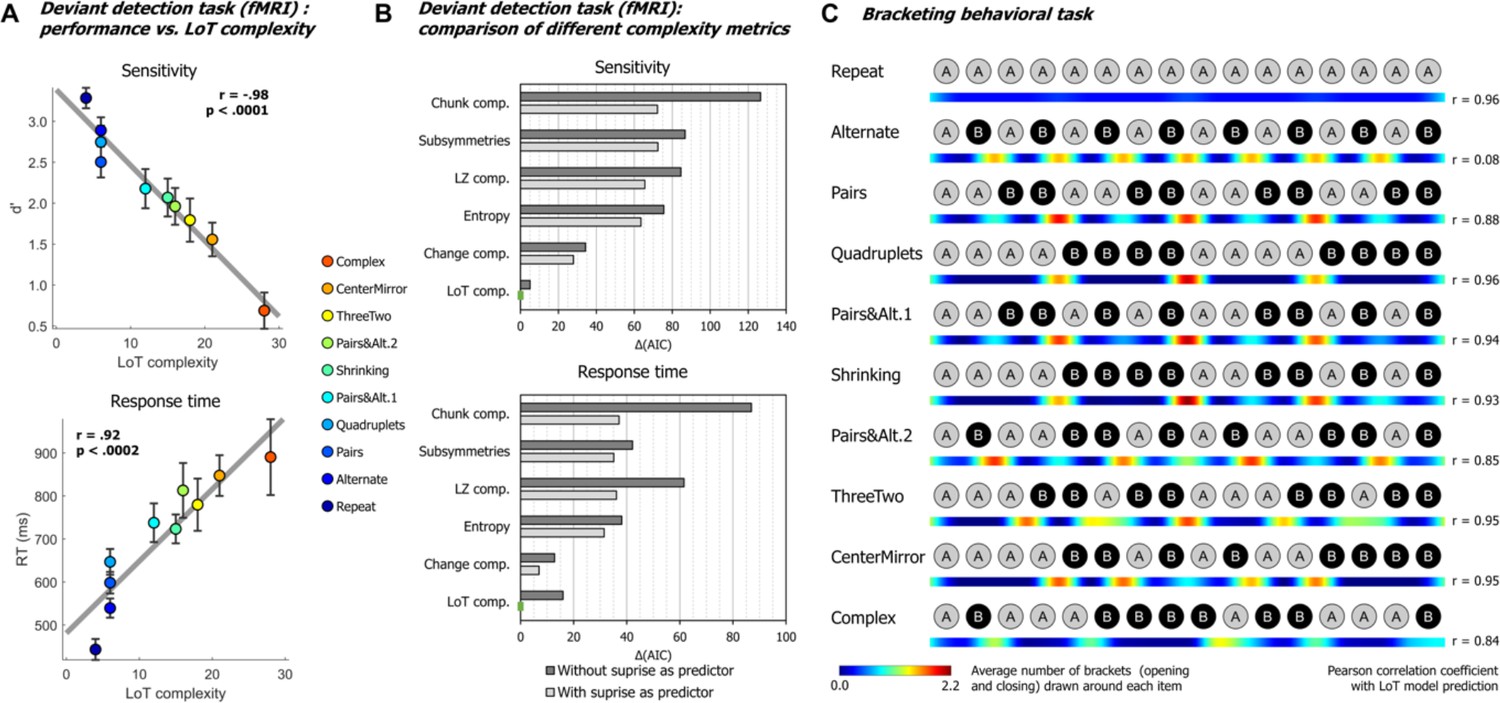
Behavioral data.
(A) Group-averaged sensitivity (d’) and response times for each sequence in the deviant detection task, plotted against the language of thought (LoT) complexity. A significant linear relationship with LoT complexity was found in both cases. The Pearson correlation coefficient and associated p-value are reported. Error bars represent SEM. (B) Comparison of the goodness of fit (indexed by the Akaike information criterion) of 12 mixed models (for sensitivity, top, and for response time, bottom), that is, each testing one out of six different complexity metrics (see main text) and including or not a transition-based surprise predictor. Δ(AIC) is the difference in AIC with the best model of the 12. A lower value indicates a better fit. The best model (Δ(AIC)=0) is marked by a green rectangle on the vertical axis. (C) The heatmap for each sequence represents the vector of the average number of brackets drawn by the participants around each item in the sequence bracketing task (after smoothing for illustration purposes). The Pearson correlation coefficient with the vector of brackets predicted by the LoT model is reported on the right side. A high correlation was obtained for all sequences but Alternate, since several subjects segmented this sequence in eight groups of two items, while the shortest LoT expression represented it in a single group of 16 items with 15 alternations.
Figure 2—figure supplement 1
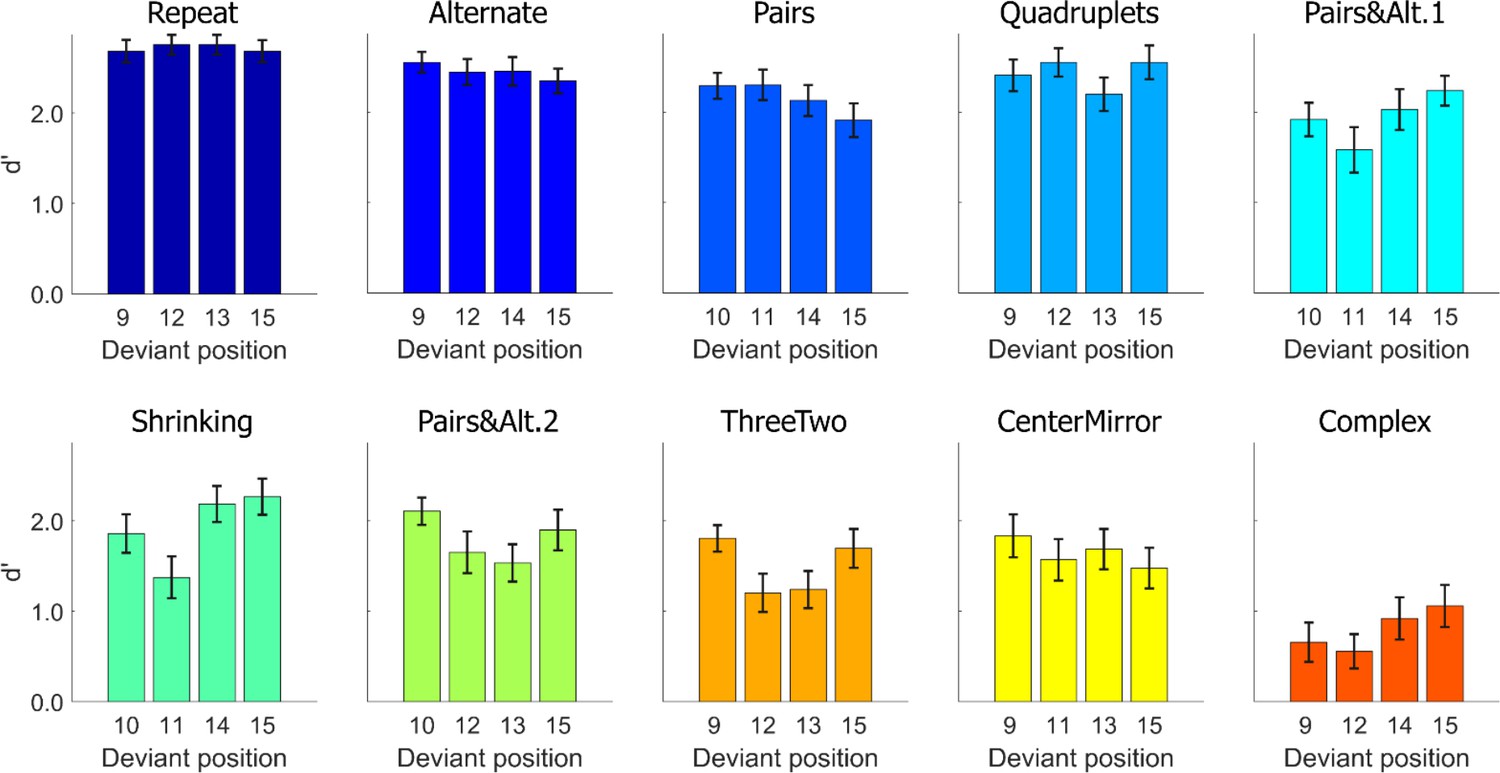
Task performance: average sensitivity (d’), for each position and each sequence.
Error bars represent SEM.
Figure 3 with 2 supplements
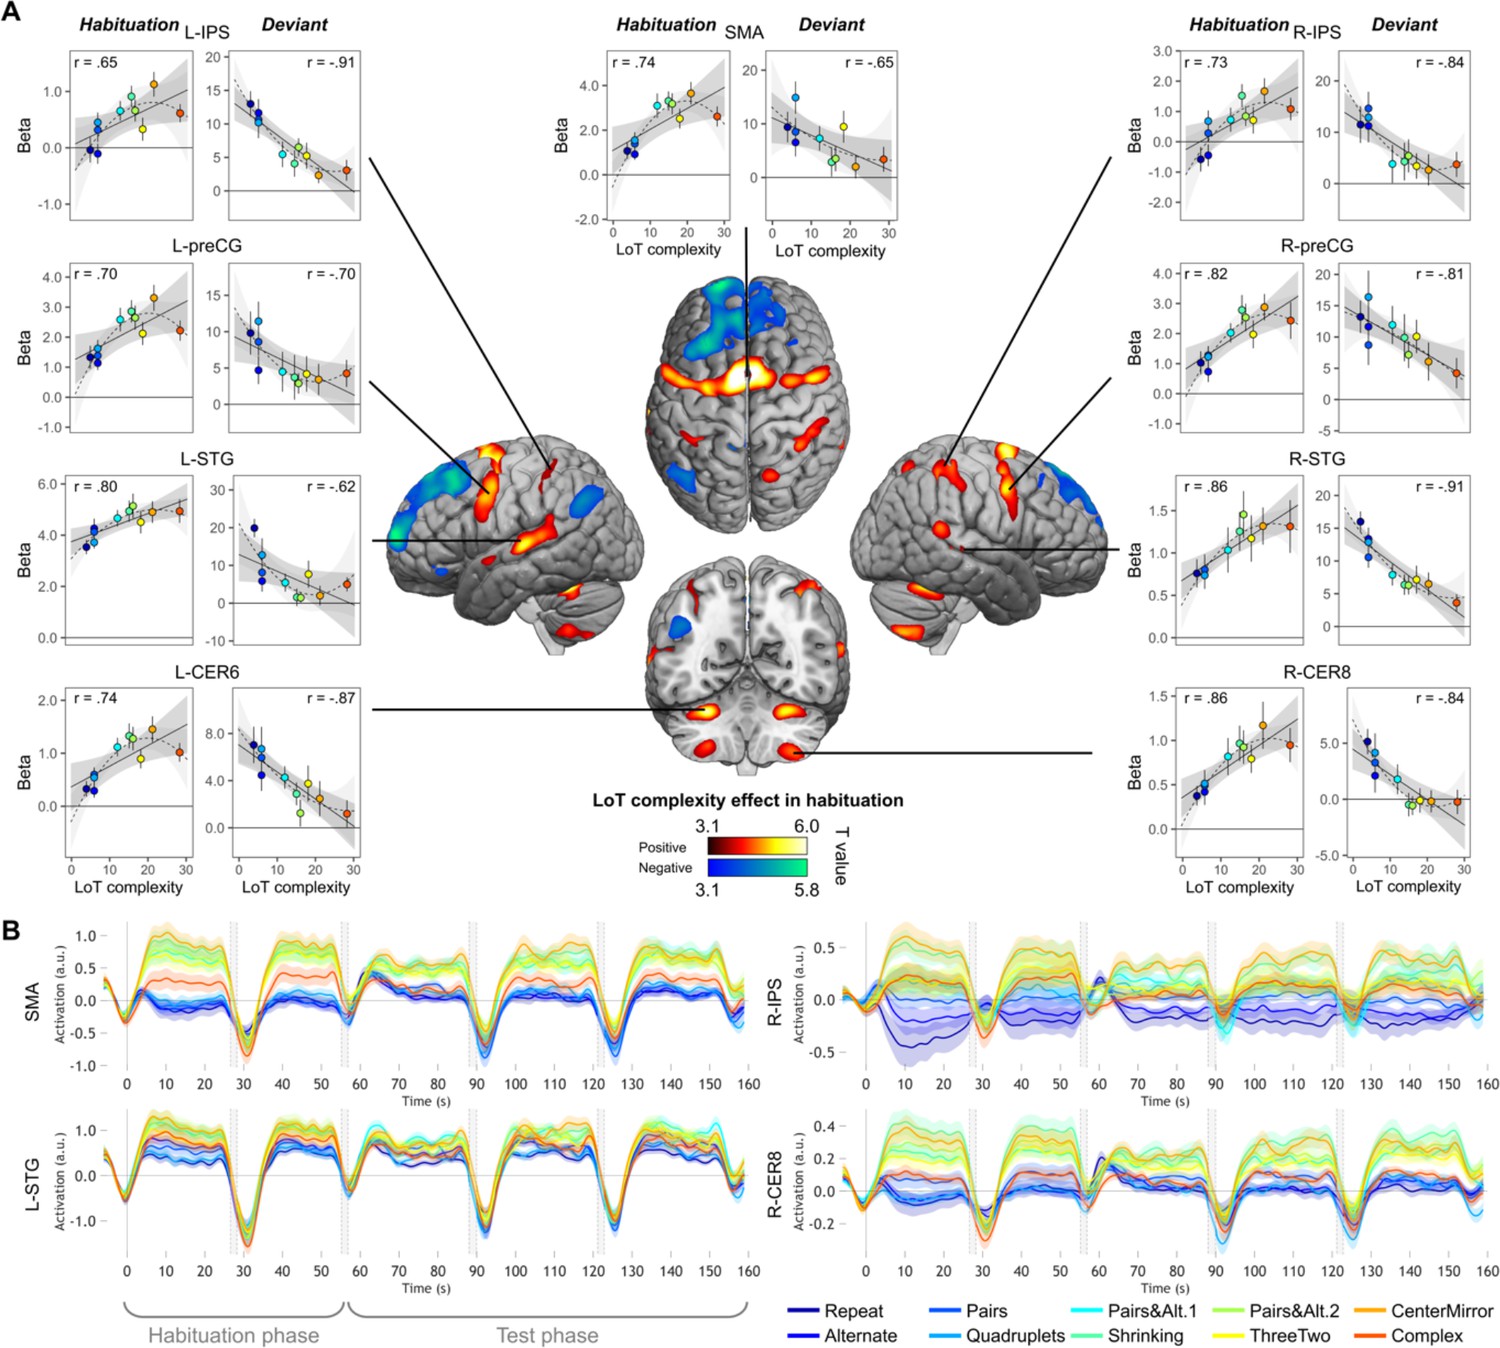
Sequence complexity in the proposed language of thought (LoT) modulates fMRI responses.
(A) Brain areas showing an increase (hot colors) or a decrease (cold colors) in activation with sequence LoT complexity during habituation (voxel-wise p<0.001, uncorrected; cluster-wise p<0.05, FDR corrected). Scatterplots represent the group-averaged activation for each of the ten sequences as a function of their LoT complexity (left panels: habituation trials; right panels, deviant trials) in each of nine regions of interest (ROIs). Data values are from a participant-specific ROI analysis. Error bars represent SEM. Linear trends are represented by a solid line (with 95% CI in dark gray) and quadratic trend by a dashed line (with 95% CI in light gray). Pearson linear correlation coefficients are also reported. (B) Time course of group-averaged BOLD signals for each sequence, for four representative ROIs. Each mini-session lasted 160 s and consisted of 28 trials divided into 5 blocks (2×5 habituation and 3×6 test trials), interspersed with short rest periods of variable duration (depicted in light gray). The full time course was reconstituted by resynchronizing the data at the onset of each successive block (see Materials and methods). Shading around each time course represents one SEM.
Figure 3—figure supplement 1

Positive (hot colors) and negative (cold colors) effects of language of thought (LoT) complexity effects on standard trials (voxel-wise p<0.001, uncorrected; cluster-wise p<0.05, FDR corrected).
Figure 3—figure supplement 2
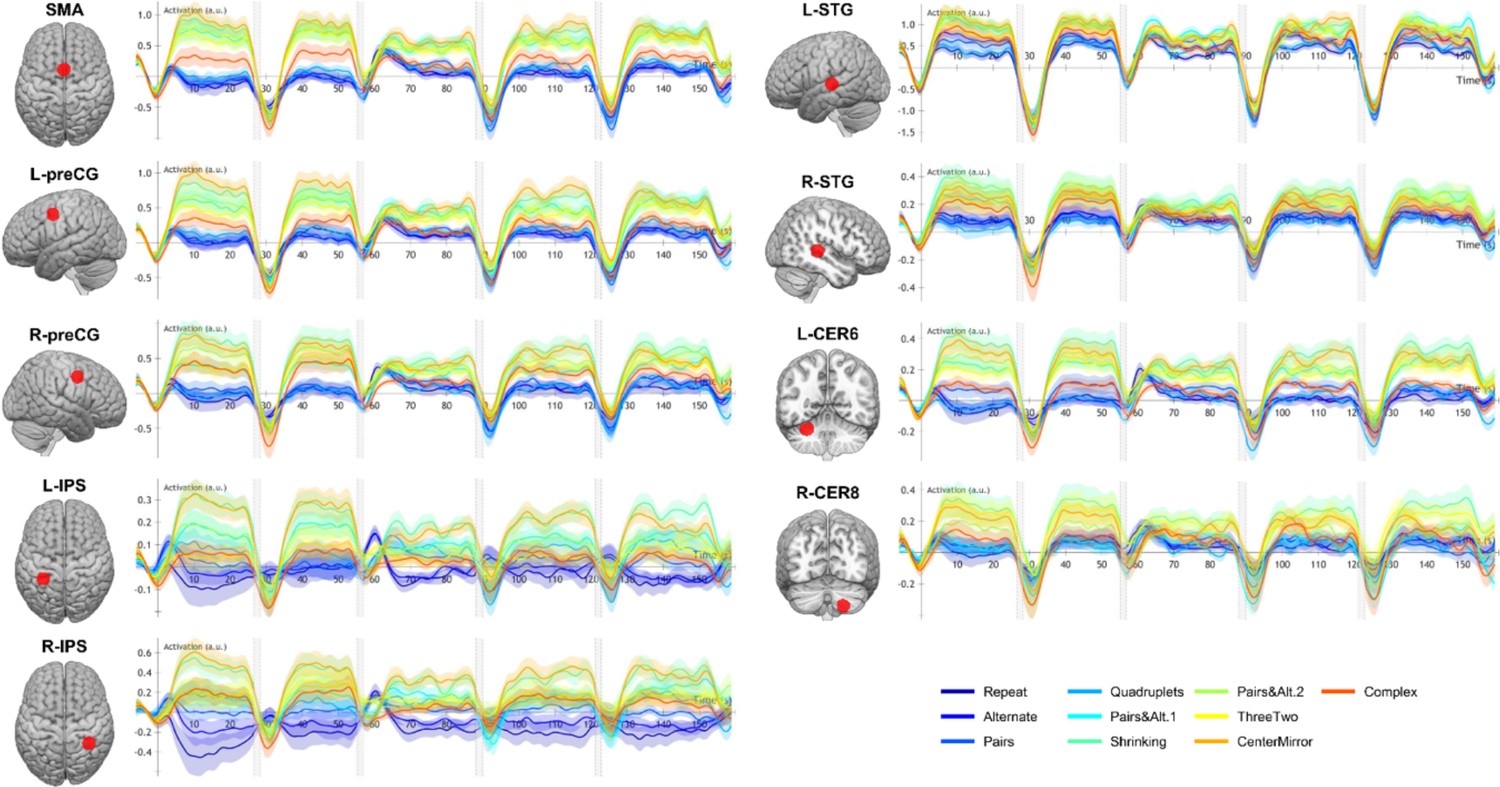
Time course of group-averaged BOLD signals for each sequence in nine regions of interest (ROIs) where a language of thought (LoT) complexity effect was found.
Each mini-session lasted 160 s and was composed of five blocks (two habituation and three tests) interspersed with short rest periods of variable duration (depicted in light gray). The full time course was reconstituted by resynchronizing the data at the onset of each successive block (see Materials and methods). Shading around each time course represents one SEM.
Figure 4

Brain responses to deviants decrease with language of thought (LoT) complexity.
Colors indicate the brain areas whose activation on deviant trials decreased significantly with complexity, in two distinct general linear models (GLMs): one in which all deviant stimuli were modeled (red), and one in which only correctly detected deviant stimuli were modeled (green) (voxel-wise p<0.001, uncorrected; cluster-wise p<0.05, FDR corrected). Overlap is shown in yellow.
Figure 5
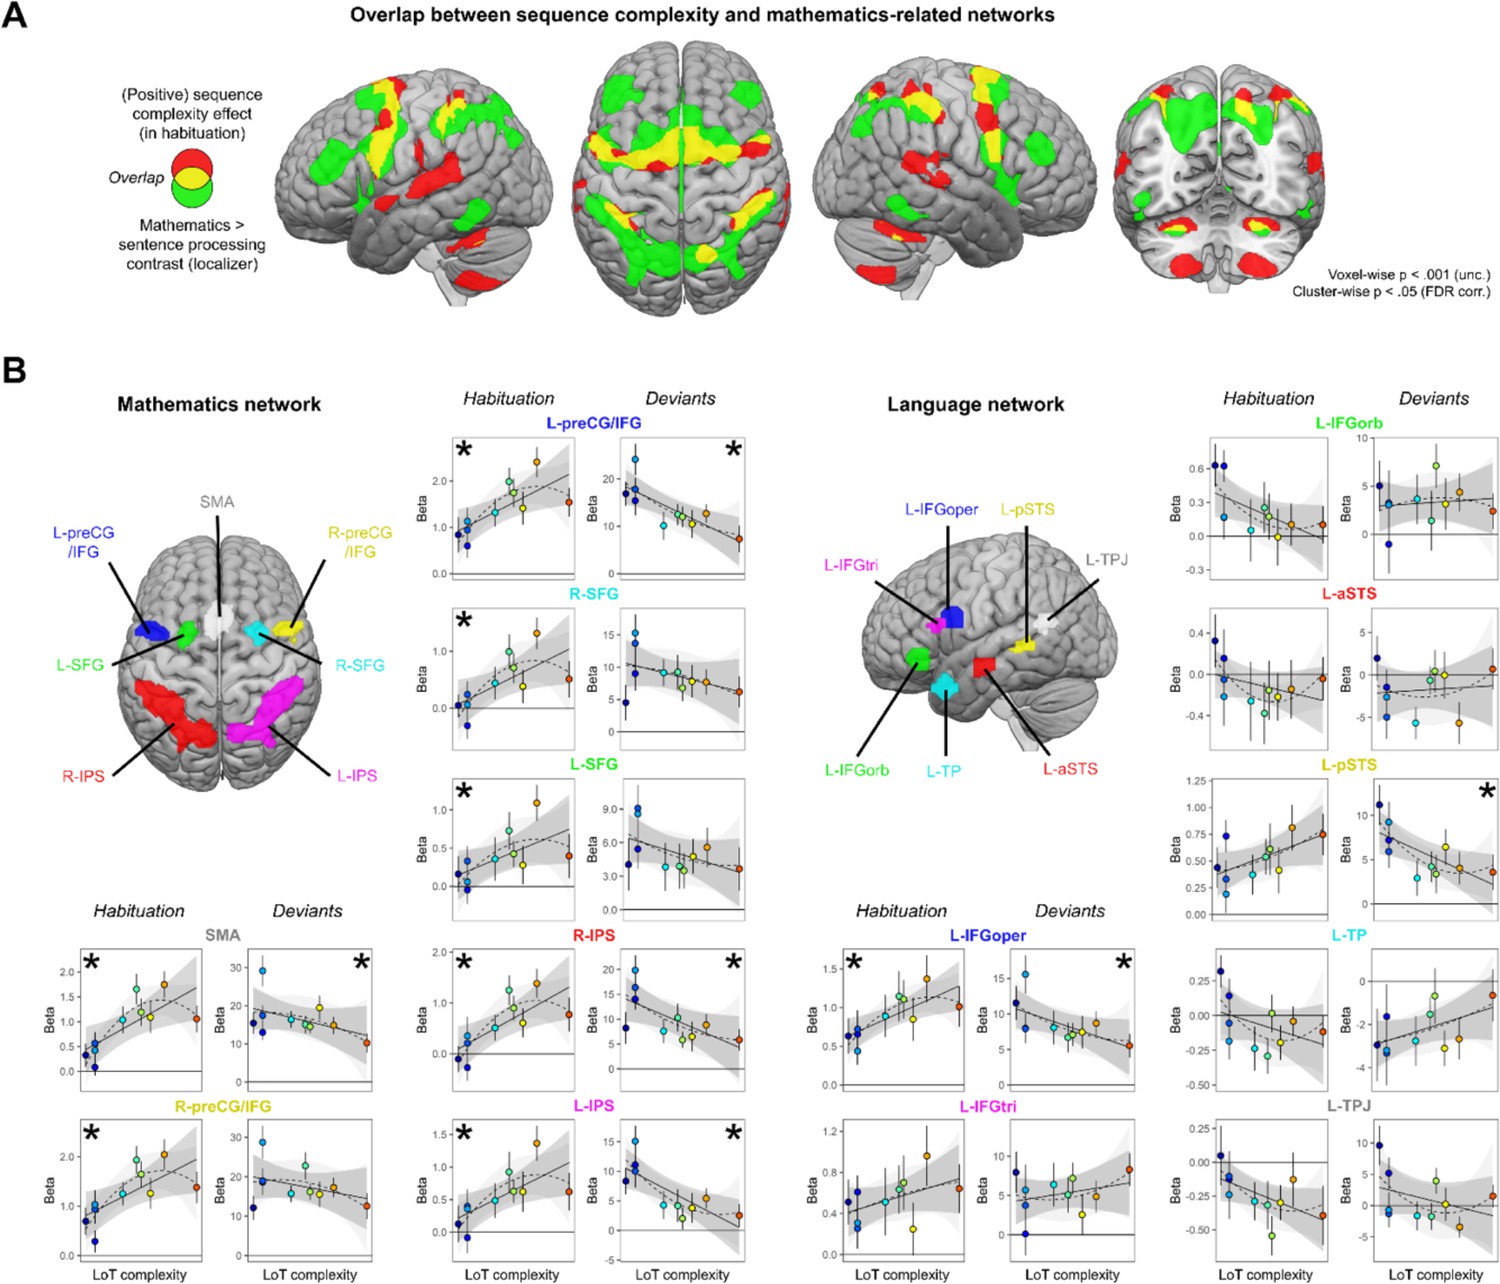
Sequence complexity effects in mathematics and language networks.
(A) Overlap between the brain areas showing an increase of activation with sequence language of thought (LoT) complexity during habituation in the main experiment (in red) and the brain areas showing an increased activation for mathematical processing (relative to simple listening/reading of non-mathematical sentences) in the localizer experiment (in green; both maps thresholded at voxel-wise p<0.001 uncorrected, cluster-wise p<0.05, FDR corrected). Overlap between the two activation maps is shown in yellow. (B) Overview of the seven search volumes representing the mathematics network (left) and the seven search volumes representing the language network (right) used in the region-of-interest (ROI) analyses. Within each ROI, each scatter plot represents the group-averaged activation for each of the 10 sequences according to their LoT complexity, for habitation blocks and for deviant trials (same format as Figure 3). A star (*) indicates significance of the linear effect of LoT complexity in a linear mixed-effects model.
Figure 6 with 4 supplements
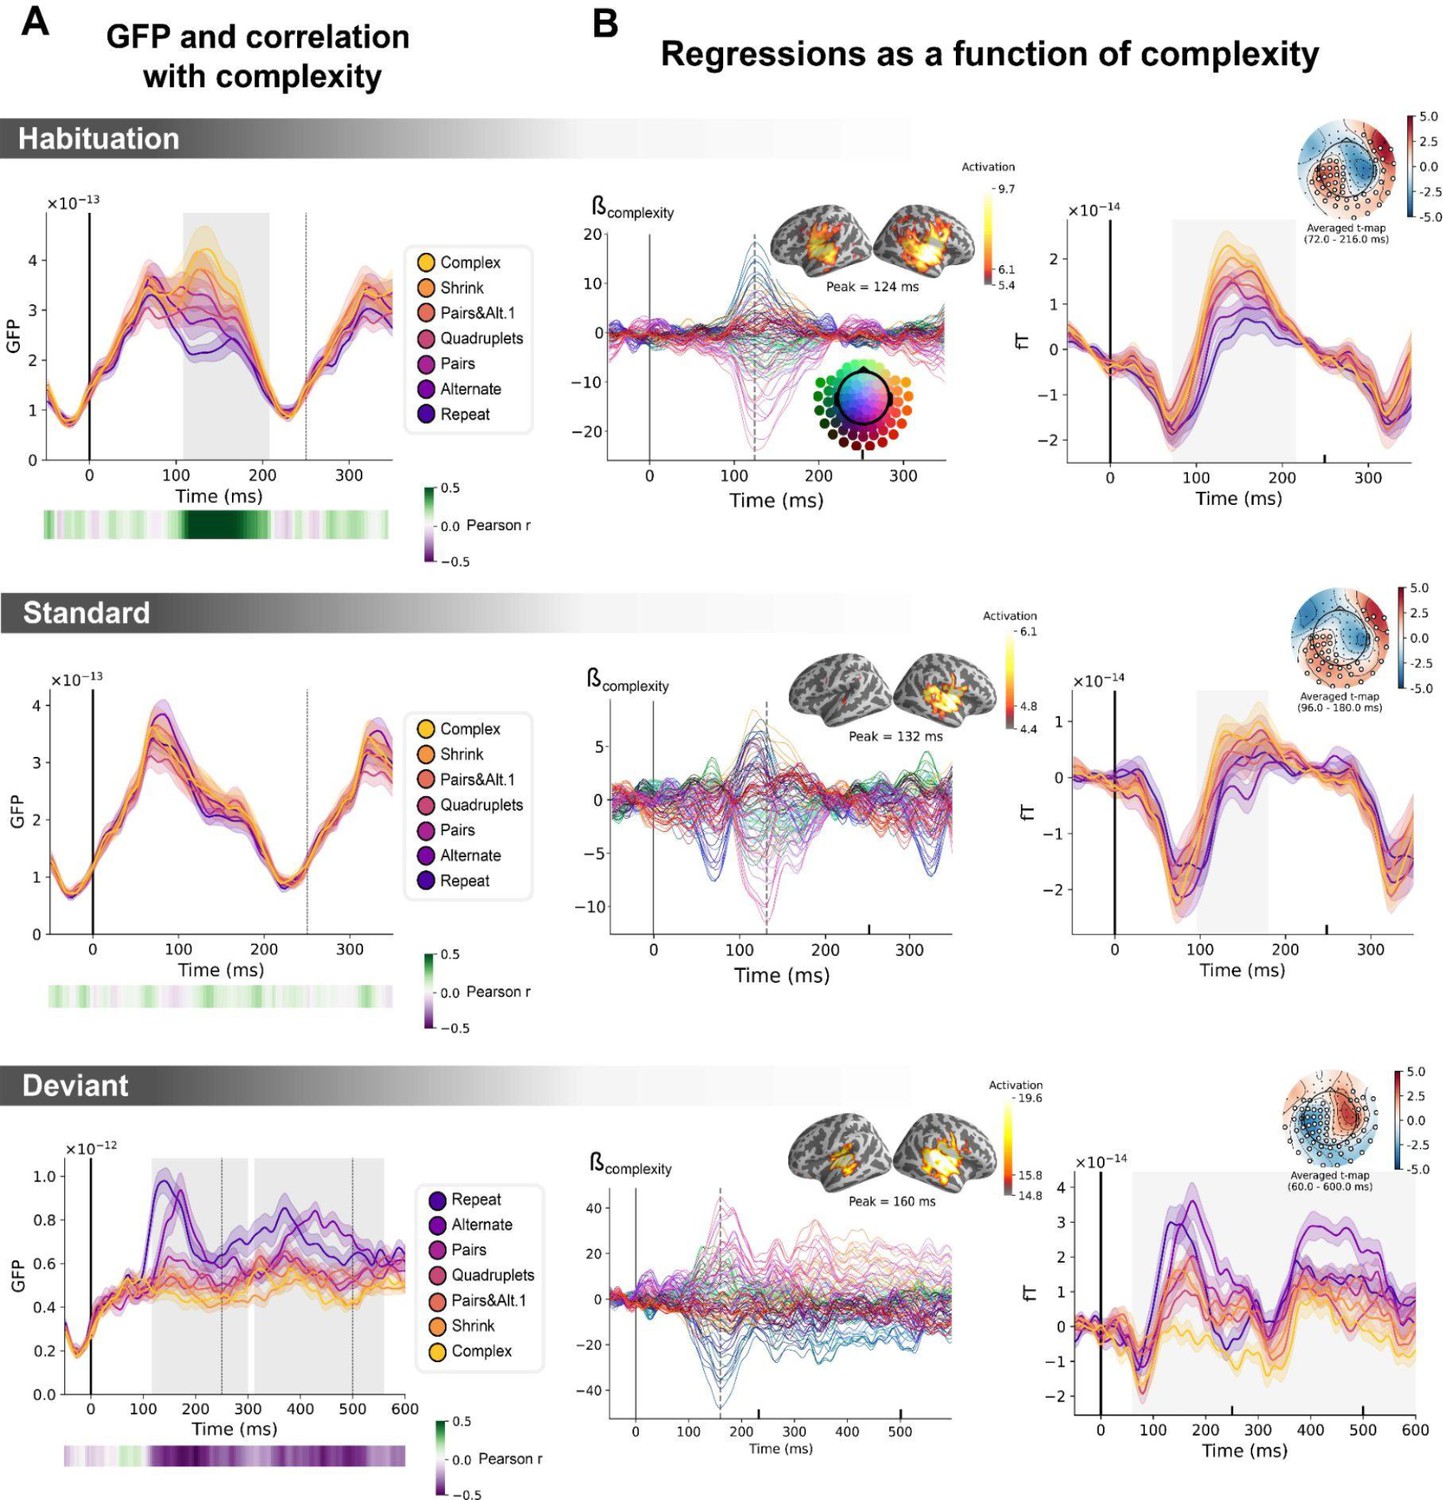
Sequence complexity in the proposed language of thought (LoT) modulates magneto-encephalography (MEG) signals to habituation, standard, and deviant trials.
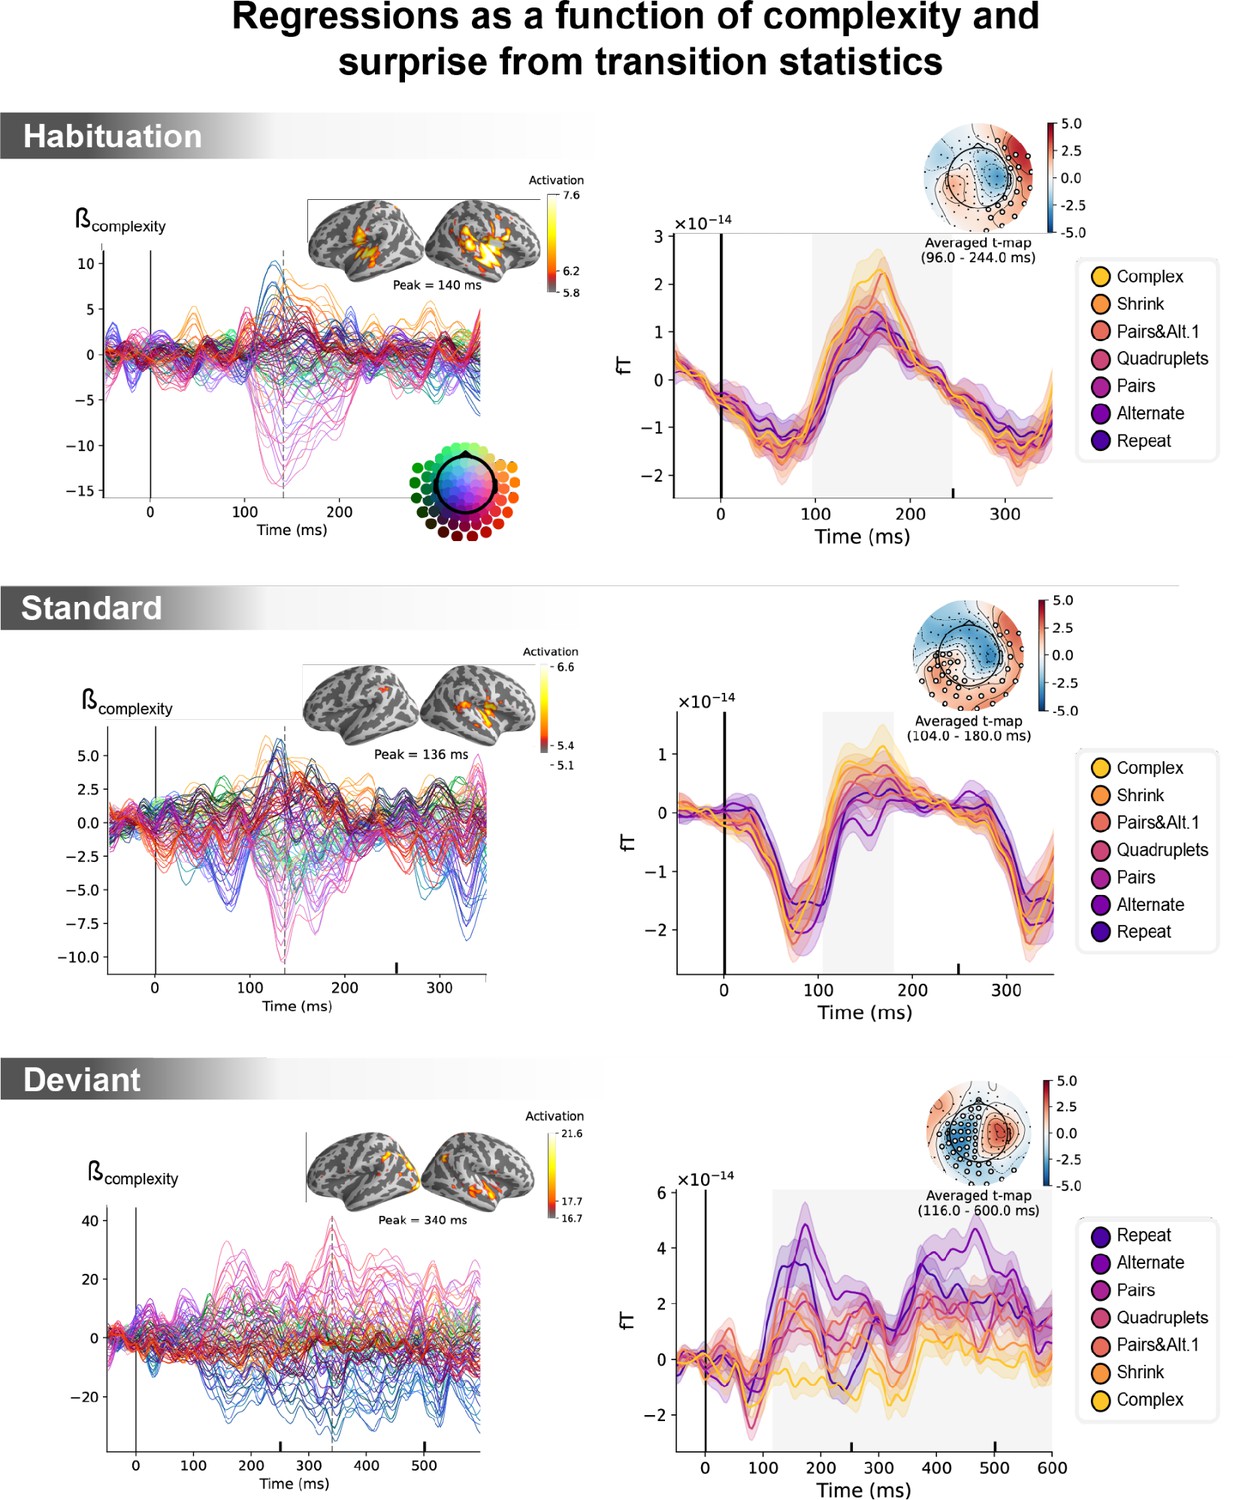
(A) Global field power computed for each sequence (see color legend) from the evoked potentials of the habituation, standard, and deviant trials. 0 ms indicates sound onset. Note that the time window ranges until 350 ms for habituation and standard trials (with a new sound onset at S0A=250 ms), and until 600 ms for deviant trials and for the others. Significant correlation with sequence complexity was found in habituation and deviant GFPs and are indicated by the shaded areas. (B) Regressions of MEG signals as a function of sequence complexity. Left: amplitude of the regression coefficients β of the complexity regressor for each MEG sensor. Insets show the projection of those coefficients in source space at the maximal amplitude peak, indicated by a vertical dotted line. Right: spatiotemporal clusters where regression coefficients were significantly different from 0. While several clusters were found (see text and Figure 6—figure supplement 3), for the sake of illustration, only one is shown for each trial type. The clusters involved the same sensors but on different time windows (indicated by the shaded areas) and with an opposite t-value for deviant trials. Neural signals were averaged over significant sensors for each sequence type and were plotted separately.
Figure 6—figure supplement 1
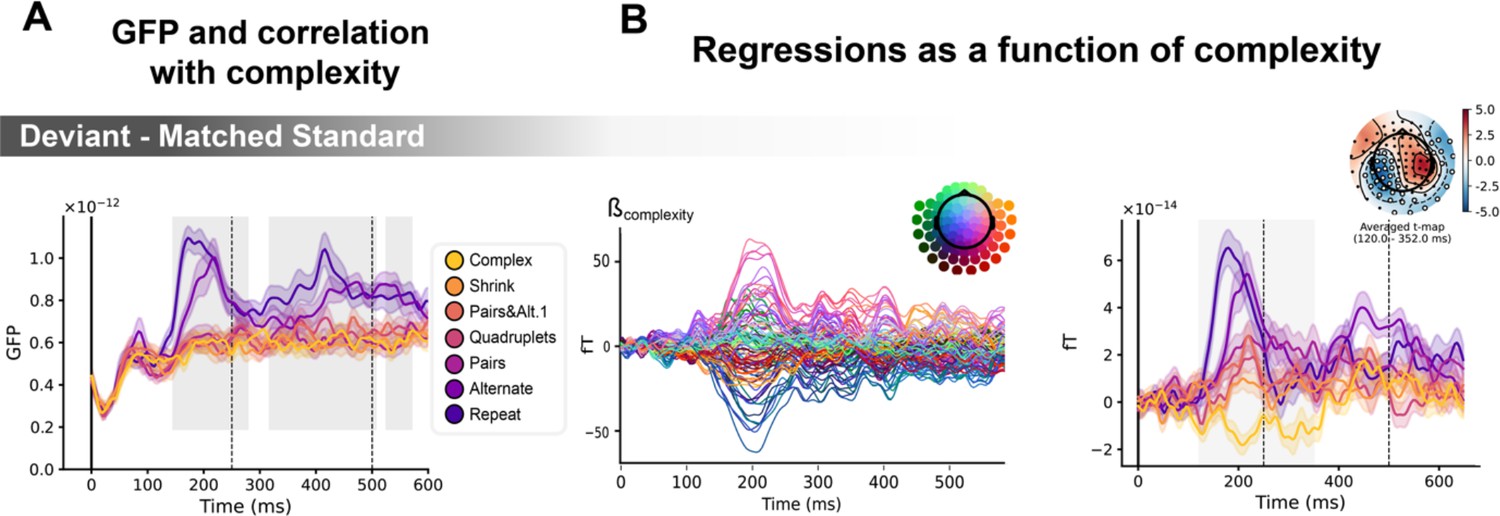
Sequence complexity modulates the contrast of deviant / matched standard trials.
(A) Global field power computed for the deviant / matched standard contrast for each sequence (see color legend). 0 ms indicates sound onset. Significant correlation with sequence complexity is indicated by the shaded areas. (B) Regressions of contrast as a function of sequence complexity. Left: amplitude of the regression coefficients β of the complexity regressor for each magneto-encephalography (MEG) sensor. Right: spatiotemporal clusters where regression coefficients were significantly different from 0. Two clusters were found, the sake of illustration, only one is shown here. Unsurprisingly, the clusters involved the same sensors as in Figure 6. Neural signals were averaged over significant sensors for each sequence type and were plotted separately.
Figure 6—figure supplement 2
Unconfounding the effects of statistical surprise and sequence complexity on magneto-encephalography (MEG) signals.
Left: amplitude of the regression coefficients β of the complexity regressor for each MEG sensor, in a general linear model where transition-based surprise, repetition, and alternation were also modeled. Insets show the projection of these coefficients on the source space for its maximal amplitude value, indicated by the vertical dotted lines. Right: illustration of spatiotemporal clusters where regression coefficients were significantly different from 0. The time windows identified by the permutation test are indicated by the shaded areas and have an opposite t-value for deviant trials. Neural signals were averaged over the cluster sensors for each sequence type and were plotted separately (see color legend). Note that the time window goes until 600 ms for deviant trials and until 350 ms for the other trials.
Figure 6—figure supplement 3
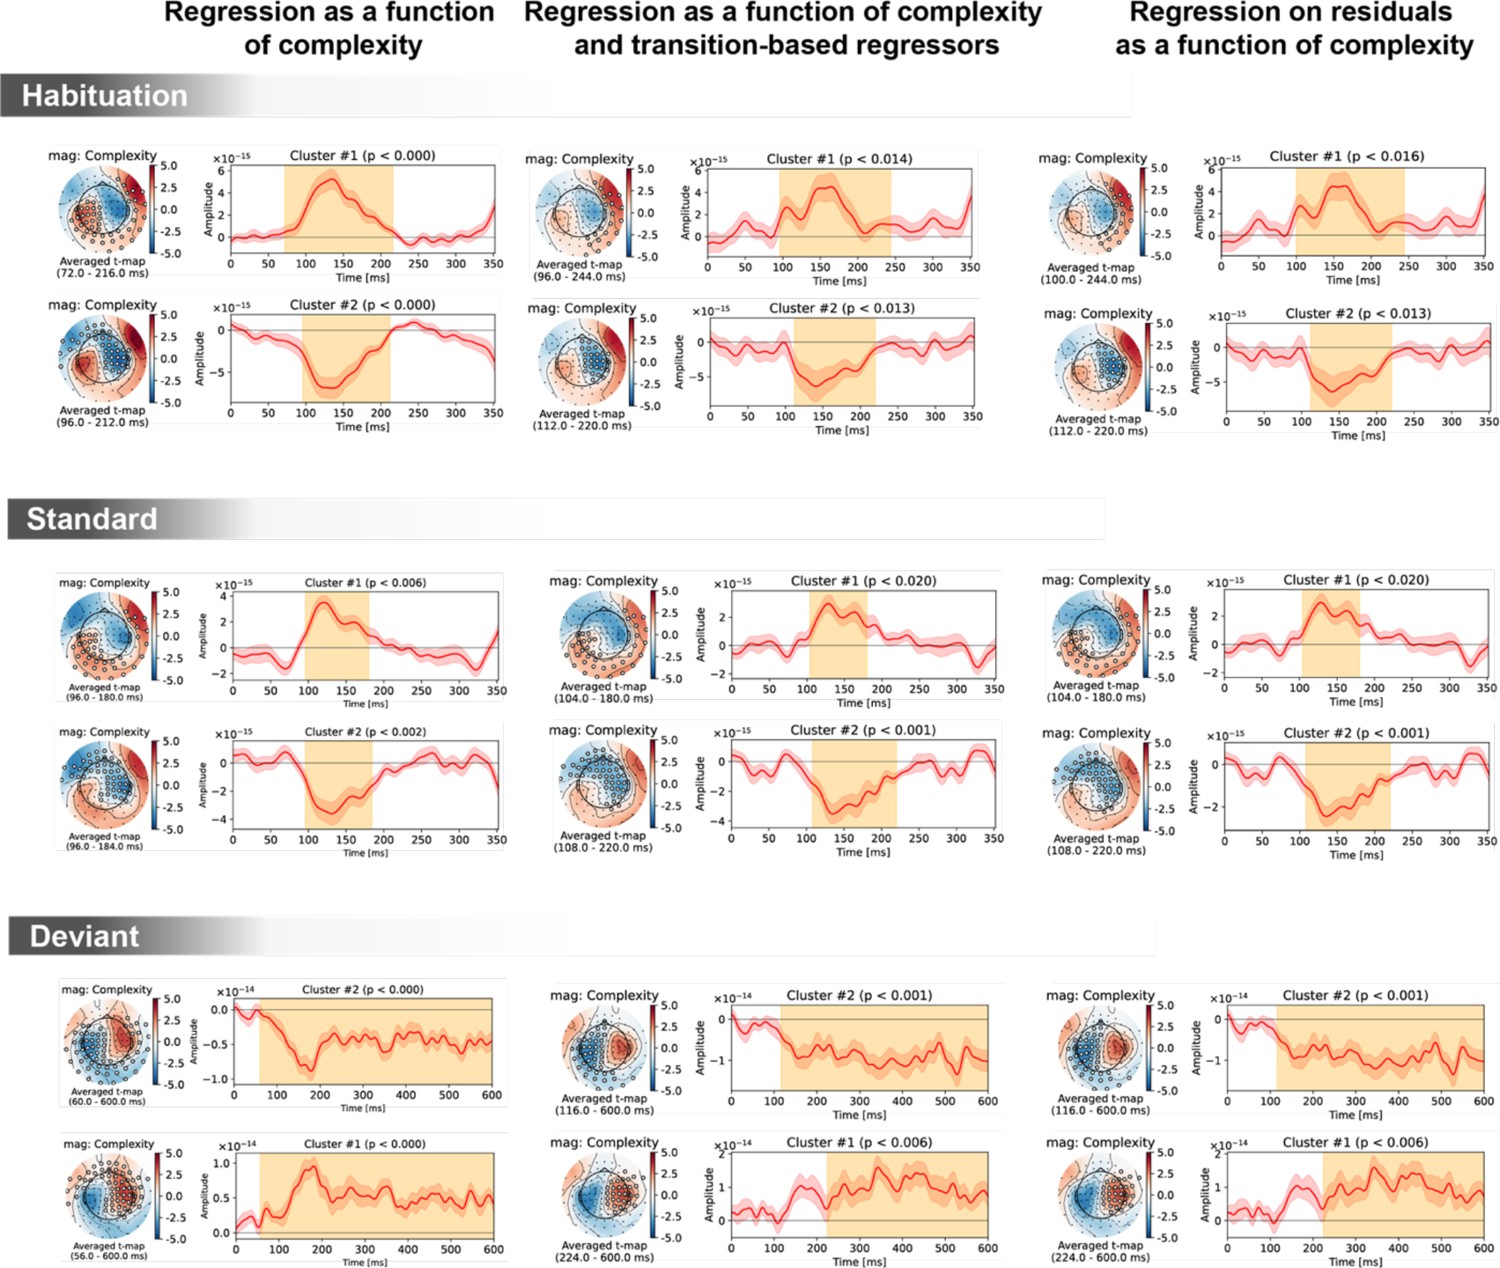
Spatiotemporal clusters for the complexity regressor in sensor space, shown separately for the three trial types (habituation, standard, deviant) and three general linear models of magneto-encephalography (MEG) signals: with complexity alone (left column); with complexity, transition-based surprise and repeat/alternate (middle column); and with complexity after regressing out transition-based surprise and repeat/alternate signals.
The clusters are very similar in all three cases, suggesting a robust effect of complexity irrespectively of transition statistics.
Figure 6—figure supplement 4
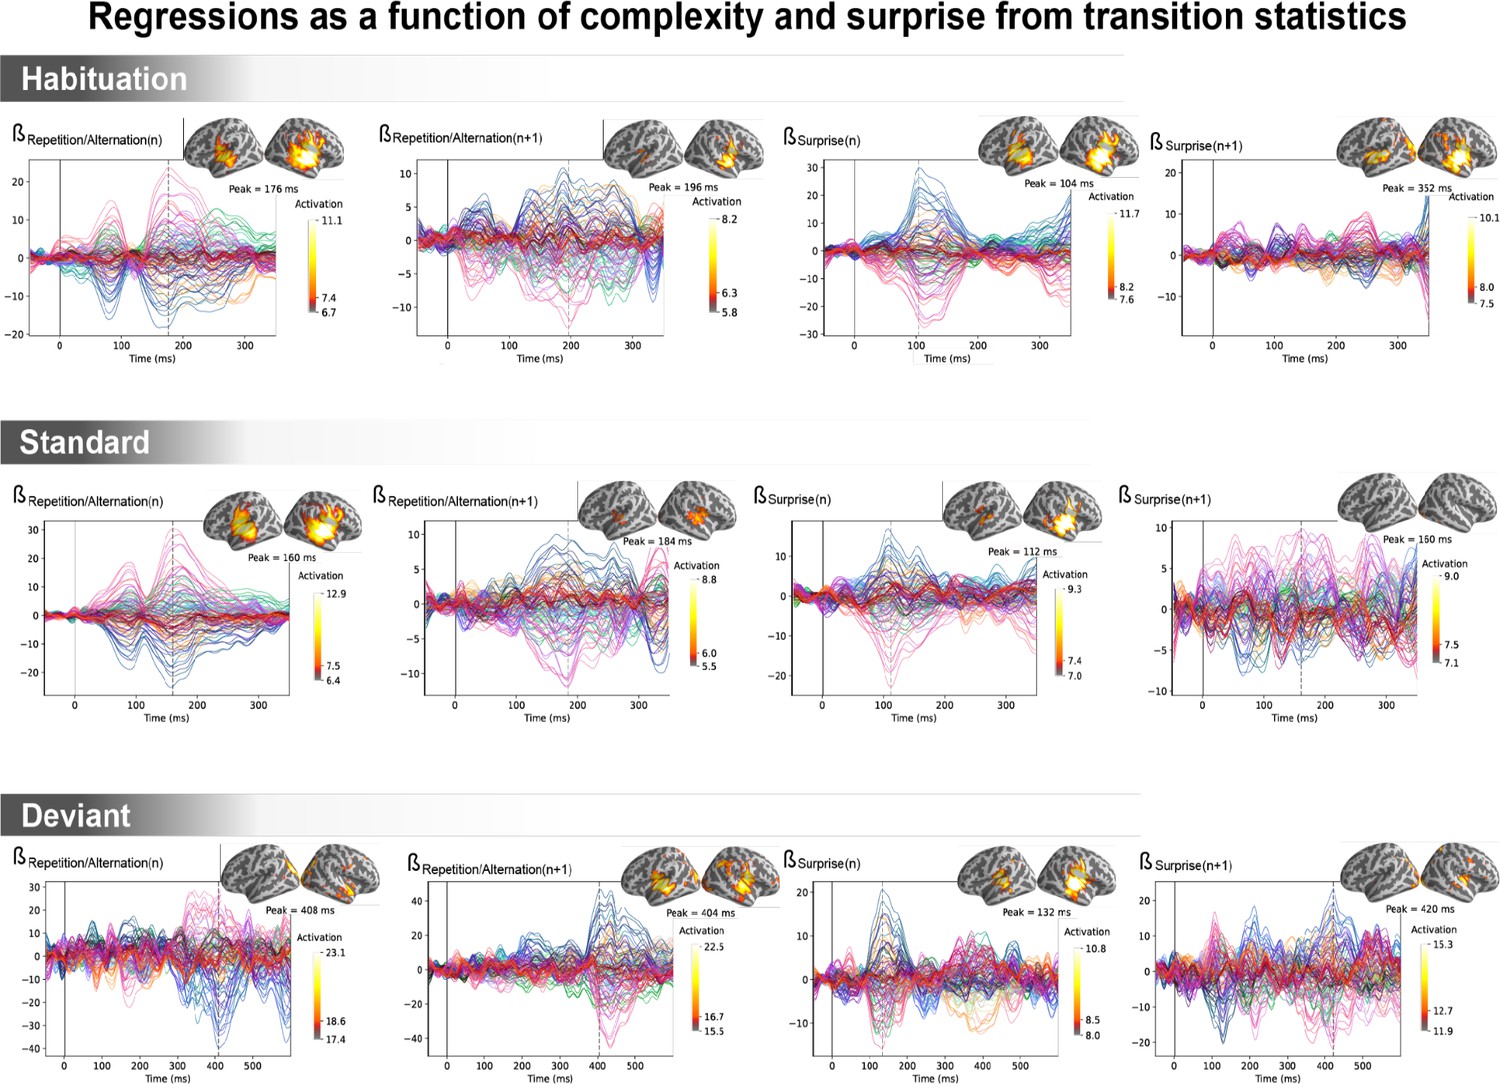
Amplitude of the regression coefficient β for each magneto-encephalography (MEG) sensor for the four regressors of transition statistics: repetition/alternation for item n (presented at t=0 ms), repetition/alternation for item n+1 (presented at t=250 ms), transition-based surprise for item n, and transition-based surprise for item n+1.
The transition-based surprise predictor is computed using an ideal observer estimating surprise over 100 past observations. The projection on the source space at the time of its maximal amplitude is also shown.
Figure 7
Multivariate decoding of deviant trials from magneto-encephalography (MEG) signals, and its variation with sequence complexity.
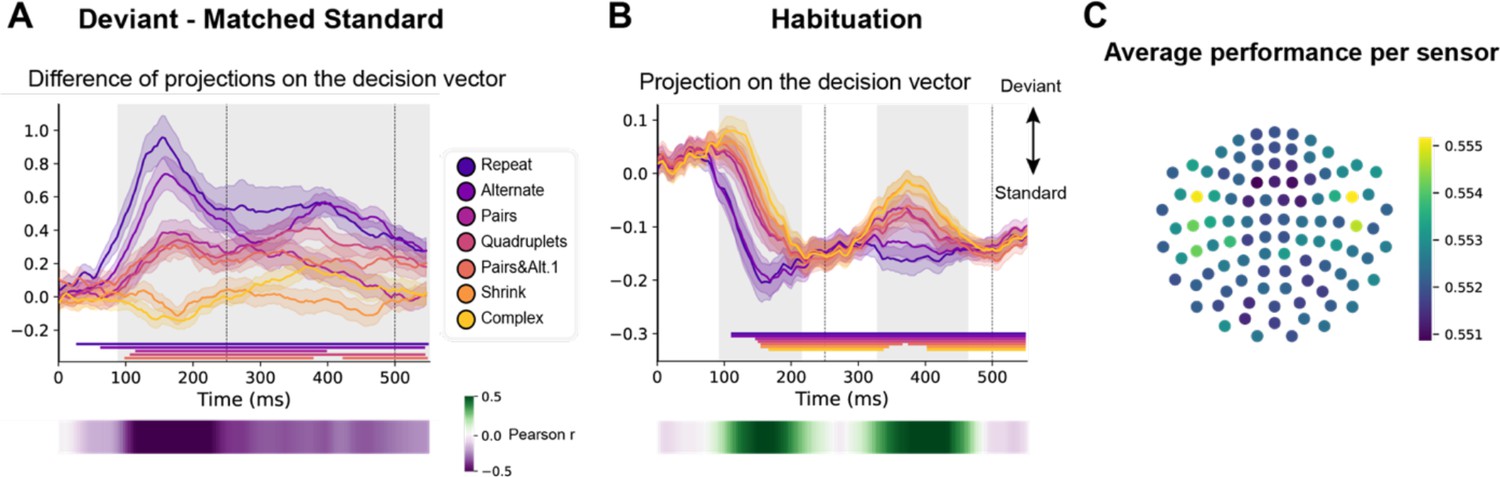
(A) A decoder was trained to classify standard from deviant trials from MEG signals at a given time point. We here show the difference in the projection on the decision vector for standard and deviant trials, that is a measure of the decoder’s accuracy. The decoder was trained jointly on all sequences, but its performance is plotted here for left-out trials separately for each sequence type. Shaded areas indicate s.e.m. and colored lines at bottom indicate the time windows identified by the temporal cluster-based permutation test (p<0.05 corrected) obtained from cluster-based permutation test on the full window. The heatmap at the bottom represents the correlation of the performance with sequence complexity (Pearson’s r). The gray shaded time window in the main graph indicates the time window identified by the two-tailed p<0.05, temporal cluster-based permutation test. (B) Projection on the decision vector for habituation trials. The early brain response is classified as deviant but later as standard. This projection time course is increasingly delayed as a function of sequence complexity (same format as A). (C) Sensor map showing the relative contribution of each sensor to overall decoding performance. At the time of maximal overall decoding performance (165 ms) we trained and tested 4000 new decoders that used only a subset of 40 gradiometers at 20 sensor locations. For each sensor location, the color on the maps in the right column indicates the average decoding performance when this sensor location was used in decoding, thus assessing its contribution to overall decoding.
Figure 8
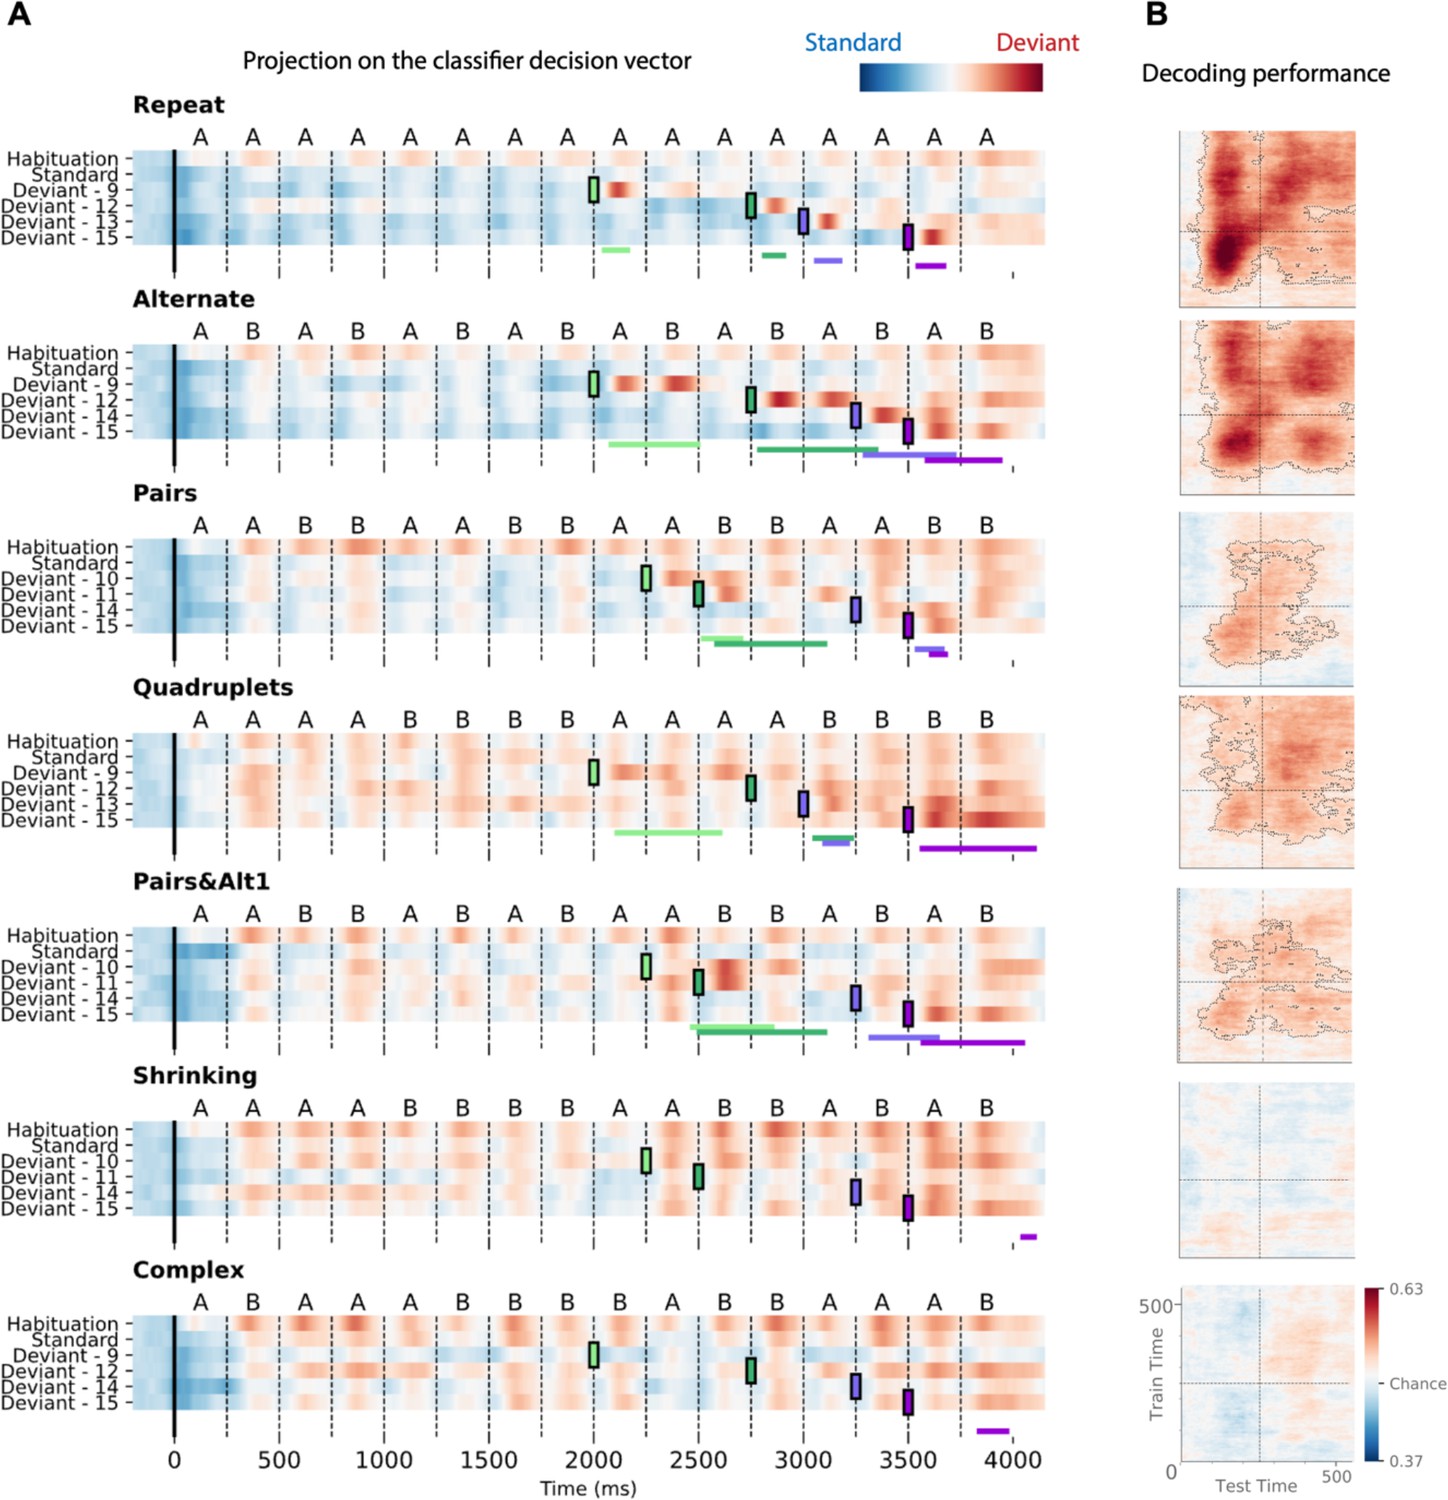
Time course of the deviancy decoder across the different types of sequences and deviant positions.
(A) Average projection of magneto-encephalography (MEG) signals onto the decoding axis of the standard/deviant decoder. For each sequence, the time course of the projection was computed separately for habituation trials, standard trials, and for the four types of trials containing a deviant at a given position. The figure shows the average output of decoders trained between 130 and 210 ms post-deviant. Red indicates that a trial tends to be classified as a deviant, blue as a standard. Colored lines at the bottom of each graph indicate the time windows obtained from the cluster permutation test comparing deviants and standards in a 0–600 ms window after deviant onset. (B) Average generalization-across-time (GAT) matrices showing decoding performance as a function of decoder training time (y axis) and testing time (x axis). Vertical and horizontal lines indicate the onset of the next tone. The dashed lines outline p<0.05 cluster-level significance, corrected for multiple comparisons (see Materials and methods). Simpler sequences exhibit overall greater and more sustained performance. We note that, while deviancy detection does not reach significance for Shrinking and Complex sequences in the GAT matrices, violation signals reached significance for deviant position 15.
Author response image 1
Author response image 2

Author response image 3

Author response image 4

Author response image 5
Author response image 6
Tables
Table 1
Coordinates of brain areas modulated by language of thought (LoT) complexity during habituation.
| Positive LoT complexity effect in habituation trials | ||||||||
|---|---|---|---|---|---|---|---|---|
| Region | H | k | p(unc.) | p(FWE-corr) | T | x | y | z |
| Supplementary motor area, precentral gyrus, superior frontal gyrus (dorsolateral), middle frontal gyrus | L/R | 8991 | <0.0001 | <0.0001 | 6.62 | 1 | 5 | 65 |
| <0.0001 | <0.001 | 5.82 | 8 | 12 | 49 | |||
| <0.0001 | <0.05 | 5.59 | 27 | 5 | 52 | |||
| Lobule VIII of cerebellar hemisphere | L | 1411 | <0.0001 | <0.0001 | 6.19 | 22 | 68 | 53 |
| Lobule VI and Crus I of cerebellar hemisphere | L | 939 | <0.0001 | <0.001 | 5.97 | 29 | 56 | 28 |
| Superior temporal gyrus, middle temporal gyrus | L | 2022 | <0.0001 | <0.05 | 5.56 | 68 | 23 | 5 |
| <0.0001 | <0.05 | 4.80 | 59 | 35 | 12 | |||
| <0.0001 | 0.213 | 4.25 | 55 | 42 | 23 | |||
| Lobule VI of cerebellar hemisphere | R | 1216 | <0.0001 | <0.05 | 5.45 | 27 | 58 | 27 |
| Lobule VIII of cerebellar hemisphere | L | 1549 | <0.0001 | <0.05 | 5.04 | 22 | 67 | 53 |
| <0.0001 | 0.118 | 4.44 | 33 | 54 | 55 | |||
| Superior temporal gyrus | R | 1039 | <0.0001 | <0.05 | 4.93 | 48 | 30 | 3 |
| <0.0001 | <0.05 | 4.79 | 67 | 44 | 17 | |||
| <0.001 | 0.880 | 3.55 | 69 | 23 | 3 | |||
| Postcentral gyrus, Inferior parietal gyrus | R | 1478 | <0.0001 | <0.05 | 4.79 | 36 | 46 | 56 |
| <0.0001 | 0.061 | 4.63 | 46 | 35 | 61 | |||
| <0.0001 | 0.170 | 4.33 | 46 | 32 | 47 | |||
| Superior parietal gyrus, Precuneus | R | 547 | <0.0001 | 0.085 | 4.54 | 17 | 67 | 58 |
| <0.001 | 0.792 | 3.65 | 24 | 60 | 42 | |||
| Inferior parietal gyrus, Postcentral gyrus | L | 1570 | <0.0001 | 0.106 | 4.47 | 31 | 42 | 44 |
| <0.0001 | 0.149 | 4.37 | 45 | 35 | 38 | |||
| <0.0001 | 0.530 | 3.90 | 40 | 42 | 61 | |||
| Negative LoT complexity effect in habituation trials | ||||||||
| Region | H | k | p(unc.) | p(FWE-corr) | T | x | y | z |
| Superior frontal gyrus (dorsolateral, medial, medial orbital), middle frontal gyrus | L/R | 12366 | <0.0001 | <0.001 | 5.86 | 19 | 67 | 12 |
| <0.0001 | <0.05 | 5.42 | 29 | 25 | 47 | |||
| <0.0001 | <0.05 | 5.33 | 6 | 44 | 58 | |||
| Middle cingulate and paracingulate gyri, precuneus | L | 1444 | <0.0001 | <0.05 | 5.26 | 1 | 33 | 51 |
| Angular gyrus | L | 1530 | <0.0001 | 0.060 | 4.63 | 43 | 65 | 37 |
| <0.001 | 0.816 | 3.63 | 33 | 54 | 24 | |||
| <0.001 | 0.938 | 3.45 | 27 | 82 | 44 | |||
| IFG pars orbitalis | L | 522 | <0.0001 | 0.354 | 4.07 | 52 | 35 | 14 |
| <0.0001 | 0.473 | 3.95 | 34 | 40 | 7 | |||
| <0.0001 | 0.645 | 3.80 | 27 | 33 | 16 |
Additional files
-
Supplementary file 1
Selected sequences.
The first column indicates the list of the different 16-item sequences used in the magneto-encephalography (MEG) and fMRI experiments. *Sequences used only in the fMRI experiment. The second column provides the sequence description obtained from the LoT. The third column is its verbal description, meant to ease the understanding of the formal expression.
- https://cdn.elifesciences.org/articles/84376/elife-84376-supp1-v1.docx
-
Supplementary file 2
fMRI complexity effect on standard trials (voxel-wise p<0.001, uncorrected; cluster-wise p<0.05, FDR corrected).
- https://cdn.elifesciences.org/articles/84376/elife-84376-supp2-v1.docx
-
Supplementary file 3
fMRI complexity effect on deviant trials (voxel-wise p<0.001, uncorrected; cluster-wise p<0.05, FDR corrected).
- https://cdn.elifesciences.org/articles/84376/elife-84376-supp3-v1.docx
-
MDAR checklist
- https://cdn.elifesciences.org/articles/84376/elife-84376-mdarchecklist1-v1.docx
Download links
A two-part list of links to download the article, or parts of the article, in various formats.
Downloads (link to download the article as PDF)
Open citations (links to open the citations from this article in various online reference manager services)
Cite this article (links to download the citations from this article in formats compatible with various reference manager tools)
Brain-imaging evidence for compression of binary sound sequences in human memory
eLife 12:e84376.
https://doi.org/10.7554/eLife.84376


