Neuroelectrophysiology-compatible electrolytic lesioning
- Department of Electrical Engineering, Stanford University, United States
- Department of Bioengineering, Stanford University, United States
- Department of Comparative Medicine, Stanford University, United States
- Department of Neurosurgery, Stanford University, United States
- Wu Tsai Neuroscience Institute, Stanford University, United States
- Bio-X, Stanford University, United States
Figures
Figure 1 with 1 supplement

The circuit diagram for the electrolytic lesioning device.
An op-amp is used in a negative feedback loop to maintain a constant current through the two electrodes in the brain (). The op-amp was implemented as suggested by its accompanying evaluation kit and supplied components. The system is powered by a 12 V power supply, and a boost converter is used to create a and - of 450 V and –450 V, respectively. The current through can be set by changing the resistance of the potentiometer, . is a hypothesized physiological parasitic component, which could be either resistive or capacitive (dashed box).
Figure 1—figure supplement 1
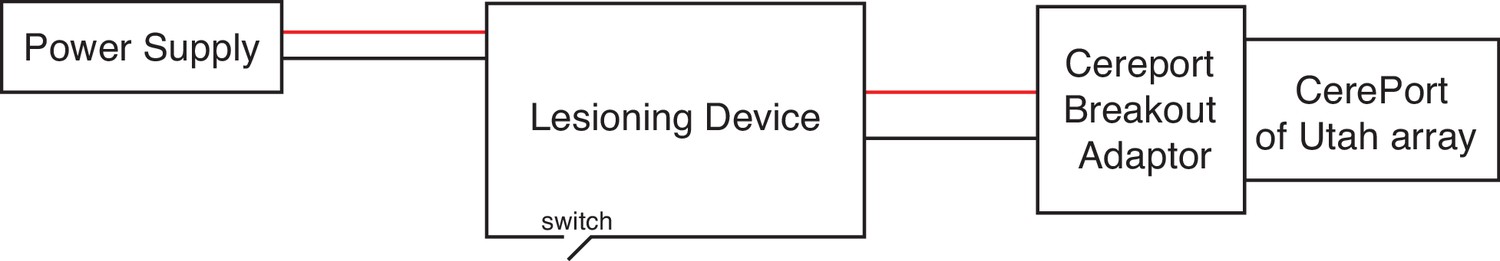
Connection diagram of the experimental setup for creating electrolytic lesions.
Figure 2 with 1 supplement
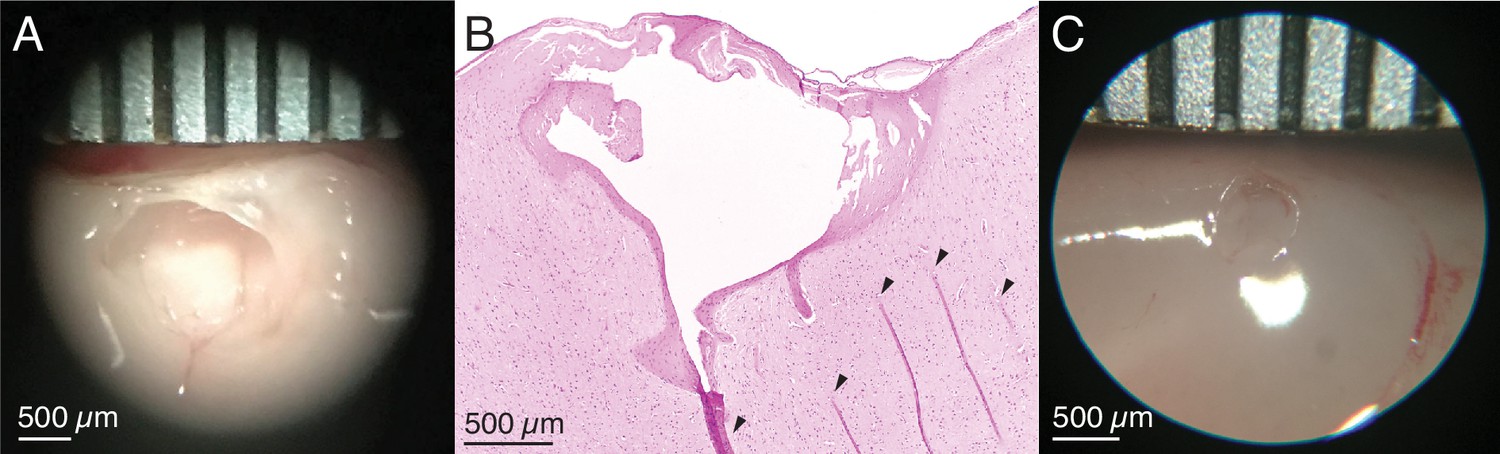
Ex vivo testing to calibrate lesion parameters.
(A) Ex vivo demonstration of the electrolytic lesion technique in unfixed sheep cerebral cortex using an intracortical Utah microelectrode array. Sustained delivery of 250 μA of direct current for 10 min between adjacent electrodes (400 μm spacing) resulted in a clean spheroidal cavitation in cortex approximately 1.5 mm in diameter. Ruler is marked every 500 μm. (B) Hematoxylin and eosin (H&E) stained slice of the lesion in (A) clearly shows the lesioned region. Arrows indicate tissue fold artifacts that resulted from the histology process, not the lesion. The other dark pink areas surrounding the cavitation in cortex are regions of necrosis. (C) A smaller ex vivo lesion in unfixed cerebral cortex of a pig created by decreasing the direct current amplitude and duration to 180 μA for 1 min. The cavitation has a diameter slightly over 0.5 mm.
Figure 2—figure supplement 1
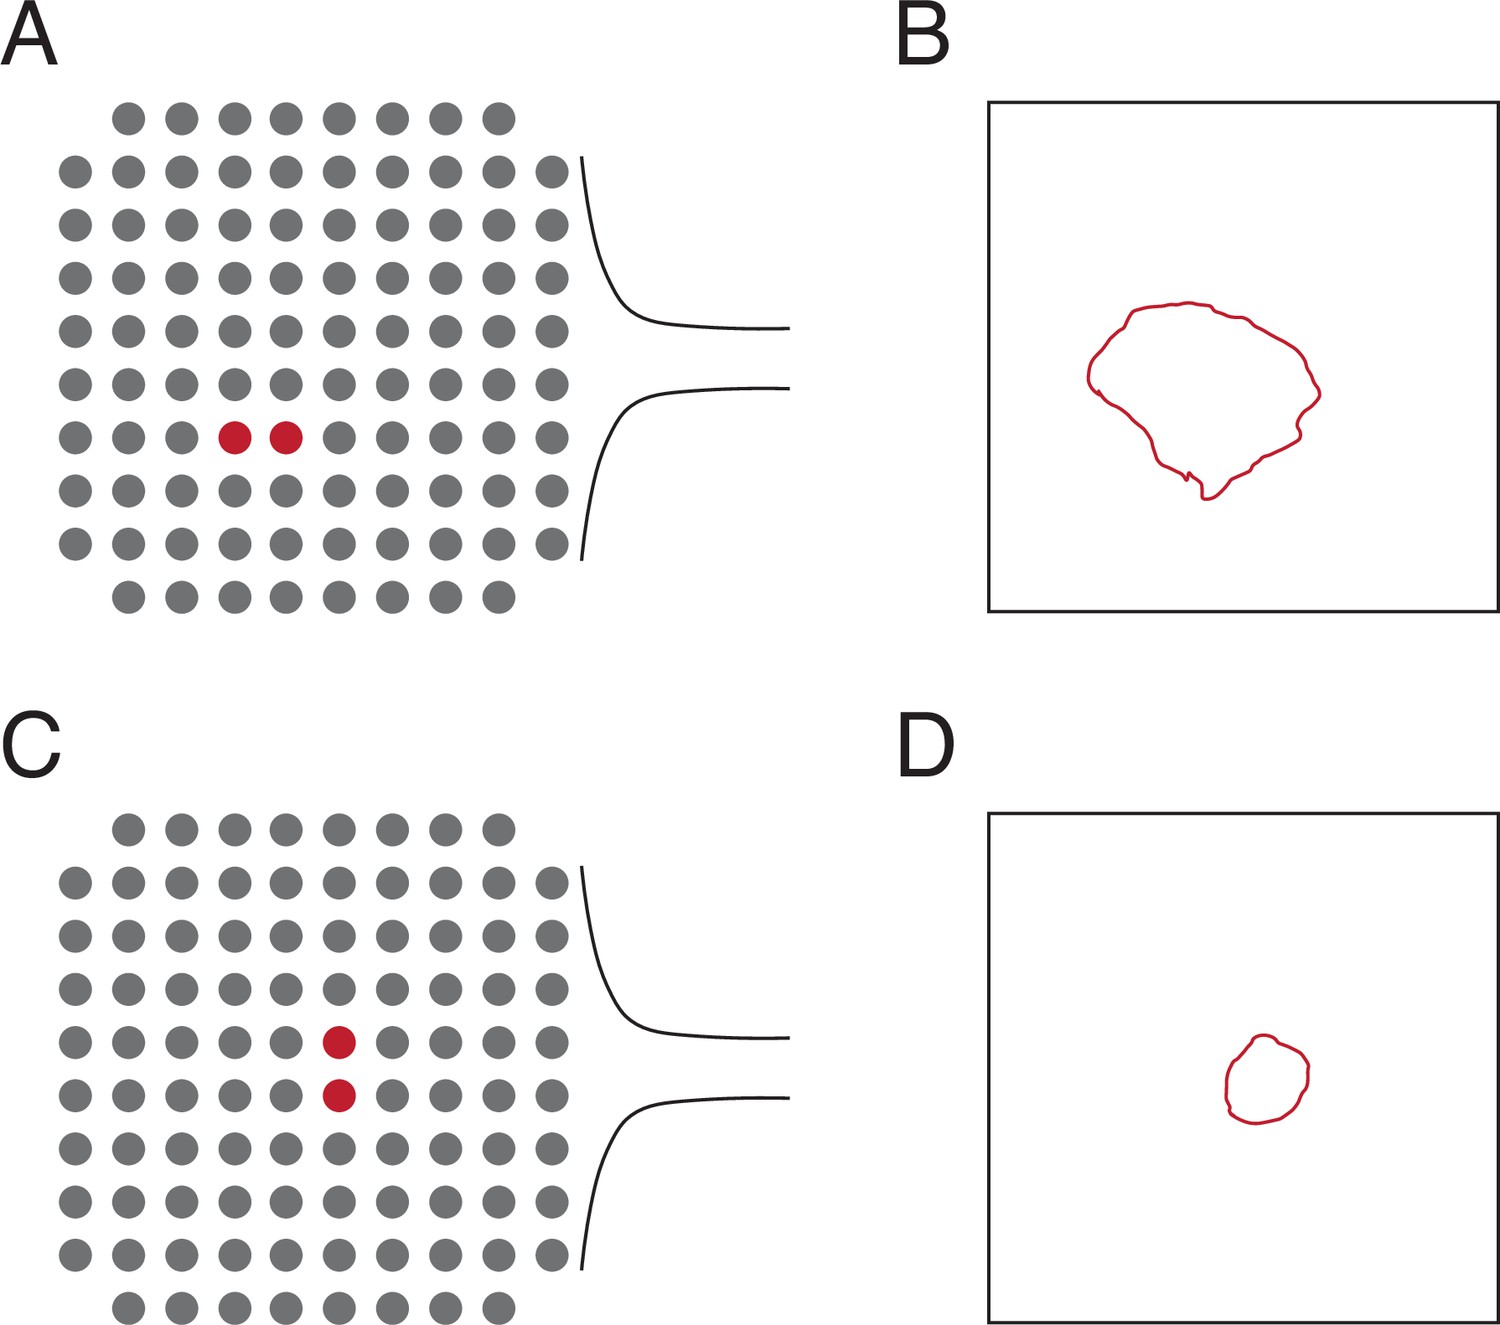
Locations of the electrodes used to lesion and the relative size ofthe lesion area to the array area for the testing in Figure 2.
(A) Diagram of the location of the twoelectrodes used to create the lesion in Figure 2A, B. (B) Area visible from the cortical surface of thelesion in Figure 2A, B relative to the area of a Utah array (4 mm × 4 mm). The exact location of thelesion relative to the array is unknown. (C) Diagram of the location of the two electrodes used tocreate the lesion in Figure 2C. (D) Area visible from the cortical surface of the lesion in Figure 2C relativeto the area of a Utah array. The exact location of the lesion relative to the array is unknown.
Figure 3 with 1 supplement
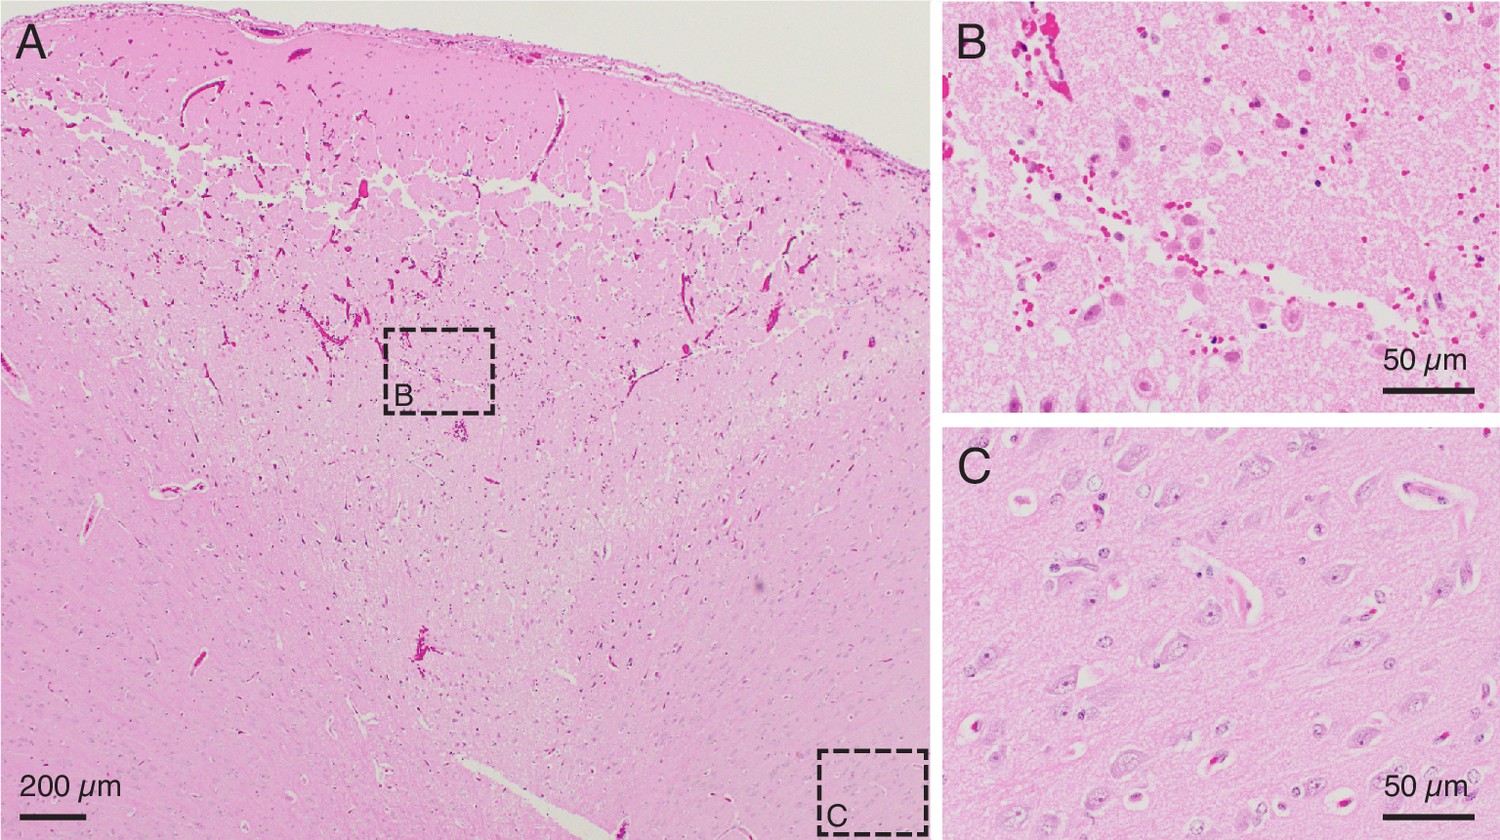
In vivo testing to further calibrate lesion parameters.
(A) H&E stained slice from an in vivo demonstration of the lesioning technique in pig cerebral cortex. 150 μA direct current passed through two adjacent electrodes (400 μm spacing) for 1 min resulted in a conical region of damaged parenchyma. The top of the conical region shows a line of damage which may be caused by physical removal of the microelectrode array after testing. Anatomically observed alterations are clearly demarcated, emphasizing the fine localization of the lesioning method. Note: An outline of the region of damaged parenchyma is shown in Figure 3—figure supplement 1. (B) Region of intermixed necrotic and histologically normal neurons within the conical zone of damage is visible in a close-up of the slice from (A). Necrotic neurons have shrunken cell bodies. The microelectrode array is expected to continue recording from remaining healthy neurons after performing a lesion. (C) Region of viable neurons outside the conical region of damage is visible in a close-up of the slice from (A). This shows the precise spread of the method, with intact, viable tissue present just outside the lesioned area.
Figure 3—figure supplement 1

The H&E stained slice from Figure 3A, with the conical region of damaged parenchyma outlined with a dashed white line for clarity.
As stated in the caption for Figure 3A, this is from an in vivo demonstration of the lesioning technique in pig cerebral cortex, when 150 μA direct current was passed through two adjacent electrodes (400 μm spacing) for 1 min. The conical region of damaged parenchyma (in white dashed line), is bounded on top by aline of damage which may be caused by physical removal of the microelectrode array after testing.
Figure 4
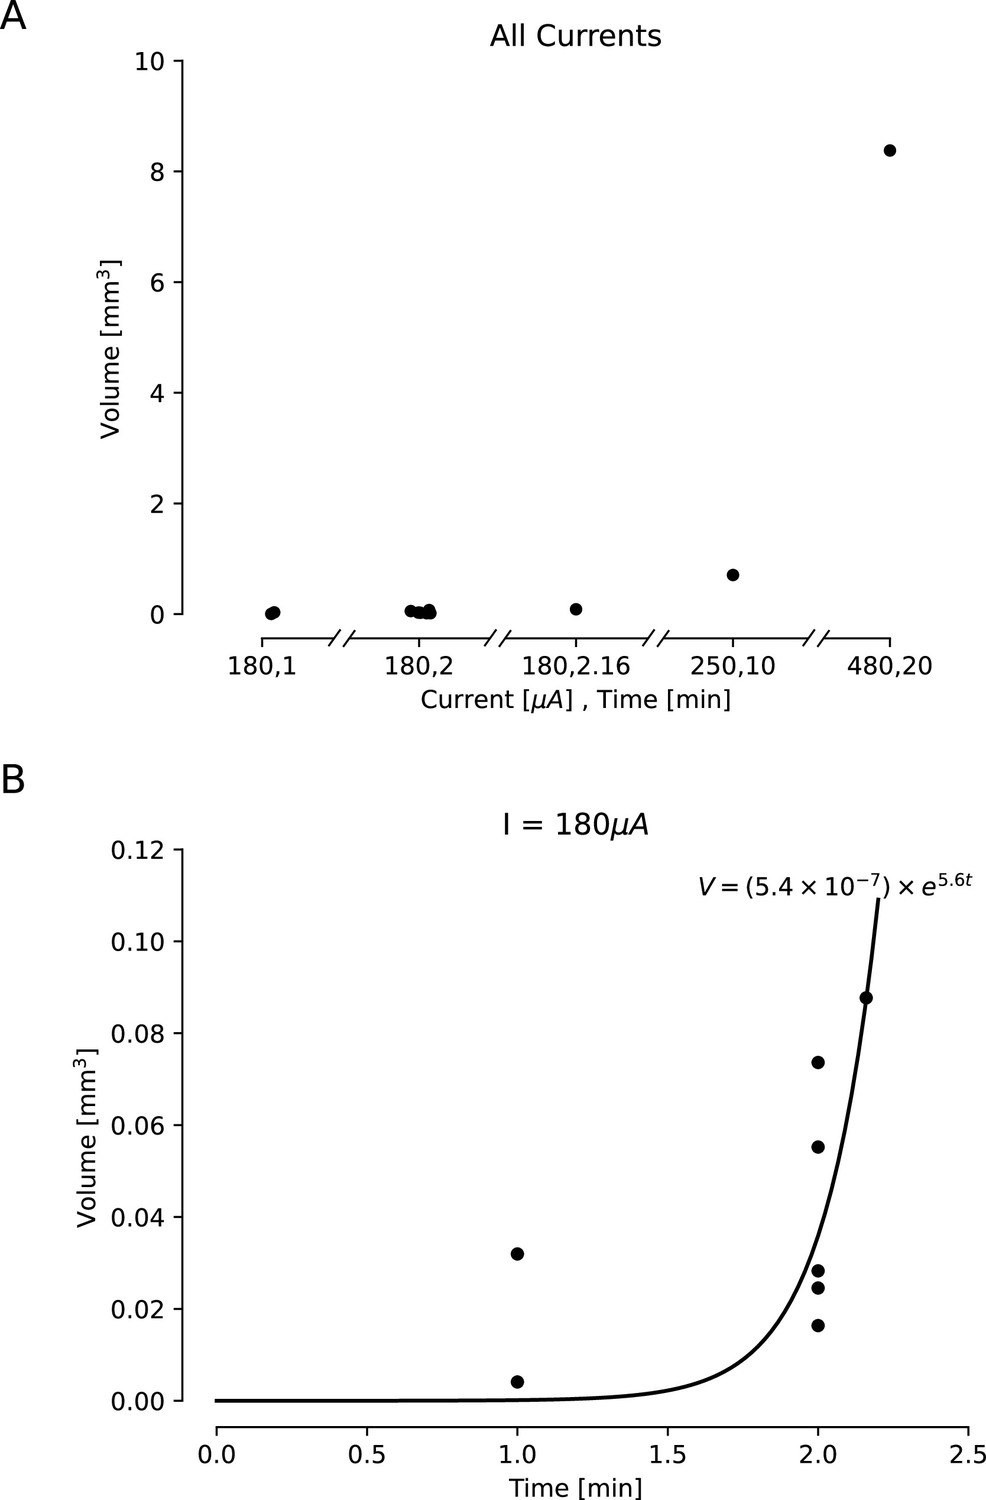
Estimated lesion volumes from lesions created in ex vivo sheep and pig cortex.
All volumes were cavitations in cortex and were estimated assuming a conical lesion volume. (A) Estimated volumes are shown with black dots for each direct current amplitude and duration pairing. (B) Estimated volumes are shown for a variety of durations of applied 180 μA direct current. A curve was fit to this line, showing an exponential relationship between duration of the current and lesion volume (,).
Figure 5
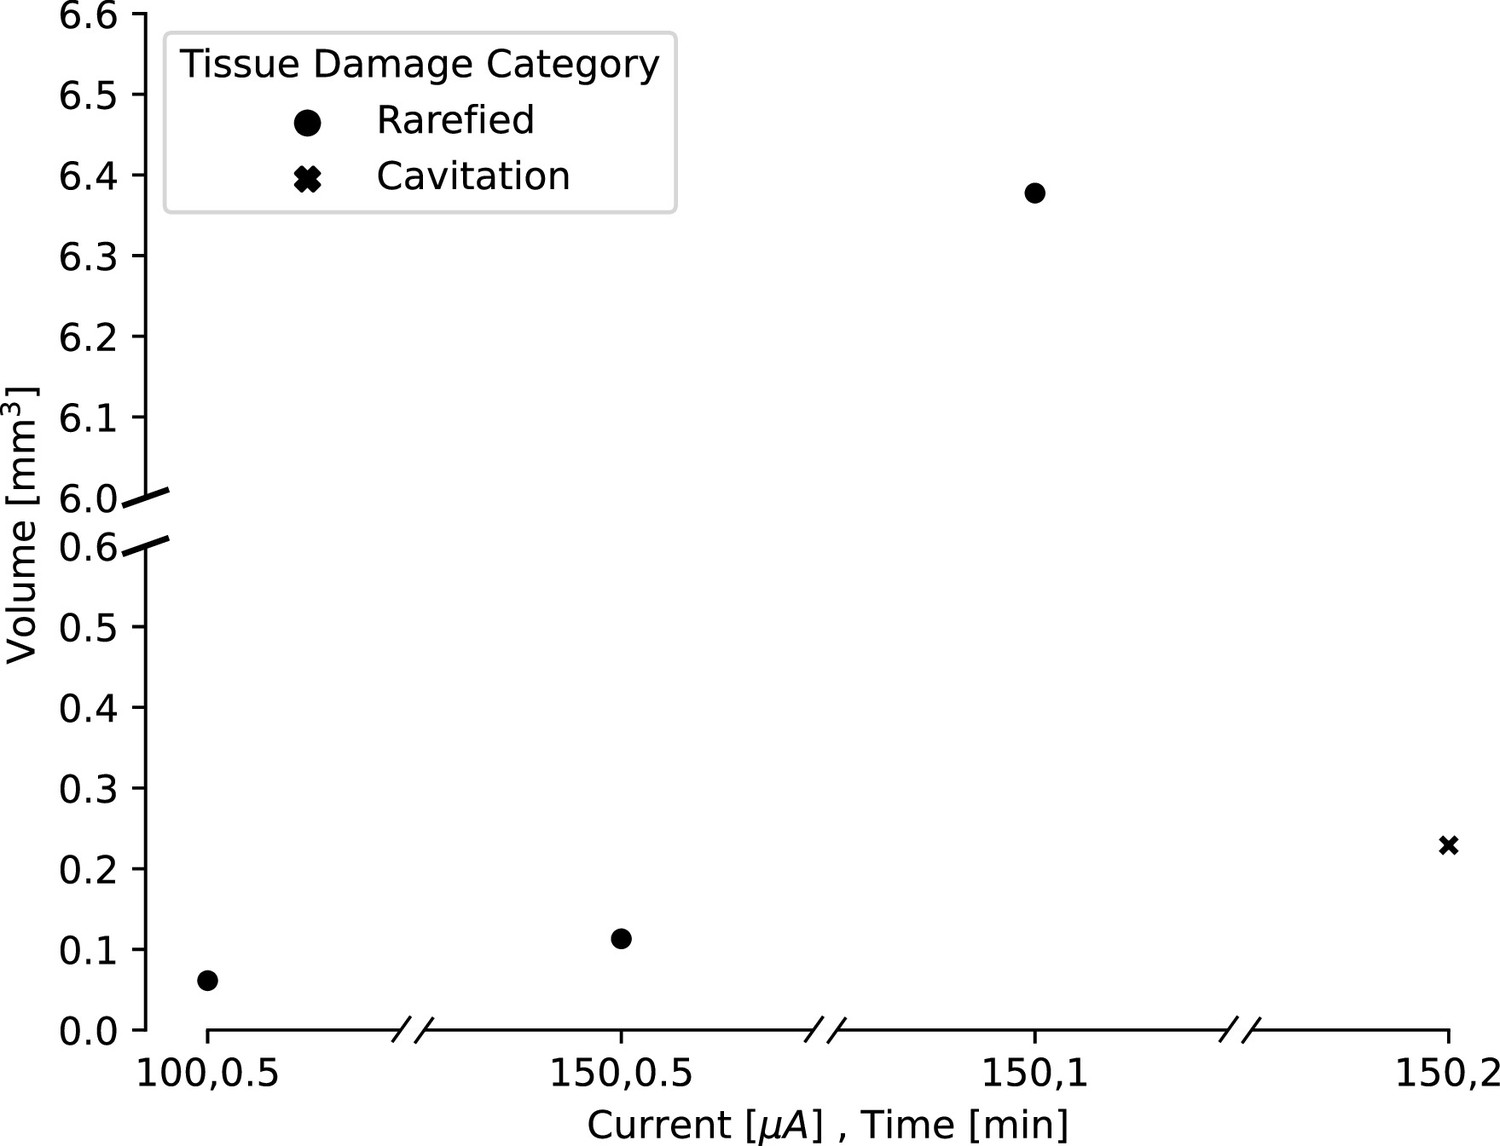
Estimated lesion volumes from lesions created in in vivo pig cortex for a subset of direct current amplitude and duration pairings.
For rarefied tissue damage, the lesion volume is indicated with a black dot, while for cavitation damage, the volume is indicated with a blue dot. Estimated lesion volumes were calculated from histology measurements and assumed a conical lesion volume (with the histology slice bisecting the volume), except for the lesion where 150 μA direct current was applied for 30 s, which was calculated as a spherical volume as indicated by the visually identified damage in the histology slice.
Figure 6

Voltage and current traces from seven representative lesions in an awake-behaving rhesus macaque (Monkey H).
Lesions are shown in chronological order and are labeled with an experimental ID in the form SYYMMDD, where S indicates the animal, followed by the date. Traces only capture the values while the lesioning device was turned on (45 s for most lesions and 50 s for lesion H200120). (A) Voltage traces. Discontinuity at the beginning of the traces indicates transient voltages that were too rapid to be captured by the voltmeter, lasting between 0.13 and 0.33 s. The fluctuating voltages, especially the rapid increase in voltage at the beginning of lesioning, emphasize the importance of using a current source to deliver consistent amounts of current into the brain. (B) Current traces. The device delivered stable current for the duration of the lesion. Fluctuations are likely due to the 10 μA precision of the multimeter that read the current.
Figure 7
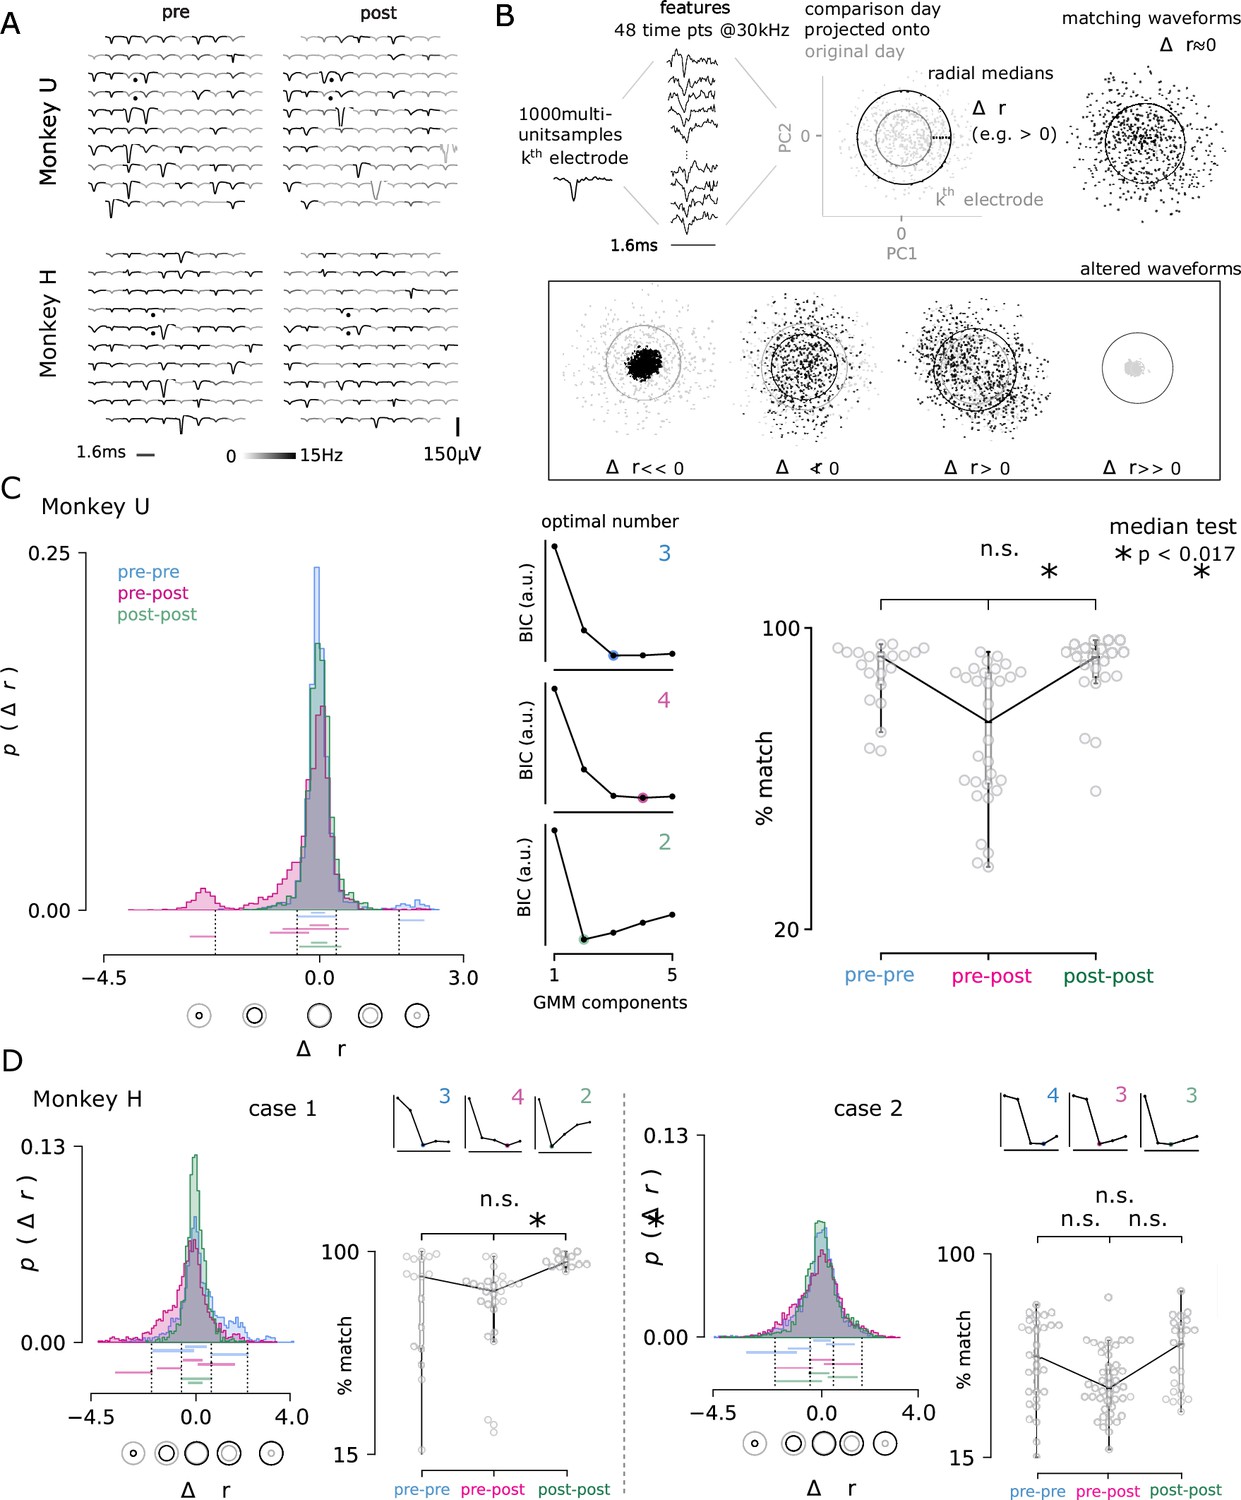
Electrolytic lesions perturb neuron populations while maintaining stable recordings.
(A) A representative comparison of recorded action potential waveforms, before and after the first lesion in Monkey U (top) and the sixth lesion in Monkey H (bottom). The location of the lesion electrodes are marked by black dots, showing visible changes in waveforms with low spatial specificity across the array. Signal was observed in the recording sessions immediately before and after lesioning (left, right). An action potential detection rate was determined from both periods of rest and task engagement (gray-scale shading, capped at 5 Hz for visualization). (B) The multi-neuron activity recorded on each electrode was analyzed for changes in the proportions of activity. Action potential waveforms from a selected day (black) were compared to 1000 waveforms from a previous day (grey) by projecting the selected day’s waveforms into the top two principal components determined from the previous day. The median radius of all waveform points relative to the origin in these two dimensions are represented as circles for both the comparison and original day. The difference in radii, , was computed for each channel and for all pairs of recording days, separated by no more than four days to ensure minimal rates of spontaneous turnover noted in the literature Gallego et al., 2020. Changes in radius could arise through changes in the relative proportion of activity among the recorded neurons, as well as putative neuron loss () and gain (). (C) The day-to-day pairwise comparisons fall within three groups: pre-lesion days (pre-pre), pre-lesion versus post-lesion days (pre-post; up to 3 days post-lesion), and post-lesion days (post-post; four to seven days after a lesion). In all comparison cases, 24, 48, 72, or 96 hr separated the recording sessions. Distribution of the values for all channels and days are shown for each group from Monkey U. Central panels Gaussian mixture models were fit to the data and the optimal number of components for each was determined using the Bayesian information criterion (BIC, normalized arbitrary units). An entirely new cluster is identified for the pre-post group that is hypothesized to largely represent the loss of neurons from the local population, beyond the usual rate of turnover observed in pre-lesion conditions. Right panel The three groups were then compared by looking at the percentage of the 96 electrodes that matched across comparison days. The percentage of matching neurons dropped significantly after a lesion (median test; * < 0.017, corresponding to the conservative Bonferroni corrected significance threshold of 0.05 for the three comparisons). (D) The same analysis is performed for Monkey H, which yielded two cases: lesions consistent with Monkey U (lesions 2, 4, and 7; left) and those with high levels of turnover before and after injury (lesions 5, 6, 8, 9, and 10; right). Note, lesions in Monkey U were well-spaced out over three months and considered as independent samples. Lesions in Monkey H were performed in much quicker succession, which likely contributes to the discrepancy.
Figure 8
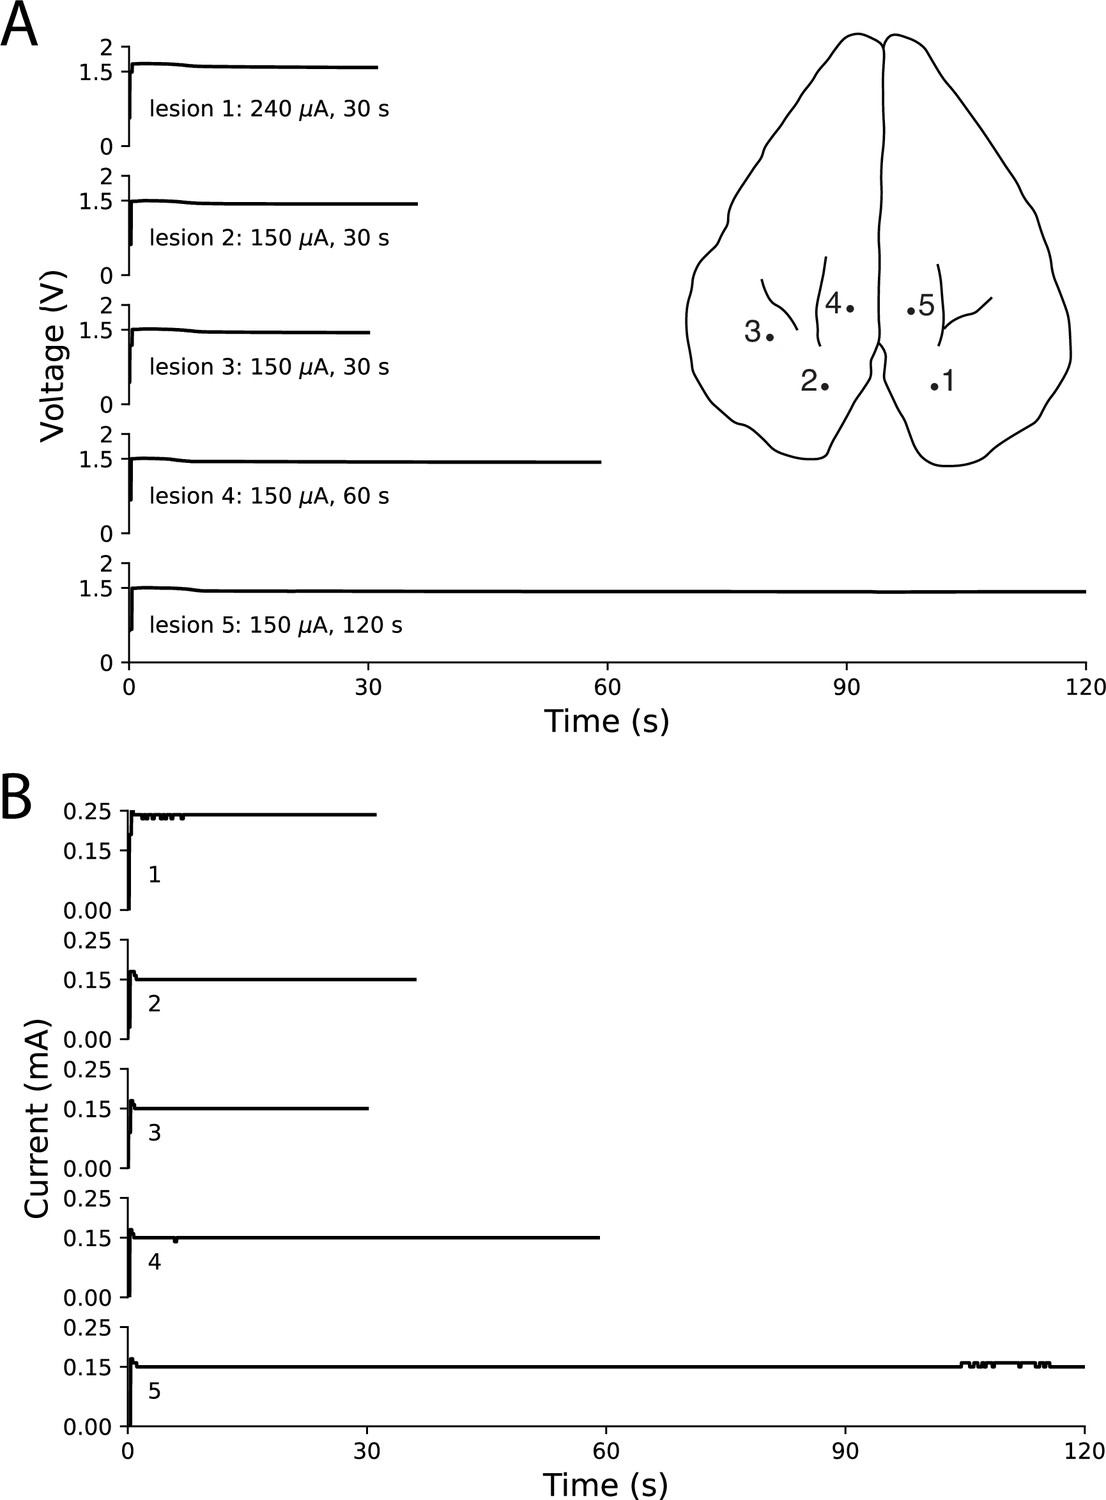
Ex vivo testing in rabbit cortex using a linear multielectrode probe.
Surface penetration locations for the five lesions made with a linear multielectrode probe are marked on rabbit cortex, with corresponding voltage traces (A) and current traces (B) arranged top-to-bottom. Electrode contacts were separated by 100 μm and lowered approximately 400 μm below the surface. The voltage slowly decreased throughout each lesion, while the circuit maintained steady current delivery. Only minor fluctuations in current of less than 10 μA were observed, based on the resolution of the ammeter.
Additional files
-
Supplementary file 1
Lesion parameters used for ex vivo testing.
Voltage was monitored with a voltmeter during lesioning, and notes were collected about the voltage. Tests that were performed solely to understand the effect of impacting and removing the microelectrode array without passing any current to create an electrolytic lesion are indicated with N/A for the current value. One ex vivo brain was used for all testing on 180702, and two ex vivo brains were used on each of the other two dates.
- https://cdn.elifesciences.org/articles/84385/elife-84385-supp1-v1.zip
-
Supplementary file 2
Lesion parameters used for in vivo testing.
Voltage was monitored with a voltmeter during lesioning, and notes were collected about the voltage. Tests that were performed solely to understand the effect of impacting and removing the microelectrode array without passing any current to create an electrolytic lesion are indicated with N/A for the current value. One animal was used for all testing on a given date.
- https://cdn.elifesciences.org/articles/84385/elife-84385-supp2-v1.zip
-
MDAR checklist
- https://cdn.elifesciences.org/articles/84385/elife-84385-mdarchecklist1-v1.pdf
Download links
A two-part list of links to download the article, or parts of the article, in various formats.
Downloads (link to download the article as PDF)
Open citations (links to open the citations from this article in various online reference manager services)
Cite this article (links to download the citations from this article in formats compatible with various reference manager tools)
Neuroelectrophysiology-compatible electrolytic lesioning
eLife 12:RP84385.
https://doi.org/10.7554/eLife.84385.3


