Syncytin-mediated open-ended membrane tubular connections facilitate the intercellular transfer of cargos including Cas9 protein
- Department of Molecular and Cell Biology, Howard Hughes Medical Institute, University of California, United States
Figures
Figure 1 with 2 supplements
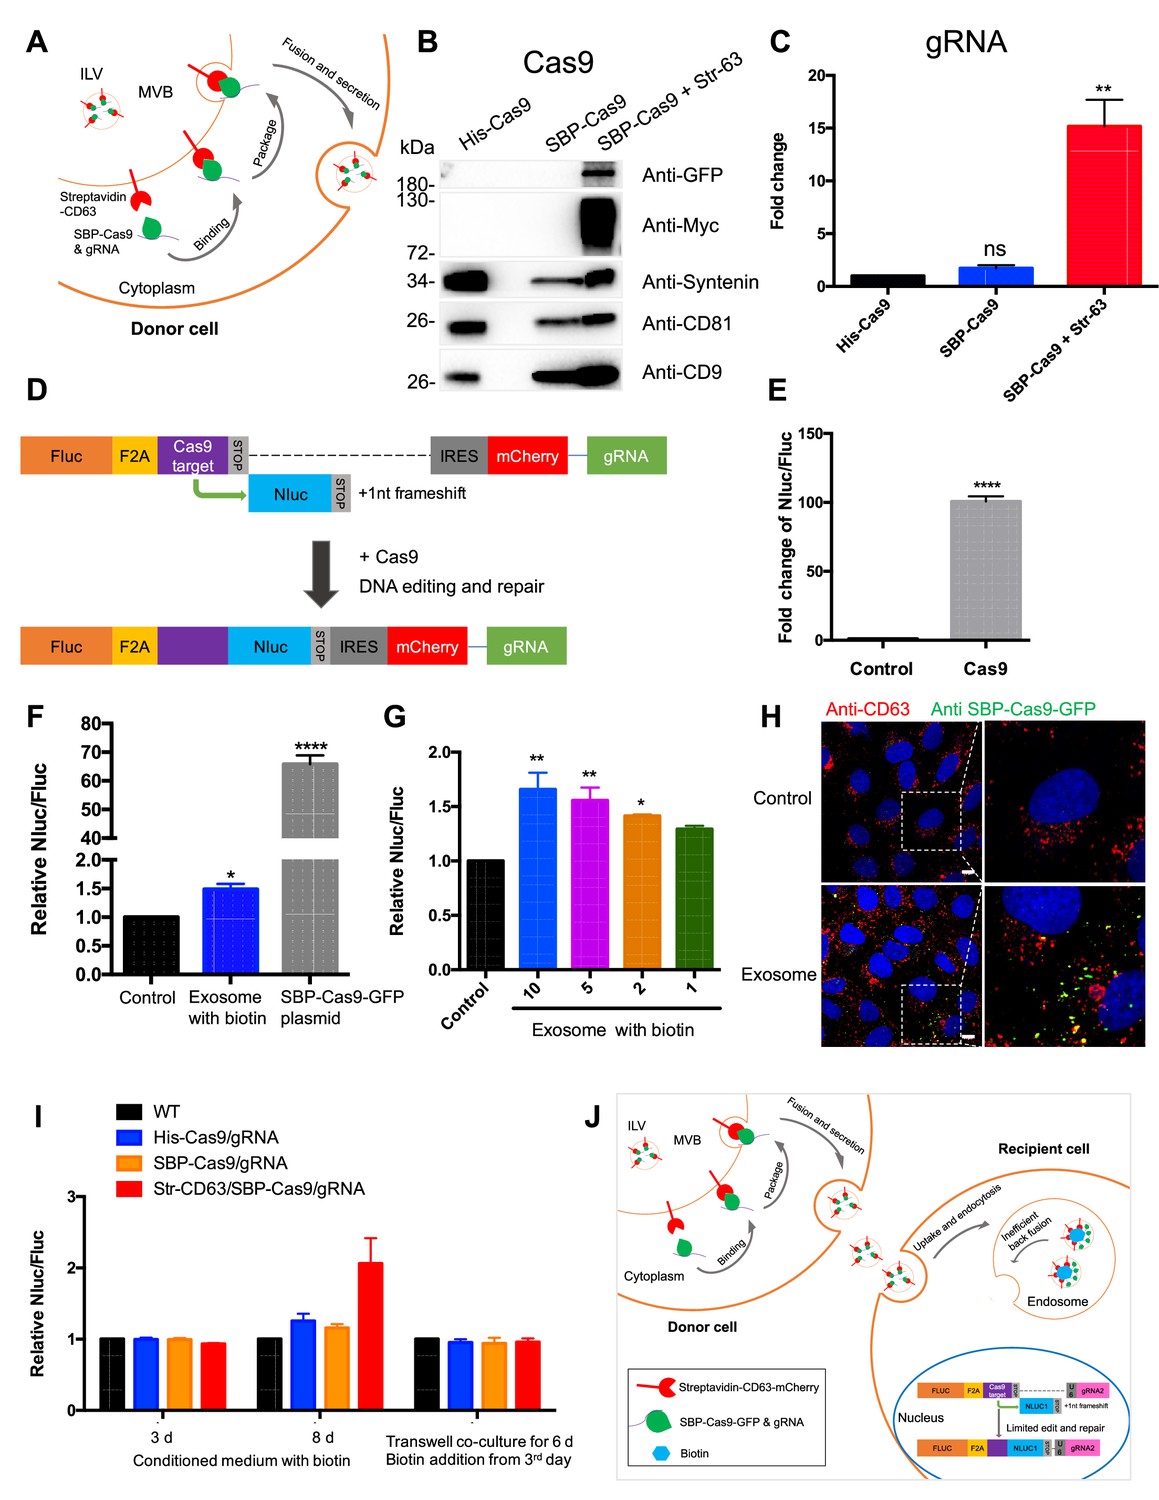
Exosome-mediated Cas9 intercellular transfer is inefficient.
(A) Schematic showing how the modified RUSH system was used for packaging Cas9/gRNA into exosomes. (B) His-tagged and Flag-tagged Cas9-GFP fusion protein were expressed in HEK293T cells stably as a negative control. Exosomes from the three stable cell lines (His-Flag-Cas9-GFP, SBP-Flag-Cas9-GFP only, or SBP-Flag-Cas9-GFP and Myc-streptavidin-CD63-mCherry) were purified. Cas9-GFP protein was detected in exosomes from the cells expressing both SBP-Flag-Cas9-GFP and Myc-streptavidin-CD63-mCherry. (C) gRNA in exosomes from the three stable cell lines was quantified. gRNA in exosomes from cells with SBP-Flag-Cas9-GFP and Myc-streptavidin-CD63-mCherry was enriched ~15× with respect to cells His-Flag-Cas9-GFP only. Data represent mean ± SEM, n ≥ 3. ns, not significant, **p<0.01, one-way ANOVA. (D) Schematic representation of the reporter system. Firefly luciferase gene (Fluc) expressed constitutively followed by a Cas9/gRNA-targeted linker region and a stop codon. The Nanoluc gene (Nluc) was placed after the stop codon with one nucleotide out of frame; thus, Nluc cannot be expressed without Cas9 editing. After Cas9/gRNA is expressed or transferred, the Cas9/gRNA target linker region may be cleaved and subsequent DNA repair via non-homologous end joining may induce a frameshift in the linker region to restore some Nluc gene expression. (E) Proof of concept. In HEK293T cells with the reporter plasmid, the expression of Cas9 protein increased the Nluc/Fluc signal dramatically compared to that transfected with control empty plasmid. Data represent mean ± SEM, n ≥ 3. ****p<0.0001, two-tailed t-test. (F) The engineered exosomes were incubated with the reporter cells for 24–48 hr, and the cells were washed for the detection of Nluc/Fluc. SBP-Cas9-GFP plasmid was introduced by transfection as a positive control. Data represent mean ± SEM, n ≥ 3. *p<0.05, ****p<0.0001, one-way ANOVA. (G) Different amounts of engineered exosomes were incubated with reporter cells for detection of the Nluc/Fluc signal. Data represent mean ± SEM, n ≥ 3. *p<0.05, **p<0.01, one-way ANOVA. (H) Engineered exosomes from HEK293T cells were incubated with U2OS cells for 16 hr followed by immunofluorescence detection using anti-GFP (green) and anti-CD63 (red) antibodies. The nucleus was stained by Hoechst 33342. Scale bar is 10 μm. (I) The conditioned medium from different donor cells was used to culture the reporter cells in the presence of 40 μM biotin, or the donor cells and the recipient cells were co-cultured for 6 days in a transwell dish (0.45 μm pore). Biotin was added from the third day followed by Nluc/Fluc assay after 6 days. (J) A proposed model suggesting that exosome-mediated Cas9 intercellular transfer is inefficient.
-
Figure 1—source data 1
Uncropped Western blot images corresponding to Figure 1B.
- https://cdn.elifesciences.org/articles/84391/elife-84391-fig1-data1-v2.zip
Figure 1—figure supplement 1
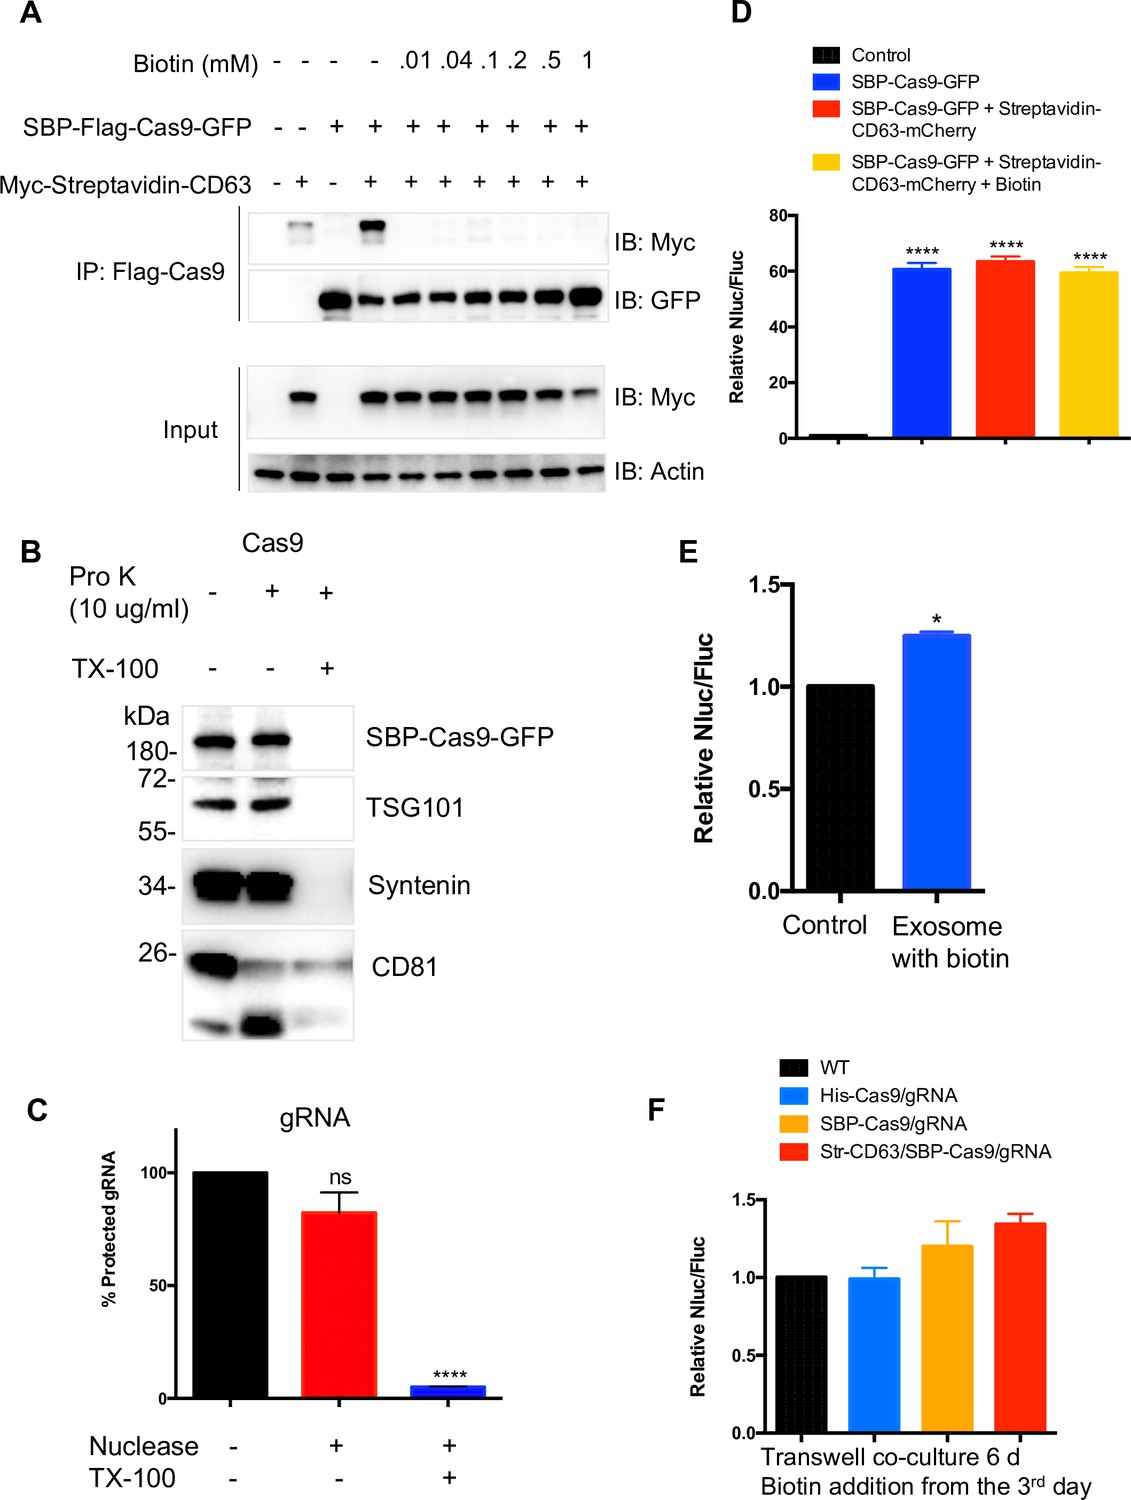
Validation of modified RUSH strategy.
(A) Immunoprecipitation (IP) was performed using anti-Flag and HEK293T cells expressing SBP-Flag-Cas9-GFP and/or Myc-streptavidin-CD63-mCherry. Cells expressing both proteins were cultured with or without biotin for 24 hr. Cell lysates were incubated with anti-Flag agarose beads, washed, and mixed with sample buffer. The input and IP samples were analyzed by immunoblotting. (B, C) Exosomes from cells expressed both SBP-Flag-Cas9-GFP and Myc-streptavidin-CD63-mCherry were purified and exposed to proteinase K with or without Triton X-100 (B) or to micrococcal nuclease with or without detergent (C) showing both Cas9 and gRNA localized within exosomes. Data represent mean ± SEM, n ≥ 3. ns, not significant, ****p<0.0001, one-way ANOVA. (D) SBP-Cas9-GFP plasmid was introduced by transfection as a positive control. Both SBP-Cas9-GFP and streptavidin-CD63-mCherry plasmids were co-transfected into the reporter cells in presence or absence of biotin. Data represent mean ± SEM, n ≥ 3. ****p<0.0001, one-way ANOVA. (E) The engineered exosomes were purified from MDA-MB-231 cells expressing SBP-Flag-Cas9-GFP and Myc-Streptavidin-CD63-mCherry and incubated with the reporter cells for 24–48 hr, washed, and assayed for Nluc/Fluc. Data represent mean ± SEM, n ≥ 3. *p<0.05, two-tailed t-test. (F) The MDA-MB-231 cells containing different constructs were co-cultured with reporter cells in a transwell dish (0.45 μm pore). Biotin was added from the third day followed by Nluc/Fluc assay after 6 days.
-
Figure 1—figure supplement 1—source data 1
Uncropped Western blot images corresponding to Figure 1—figure supplement 1A.
- https://cdn.elifesciences.org/articles/84391/elife-84391-fig1-figsupp1-data1-v2.zip
-
Figure 1—figure supplement 1—source data 2
Uncropped Western blot images corresponding to Figure 1—figure supplement 1B.
- https://cdn.elifesciences.org/articles/84391/elife-84391-fig1-figsupp1-data2-v2.zip
Figure 1—figure supplement 2
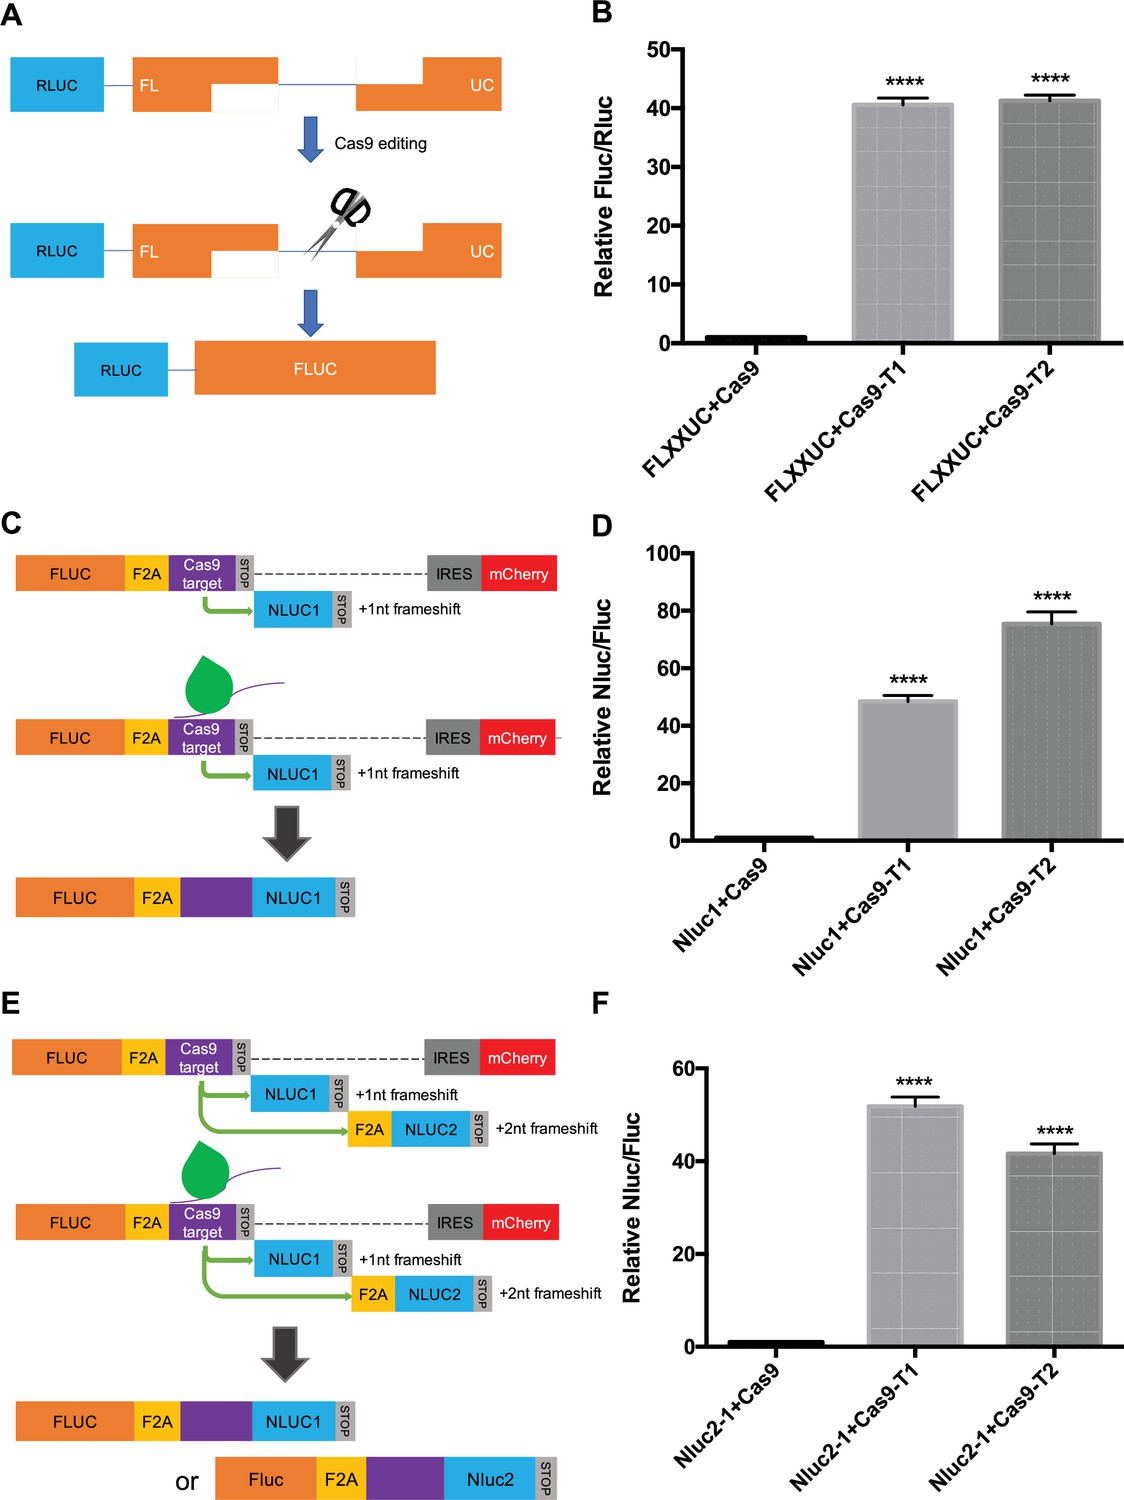
Cas9-based reporter optimization.
(A) Schematic representation of the alternative reporter systems for Cas9 editing detection. Renilla luciferase gene (Rluc) expressed constitutively, followed by a truncated firefly luciferase gene (Fluc) containing a Cas9/gRNA-targeted linker region with an ~800 bp overlap between the two Fluc truncations. Fluc cannot be expressed without Cas9 editing. After Cas9/gRNA is expressed or transferred, the Cas9/gRNA target linker region may be cleaved. Subsequently, DNA repair via single-strand annealing may induce recombination of the two Fluc gene fragments to form a full-length Fluc gene. (B) Proof of concept in (A). In HEK293T cells with the reporter plasmid, both the expression of Cas9/gRNA1 and Cas9/gRNA2 increased the Fluc/Rluc signal dramatically compared to a control (~40-fold). (C) An alternative reporter construct to the one described in Figure 1D where the gRNA was not provided by the reporter cassette. (D) Proof of concept in (C). (E) Similar to (C) but with two Nluc genes placed after the stop codon with one nucleotide (Nluc1) and two nucleotides (Nluc2) out of frame. (F) Proof of concept in (E). In HEK293T cells with the reporter plasmid, the expression of Cas9/gRNA1 or Cas9/gRNA2 increased the Nluc/Fluc signal about 40–50-fold. Data represent mean ± SEM, n ≥ 3. ****p<0.0001, one-way ANOVA. Strategy C with expression of the gRNA2 in the reporter cassette as described in Figure 1D and used in subsequent experiments.
Figure 2 with 1 supplement
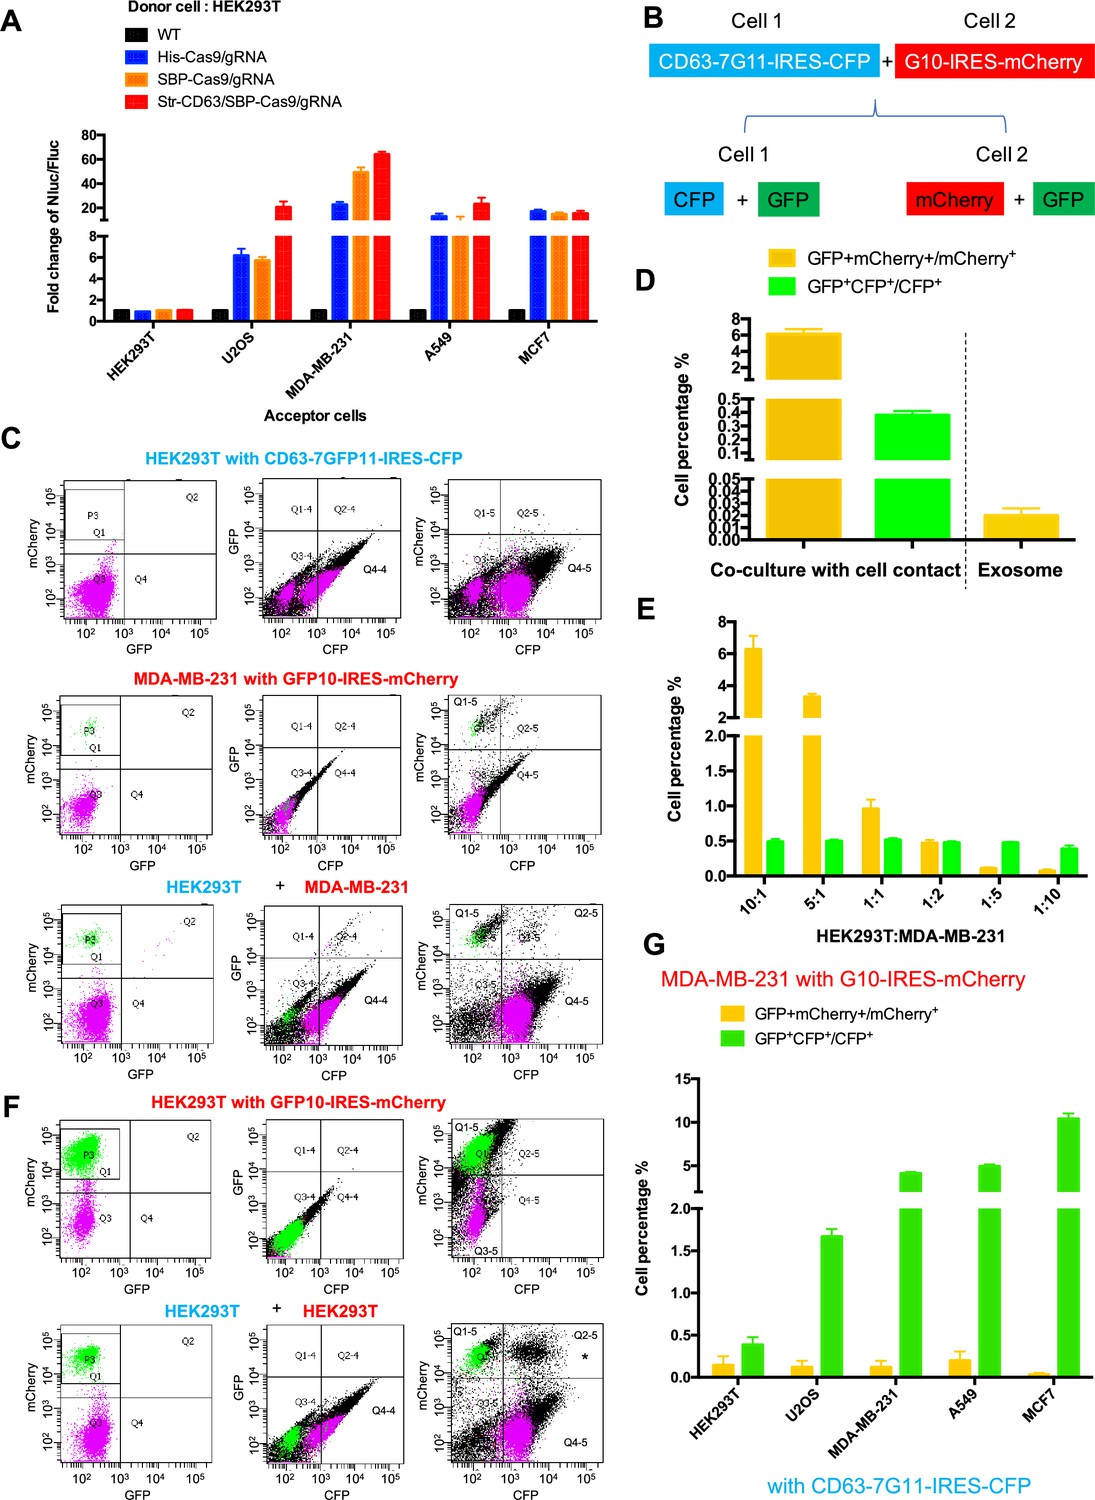
Intercellular transfer of Cas9 and other cargos through direct cell-cell contact.
(A) Donor cells: HEK293T wild-type (WT) with stable overexpression of his tagged Cas9-GFP/gRNA (His-Cas9/gRNA), with stable overexpression of SBP tagged Cas9-GFP/gRNA (SBP-Cas9/gRNA) or with stable overexpression of SBP-Cas9-GFP/gRNA and Myc-streptavidin-CD63-mCherry (Str-CD63/SBP-Cas9/gRNA). The last construct permits Cas9 incorporation into endosomes as depicted in Figure 1J. Acceptor cells: HEK293T, U2OS, MDA-MB-231, A549, or MCF7 with stable transfection of the reporter plasmid. After 6 days of co-culture, Nluc/Fluc assays were performed and normalized to an aliquot of co-cultured WT donor and reporter cells. (B) Diagram showing trifluorescence split-GFP system for the detection of intercellular transfer. (C) HEK293T expressing CD63 fused 7-tandem GFP11 and CFP (top) was co-cultured with MDA-MB-231 expressing GFP1-10 and mCherry (middle), after 3 days the co-cultures were analyzed by flow cytometry (bottom). The plots are displayed in an all-cell mode. The possible singlet and doublet are indicated with green/purple dots and black dots, respectively. Quadrants Q2, Q2-4, Q2-5 mainly represent double-positive. (D) Double-positive fluorescent cells were quantified. GFP+ mCherry+/mCherry+ represents the ratio of cells with GFP+mCherry double-positive fluorescence to cells with mCherry; GFP+CFP+/CFP+ represents the ratio of cells with GFP+CFP double-positive fluorescence to cells with CFP. Three independent experiments were performed. Data represent mean ± SEM. (E) HEK293T expressing CD63 fused 7*tandem GFP11 and CFP was co-cultured with MDA-MB-231 expressing GFP1-10 and mCherry. The ratio of HEK293T to MDA-MB-231 is indicated. After 3 days, the co-cultures were analyzed by flow cytometry and double-positive fluorescence was quantified. Data in this figure represent mean ± SEM, n ≥ 3. (F) HEK293T expressing CD63 fused 7-tandem GFP11 and CFP (same as C, top) was co-cultured with HEK293T expressing GFP1-10 and mCherry (top) and after 3 days the co-cultures were analyzed by flow cytometry (bottom). The plots are displayed in an all-cell mode. The possible singlet and doublet are indicated with green/purple dots and black dots, respectively. Quadrants Q2, Q2-4, Q2-5 mainly represent double-positive. Asterisk in the bottom panel indicates that the double positive of mCherry and CFP may derive from adherent cells, not intercellular transfer. (G) MDA-MB-231 expressing GFP1-10 and mCherry was co-cultured with other cell lines expressing CD63 fused 7-tandem GFP11 and CFP at the ratio of 10:1 and after 3 days the co-cultures were analyzed by flow cytometry and double-positive fluorescence was quantified. Three independent experiments were performed. Data represent mean ± SEM.
Figure 2—figure supplement 1
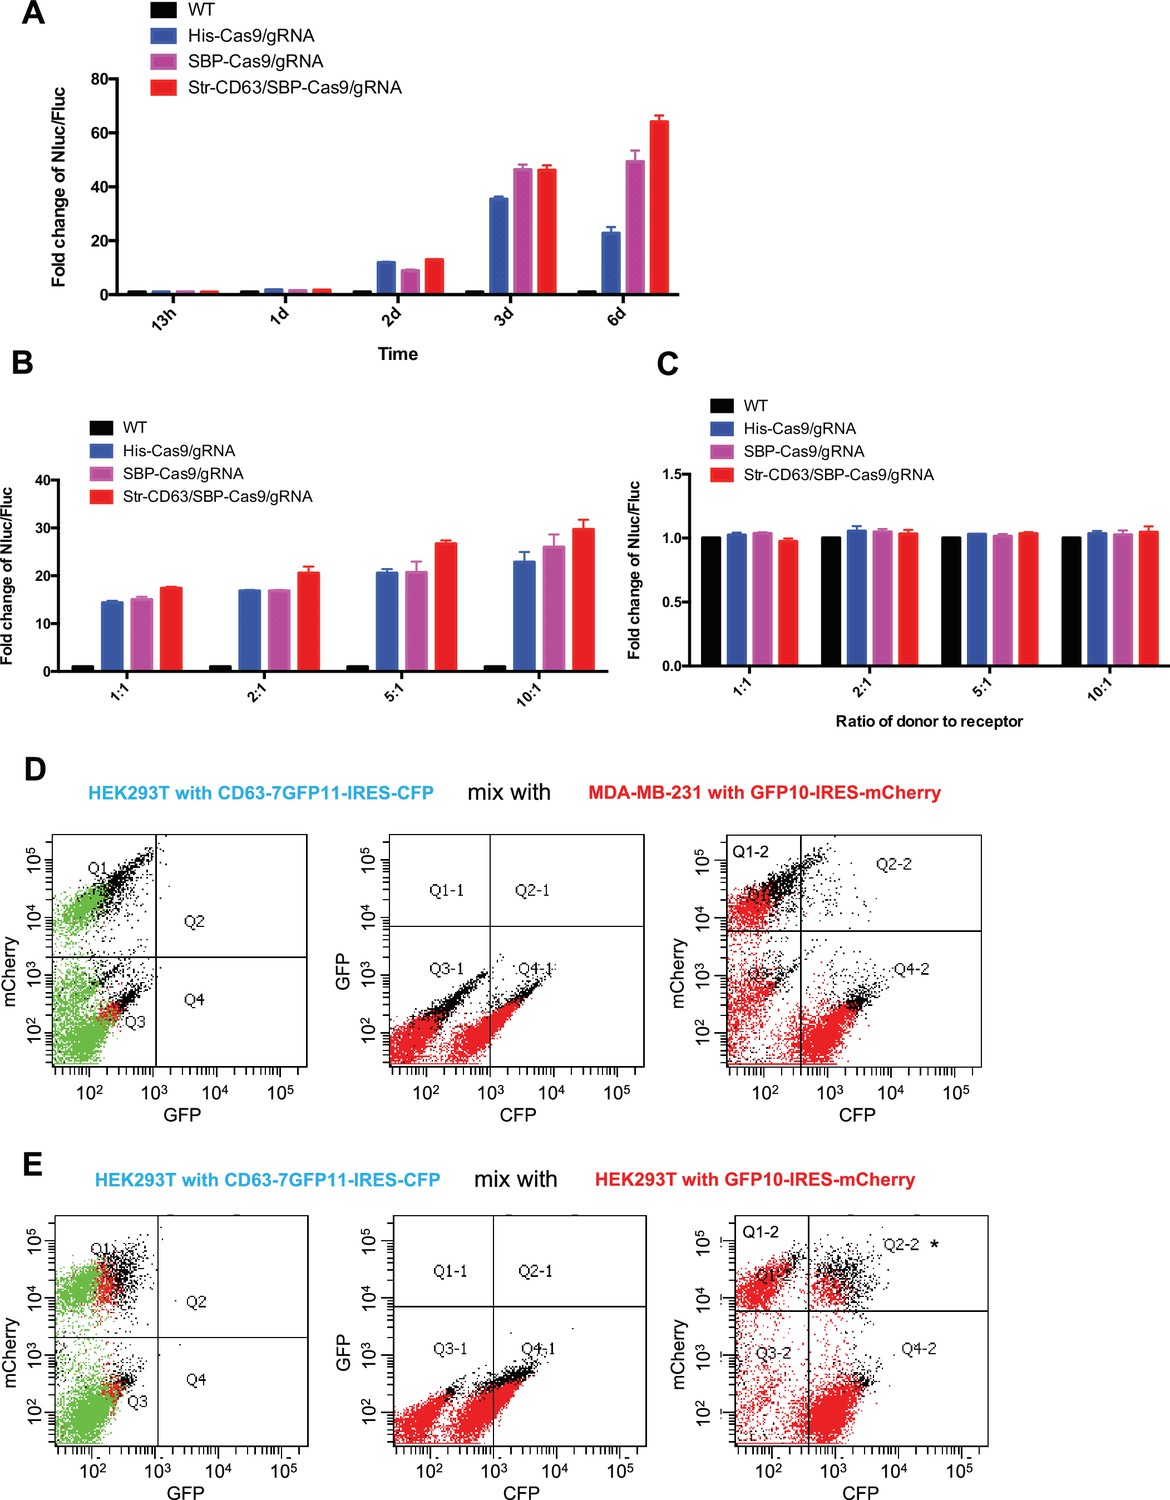
The effects of co-culture time and different ratios of donor to recipient cells on transfer.
(A–C) Donor cells: HEK293T wild-type (WT) with stable overexpression of his-tagged Cas9-GFP/gRNA (His-Cas9/gRNA), with stable overexpression of SBP tagged Cas9-GFP/gRNA (SBP-Cas9/gRNA) or with stable overexpression of SBP-Cas9-GFP/gRNA and Myc-streptavidin-CD63-mCherry (Str-CD63/SBP-Cas9/gRNA). (A) The recipient cell line was MDA-MB-231 with the reporter plasmid and co-culture incubations were for the indicated times. (B) The recipient cell line was MDA-MB-231 with a reporter plasmid. The ratio of donor cells to the recipient cells is indicated. (C) The recipient cell line was HEK293T with a reporter plasmid. The ratio of donor cells to the recipient cells is indicated. (D) HEK293T expressing CD63-fused 7-tandem GFP11 and CFP was mixed with MDA-MB-231 expressing GFP1-10 and mCherry and analyzed by flow cytometry. The plots are displayed in an all-cell mode. The possible singlet and doublet are indicated with green/red dots and black dots, respectively. (E) HEK293T expressing CD63-fused 7-tandem GFP11 and CFP was mixed with HEK293T expressing GFP1-10 and mCherry and analyzed by flow cytometry. The plots are displayed in an all-cell mode. The possible singlet and doublet are indicated with green/red dots and black dots, respectively. One possibility for the double-labeled singlet cells (red dots) in Q2-2 (asterisk) is that fluorescent cell debris may have attached to the cell surface of the other cell, resulting in double-positive fluorescence in a single cell. This possible artifact emphasizes the value of our trifluorescence split-GFP to detect authentic cytoplasmic intercellular transfer (GFP fragment transfer and recombination), thus minimizing the possibility of an inauthentic signal.
Figure 3 with 2 supplements
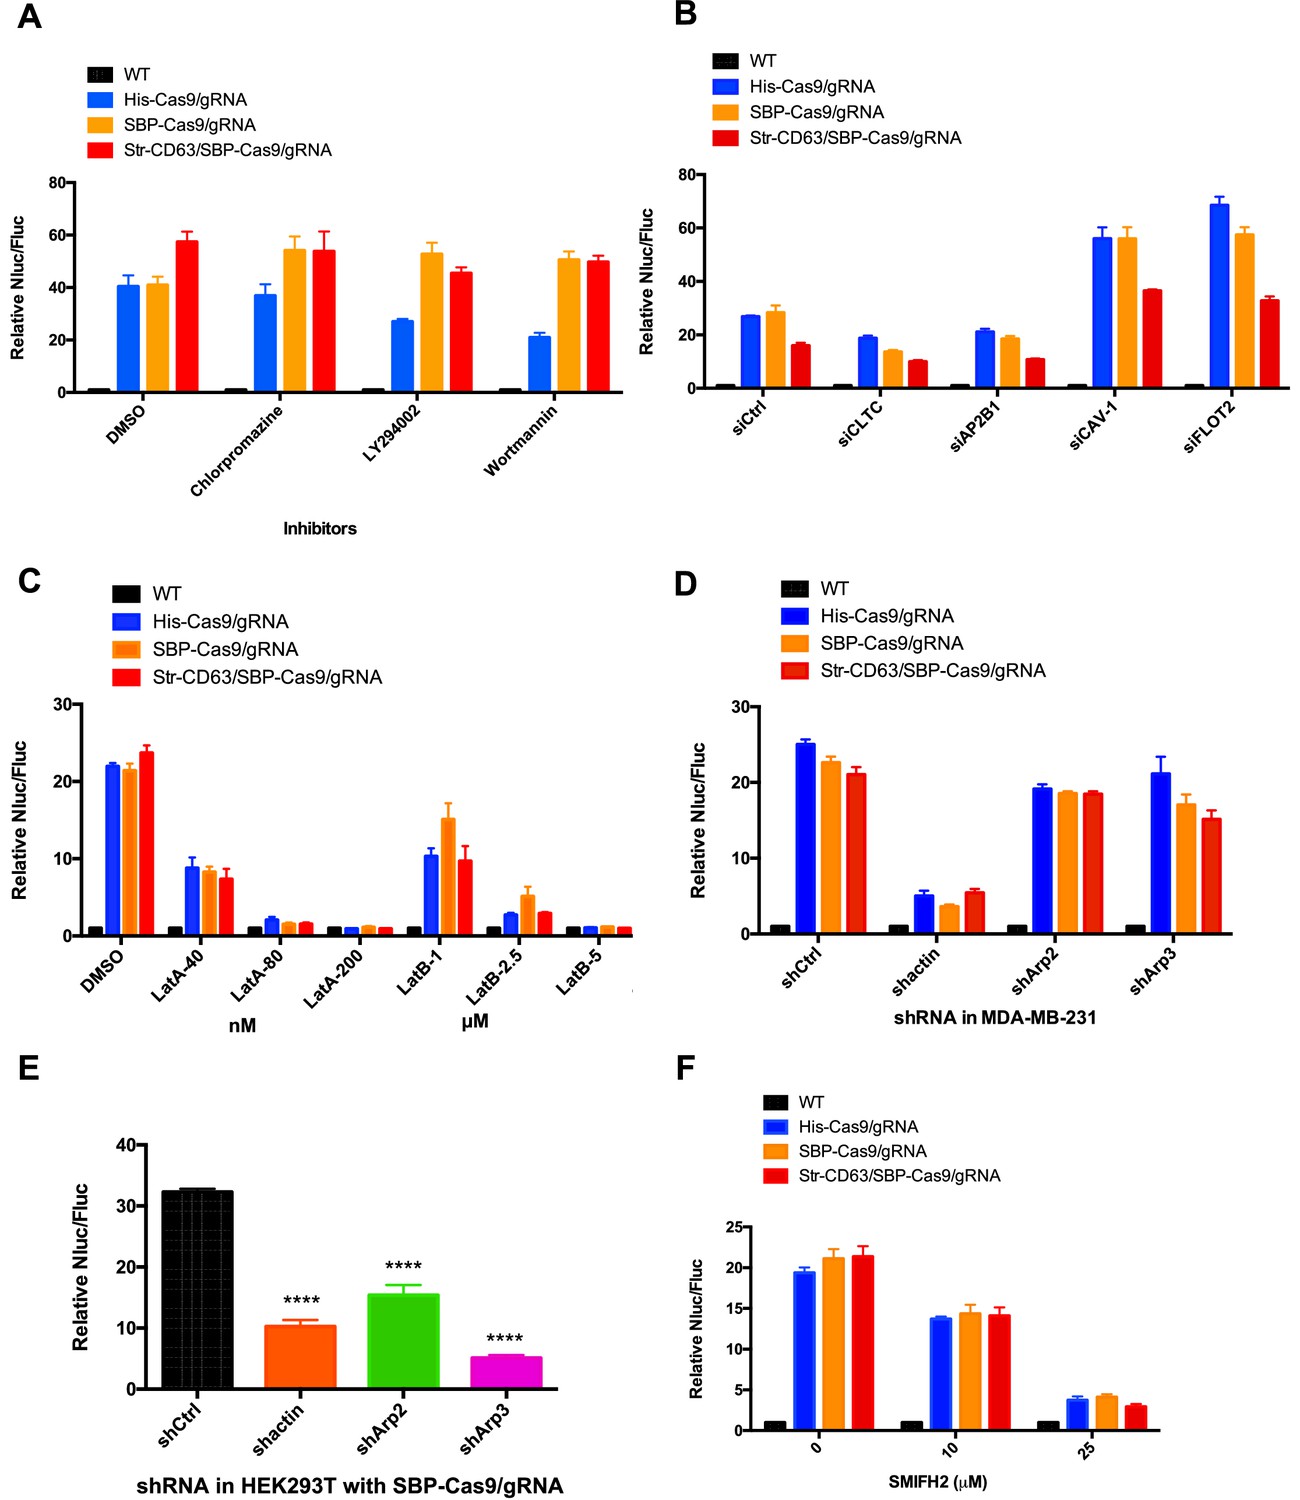
Inhibitors of F-actin but not of endocytosis reduce intercellular transfer of Cas9.
(A–D, F) Donor cells: HEK293T wild-type (WT) with stable overexpression of his tagged Cas9-GFP/gRNA (His-Cas9/gRNA), with stable overexpression of SBP tagged Cas9-GFP/gRNA (SBP-Cas9/gRNA) or with stable overexpression of SBP-Cas9-GFP/gRNA and Myc-streptavidin-CD63-mCherry (Str-CD63/SBP-Cas9/gRNA). The recipient cell line was MDA-MB-231 with a reporter plasmid. Nluc/Fluc assays were performed and normalized to an aliquot of co-cultured WT donor and reporter cells. (A) Nluc/Fluc activities were measured after donor cells and acceptor cells were co-cultured for 3 days with DMSO or different inhibitors. (B) The indicated genes were knocked down in recipient cells via siRNA and then co-cultured with donor cells for 3 days. siCtrl represents a negative control for the siRNA knockdown. CLTC, clathrin heavy chain; AP2B1, adaptor-related protein complex 2 subunit beta 1; CAV-1, caveolin 1; FLOT2, flotillin 2. (C) The donor cells and acceptor cells were co-cultured for 3 days with either DMSO, 40, 80, or 200 nM latrunculin A (LatA), or 1, 2.5, or 5 μM latrunculin B (LatB). The Nluc/Fluc signal detected after co-culture suggested that more than half of the cells remained viable during drug treatment. (D) The indicated genes were knocked down in recipient cells via shRNA that were then co-cultured with donor cells for 3 days. siCtrl represents negative control for the siRNA knockdown. (E) Donor cells: HEK293T with stable overexpression of SBP tagged Cas9-GFP/gRNA (SBP-Cas9/gRNA). The recipient cell line was MDA-MB-231 with the reporter plasmid. The indicated genes were knocked down in donor cells via shRNA that were then co-cultured with recipient cells for 3 days. (F) Donor cells and acceptor cells were co-cultured for 4 days with either DMSO, 10, or 25 μM formin inhibitor, SMIFH2. The Nluc/Fluc signal detected after co-culture suggested that more than 70% of the cells remained viable during drug treatment. Nluc/Fluc assays were performed and normalized to an aliquot of co-cultured WT donor and reporter cells. Data in this figure represent mean ± SEM, n ≥ 3. ****p<0.0001, one-way ANOVA.
Figure 3—figure supplement 1
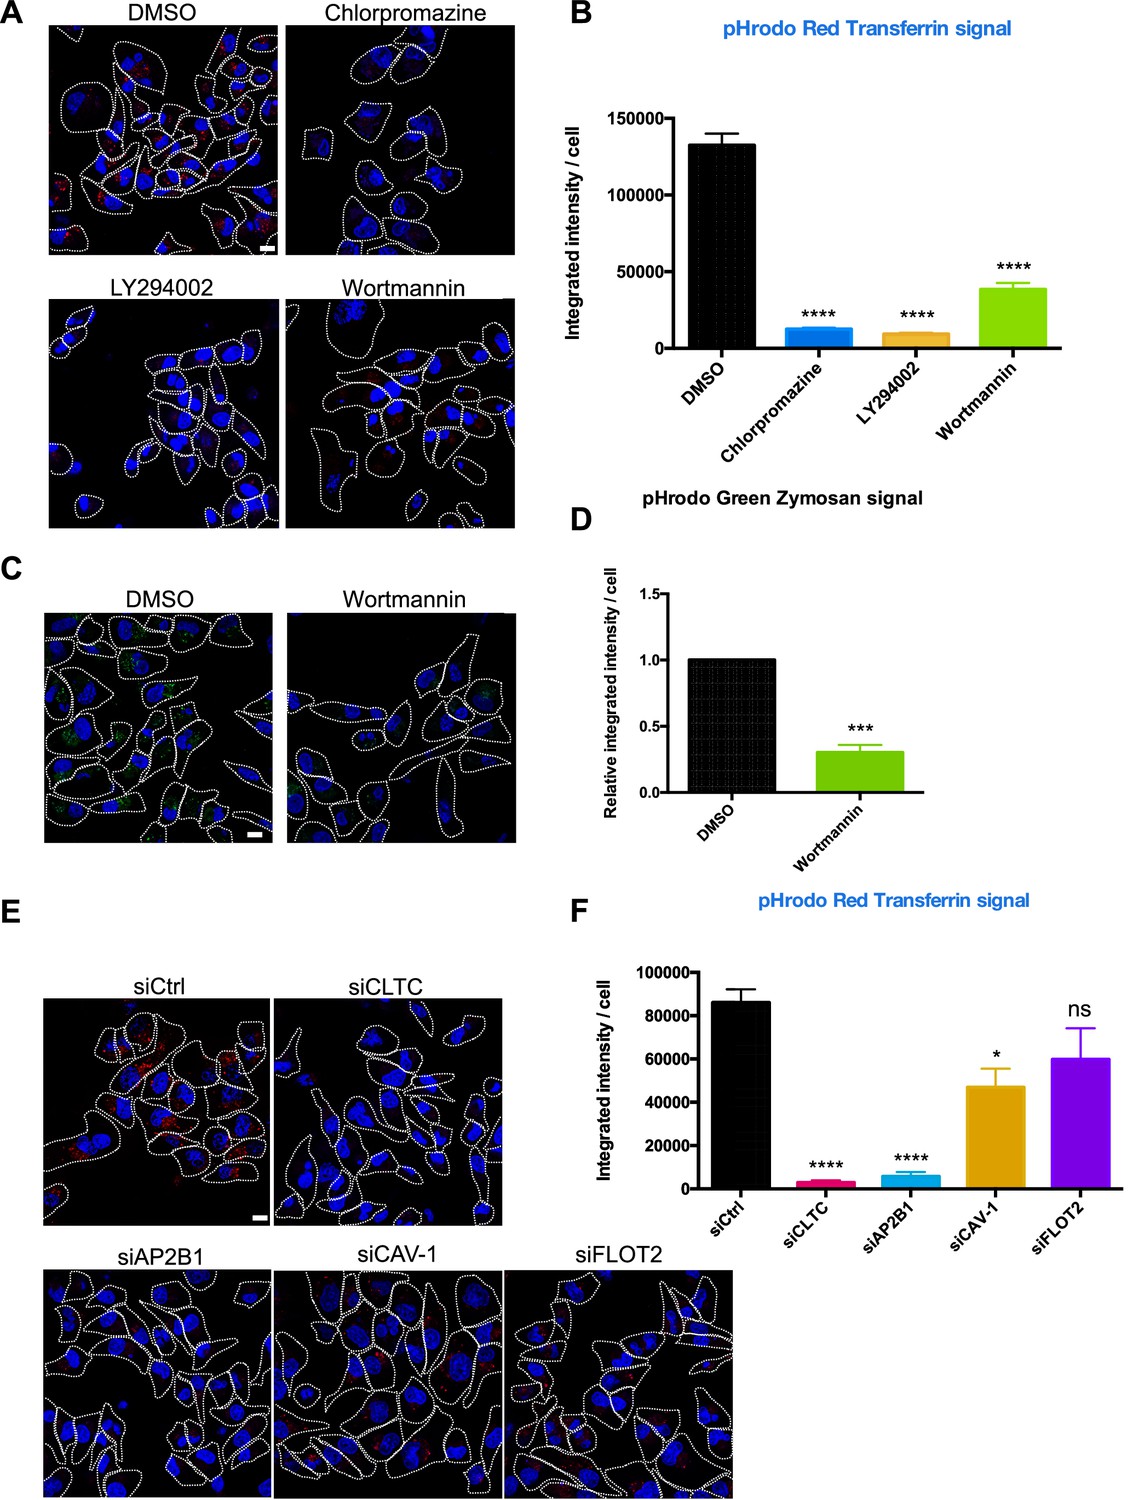
Endocytosis inhibitors and endocytosis protein knockdown block transferrin uptake.
(A) MDA-MB-231 cells were incubated with indicated inhibitors for 48 hr. Cells were washed 2× and then incubated with pHrodo red transferrin conjugate and Hoechst 33342 for 20 min, washed 4×, and observed cells by confocal microscopy. Scale bar is 10 μm. (B) The integrated intensity per cell from (A) was quantified by ImageJ. n = 200 cells were captured. Data represent mean ± SEM, n ≥ 3. ****p<0.0001, one-way ANOVA. (C) MDA-MB-231 cells were incubated with indicated inhibitors for 48 hr and then incubated with Phrodo Green Zymosan Bioparticles and Hoechst 33342. Scale bar is 10 μm. (D) The integrated intensity per cell from (C) was quantified by ImageJ. n = 200 cells were captured. Data represent mean ± SEM, n ≥ 3. ***p<0.001, two-tailed t-test. (E, F) The endocytosis factors were knocked down in MDA-MB-231 cells for 48 hr and processed for visualization and quantification as in (A, B). Data represent mean ± SEM, n ≥ 3. ****p<0.0001, one-way ANOVA. Scale bar is 10 μm.
Figure 3—figure supplement 2
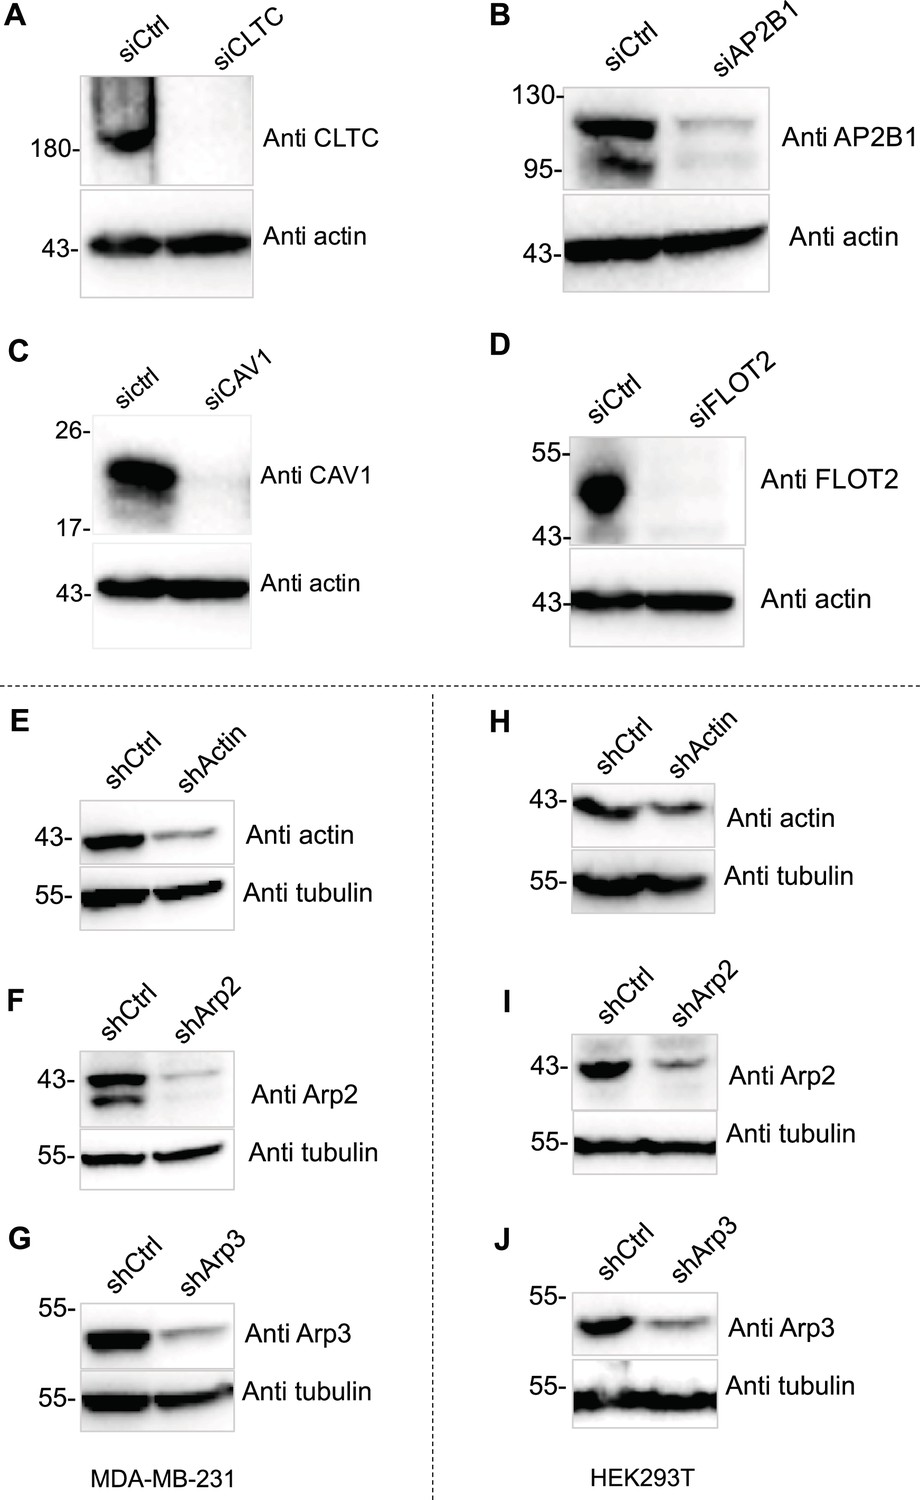
Knockdown validation.
(A–D) The endocytosis factors were knocked down for 72 hr in MDA-MB-231 cells, and lysate samples were assessed by SDS-PAGE and immunoblotting. (E–G) Actin or Arp2/3 complex were knocked down in MDA-MB-231 cells. (H–J) Actin or Arp2/3 complex were knocked down in HEK293T cells.
-
Figure 3—figure supplement 2—source data 1
Uncropped Western blot images corresponding to Figure 3—figure supplement 2A.
- https://cdn.elifesciences.org/articles/84391/elife-84391-fig3-figsupp2-data1-v2.zip
-
Figure 3—figure supplement 2—source data 2
Uncropped Western blot images corresponding to Figure 3—figure supplement 2B.
- https://cdn.elifesciences.org/articles/84391/elife-84391-fig3-figsupp2-data2-v2.zip
-
Figure 3—figure supplement 2—source data 3
Uncropped Western blot images corresponding to Figure 3—figure supplement 2C.
- https://cdn.elifesciences.org/articles/84391/elife-84391-fig3-figsupp2-data3-v2.zip
-
Figure 3—figure supplement 2—source data 4
Uncropped Western blot images corresponding to Figure 3—figure supplement 2D.
- https://cdn.elifesciences.org/articles/84391/elife-84391-fig3-figsupp2-data4-v2.zip
-
Figure 3—figure supplement 2—source data 5
Uncropped Western blot images corresponding to Figure 3—figure supplement 2E and H.
- https://cdn.elifesciences.org/articles/84391/elife-84391-fig3-figsupp2-data5-v2.zip
-
Figure 3—figure supplement 2—source data 6
Uncropped Western blot images corresponding to Figure 3—figure supplement 2F and I.
- https://cdn.elifesciences.org/articles/84391/elife-84391-fig3-figsupp2-data6-v2.zip
-
Figure 3—figure supplement 2—source data 7
Uncropped Western blot images corresponding to Figure 3—figure supplement 2G and J.
- https://cdn.elifesciences.org/articles/84391/elife-84391-fig3-figsupp2-data7-v2.zip
Figure 4 with 2 supplements
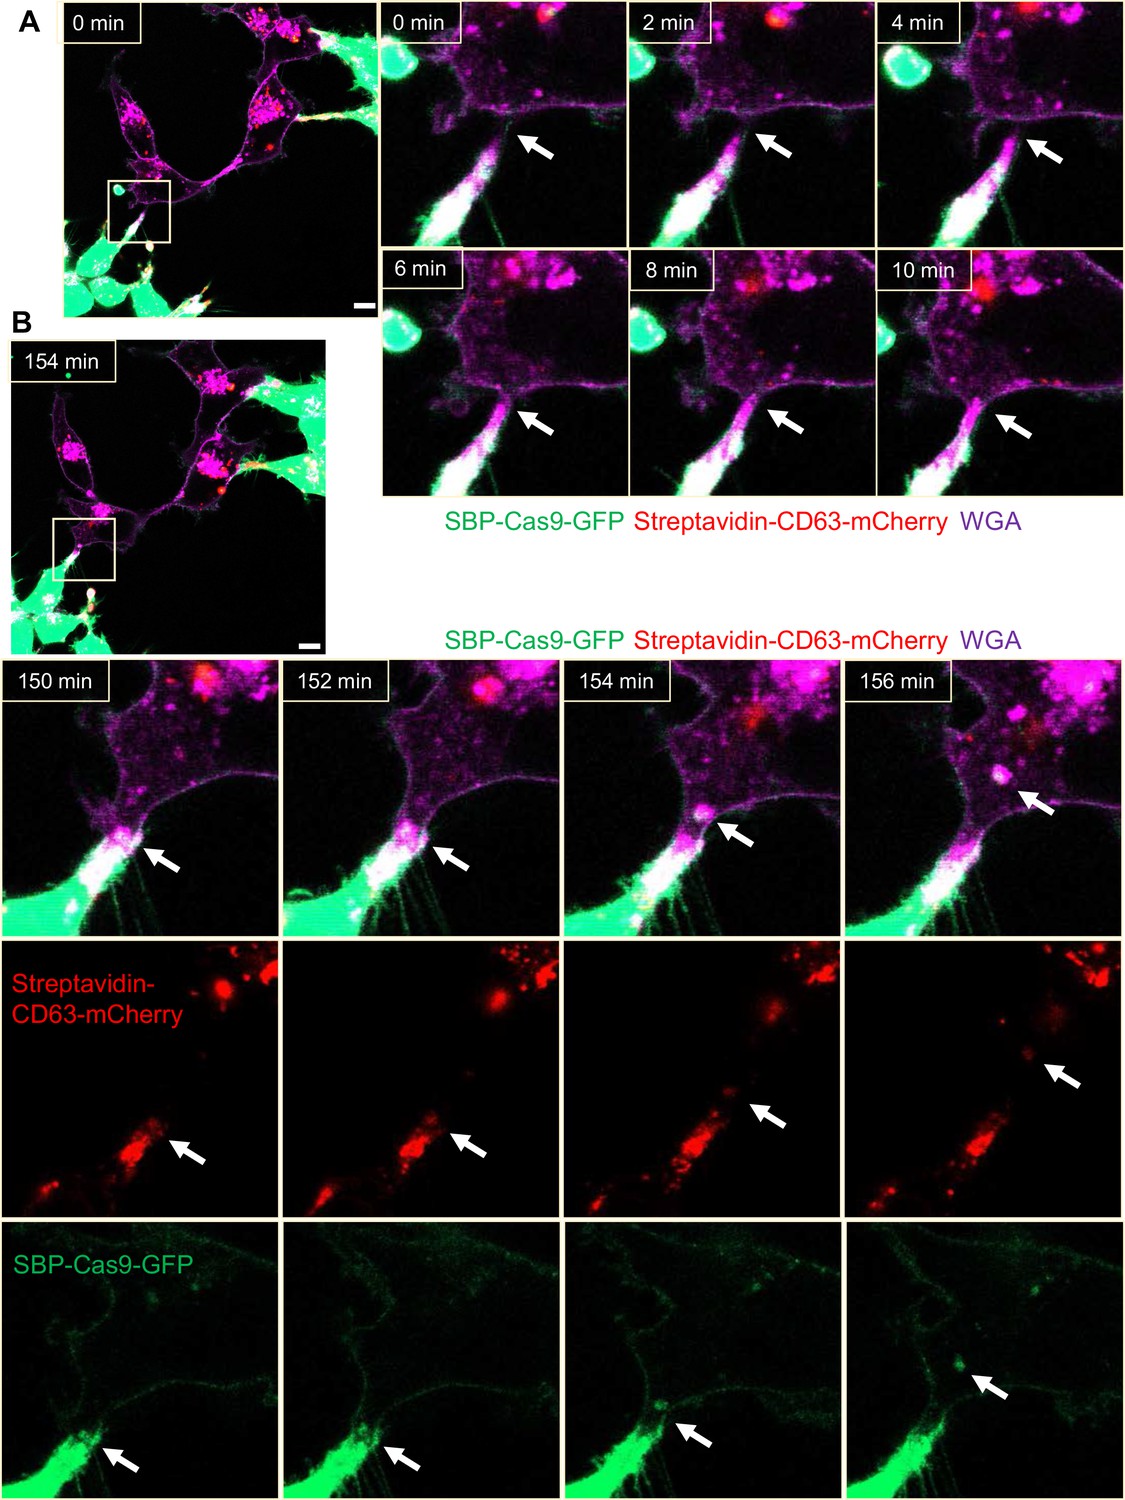
Intercellular transfer of Cas9 protein through open-ended tubular connections.
(A, B) Visualization of open-ended tubular connection structure and time-lapse imaging of the co-culture. Donor cells: HEK293T with stable overexpression of SBP-Cas9-GFP/gRNA and Myc-streptavidin-CD63-mCherry (Str-CD63/SBP-Cas9/gRNA). Acceptor cell: MDA-MB-231. Green: SBP-Cas9-GFP; red: Myc-streptavidin-CD63-mCherry; purple: CF640R WGA conjugate. Scale bar is 10 μm. The white arrows in (A) indicate the formation of an open-ended tubular connection. The white arrows in (B) indicate that the cargos including endosomal vesicles (red, middle row) and SBP-Cas9-GFP (green, bottom row) transferred through the open-ended tubular connection.
Figure 4—figure supplement 1
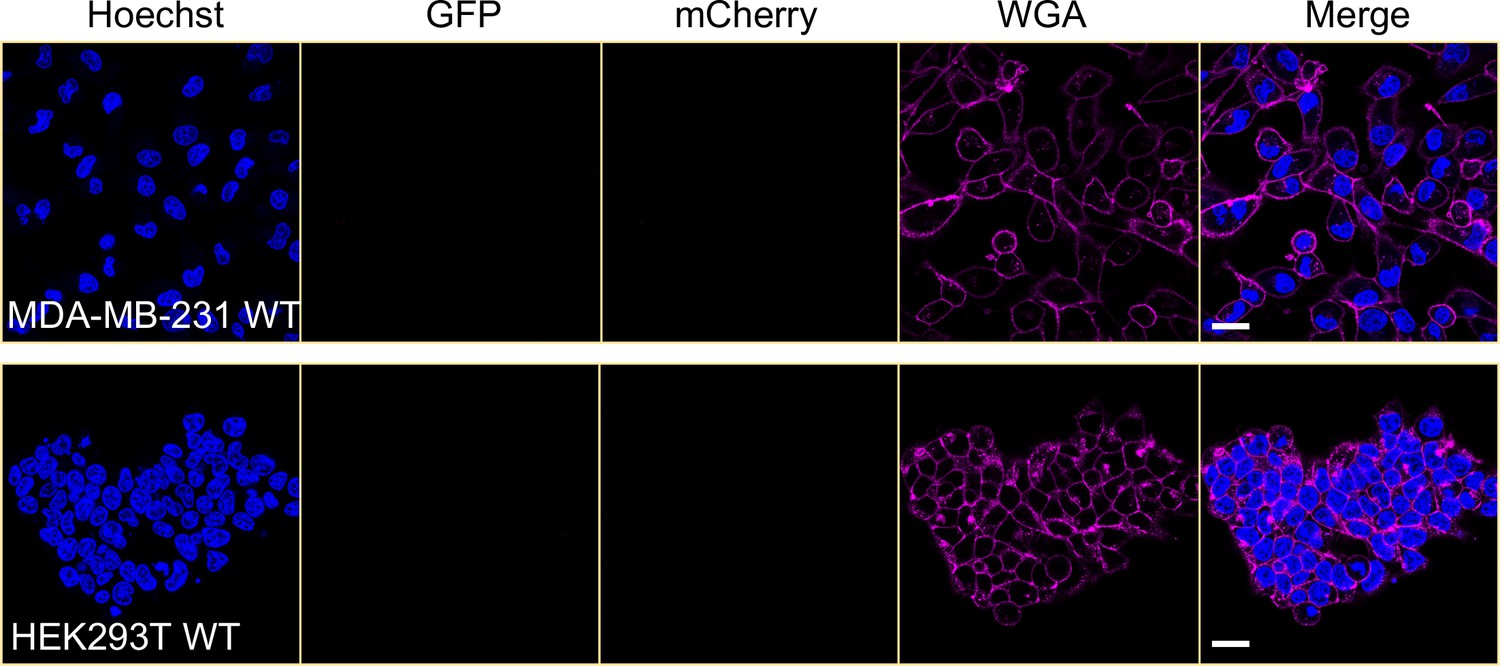
MDA-MB-231 and HEK293T wild-type cells were observed by confocal microscopy.
The cells were stained by Hoechst 33342 and CF640R WGA conjugate. Scale bar is 20 μm.
Figure 4—video 1
Intercellular transfer of Cas9 through open-ended tubular connections.
Formation of open-ended tubular connection and detection of endosomal vesicles (red) and SBP-Cas9-GFP (green) transferred from donor to acceptor followed by disruption of the connection. Donor cells: HEK293T with stable overexpression of SBP-Cas9-GFP/gRNA and Myc-streptavidin-CD63-mCherry (Str-CD63/SBP-Cas9/gRNA). Acceptor cell: MDA-MB-231. Scale bar is 10 μm. Green: SBP-Cas9-GFP; red: Myc-streptavidin-CD63-mCherry; purple: CF640R WGA conjugate.
Figure 5 with 2 supplements
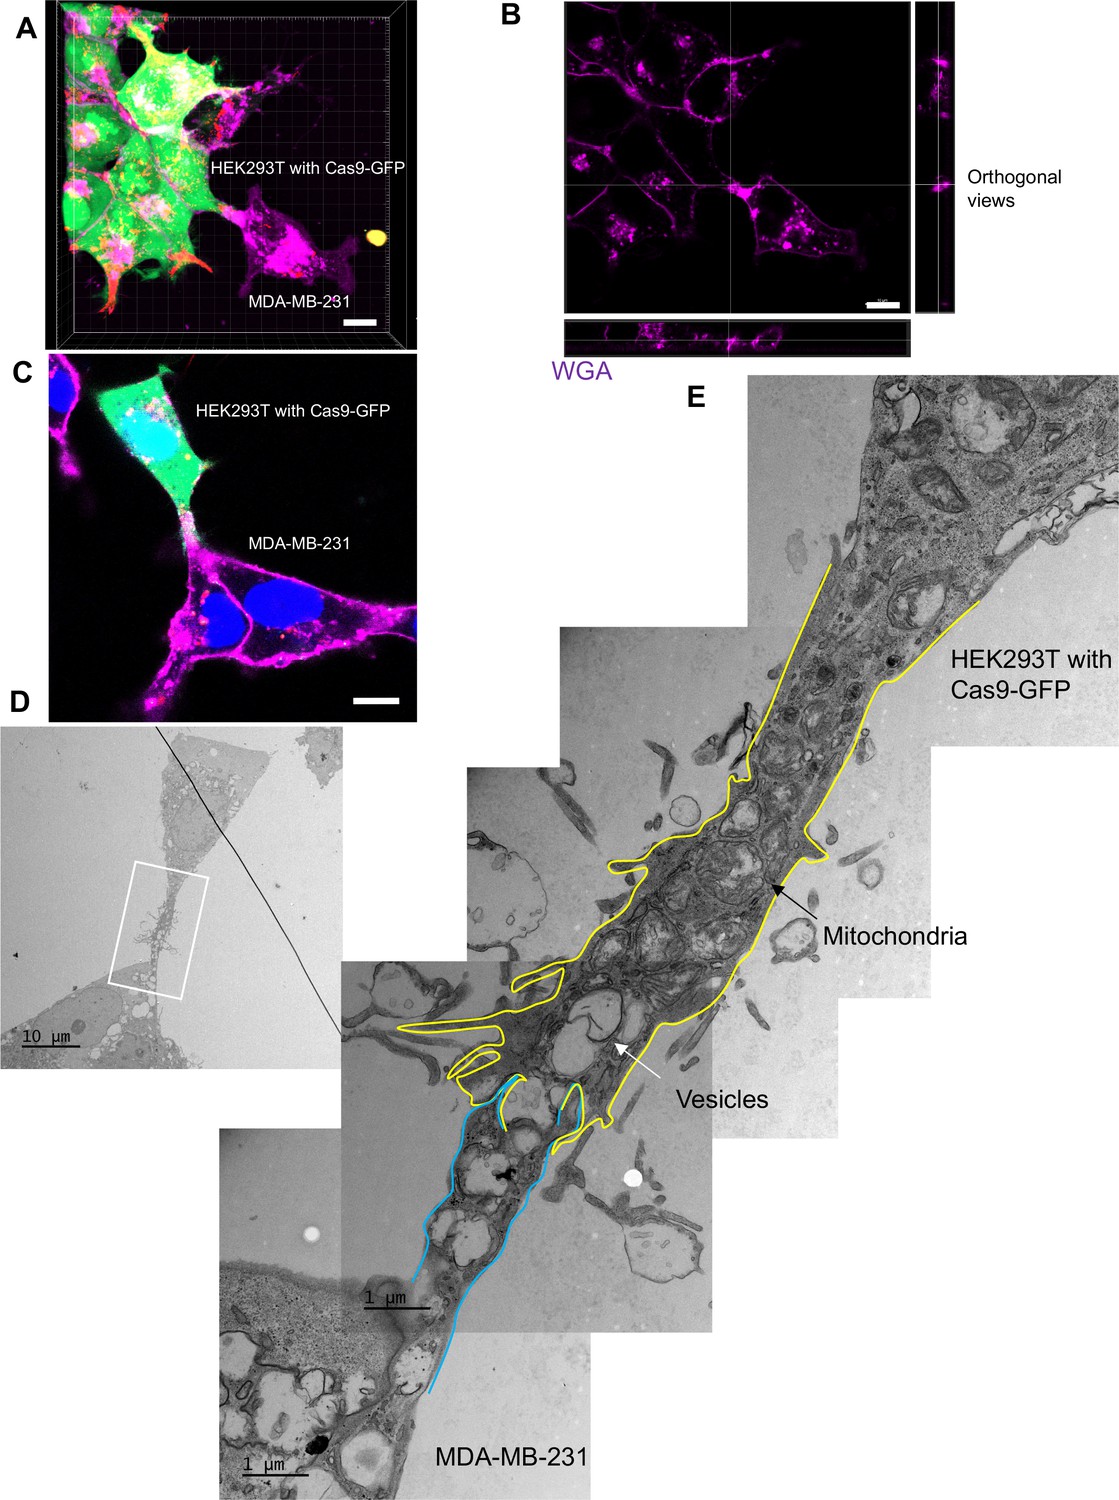
The ultrastructure of open-ended tubular connection confirmed by 3D tomography and correlative light and electron microscopy (CLEM).
(A, B) 3D tomograph of open-ended tubular connection between HEK293T and MDA-MB-231. Z-stack images of the co-cultures were collected by confocal microscopy and analyzed using Imaris software. Donor cells: HEK293T with stable overexpression of SBP-Cas9-GFP/gRNA and Myc-streptavidin-CD63-mCherry (Str-CD63/SBP-Cas9/gRNA). Acceptor cell: MDA-MB-231. Green: SBP-Cas9-GFP; red: Myc-streptavidin-CD63-mCherry; purple: CF640R WGA conjugate. The top and lateral view of a contact site are shown in (B). Scale bar is 10 μm. (C–E) The ultrastructure of an open-ended tubular connection visualized by CLEM. (C) The open-ended tubular connection between HEK293T and MDA-MB-231 imaged by confocal microscopy. Green: SBP-Cas9-GFP; red: Myc-streptavidin-CD63-mCherry; purple: CF640R WGA conjugates; blue: Hoechst 33342. Scale bar is 10 μm. (D) The same area was imaged by transmission electron microscopy. Scale bar is 10 μm. (E) The area in white frame in (D) was examined and images were stacked. The plasma membrane of the membrane tube was traced manually with yellow line (from HEK293T) or blue line (from MDA-MB-231). Mitochondria and endosome-related vesicles were indicated by black and white arrows, respectively. Scale bar is 1 μm.
Figure 5—video 1
Open-ended tubular connection visualized by 3D tomography.
3D tomography of open-ended tubular connection structure between HEK293T and MDA-MB-231. The merged (Figure 5—video 1) and WGA-only channel (Figure 5—video 2) are shown. Scale bar is 10 μm. The videos were generated using Imaris software.
Figure 5—video 2
Open-ended tubular connection visualized by 3D tomography (WGA only channel).
The video including scale bar is uploaded to replace the previous one.
Figure 6 with 1 supplement
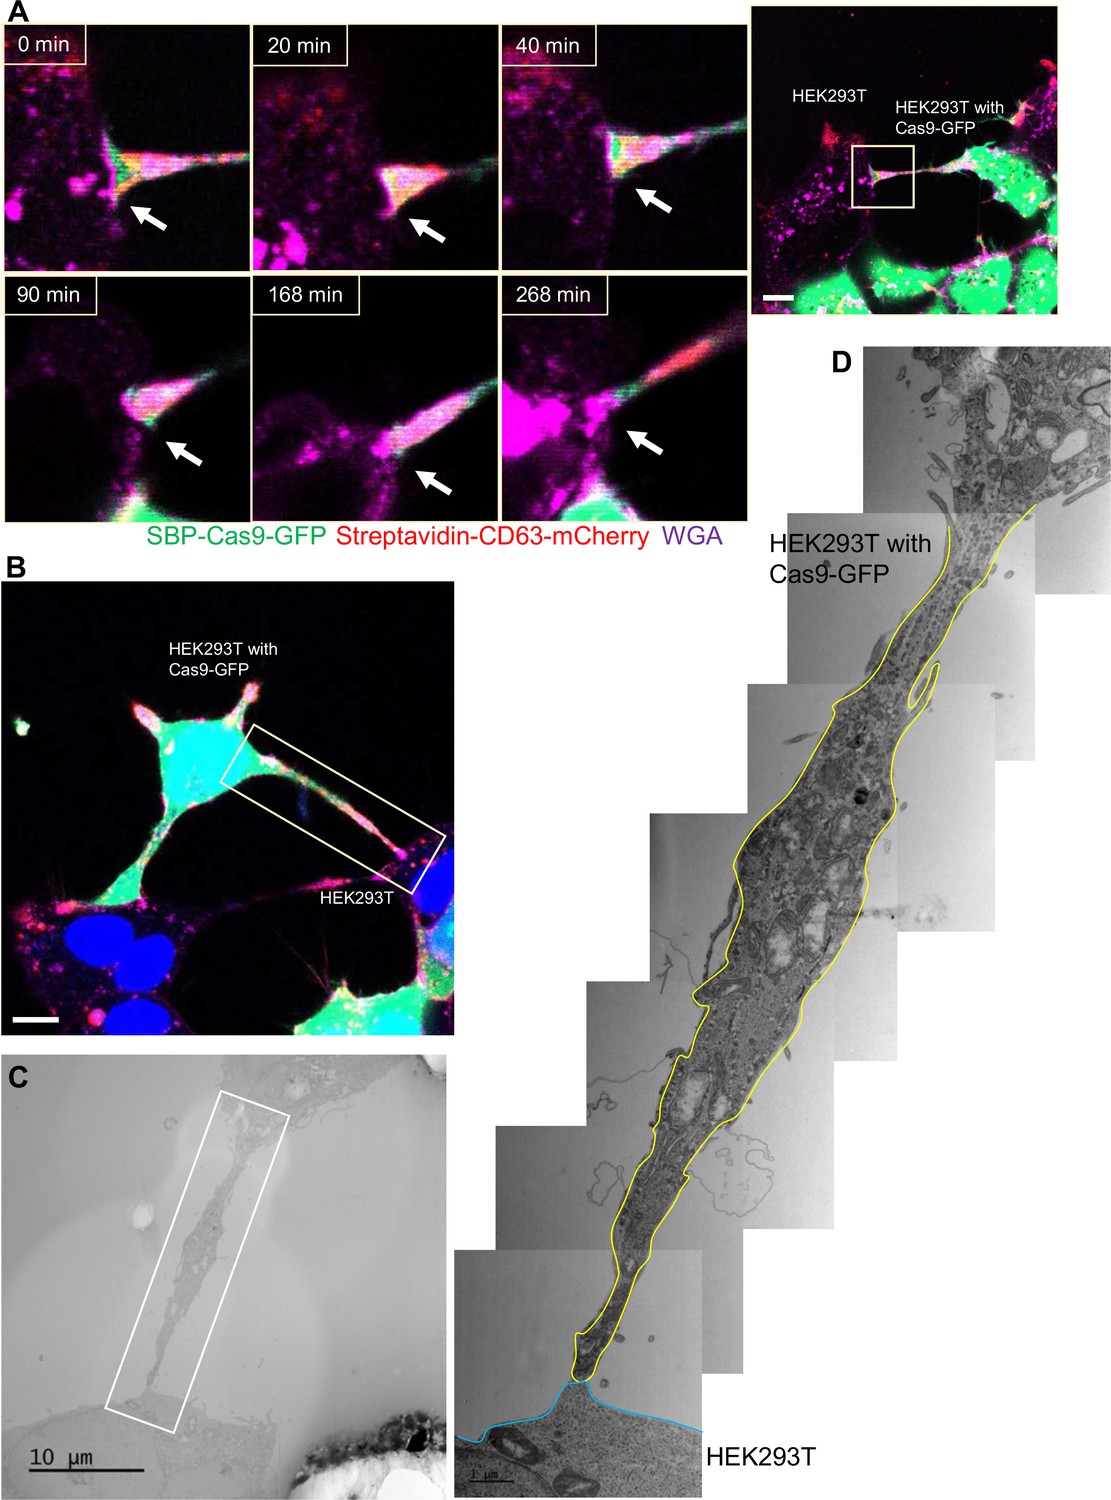
Close-ended tubular connection between HEK293T cells.
(A) Visualization of close-ended membrane tube structure and time-lapse imaging of the co-culture. Donor cells: HEK293T with stable overexpression of SBP-Cas9-GFP/gRNA and Myc-streptavidin-CD63-mCherry (Str-CD63/SBP-Cas9/gRNA). Acceptor cell: HEK293T. Green: SBP-Cas9-GFP; red: Myc-streptavidin-CD63-mCherry; purple: CF640R WGA conjugate. Scale bar is 10 μm. The white arrows indicate a close-ended membrane tube. (B–D) Close-ended membrane tube ultrastructure visualized by correlative light and electron microscopy (CLEM). (B) The close-ended membrane tube between HEK293T cells was imaged by confocal microscopy. Green: SBP-Cas9-GFP; red: Myc-streptavidin-CD63-mCherry; purple: CF640R WGA conjugates; blue: Hoechst 33342. Scale bar is 10 μm. (C) The same area was imaged by transmission electron microscopy. Scale bar is 10 μm. (D) The area in white frame in (C) was examined and images were stacked. The plasma membrane of the membrane tube traced manually with a yellow (from HEK293T with Cas9-GFP) or blue line (from HEK293T WT). Scale bar is 1 μm.
Figure 6—video 1
Close-ended tunneling tubular connection formed between HEK293T cells.
Donor cell: HEK293T with stable overexpression of SBP-Cas9-GFP/gRNA and Myc-streptavidin-CD63-mCherry (Str-CD63/SBP-Cas9/gRNA). Acceptor cell: HEK293T. Scale bar is 10 μm. Green: SBP-Cas9-GFP; red: Myc-streptavidin-CD63-mCherry; purple: CF640R WGA conjugate.
Figure 7 with 1 supplement
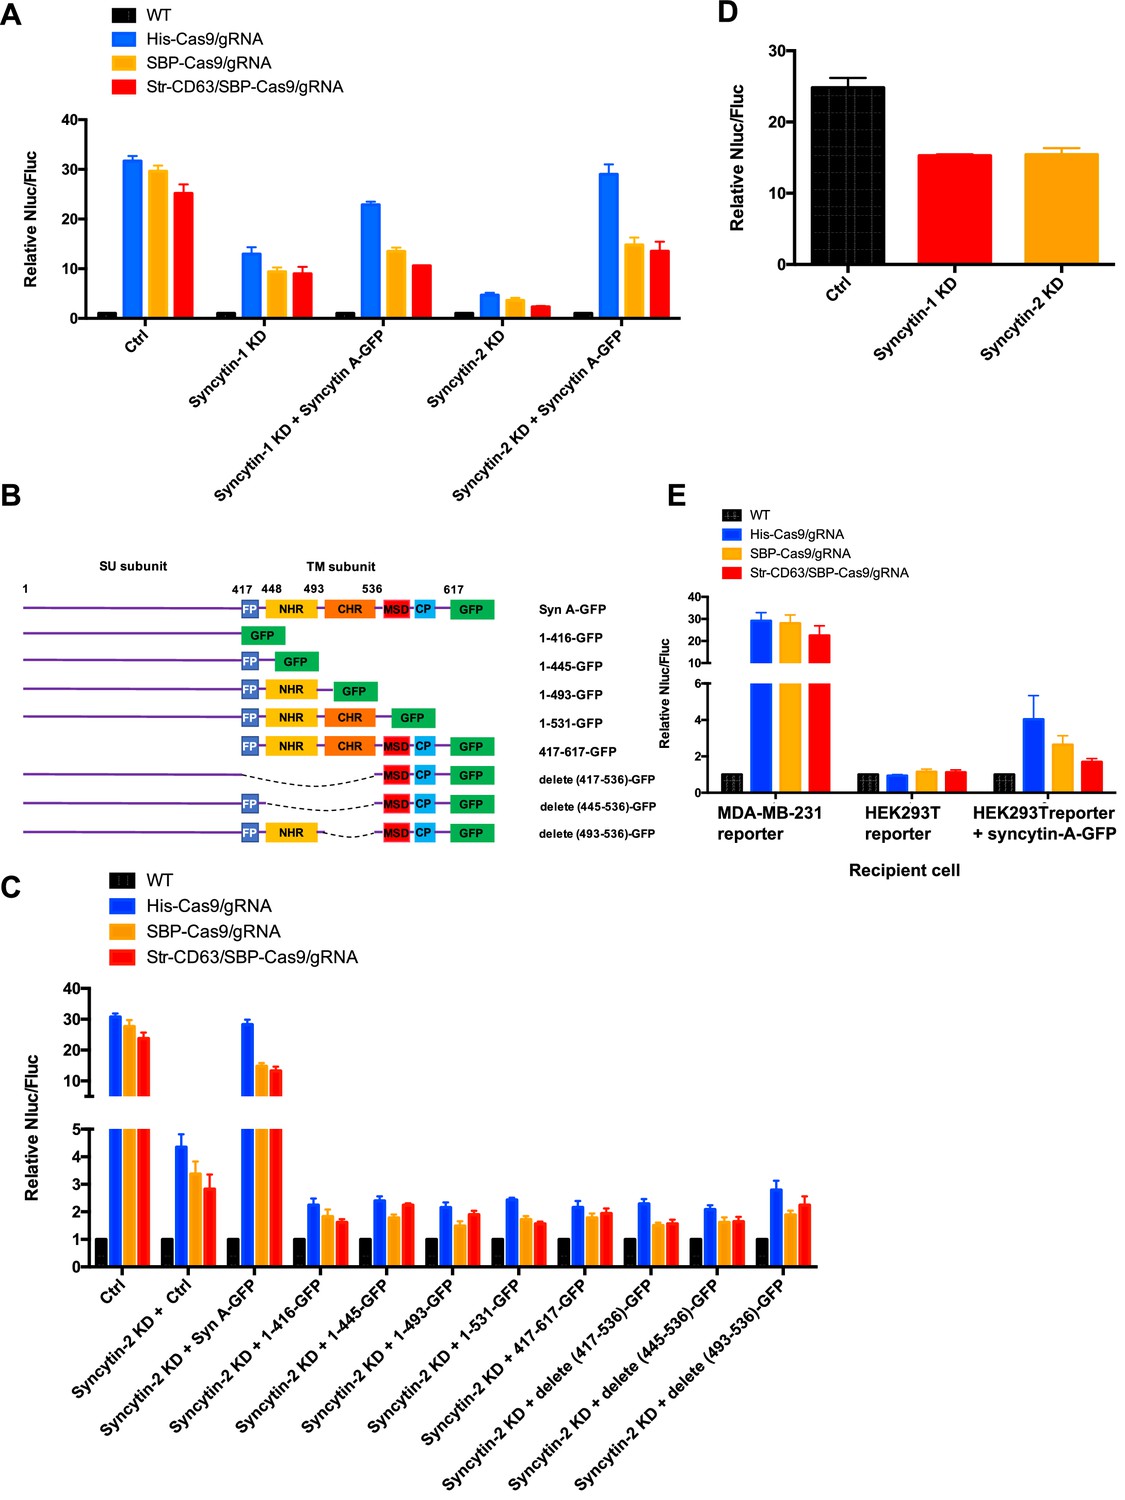
Syncytins in MDA-MB-231 regulate intercellular transfer of Cas9 protein.
(A) Donor cells: HEK293T wild-type (WT) with stable overexpression of his tagged Cas9-GFP/gRNA (His-Cas9/gRNA), with stable overexpression of SBP-tagged Cas9-GFP/gRNA (SBP-Cas9/gRNA) or with stable overexpression of SBP-Cas9-GFP/gRNA and Myc-streptavidin-CD63-mCherry (Str-CD63/SBP-Cas9/gRNA). The recipient cells are MDA-MB-231 with reporter plasmid only (Ctrl), syncytin-1 knockdown (syncytin-1 KD), syncytin-1 knockdown, as well as expression of GFP-fused mouse syncytin A (syncytin-1 KD+syncytin A-GFP), syncytin-2 knockdown (syncytin-2 KD), or syncytin-2 knockdown as well as expression of GFP-fused mouse syncytin A (syncytin-2 KD+syncytin-A-GFP). Donor cells and acceptor cells were co-cultured for 3 days followed by quantitative assay of nanoluciferase and firefly luciferase. Nluc/Fluc assays were performed and normalized to an aliquot of co-cultured WT donor and reporter cells. Data represent mean ± SEM, n ≥ 3. (B) The architecture of mouse syncytin-A and schematic showing the truncations of syncytin-A. (C) Donor cells were the same as in (A). The recipient cells were MDA-MB-231 with reporter plasmid only (Ctrl), syncytin-2 knockdown (syncytin-2 KD+Ctrl), syncytin-2 knockdown, as well as expression of GFP-fused mouse syncytin-A (syncytin-2 KD+syncytin A-GFP), or syncytin-2 knockdown as well as expression of GFP-fused truncated syncytin-A (syncytin-2 KD+truncated syncytin A-GFP). Donor cells and recipient cells were co-cultured for 3 days. Nluc/Fluc assays were performed and normalized to an aliquot of co-cultured WT donor and reporter cells. Data represent mean ± SEM, n ≥ 3. (D) Donor cells: HEK293T with stable overexpression of SBP-tagged Cas9-GFP/gRNA (SBP-Cas9/gRNA) (CTRL), syncytin-1 knockdown, or syncytin-2 knockdown. The recipient cell line is MDA-MB-231 with reporter plasmid. The donor cells and recipient cells were co-cultured for 3 days. Nluc/Fluc assays were performed and normalized to an aliquot of co-cultured WT donor and reporter cells. Data represent mean ± SEM, n ≥ 3. (E) Donor cells were same as in (A). The recipient cells were MDA-MB-231 with reporter plasmid, HEK293T with reporter plasmid, or HEK293T with reporter plasmid as well as expression of GFP-fused mouse syncytin-A. The donor cells and recipient cells were co-cultured for 3 days. Nluc/Fluc assays were performed and normalized to an aliquot of co-cultured WT donor and reporter cells. Data represent mean ± SEM, n ≥ 3.
Figure 7—figure supplement 1
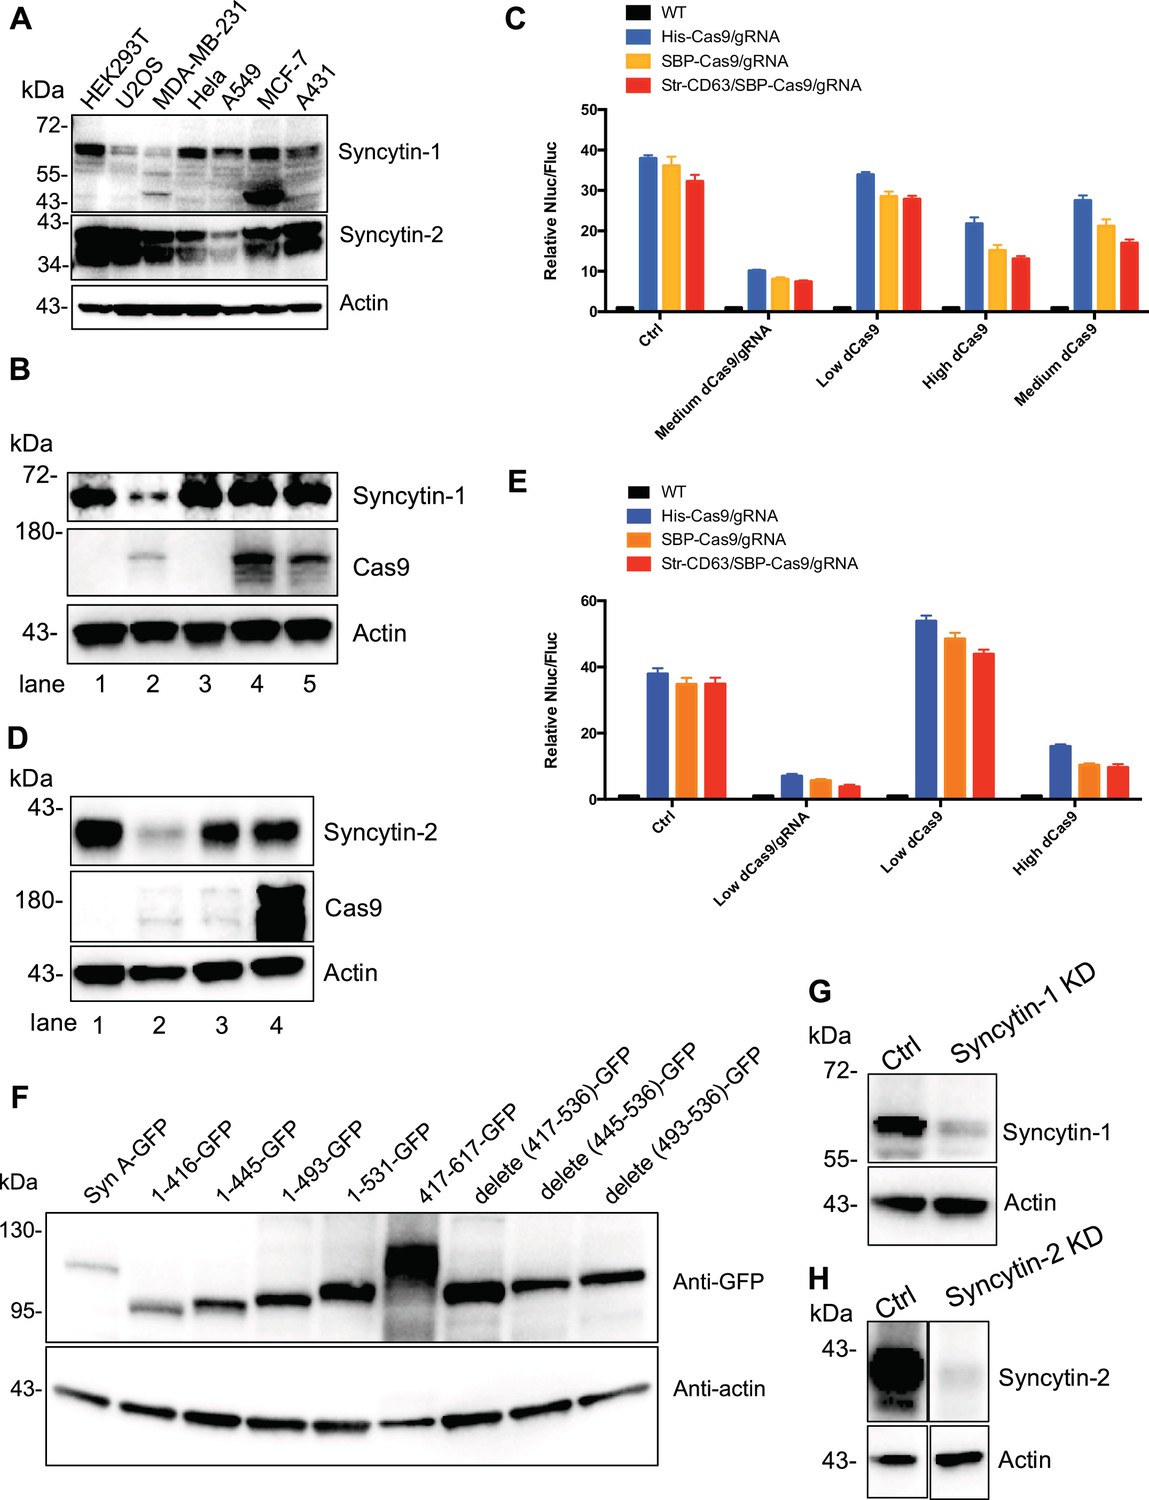
Confirmation of syncytin expression and knockdown.
(A) Human endogenous fusogen, syncytins expressed in different cell lines. (B) Syncytin-1 was knocked down in MDA-MB-231 reporter cells using CRISPRi. We varied the level of dCas9 alone (low, medium, and high) to determine the effect of CRISPRi on the Nluc/Fluc signal. Lane 1, reporter cell with control plasmid; lane 2, reporter cell with medium level of dCas9 and gRNA for syncytin-1 knockdown; lane 3, reporter cell with low level of dCas9 only; lane 4, reporter cell with high level of dCas9 only; lane 5, reporter cell with medium level of dCas9 only. Syncytin-1 was knocked down in lane 2 where the level of dCas9 was similar to the medium level of dCas9 in lane 5. (C) Donor cells: HEK293T wild-type (WT) with stable overexpression of his tagged Cas9-GFP/gRNA (His-Cas9/gRNA), with stable overexpression of SBP-tagged Cas9-GFP/gRNA (SBP-Cas9/gRNA) or with stable overexpression of SBP-Cas9-GFP/gRNA and Myc-streptavidin-CD63-mCherry (Str-CD63/SBP-Cas9/gRNA). The recipient cells were MDA-MB-231 with reporter plasmid only (Ctrl), medium level of dCas9/gRNA for syncytin-1 knockdown, low level of dCas9, high level of dCas9, or medium level of dCas9. The donor cells and recipient cells were co-cultured for 3 days. Nluc/Fluc assays were performed and normalized to an aliquot of co-cultured WT donor and reporter cells. Data represent mean ± SEM, n ≥ 3. Syncytin-1 level was reduced by knockdown but not by dCas9 expression alone. (D) Syncytin-2 was knocked down in MDA-MB-231 reporter cells using CRISPRi. Lane 1, reporter cell with control plasmid; lane 2, reporter cell with low level of dCas9 and gRNA for syncytin-2 knockdown; lane 3, reporter cell with low level of dCas9 only; lane 4, reporter cell with high level of dCas9 only. Syncytin-2 was knocked down in lane 2 where the level of dCas9 was similar to the low level of dCas9 in lane 3. (E) Donor cells were same as in (C). The recipient cells are MDA-MB-231 with reporter plasmid only (Ctrl), low level of dCas9/gRNA for Syncytin-2 knockdown, low level or high level of dCas9 alone. The donor cells and recipient cells were co-cultured for 3 days. Nluc/Fluc assays were performed and normalized to an aliquot of co-cultured WT donor and reporter cells. Data represent mean ± SEM, n ≥ 3. Syncytin-2 knockdown but not dCas9 expression alone reduced the signal. (F) The GFP-fused syncytin-A truncations were expressed in MDA-MB-231 cells and detected by immunoblot. *417–617-GFP may migrate as oligomeric species. (G, H) syncytin-1 (G) or syncytin-2 (H) was knocked down in HEK293T with stable overexpression of SBP tagged Cas9-GFP/gRNA (SBP-Cas9/gRNA).
-
Figure 7—figure supplement 1—source data 1
Uncropped Western blot images corresponding to Figure 7—figure supplement 1A.
- https://cdn.elifesciences.org/articles/84391/elife-84391-fig7-figsupp1-data1-v2.zip
-
Figure 7—figure supplement 1—source data 2
Uncropped Western blot images corresponding to Figure 7—figure supplement 1B.
- https://cdn.elifesciences.org/articles/84391/elife-84391-fig7-figsupp1-data2-v2.zip
-
Figure 7—figure supplement 1—source data 3
Uncropped Western blot images corresponding to Figure 7—figure supplement 1D.
- https://cdn.elifesciences.org/articles/84391/elife-84391-fig7-figsupp1-data3-v2.zip
-
Figure 7—figure supplement 1—source data 4
Uncropped Western blot images corresponding to Figure 7—figure supplement 1F.
- https://cdn.elifesciences.org/articles/84391/elife-84391-fig7-figsupp1-data4-v2.zip
-
Figure 7—figure supplement 1—source data 5
Uncropped Western blot images corresponding to Figure 7—figure supplement 1G.
- https://cdn.elifesciences.org/articles/84391/elife-84391-fig7-figsupp1-data5-v2.zip
-
Figure 7—figure supplement 1—source data 6
Uncropped Western blot images corresponding to Figure 7—figure supplement 1H.
- https://cdn.elifesciences.org/articles/84391/elife-84391-fig7-figsupp1-data6-v2.zip
Figure 8 with 2 supplements
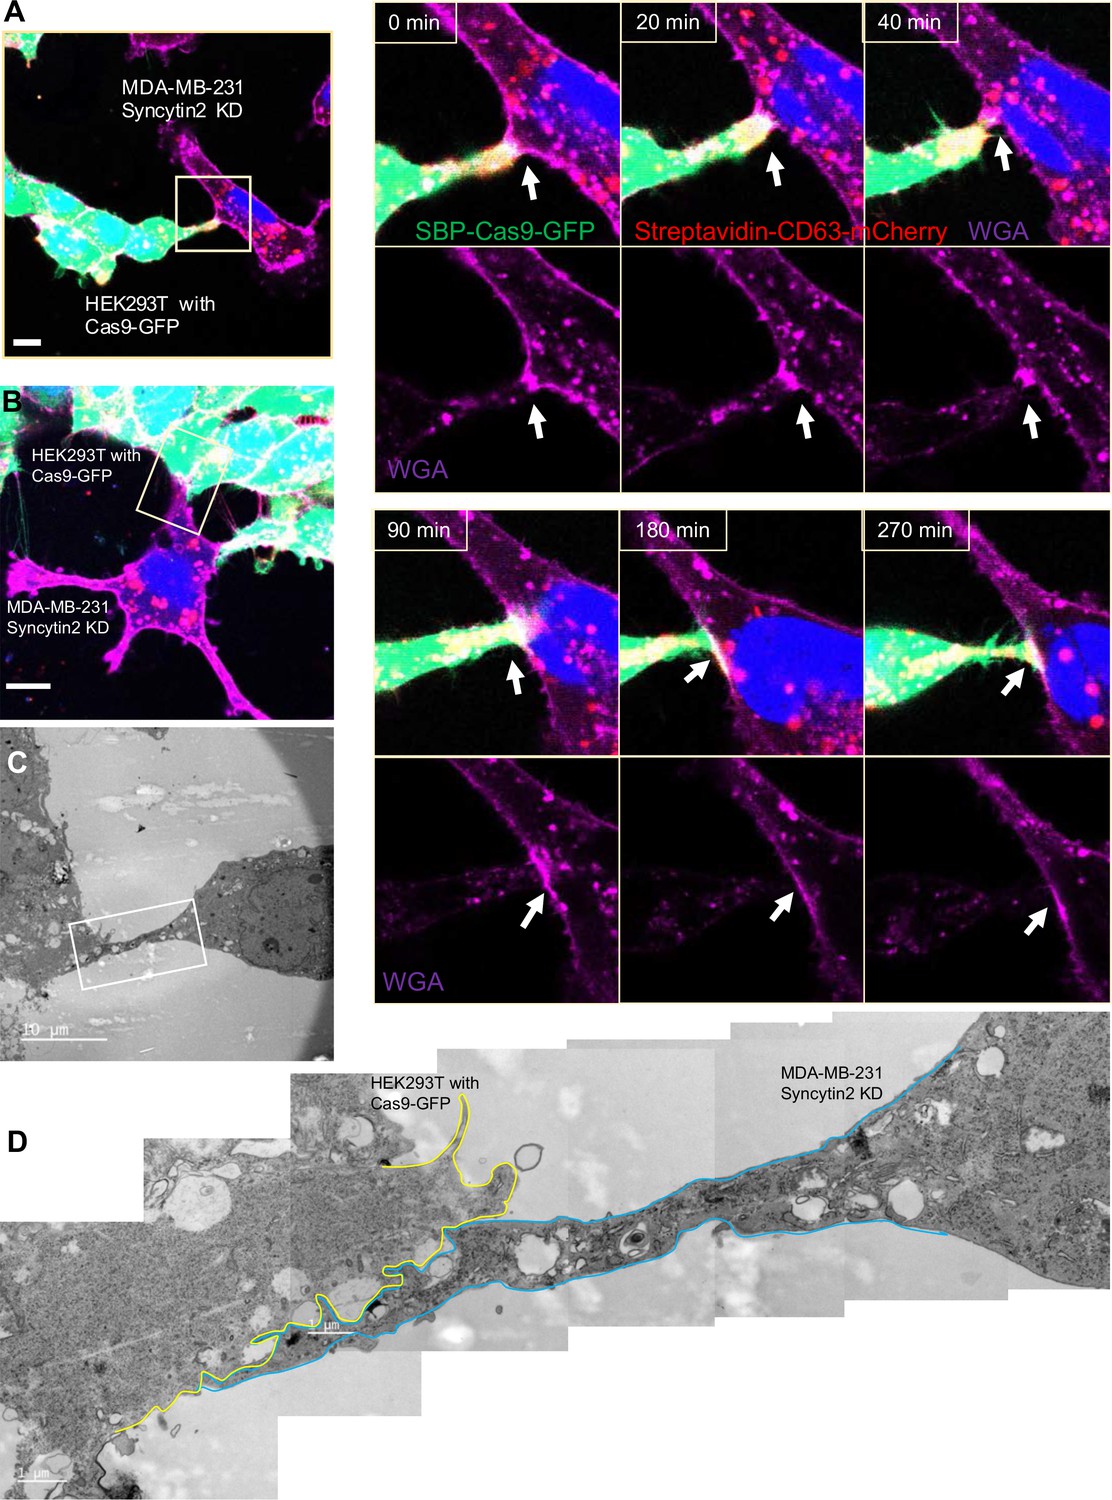
Syncytin-2 knockdown in MDA-MB-231 form close-ended tubular connection.
(A) Visualization of close-ended membrane tube structure and time-lapse imaging of a co-culture of HEK293T with stable overexpression of Str-CD63/SBP-Cas9/gRNA with MDA-MB-231 Syncytin-2 knockdown cells containing Fluc:Nluc:mCherry. Green: SBP-Cas9-GFP; purple: CF640R WGA conjugates; blue: Hoechst 33342. Scale bar is 10 μm. The white arrows indicate a close-ended membrane tube. Of note, the red signal in MDA-MB-231 may be the mCherry signal from the reporter plasmid. (B–D) Close-ended membrane tube ultrastructure was visualized by correlative light and electron microscopy (CLEM). (B) The close-ended membrane tube between HEK293T cells and MDA-MB-231 with syncytin-2 knockdown was imaged by confocal microscopy. Green: SBP-Cas9-GFP; red: Myc-streptavidin-CD63-mCherry; purple: CF640R WGA conjugates; blue: Hoechst 33342. Scale bar is 10 μm. (C) The same area was imaged by transmission electron microscopy. Scale bar is 10 μm. (D) The area in white frame in (C) was examined and images were stacked. The plasma membrane of the membrane tube was traced manually with a yellow (from HEK293T with Cas9-GFP) or blue line (from MDA-MB-231 with Syncytin-2 knockdown). Scale bar is 1 μm.
Figure 8—figure supplement 1
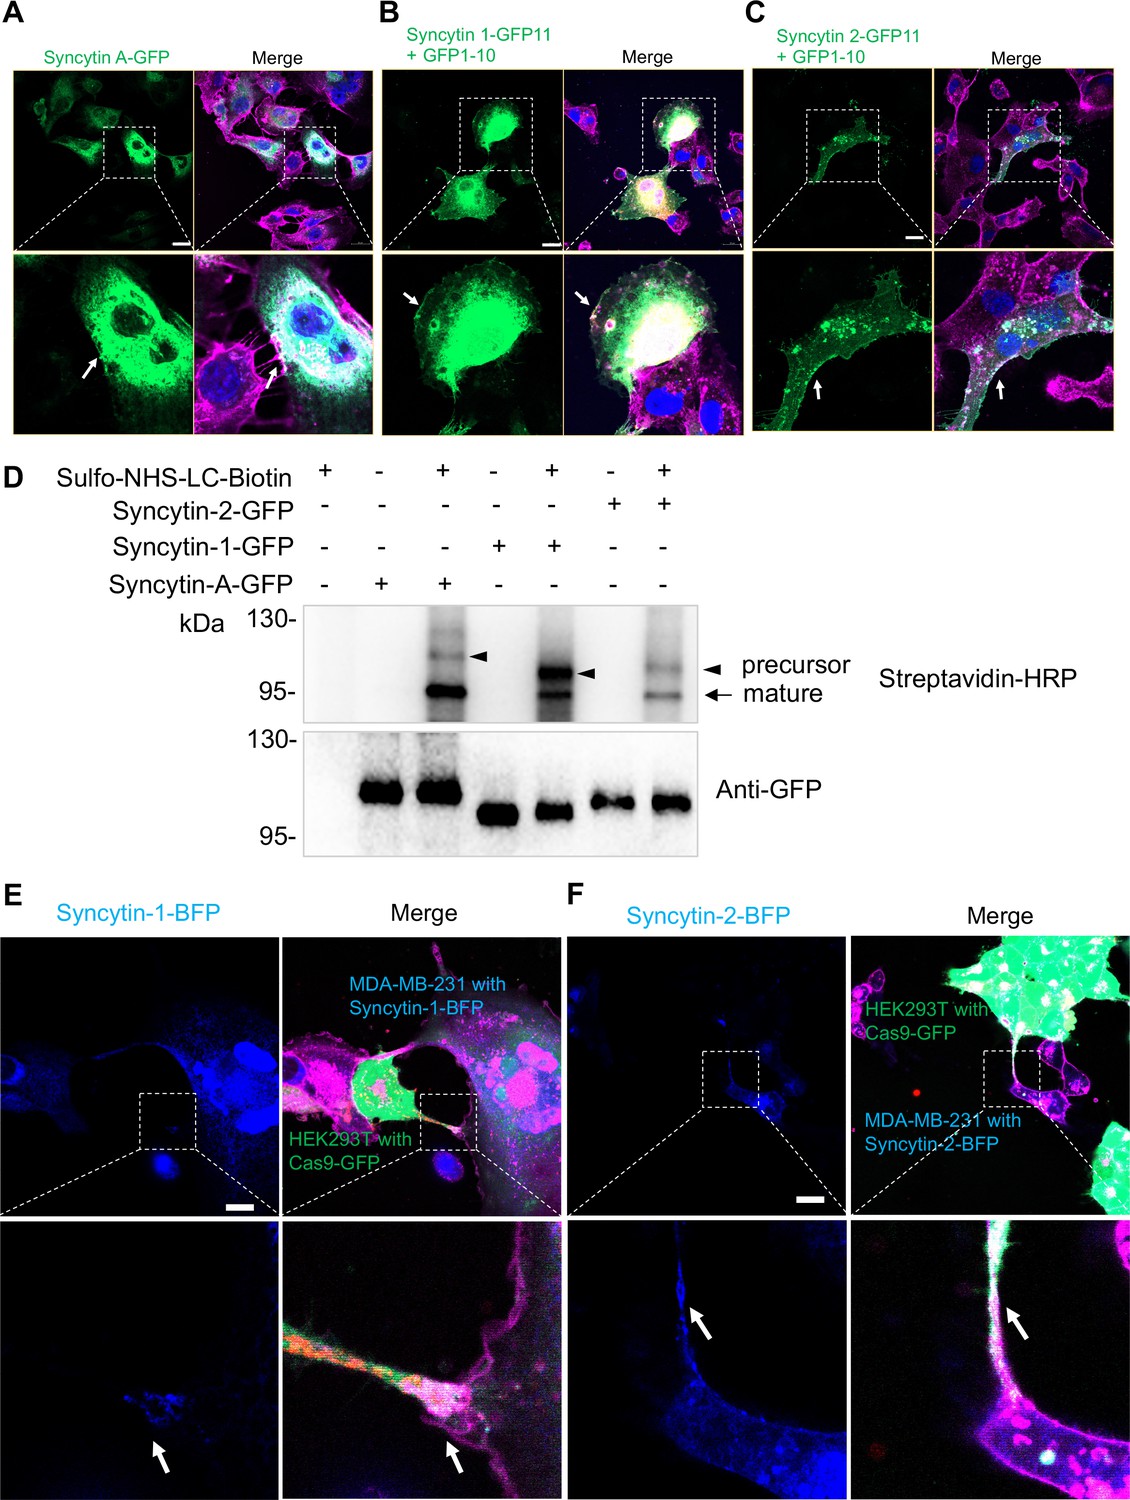
Localization of syncytins at cell surface and sites of cell-cell contact.
(A) Syncytin A-GFP was transfected in MDA-MB-231 cells. Cells were fixed and stained with a CF640R WGA conjugate. White arrows indicate the localization of syncytin A at or near the plasma membrane. Scale bar is 20 μm. (B) Syncytin 1-GFP11 and GFP1-10 were co-transfected in MDA-MB-231 cells. Cells were fixed and stained by with a CF640R-WGA conjugate. White arrows indicate the localization of syncytin-1 at or near the plasma membrane. Scale bar is 20 μm. (C) Syncytin 2-GFP11 and GFP1-10 were co-transfected in MDA-MB-231 cells. Cells were fixed and stained with a CF640R-WGA conjugate. White arrows indicate the localization of syncytin-2 at or near the plasma membrane. Scale bar is 20 μm. (D) Cell surface protein biotinylation assay. GFP-tagged syncytin-A, syncytin-1, or syncytin-2 were expressed in MDA-MB-231 cells that were treated with a sulfo-NHS-LC-biotin reagent under conditions where biotinylation is restricted to proteins exposed on the cell exterior. After treatment, the reaction was quenched and cells were washed and lysed, followed by immunoprecipitation with GFP antibody. GFP-IP samples were probed by blotting with GFP and with streptavidin-HRP. Note the precursor (arrowheads) and mature (arrow) forms of syncytin detected in the streptavidin-HRP blot. In contrast, GFP immunoblots of immunoprecipitated syncytin-GFP fusions detected only full-length precursor proteins. (E) MDA-MB-231 cells transfected with syncytin 1-BFP were co-cultured with HEK293T transfected with SBP-Cas9-GFP/gRNA and Myc-streptavidin-CD63-mCherry. Cells were stained with a CF640R-WGA conjugate (purple). White arrows indicate the localization of syncytin-1 at a point of cell-cell contact. Scale bar is 20 μm. (F) MDA-MB-231 cells transfected with syncytin 2-BFP were co-cultured with HEK293T transfected with SBP-Cas9-GFP/gRNA and Myc-streptavidin-CD63-mCherry. Cells were stained with a CF640R-WGA conjugate (purple). White arrows indicate the localization of syncytin-2 at a point of cell-cell contact site. Scale bar is 20 μm.
-
Figure 8—figure supplement 1—source data 1
Uncropped Western blot images corresponding to Figure 8—figure supplement 1D.
- https://cdn.elifesciences.org/articles/84391/elife-84391-fig8-figsupp1-data1-v2.zip
Figure 8—video 1
Syncytin-2 knockdown in MDA-MB-231 blocks plasma membrane fusion to form a close-ended tubular connection.
Donor cells: HEK293T with stable overexpression of SBP-Cas9-GFP/gRNA and Myc-streptavidin-CD63-mCherry (Str-CD63/SBP-Cas9/gRNA). Acceptor cell: MDA-MB-231 with Syncytin-2 knockdown. Scale bar is 10 μm. Green: SBP-Cas9-GFP; red: Myc-streptavidin-CD63-mCherry; purple: CF640R WGA conjugates; blue: Hoechst 33342.
Figure 9
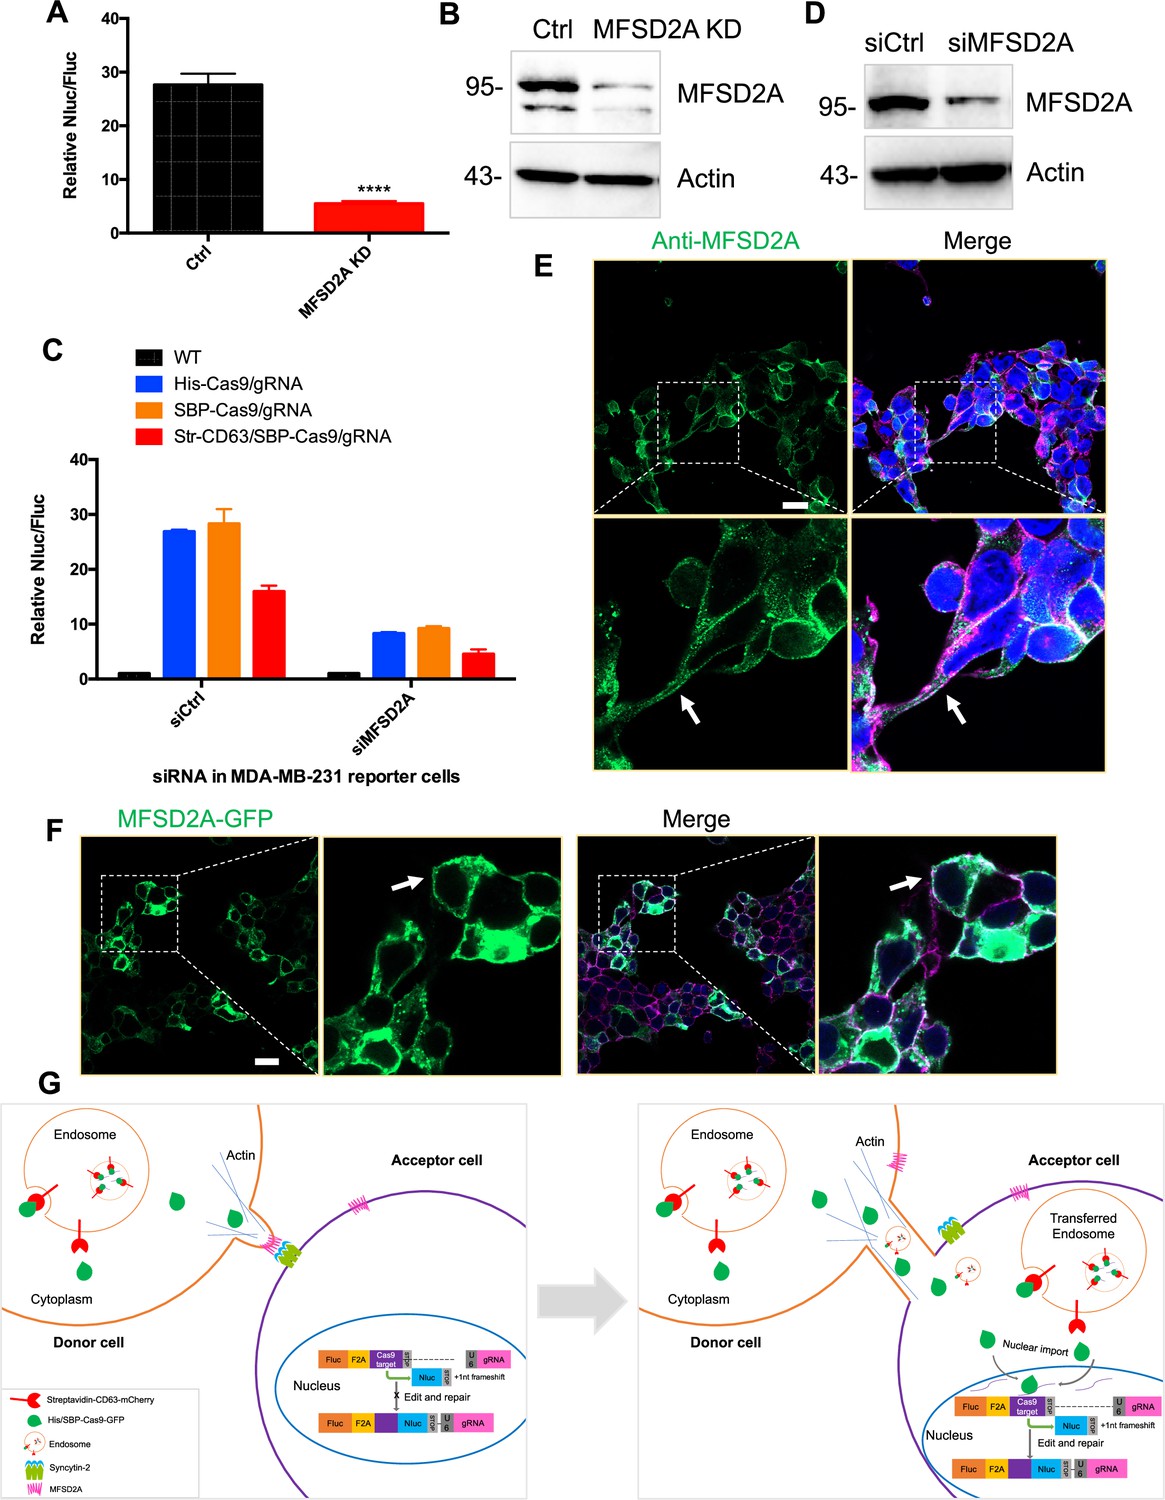
MFSD2A knockdown in in both HEK293T and MDA-MB-231 cells reduced intercellular transfer of Cas9.
(A) Donor cells: HEK293T with stable overexpression of SBP-tagged Cas9-GFP/gRNA (SBP-Cas9/gRNA) (Ctrl), or MFSD2A knockdown. The recipient cell line is MDA-MB-231 with reporter plasmid. The donor cells and recipient cells were co-cultured for 3 days. Nluc/Fluc was measured and the data normalized to WT donor cells. Data represent mean ± SEM, n ≥ 3. ****p<0.0001, one-way ANOVA. (B) MFSD2A was knocked down in HEK293T with stable overexpression of SBP-tagged Cas9-GFP/gRNA (SBP-Cas9/gRNA). (C) Donor cells: HEK293T wild-type (WT) with stable overexpression of his-tagged Cas9-GFP/gRNA (His-Cas9/gRNA), with stable overexpression of SBP-tagged Cas9-GFP/gRNA (SBP-Cas9/gRNA) or with stable overexpression of SBP-Cas9-GFP/gRNA and myc-streptavidin-CD63-mCherry (Str-CD63/SBP-Cas9/gRNA). The recipient cells are MDA-MB-231 with reporter plasmid (siCtrl), or MFSD2A knockdown (siMFSD2A). Donor cells and recipient cells were co-cultured for 3 days. Nluc/Fluc assays were performed and normalized to an aliquot of co-cultured WT donor and reporter cells. Data represent mean ± SEM, n ≥ 3. (D) MFSD2A was knocked- own in MDA-MB-231 with reporter plasmid. (E) MFSD2A localization in HEK293T cells was detected by immunofluorescence using anti-MFSD2A antibody (green). The cells were stained by Hoechst 33342 and a CF640R-WGA conjugate. White arrows indicate the localization of MFSD2A at or near the plasma membrane. Scale bar is 20 μm. (F) MFSD2A-GFP was transfected in HEK293T cells. Cells were fixed and stained with a CF640R-WGA conjugate. White arrows indicate the localization of MFSD2A at or near the plasma membrane. Scale bar is 20 μm. (G) Model: donor and recipient cells form actin-based tubular protrusions projecting from donor cells (or both of donor and recipient cells) (left). Tubules adhere to recipient cell surface. The human endogenous fusogen, syncytin (especially syncytin-2), expressed on the acceptor cell surface then interacts with its receptor, MFSD2A, on the donor cell surface to facilitate plasma membrane fusion forming an open-ended tubular connection. Cargo, including endosomes and mitochondria, as well as Cas9 protein (free or bound to endosomes) and presumably other proteins and RNA, transfer from donor cells to recipient cells (right). Cytoplasmic Cas9 protein enters the nucleus inducing genome editing and Nluc expression (right). Of note, in cells such as MDA-MB-231, both syncytin-2 and MFSD2A are functional.
-
Figure 9—source data 1
Uncropped Western blot images corresponding to Figure 9B.
- https://cdn.elifesciences.org/articles/84391/elife-84391-fig9-data1-v2.zip
-
Figure 9—source data 2
Uncropped Western blot images corresponding to Figure 9D.
- https://cdn.elifesciences.org/articles/84391/elife-84391-fig9-data2-v2.zip
Tables
Key resources table
| Reagent type (species) or resource | Designation | Source or reference | Identifiers | Additional information |
|---|---|---|---|---|
| Cell line (Homo sapiens) | HEK293T cells | Cell Culture Facility, UC Berkeley | N/A | |
| Cell line (H. sapiens) | U2OS cells | Cell Culture Facility, UC Berkeley | N/A | |
| Cell line (H. sapiens) | MDS-MB-231 cells | Cell Culture Facility, UC Berkeley | N/A | |
| Cell line (H. sapiens) | A549 cells | Cell Culture Facility, UC Berkeley | N/A | |
| Cell line (H. sapiens) | MCF7 cells | Cell Culture Facility, UC Berkeley | N/A | |
| Cell line (H. sapiens) | Hela cells | Cell Culture Facility, UC Berkeley | N/A | |
| Cell line (H. sapiens) | A431 cells | Cell Culture Facility, UC Berkeley | N/A | |
| Transfected construct (human) | siRNA to CLTC | QIAGEN | Hs_CLTC_10 FlexiTube siRNA, SI00299880 | Transfected construct (human) |
| Transfected construct (human) | siRNA to AP2B1 | QIAGEN | Hs_AP2B1_6 FlexiTube siRNA, SI02780085 | Transfected construct (human) |
| Transfected construct (human) | siRNA to CAV-1 | QIAGEN | Hs_CAV1_10 FlexiTube siRNA, SI00299642 | Transfected construct (human) |
| Transfected construct (human) | siRNA to FLOT2 | QIAGEN | Hs_FLOT2_5 FlexiTube siRNA, SI02781422 | Transfected construct (human) |
| Transfected construct (human) | siRNA to MFSD2A | QIAGEN | Hs_MFSD2_1 FlexiTube siRNA, SI04137854 | Transfected construct (human) |
| Antibody | Anti-GFP (rabbit polyclonal) | Torrey Pines Biolabs | Cat# AB_10013661 | WB (1:1000) |
| Antibody | Anti-myc (mouse monoclonal) | Cell Signaling Technology | Cat# 2276s | WB (1:1000) |
| Antibody | Anti-syntenin (rabbit polyclonal) | Santa Cruz Biotechnology | Cat# sc-48742 | WB (1:200) |
| Antibody | Anti-TSG101 (mouse monoclonal) | GeneTex | Cat# GTX70255 | WB (1:1000) |
| Antibody | Anti-CD81 (mouse monoclonal) | Santa Cruz Biotechnology | Cat# sc-166029 | WB (1:200) |
| Antibody | Anti-CD9 (rabbit monoclonal) | Cell Signaling Technology | Cat# AB_2798139 | WB (1:1000) |
| Antibody | Anti-CD63 (rabbit monoclonal) | Abcam | Cat# ab134045 | IF (1:300) |
| Antibody | Anti-CLTC (mouse monoclonal) | BD Transduction Laboratories | Cat# AB_397866 | WB (1:1000) |
| Antibody | Anti-AP2B1 (rabbit polyclonal) | Proteintech | Cat# 15690-1-AP | WB (1:1000) |
| Antibody | Anti-CAV1 (rabbit polyclonal) | Proteintech | Cat# 16447-1-AP | WB (1:1000) |
| Antibody | Anti-FLOT2 (mouse monoclonal) | BD Transduction Laboratories | Cat# 610384 | WB (1:1000) |
| Antibody | Anti-actin (rabbit monoclonal) | Cell Signaling Technology | Cat# 8457S | WB (1:1000) |
| Antibody | Anti-tubulin (mouse monoclonal) | Abcam | Cat# ab7291 | WB (1:1000) |
| Antibody | Anti-Arp2 (rabbit polyclonal) | Proteintech | Cat# 10922-1-AP | WB (1:1000) |
| Antibody | Anti-Arp3 (rabbit polyclonal) | Proteintech | Cat# 13822-1-AP | WB (1:1000) |
| Antibody | Anti-syncytin 1 (rabbit polyclonal) | Thermo Fisher Scientific | Cat# BS-2962R | WB (1:1000) |
| Antibody | Anti-syncytin 2 (rabbit polyclonal) | Thermo Fisher Scientific | Cat# PA5-109694 | WB (1:1000) |
| Antibody | Anti-MFSD2A (rabbit polyclonal) | OriGene Technologies | Cat# TA351394 | WB (1:1000) IF (1:300) |
| Antibody | Anti-Cas9 (mouse monoclonal) | Novus Biologicals | Cat# NBP2-36440 | WB (1:1000) |
| Recombinant DNA reagent | pUCOE- EF1a-dCas9-BFP-KRAB (plasmid) | Dr. Jonathan Weissman (Whitehead Institute, MIT) | Express dCas9-BFP-KRAB in cells for CRISPRi | |
| Recombinant DNA reagent | pMyc-streptavidin-CD63-mCherry (plasmid) | This study | Express Myc-streptavidin-CD63-mCherry in cells | |
| Recombinant DNA reagent | pSBP-flag-Cas9-GFP (plasmid) | This study | Express SBP-flag-Cas9-GFP in cells | |
| Recombinant DNA reagent | pHis-flag-Cas9-GFP (plasmid) | This study | His-flag-Cas9-GFP in cells | |
| Recombinant DNA reagent | pFluc-cas9 target-Nluc-IRES-mCherry (plasmid) | This study | Reporter for Cas9 editing | |
| Recombinant DNA reagent | pFluc-cas9 target-Nluc1-Nluc2-IRES-mCherry (plasmid) | This study | Reporter for Cas9 editing | |
| Recombinant DNA reagent | pRluc-FLXXUC-IRES-mCherry (plasmid) | This study | Reporter for Cas9 editing | |
| Recombinant DNA reagent | pLKO.1-shactin (plasmid) | This study | Lentiviral construct to transfect and express the shRNA | |
| Recombinant DNA reagent | pLKO.1-sharp2 (plasmid) | This study | Lentiviral construct to transfect and express the shRNA | |
| Recombinant DNA reagent | pLKO.1-sharp3 (plasmid) | This study | Lentiviral construct to transfect and express the shRNA | |
| Recombinant DNA reagent | pCD63-7GFP11-IRES-CFP (plasmid) | This study | Express CD63-7GFP11 and CFP in cells | |
| Recombinant DNA reagent | pGFP10-IRES-mCherry (plasmid) | This study | Express GFP10 and mCherry in cells | |
| Recombinant DNA reagent | pU6_sgRNA_CAG_puroR (plasmid) | Addgene | Express sgRNA for CRISPRi | |
| Recombinant DNA reagent | pSyncytin A-GFP (plasmid) | This study | Express Syncytin A-GFP in cells | |
| Recombinant DNA reagent | pSyncytin A (1-416)-GFP (plasmid) | This study | Express Syncytin A (1-416)-GFP in cells | |
| Recombinant DNA reagent | pSyncytin A (1-445)-GFP (plasmid) | This study | Express Syncytin A (1-445)-GFP in cells | |
| Recombinant DNA reagent | pSyncytin A (1-493)-GFP (plasmid) | This study | Express Syncytin A (1-493)-GFP in cells | |
| Recombinant DNA reagent | pSyncytin A (1-531)-GFP (plasmid) | This study | Express Syncytin A (1-531)-GFP in cells | |
| Recombinant DNA reagent | pSyncytin A (417-617)-GFP (plasmid) | This study | Express Syncytin A (417-617)-GFP in cells | |
| Recombinant DNA reagent | pSyncytin A delete (417-536)-GFP (plasmid) | This study | Express Syncytin A delete (417-536)-GFP in cells | |
| Recombinant DNA reagent | pSyncytin A delete (445-536)-GFP (plasmid) | This study | Express Syncytin A delete (445-536)-GFP in cells | |
| Recombinant DNA reagent | pSyncytin A delete (493-536)-GFP (plasmid) | This study | Express Syncytin A delete (493-536)-GFP in cells | |
| Recombinant DNA reagent | pSyncytin-1-BFP (plasmid) | This study | Syncytin-1-BFP in cells | |
| Recombinant DNA reagent | pSyncytin-2-BFP (plasmid) | This study | Syncytin-2-BFP in cells | |
| Recombinant DNA reagent | pLenti-Syncytin-1-GFP11 (plasmid) | This study | Express Syncytin-1-GFP11 in cells | |
| Recombinant DNA reagent | pLenti-Syncytin-2-GFP11 (plasmid) | This study | Express Syncytin-2-GFP11 in cells | |
| Recombinant DNA reagent | pSyncytin-1-GFP (plasmid) | This study | Express Syncytin-1-GFP in cells | |
| Recombinant DNA reagent | pSyncytin-2-GFP (plasmid) | This study | Express Syncytin-2-GFP in cells | |
| Recombinant DNA reagent | pMFSD2A-GFP (plasmid) | This study | Express MFSD2A-GFP in cells | |
| Chemical compound, drug | Biotin | Sigma | Cat# B4639 | |
| Chemical compound, drug | Proteinase K | Sigma | Cat# P2308 | |
| Chemical compound, drug | Micrococcal Nuclease | NEB | Cat# M0247S | |
| Chemical compound, drug | ANTI-FLAG M2 Affinity Gel | Sigma | Cat# A2220 | |
| Chemical compound, drug | SuperSignal West Pico PLUS | Thermo Fisher Scientific | Cat# PI34580 | |
| Chemical compound, drug | SuperSignal West Femto | Thermo Fisher Scientific | Cat# PI34096 | |
| Chemical compound, drug | TGIRT-III Enzyme | InGex | Matthew et al., PNAS (2017) | |
| Commercial assay or kit | Direct-zol RNA Miniprep Plus Kit | Zymo research | Cat# R2072 | |
| Commercial assay or kit | mirVana miRNA isolation kit | Thermo Fisher Scientific | Cat# AM1560 | |
| Commercial assay or kit | Nano-Glo Luciferase Assay | Promega | Cat# N1150 | |
| Commercial assay or kit | Luciferase Assay System | Promega | Cat# E4550 | |
| Commercial assay or kit | Luciferase reporter assay | Promega | Cat# E1910 | |
| Chemical compound, drug | PowerUp SYBR Green Master Mix | Thermo Fisher Scientific | Cat# A25741 | |
| Chemical compound, drug | Chlorpromazine | Sigma | Cat# C8138 | 5 µg/ml |
| Chemical compound, drug | LY294002 | Sigma | Cat# L9908 | 10 µM |
| Chemical compound, drug | Wortmannin | Sigma | Cat# W1628 | 1 µM |
| Chemical compound, drug | Latrunculin A | Enzo | Cat# BML-T119-0100 | 40, 80, 200 nM |
| Chemical compound, drug | Latrunculin B | Sigma | Cat# 428020 | 1, 2.5, 5 µM |
| Chemical compound, drug | SMIFH2 | Sigma | Cat# 344092 | 10, 25 µM |
| Chemical compound, drug | Hoechst 33342 | Thermo Fisher Scientific | Cat# H3570 | |
| Chemical compound, drug | Phrodo Red Transferrin Conjugate | Thermo Fisher Scientific | Cat# P35376 | |
| Chemical compound, drug | Phrodo Green Zymosan Bioparticles | Thermo Fisher Scientific | Cat# P35365 | |
| Chemical compound, drug | Molecular Probes pHrodo Green Dextran | Thermo Fisher Scientific | Cat# P35368 | |
| Chemical compound, drug | Sulfo-NHS-LC-Biotin | Thermo Fisher Scientific | Cat# 21335 | |
| Chemical compound, drug | GFP-Trap agarose beads | ChromoTek | Cat# gta-20 | |
| Chemical compound, drug | Streptavidin-HRP Conjugate | Thermo Fisher Scientific | Cat# SA10001 | |
| Chemical compound, drug | CF640R Wheat Germ Agglutinin (WGA) Conjugates | Biotium | Cat# 29026-1 | |
| Chemical compound, drug | Lipofectamine 2000 Transfection Reagent | Thermo Fisher Scientific | Cat# 11668019 | |
| Chemical compound, drug | Lipofectamine RNAiMAX Transfection Reagent | Thermo Fisher Scientific | Cat# 13778150 | |
| Other | Glass-bottom dish | Thermo Fisher Scientific | Cat# NC0699576 (Cellvis D35-20-1-N) | For confocal microscopy experiments |
| Other | Gridded glass-bottom dish | Thermo Fisher Scientific | Cat# NC1144968 | For CLEM experiments |
| Software, algorithm | Fiji | NIH | https://fiji.sc/ | |
| Software, algorithm | GraphPad Prism | GraphPad | https://www.graphpad.com | |
| Software, algorithm | Imaris | Oxford Instruments | https://imaris.oxinst.com/ |
Additional files
Download links
A two-part list of links to download the article, or parts of the article, in various formats.
Downloads (link to download the article as PDF)
Open citations (links to open the citations from this article in various online reference manager services)
Cite this article (links to download the citations from this article in formats compatible with various reference manager tools)
Syncytin-mediated open-ended membrane tubular connections facilitate the intercellular transfer of cargos including Cas9 protein
eLife 12:e84391.
https://doi.org/10.7554/eLife.84391


