Multi-ancestry meta-analysis of host genetic susceptibility to tuberculosis identifies shared genetic architecture
- DSI-NRF Centre of Excellence for Biomedical Tuberculosis Research, South African Medical Research Council Centre for Tuberculosis Research, Division of Molecular Biology and Human Genetics, Faculty of Medicine and Health Sciences, Stellenbosch University, South Africa
- Wellcome Centre for Human Genetics, University of Oxford, United Kingdom
- Massachusetts General Hospital, United States
- Dana-Farber Cancer Institute, United States
- Centre for the AIDS Programme of Research in South Africa, South Africa
- Harvard Medical School, United States
- Division of Infection and Immunity, Faculty of Medical Sciences, University College London, United Kingdom
- Department of Paediatrics, University of Oxford, United Kingdom
- Department of Infectious Diseases Imperial College London, United Kingdom
- School of Health and Related Research, University of Sheffield, United Kingdom
- Centre for Genetics and Genomics Versus Arthritis, Centre for Musculoskeletal Research, The University of Manchester, United Kingdom
- Jenner Institute, University of Oxford, United Kingdom
Figures
Figure 1 with 5 supplements
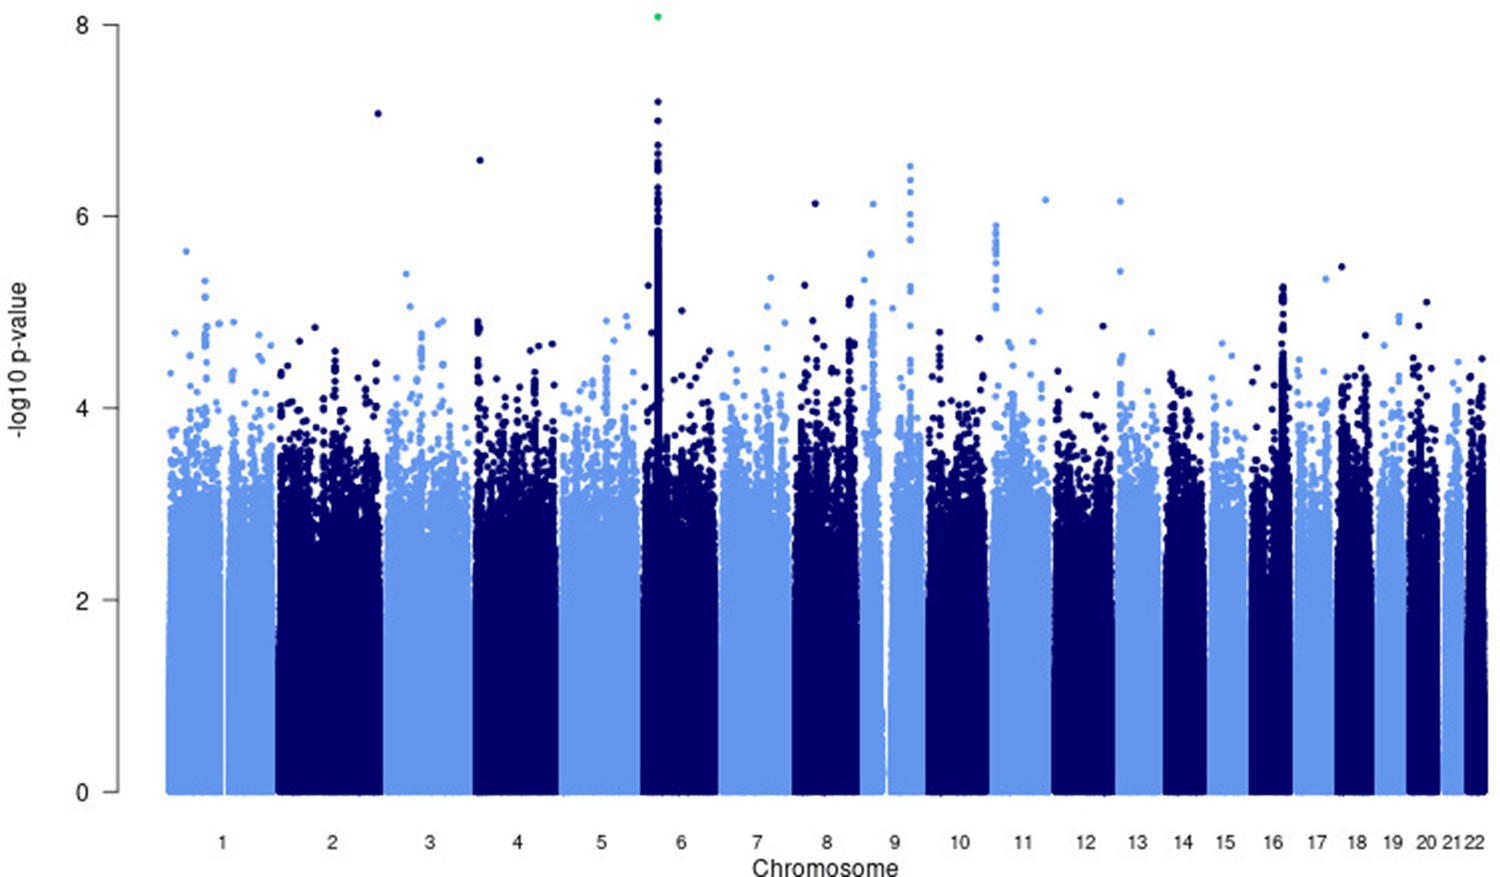
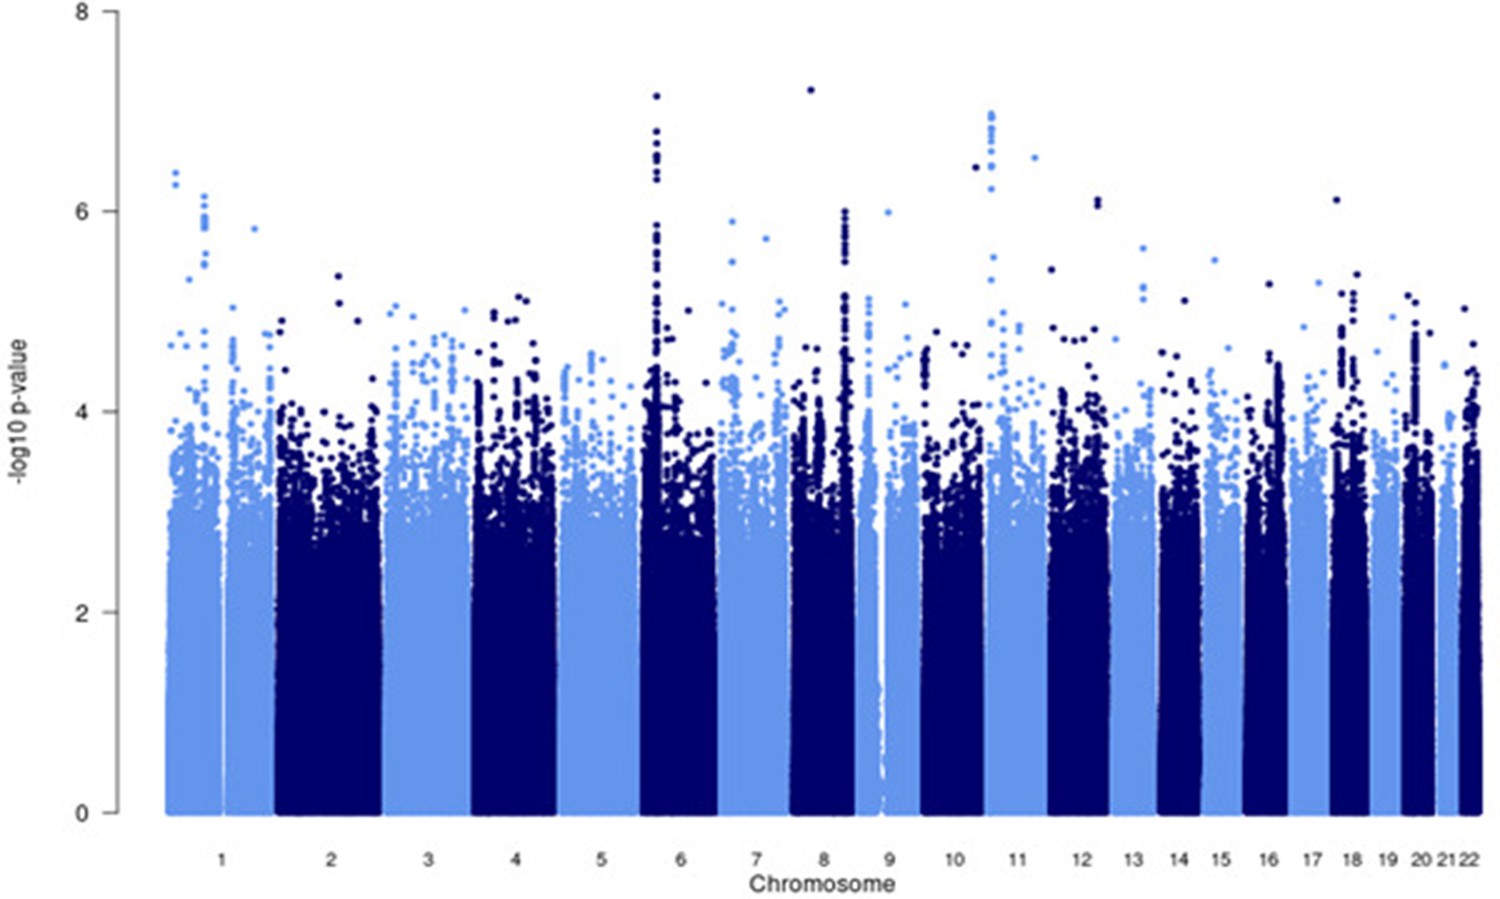
Manhattan plot of p-values (more than three studies) from the MR-MEGA analysis of all 12 datasets with genomic control reveals one significant association in the HLA-ll region of chromosome 6 (rs28383206).
Image produced using R scripts provided by MR-MEGA (Mägi et al., 2017), and source data file has been uploaded to https://doi.org/10.5061/dryad.6wwpzgn2s.
Figure 1—figure supplement 1
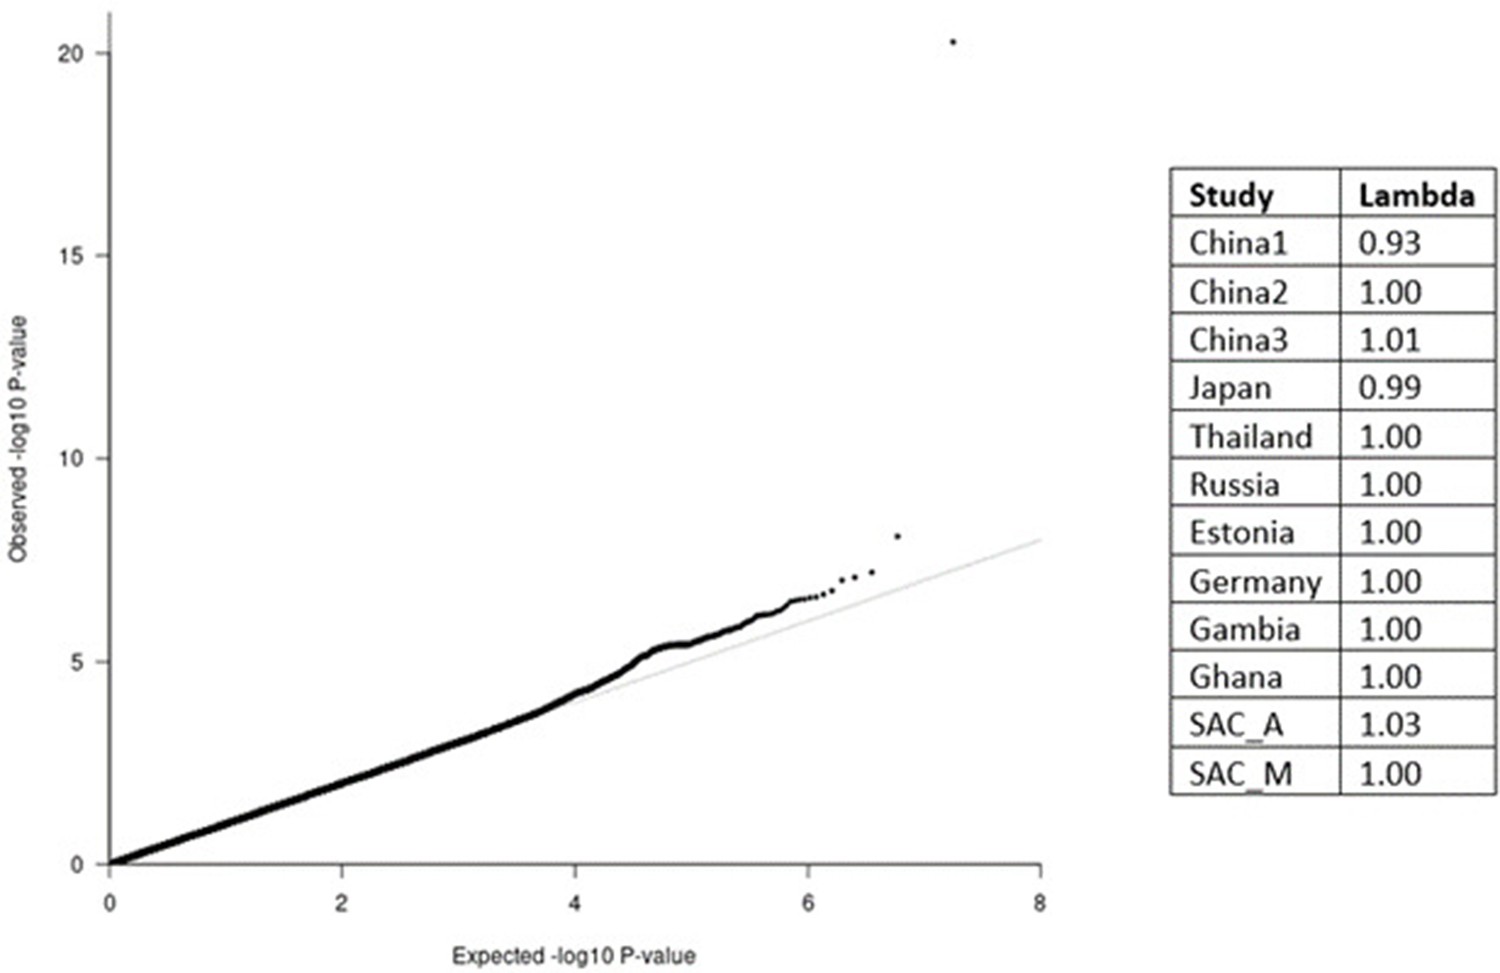
QQ-plot (left) from the MR-MEGA analysis of all 12 datasets with genomic control correction, including two principal components (PCs) as covariates.
The lambda value of 1.00 suggests no significant inflation or deflation of p-values. Lambda values for the input data (right), and source data file has been uploaded to https://doi.org/10.5061/dryad.6wwpzgn2s.
Figure 1—figure supplement 2
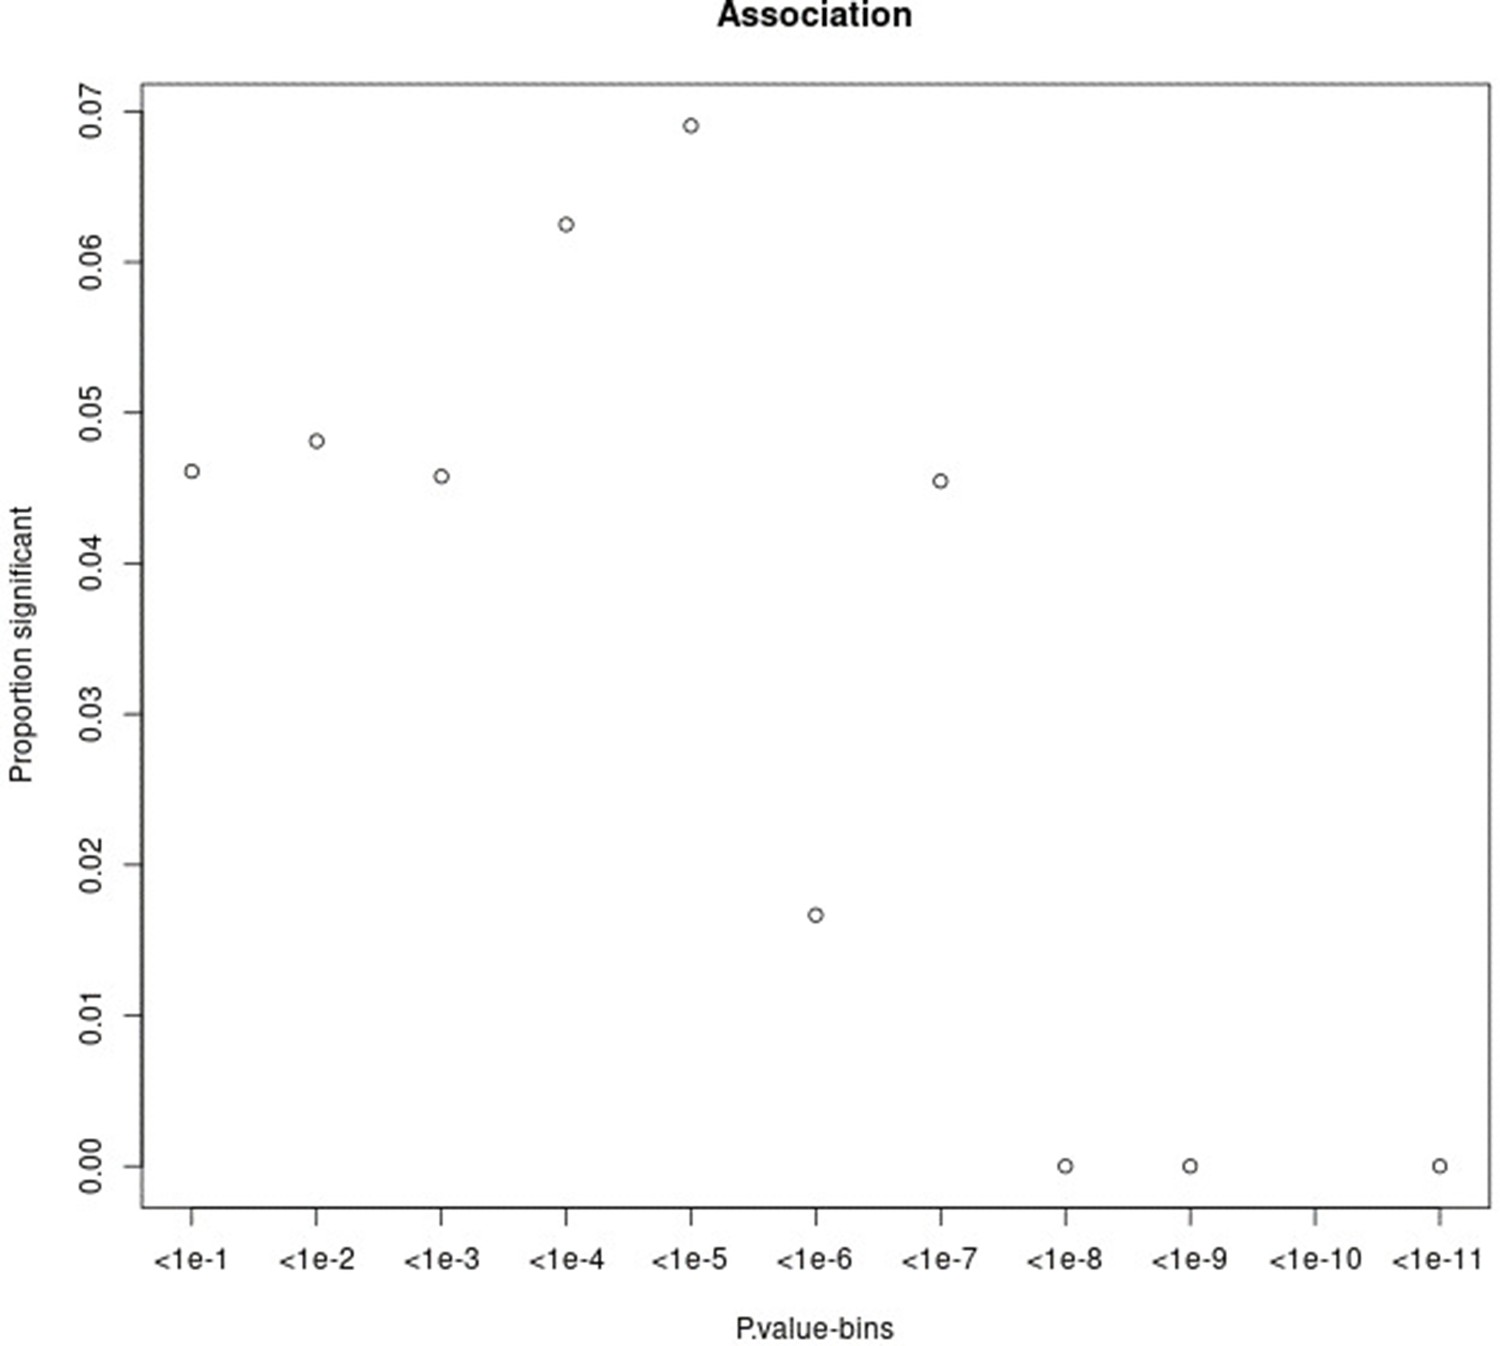
Proportion of variants that had a significant change in association p-value (based on chi-square difference test) following the inclusion of the force of infection p-value for different p-value bins.
For source data, see Figure 1—figure supplement 2—source data 1.
-
Figure 1—figure supplement 2—source data 1
Proportions of variants for each p-value bin that had a significant change in association p-value, based on chi-square test for significant difference.
- https://cdn.elifesciences.org/articles/84394/elife-84394-fig1-figsupp2-data1-v1.xlsx
Figure 1—figure supplement 3
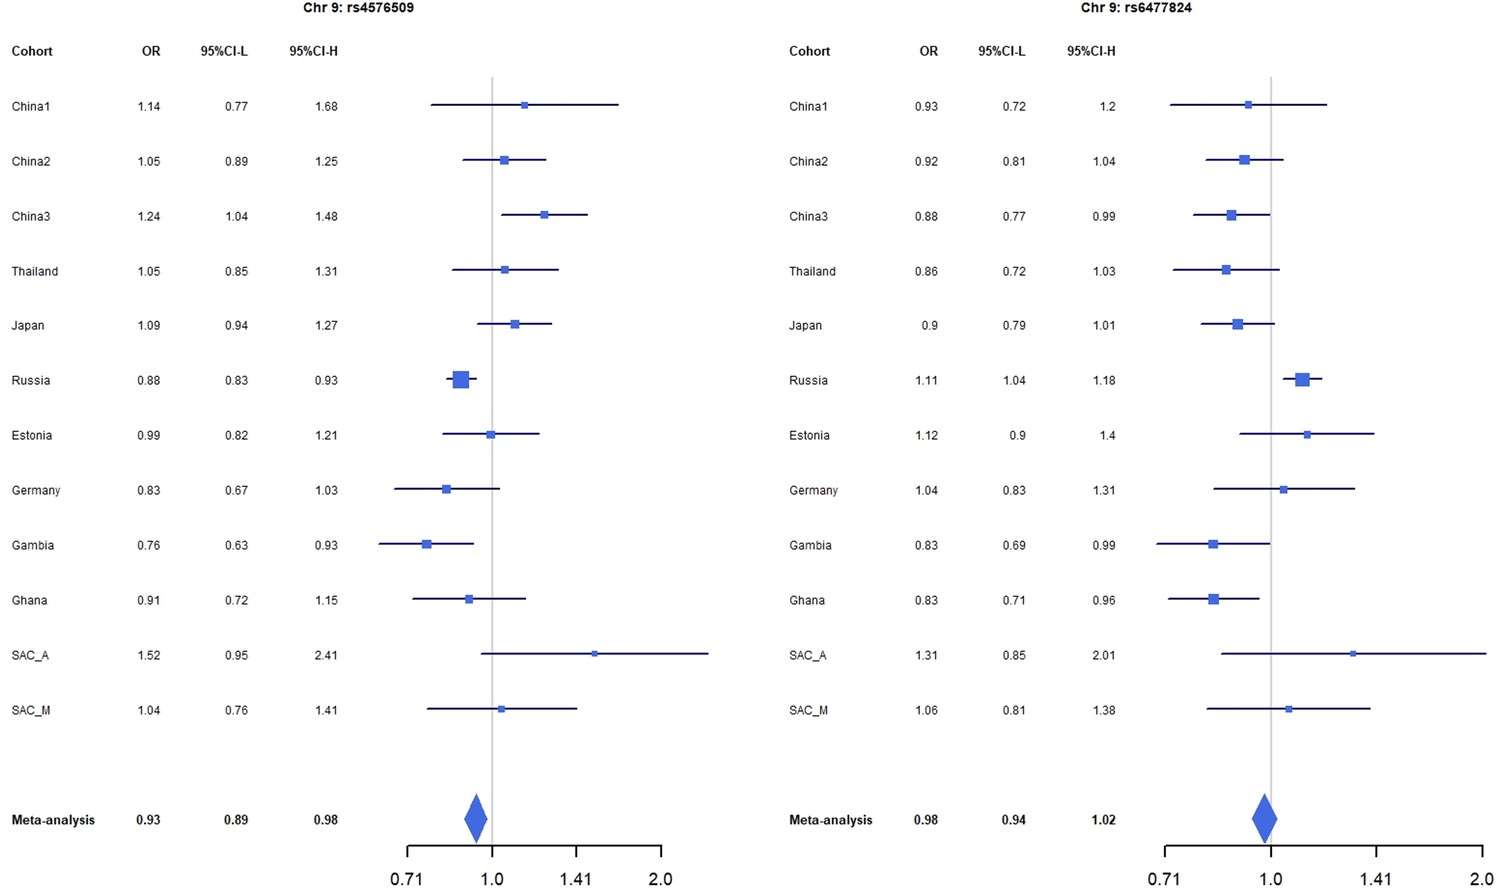
Forest plots for the suggestive chromosome 9 peaks, rs4576509 (left) and rs6477824 (right) for the trans-ethnic MR-MEGA analysis including all 12 cohorts.
For source data, see Figure 1—figure supplement 3—source data 1.
-
Figure 1—figure supplement 3—source data 1
Odds ratios and 95% confidence intervals for each source data file used to plot the forest plot of the two suggestive associations rs4576509 and rs6477824.
- https://cdn.elifesciences.org/articles/84394/elife-84394-fig1-figsupp3-data1-v1.xlsx
Figure 1—figure supplement 4

Forest plots for the suggestive chromosome 11 peak, rs12362545, for the trans-ethnic MR-MEGA analysis including all 12 cohorts.
For source data, see Figure 1—figure supplement 4—source data 1.
-
Figure 1—figure supplement 4—source data 1
Odds ratios and 95% confidence intervals for each source data file used to plot the forest plot of the suggestive association rs12362545.
- https://cdn.elifesciences.org/articles/84394/elife-84394-fig1-figsupp4-data1-v1.xlsx
Figure 1—figure supplement 5

Forest plots for the suggestive chromosome 16 peak, rs35787595, for the trans-ethnic MR-MEGA analysis including all 12 cohorts.
For source data, see Figure 1—figure supplement 5—source data 1.
-
Figure 1—figure supplement 5—source data 1
Odds ratios and 95% confidence intervals for each source data file used to plot the forest plot of the suggestive association rs35787595.
- https://cdn.elifesciences.org/articles/84394/elife-84394-fig1-figsupp5-data1-v1.xlsx
Figure 2
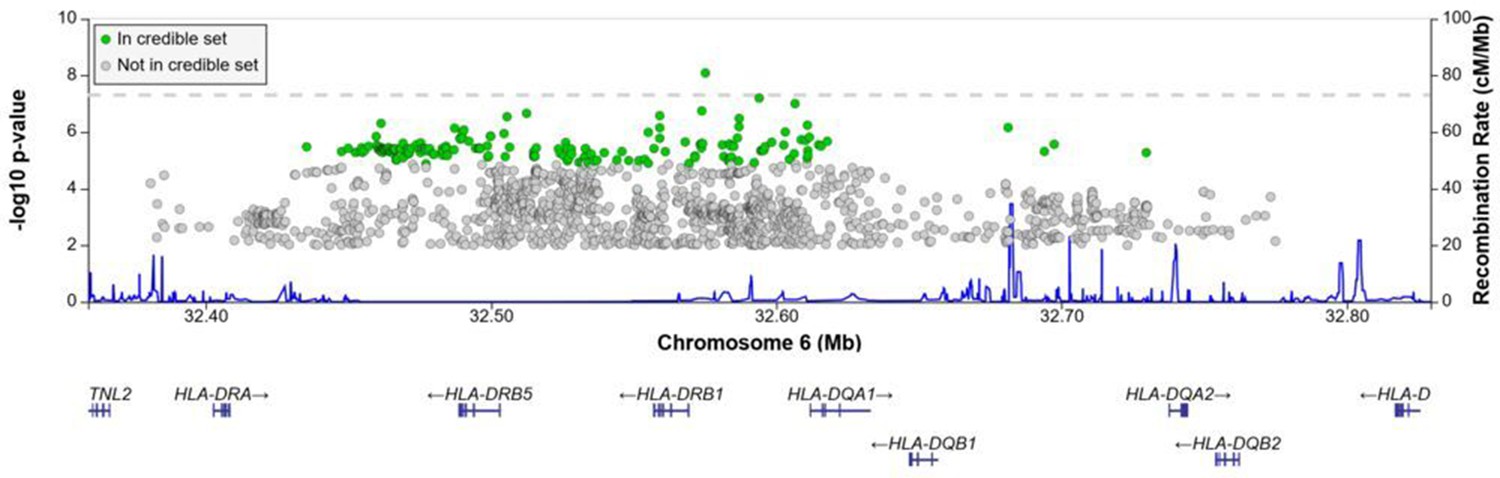
Regional association plot for the chromosome 6 HLA-ll rs28383206 association in the multi-ancestry analysis revealing a significant peak in the HLA-ll region.
Image produced using the online LocusZoom database with linkage disequilibrium (LD) mapping set to ‘all’ and p-values>0.01 removed (Boughton et al., 2021), and source data file has been uploaded to https://doi.org/10.5061/dryad.6wwpzgn2s.
Figure 3 with 1 supplement
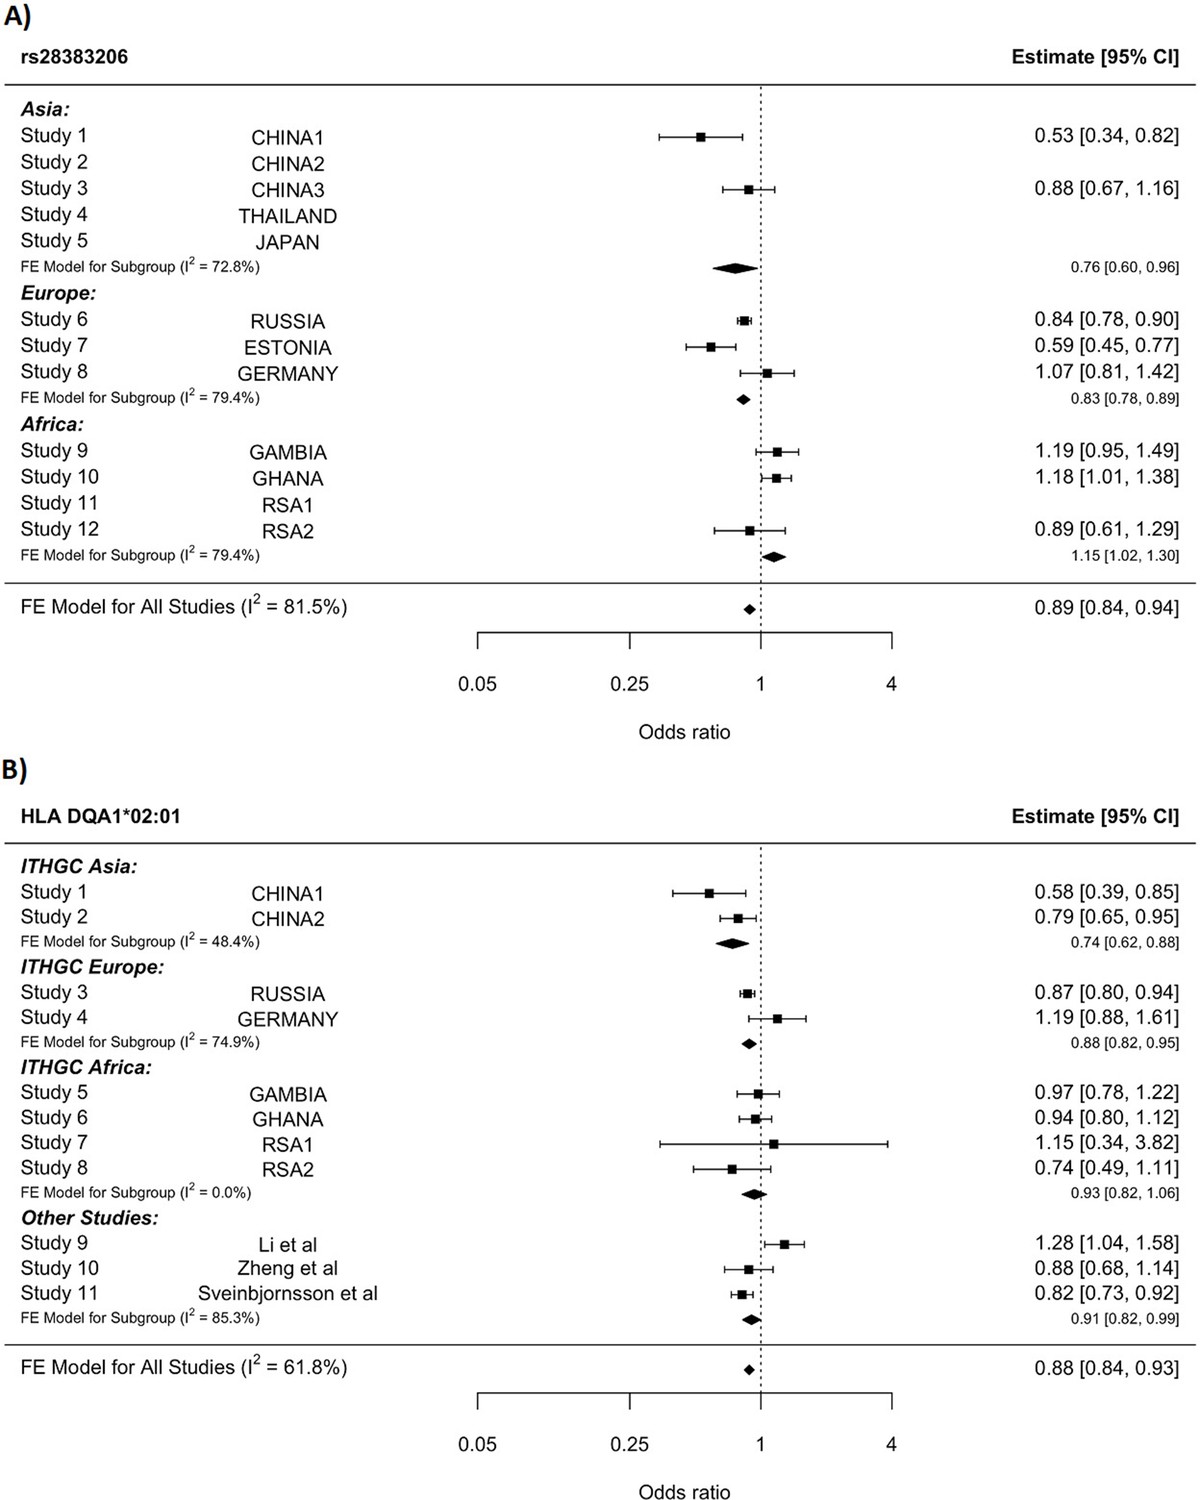
HLA conditioning analysis.
(A) Forest plot (odds ratio and 95% confidence interval) of the significant chromosome 6 association (rs28383206) for tuberculosis (TB) susceptibility in the multi-ancestry analysis, implemented using MR-MEGA with genomic control correction (GCC). Of the 12 studies included, 8 contained this variant. Studies that did not contain the variant are included in the plot but do not have results associated with them. (B) Forest plot for HLA DQA1*02:01 for the eight studies included in the HLA association analysis. Other studies included were obtained from literature searches of previous studies where HLA imputation and association studies were performed (Sveinbjornsson et al., 2016; Li et al., 2021; Zheng et al., 2018). For source data, see Figure 3—source data 1.
-
Figure 3—source data 1
HLA conditioning analysis data.
- https://cdn.elifesciences.org/articles/84394/elife-84394-fig3-data1-v1.xlsx
Figure 3—figure supplement 1
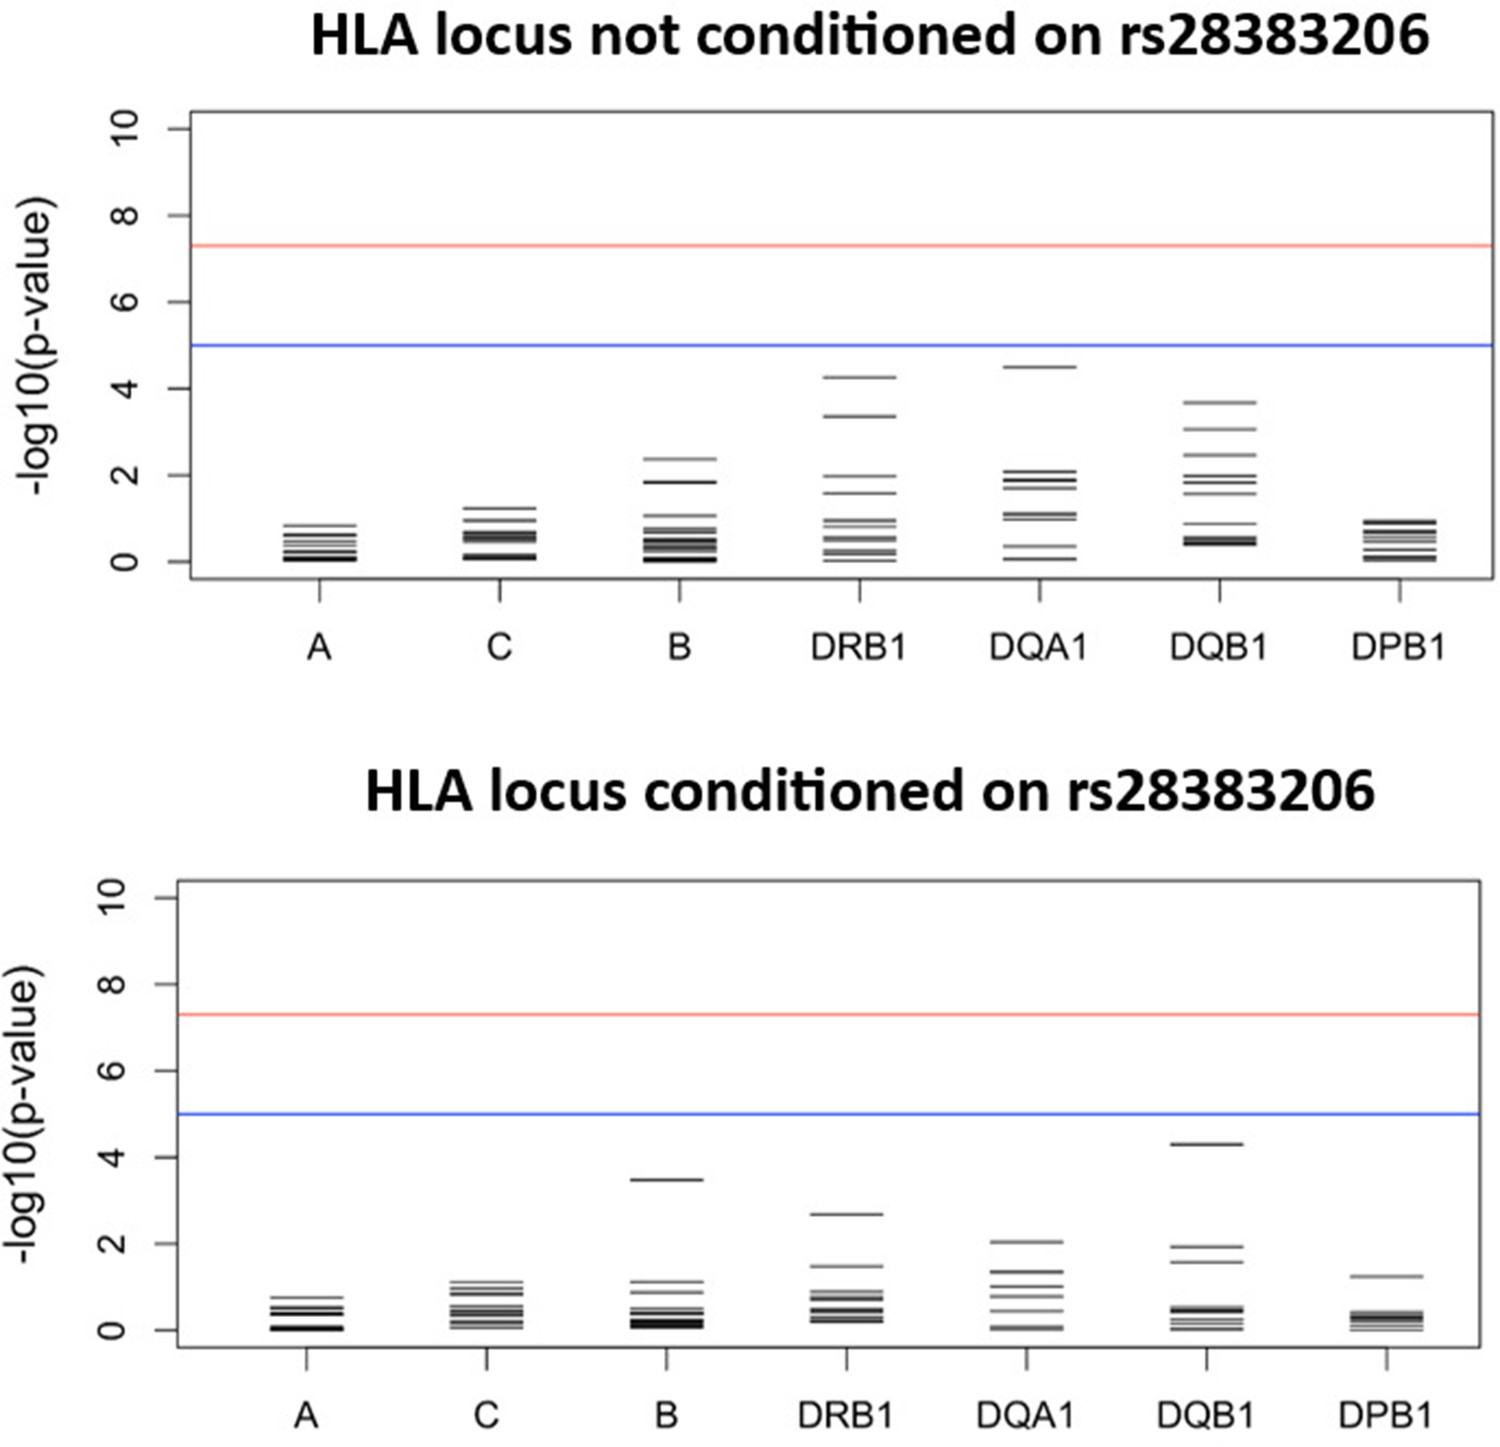
Results for the HLA class I and II meta-analysis of all studies overall (unconditioned) (top) and conditioned on the lead SNP for the six studies in which the lead SNP was present at minor allele frequency (MAF) > 2.5% (bottom).
For source data, see Figure 3—figure supplement 1—source data 1.
-
Figure 3—figure supplement 1—source data 1
Association statistics used to plot the p-value distribution for the fixed-effects meta-analysis for each HLA locus for both the conditioned and unconditioned analyses.
- https://cdn.elifesciences.org/articles/84394/elife-84394-fig3-figsupp1-data1-v1.xlsx
Figure 4 with 4 supplements
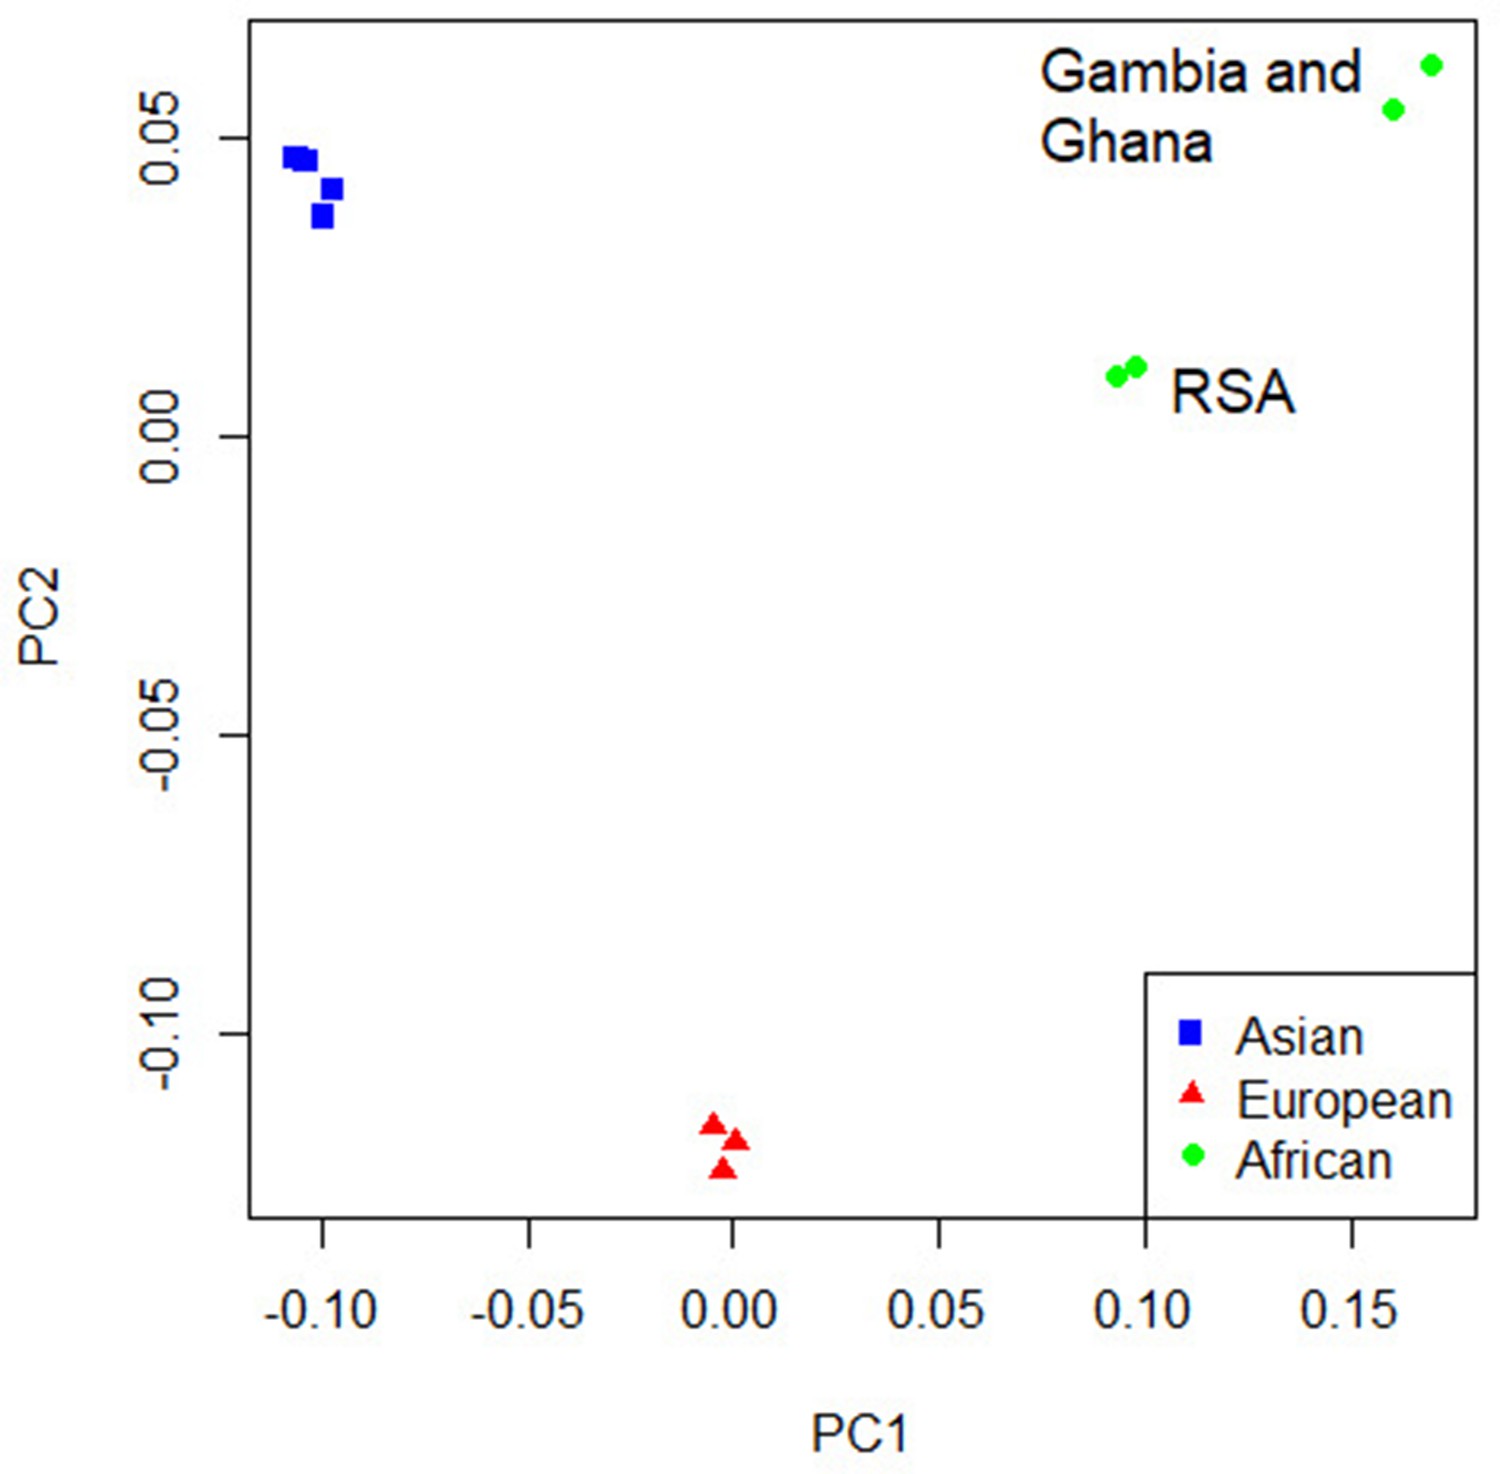
Principal component analysis (PCA) plot of all 12 studies based on the MR-MEGA mean pairwise genome-wide allele frequency differences.
Image produced using the R plot function. For source data, see Figure 4—source data 1.
-
Figure 4—source data 1
PCA source data.
- https://cdn.elifesciences.org/articles/84394/elife-84394-fig4-data1-v1.xlsx
Figure 4—figure supplement 1
Manhattan plot of all p-values (≥2 studies) for the European subgroup analysis.
Fixed effects (FE) model with genomic control correction (GCC) implemented in GWAMA, and source data file has been uploaded to https://doi.org/10.5061/dryad6wwpzgn2s.
Figure 4—figure supplement 2
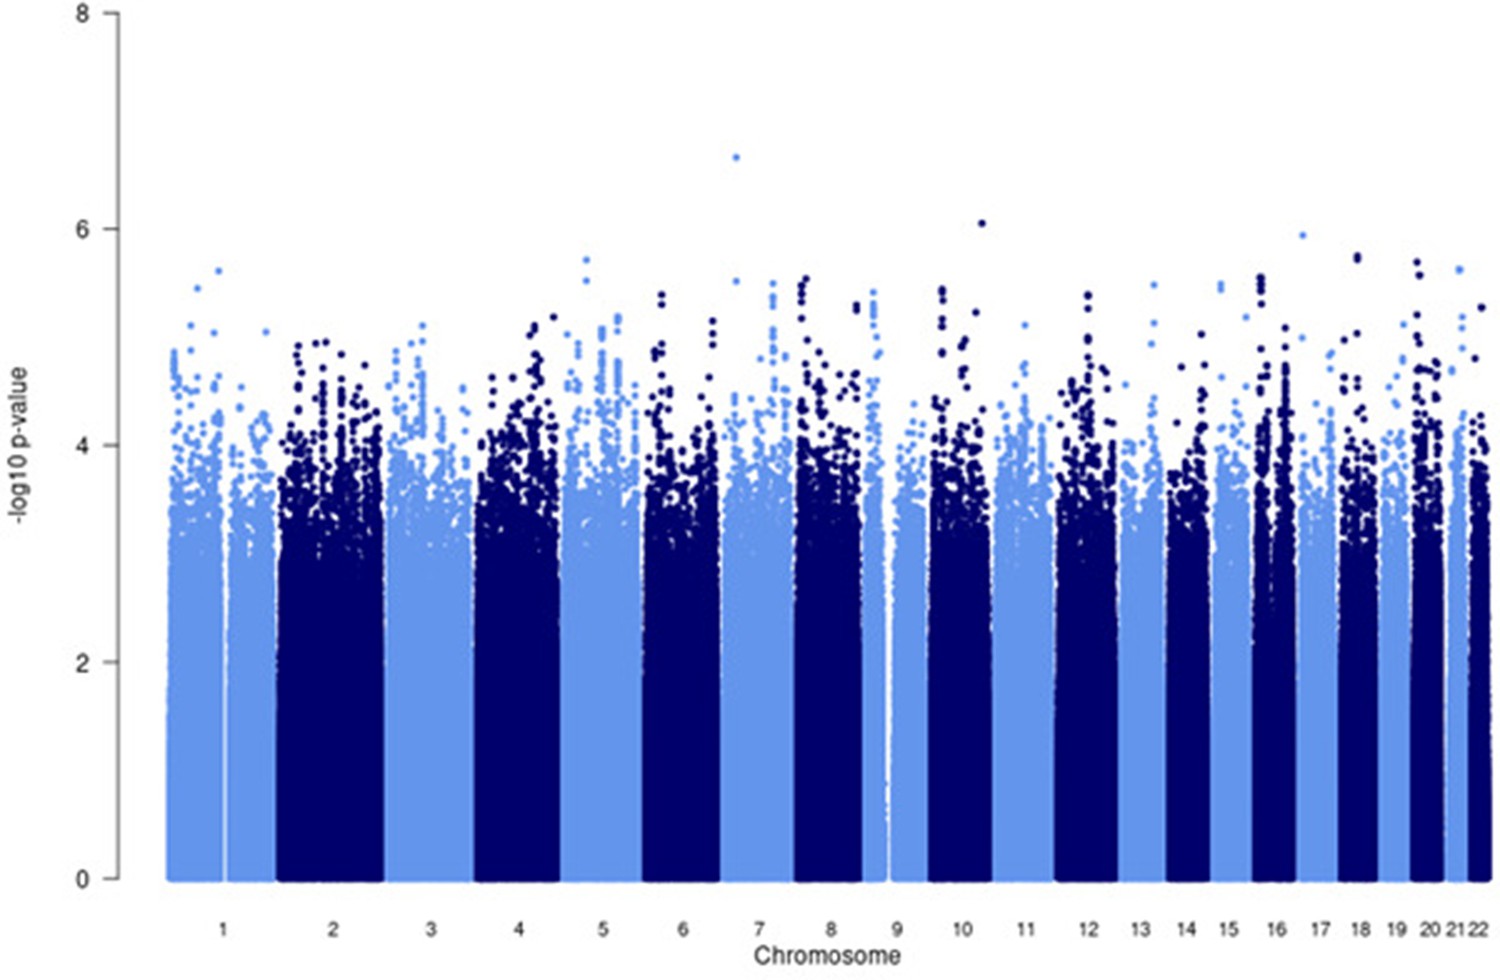
Manhattan plot of all p-values (≥2 studies) for the Asian subgroup analysis.
Fixed effects (FE) model with genomic control correction (GCC) implemented in GWAMA, and source data file has been uploaded to https://doi.org/10.5061/dryad.6wwpzgn2s.
Figure 4—figure supplement 3
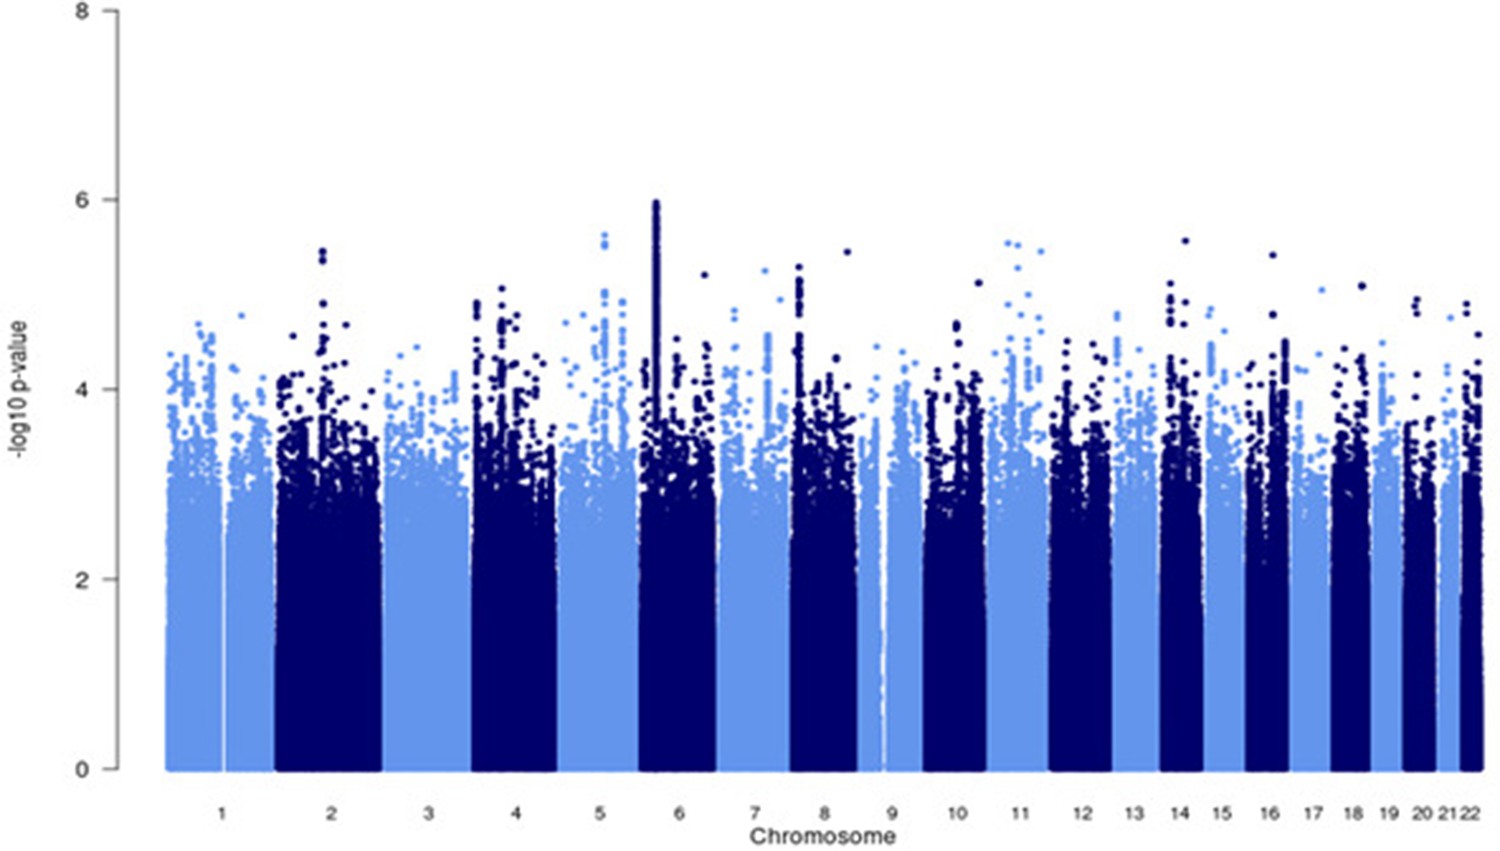
Manhattan plot of all p-values (≥2 studies) for the African subgroup analysis.
Fixed effects (FE) model with genomic control correction (GCC) implemented in GWAMA, and source data file has been uploaded https://doi.org/10.5061/dryad.6wwpzgn2s.
Figure 4—figure supplement 4
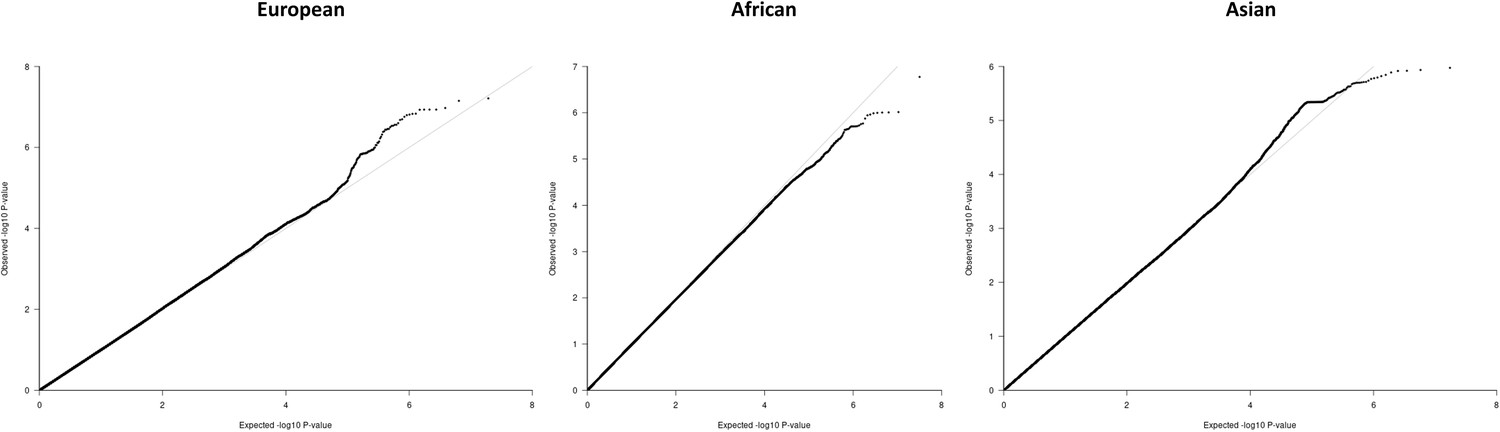
QQ-plots for the region-specific fixed effects (FE) meta-analysis using genomic control correction (GCC) and implemented in GWAMA.
Source data file has been uploaded to https://doi.org/10.5061/dryad.6wwpzgn2s.
Tables
Table 1
Summary of ITHGC TB-GWAS datasets.
| Dataset | Population | Cases/ controls | TB prevalence per 100 ,000 pa | Estimated proportion of controls ever exposed to Mtb (±SD)* | #SNPs | Genotyping platform | Reference |
|---|---|---|---|---|---|---|---|
| China 1† | Asian | 483/587 | 89 | 0.302 (0.101) | 7,710,153 | Affymetrix Genome-Wide Human SNP Array 6.0 | thye@bni-hamburg.de (unpublished) |
| China 2† | Asian | 1290/1145 | 89 | 0.302 (0.101) | 9,769, 029 | Illumina Human OmniZhonghua-8 chips | magdakellis@gmail.com (unpublished) |
| China 3 | Asian | 972/1537 | 89 | 0.302 (0.101) | 9,726,450 | Illumina Human OmniZhonghua-8 chips | Qi et al., 2017 |
| Thailand | Asian | 433/295 | 236 | 0.404 (0.112) | 6,723,358 | Illumina Human610-Quad | Mahasirimongkol et al., 2012 |
| Japan | Asian | 751/3199 | 23 | 0.142 (0.125) | 9,051,051 | Illumina HumanHap550 | Mahasirimongkol et al., 2012 |
| Russia† | European | 5914/6022 | 109 | 0.191 (0.093) | 10,878,777 | Affymetrix Genome-Wide Human SNP Array 6.0 | Curtis et al., 2015 |
| Estonia | European | 239/7047 | 13 | 0.116 (0.093) | 10,611,556 | Illumina 370K | andres.metspalu@ut.ee (unpublished) |
| Germany† | European | 586/333 | 7.8 | 0.067 (0.081) | 10,602,193 | Illumina Omni2.5+exome | thye@bni-hamburg.de (unpublished) |
| Gambia† | African | 1316/1382 | 126 | 0.280 (0.089) | 18,634,017 | Affymetrix GeneChip 500K | The Wellcome Trust Case Control Consortium, 2007 |
| Ghana† | African | 1359/1952 | 282 | 0.539 (0.198) | 19,029,214 | Affymetrix Genome-Wide Human SNP Array 6.0 | Thye et al., 2010 |
| RSA(A)† ‡ | African | 19/577 | 717 | 0.436 (0.127) | 9,227,330 | Affymetrix 500k | Daya et al., 2014b |
| RSA(M)†‡ | African | 410/405 | 717 | 0.436 (0.127) | 11,371,838 | Illumina MEGA array | Schurz et al., 2018 |
-
GWAS, genome-wide association studies; ITHGC, International Tuberculosis Host Genetics Consortium; Mtb, Mycobacterium tuberculosis; TB, tuberculosis.
-
*
Estimated proportion of control individuals ever infected with Mtb by age 35–44 in 2010, based on data from Houben & Dodd.
-
†
Raw genotyping data available.
-
‡
RSA(A/M): South African admixed population (RSA) Affymetrix (A) and MEGA (M) array data.
Table 2
Significant and suggestive associations (p-value ≤1e–5) for the multi-ancestry analysis including data from all 12 datasets implementing MR-MEGA analysis with GCC.
| Marker name | Chromosome | Position | Gene | Location | CADD score | EA | NEA | EAF | Sample size | Datasets | p-Value |
|---|---|---|---|---|---|---|---|---|---|---|---|
| rs28383206 | 6 | 32575167 | HLA-DRB1 | Intergenic | 7.6 | G | A | 0.168 | 25,059 | 8 | 8.26e–09 |
-
GCC, genomic control correction; EA, effect allele; EAF, effect allele frequency; NEA, noneffect allele.
Additional files
-
Supplementary file 1
Extended and supplementary tables.
(a) Summary of ITHGC TB-GWAS datasets. (b) Polygenic heritability estimates at different TB prevalence rates. (c) Suggestive associations (p-value≤1e–5) for the multi-ancestry analysis including data from all 12 datasets implementing MR-MEGA analysis with GCC. (d) Results for the concordance in direction of effect analysis for all p-value thresholds and reference populations (for SNNP selection). (e) Suggestive associations for the European and Asian ancestry-specific FE analysis (with GCC).
- https://cdn.elifesciences.org/articles/84394/elife-84394-supp1-v1.docx
-
MDAR checklist
- https://cdn.elifesciences.org/articles/84394/elife-84394-mdarchecklist1-v1.pdf
-
Source data 1
Collection of data and results that are not used for figures or discussed in depth in the article but may still be valuable for other researchers working on similar topics.
- https://cdn.elifesciences.org/articles/84394/elife-84394-data1-v1.xlsx
Download links
A two-part list of links to download the article, or parts of the article, in various formats.
Downloads (link to download the article as PDF)
Open citations (links to open the citations from this article in various online reference manager services)
Cite this article (links to download the citations from this article in formats compatible with various reference manager tools)
Multi-ancestry meta-analysis of host genetic susceptibility to tuberculosis identifies shared genetic architecture
eLife 13:e84394.
https://doi.org/10.7554/eLife.84394


