Insights into cargo sorting by SNX32 and its role in neurite outgrowth
- Indian Institute of Science Education and Research, Bhopal, India
- SickKids Research Institute, Hospital for Sick Children, Canada
- Molecular Biophysics Unit, Indian Institute of Science Bangalore, India
- Department of Biochemistry, Stanford University, United States
- Indian Institute of Science Education and Research Pune, India
- Amala Cancer Research Centre, India
Figures
Figure 1 with 1 supplement
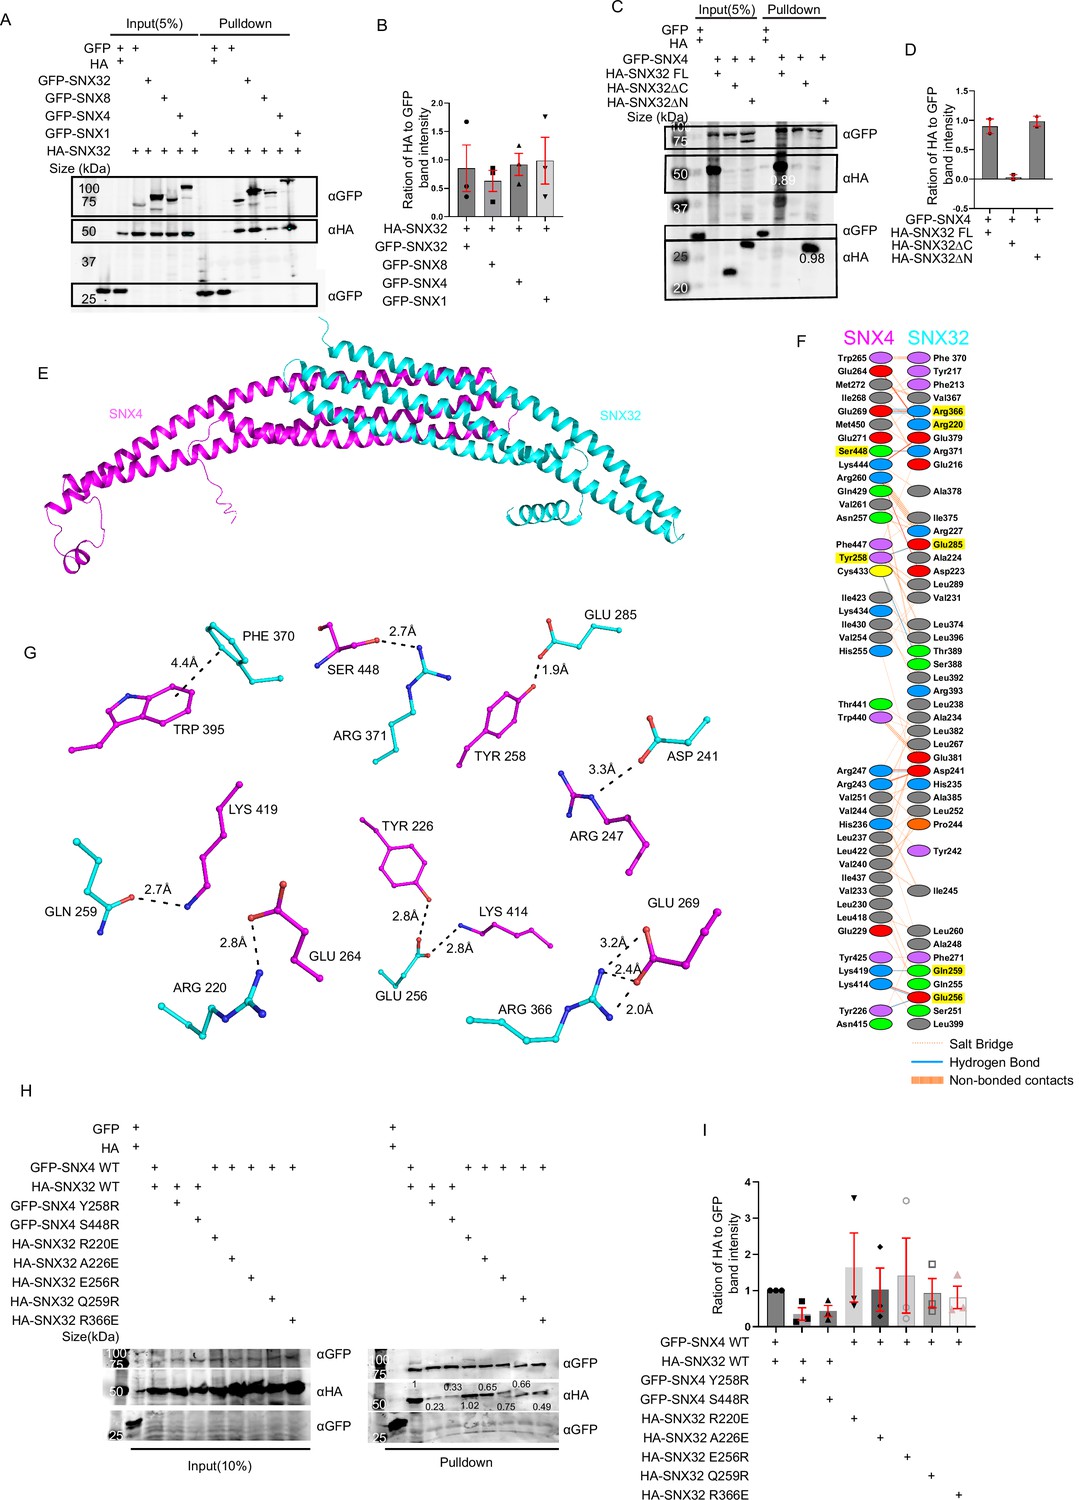
SNX32 undergoes BAR domain-mediated association with SNX4.
(A) GBP co-immunoprecipitation of GFP/HA-tagged SNX-proteins transiently transfected in HEK293T cells showing GFP-SNX/GFP-SNX4/GFP-SNX8 or GFP-SNX32 efficiently precipitating HASNX32 (representative immunoblot out of three biological replicates, values represent the ratio of HA to GFP band intensity). (B) Plot representing quantifications of the three independent experiments of GBP co-immunoprecipitation of GFP/HA-tagged SNX-proteins represented in (A). (C) Co-immunoprecipitation of GFP/HA-tagged SNX-proteins transiently transfected in HEK293T cells showing GFP-SNX4 precipitating HA-SNX32ΔN (representative immunoblot out of three biological replicates, values represent the ratio of HA to GFP band intensity). (D) Plot representing quantifications of the three independent experiments of GBP co-immunoprecipitation of GFP/HA-tagged SNX-proteins represented in (C). (E) Homology model of BAR domains of SNX32-SNX4 complex. (F) Schematic depiction of the amino acid residues lining the heterodimeric interface of SNX32 (cyan)-SNX4 (magenta). (G) Polar interactions present at the dimeric interface of SNX32 (cyan)-SNX4 (magenta). (H) GBP co-immunoprecipitation of GFP/HA-tagged SNX-proteins transiently transfected in HeLa cells showing a difference in the amount of GFP-SNX4 precipitated HA-SNX32 mutants (representative immunoblot out of three biological replicates, values represent the ratio of HA to GFP band intensity). (I) Plot representing quantifications of the three independent experiments of GBP co-immunoprecipitation of GFP/HA-tagged SNX-proteins represented in (H).
-
Figure 1—source data 1
GBP-IP of GFP/HA-tagged SNX-proteins transiently transfected in HEK293T cells showing GFP-SNX1/GFP-SNX4/GFP-SNX8 or GFP-SNX32 efficiently precipitating HA-SNX32.
Immunoblot source data of three biological replicates (values represent the ratio of HA to GFP band intensity).
- https://cdn.elifesciences.org/articles/84396/elife-84396-fig1-data1-v2.zip
-
Figure 1—source data 2
Co-immunoprecipitation of GFP/HA-tagged SNX-proteins transiently transfected in HEK293T cells showing GFP-SNX4 precipitating HA-SNX32ΔN.
Immunoblot source data of two biological replicates (values represent the ratio of HA to GFP band intensity).
- https://cdn.elifesciences.org/articles/84396/elife-84396-fig1-data2-v2.zip
-
Figure 1—source data 3
GBP co-immunoprecipitation of GFP/HA-tagged SNX-proteins transiently transfected in HeLa cells showing difference in the amount of GFP-SNX4 precipitated HA-SNX32 mutants.
Immunoblot source data of three biological replicates (values represent the ratio of HA to GFP band intensity).
- https://cdn.elifesciences.org/articles/84396/elife-84396-fig1-data3-v2.zip
Figure 1—figure supplement 1
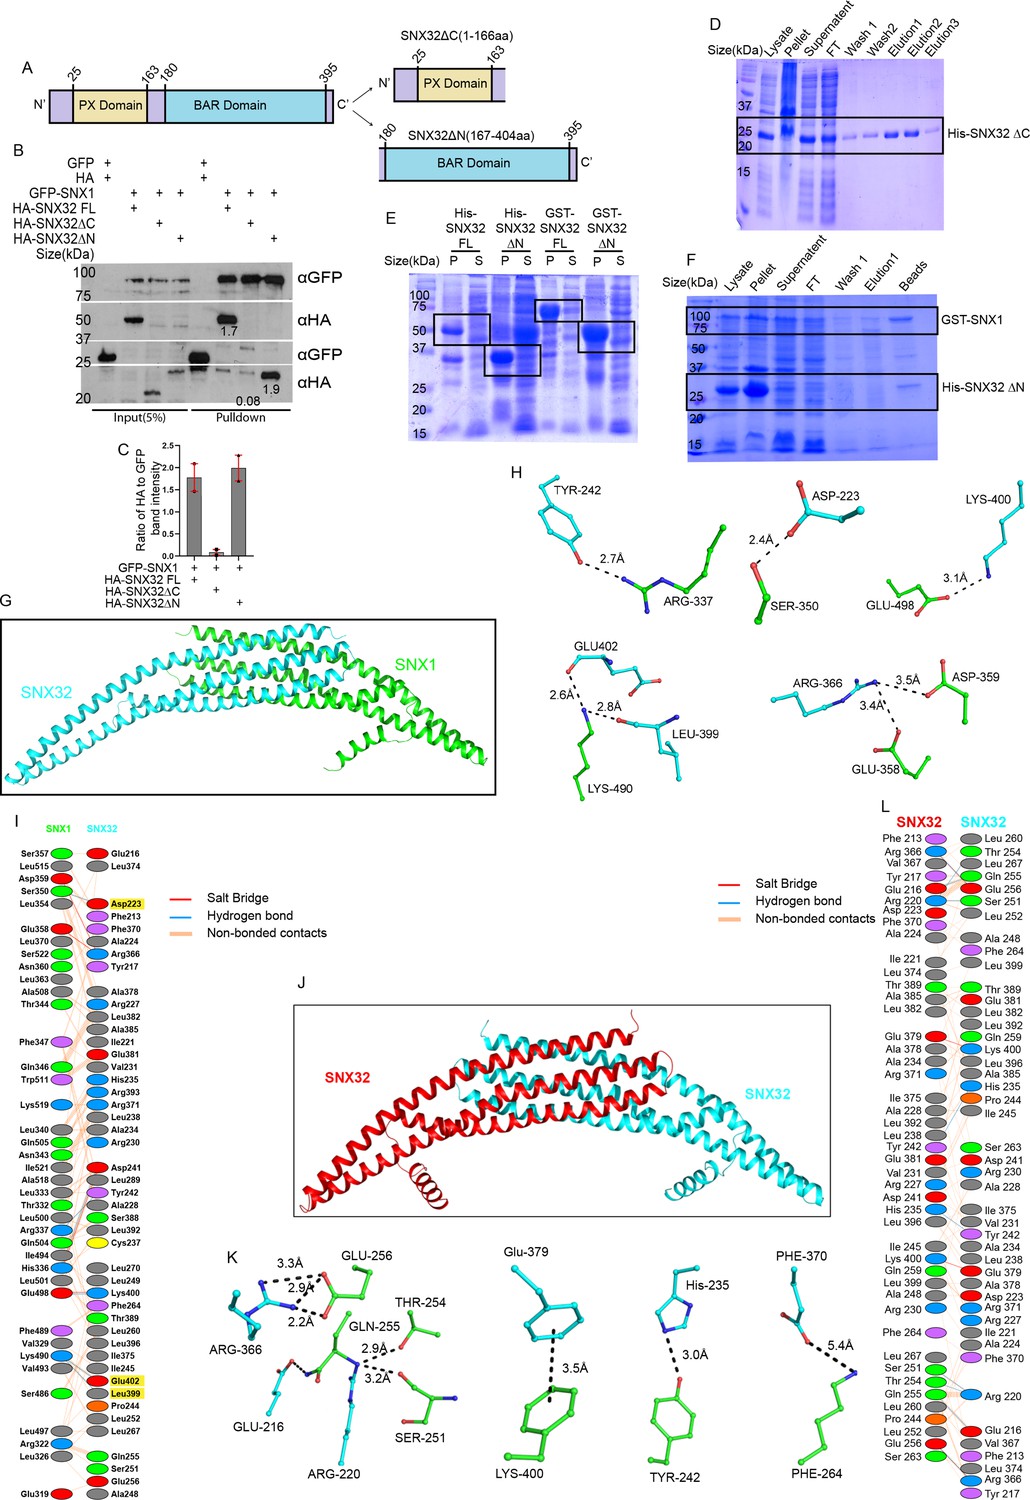
SNX32 undergoes BAR domain-mediated association with SNX1.
(A) The domain architecture indicating the N- and C-terminal endpoints of SNX32FL, SNX32ΔC, and SNX32ΔN. (B) Co-immunoprecipitation of GFP/HA-tagged SNX-proteins transiently transfected in HEK293T cells showing the co-precipitation of GFP-SNX1 and HA-SNX32ΔN. GBP immunoprecipitation was carried out as described in the ‘Materials and methods’ section and immunoblotted using GFP and HA antibody. (C) Plot representing quantifications of the three independent experiments of GBP co-immunoprecipitation of GFP/HA-tagged SNX-proteins represented in (B). (D) Coomassie blue-stained SDS-PAGE gel of affinity purification profile of His SNX32ΔC, samples representing each step of purification. FT: flow-through. (E) Coomassie blue-stained SDS-PAGE gel of His-SNX32 FL, His-SNX32ΔC, GSTSNX32FL, GST-SNX32 ΔC after induction. P: pellet and S: supernatant fractions. (F) Coomassie blue-stained SDS-PAGE gel of affinity co-purification profile of GST-SNX1/His-SNX32ΔN, samples representing each step of purification. FT: flow-through. (G) Homology model of SNX32 BAR domain (cyan) in complex with SNX1 BAR domain (green). (H) Interacting amino acid residues present in the dimeric interface of SNX32 (cyan)-SNX1 (green). (I) Snapshots of polar interactions across the dimeric interface. (J) Homology model of SNX32 BAR homodimer. (K) Interacting amino acid residues present in the dimeric interface of SNX32 (cyan)-SN32 (red). (L) Snapshots of polar interactions across the dimeric interface.
-
Figure 1—figure supplement 1—source data 1
Co-immunoprecipitation of GFP/HA-tagged SNX-proteins transiently transfected in HEK293T cells showing the co-precipitation of GFP-SNX1 and HA-SNX32ΔN.
GBP immunoprecipitation was carried out as described in the ‘Materials and methods’ section and immunoblotted using GFP and HA antibody. Immunoblot source data of two biological replicates.
- https://cdn.elifesciences.org/articles/84396/elife-84396-fig1-figsupp1-data1-v2.zip
Figure 2 with 2 supplements
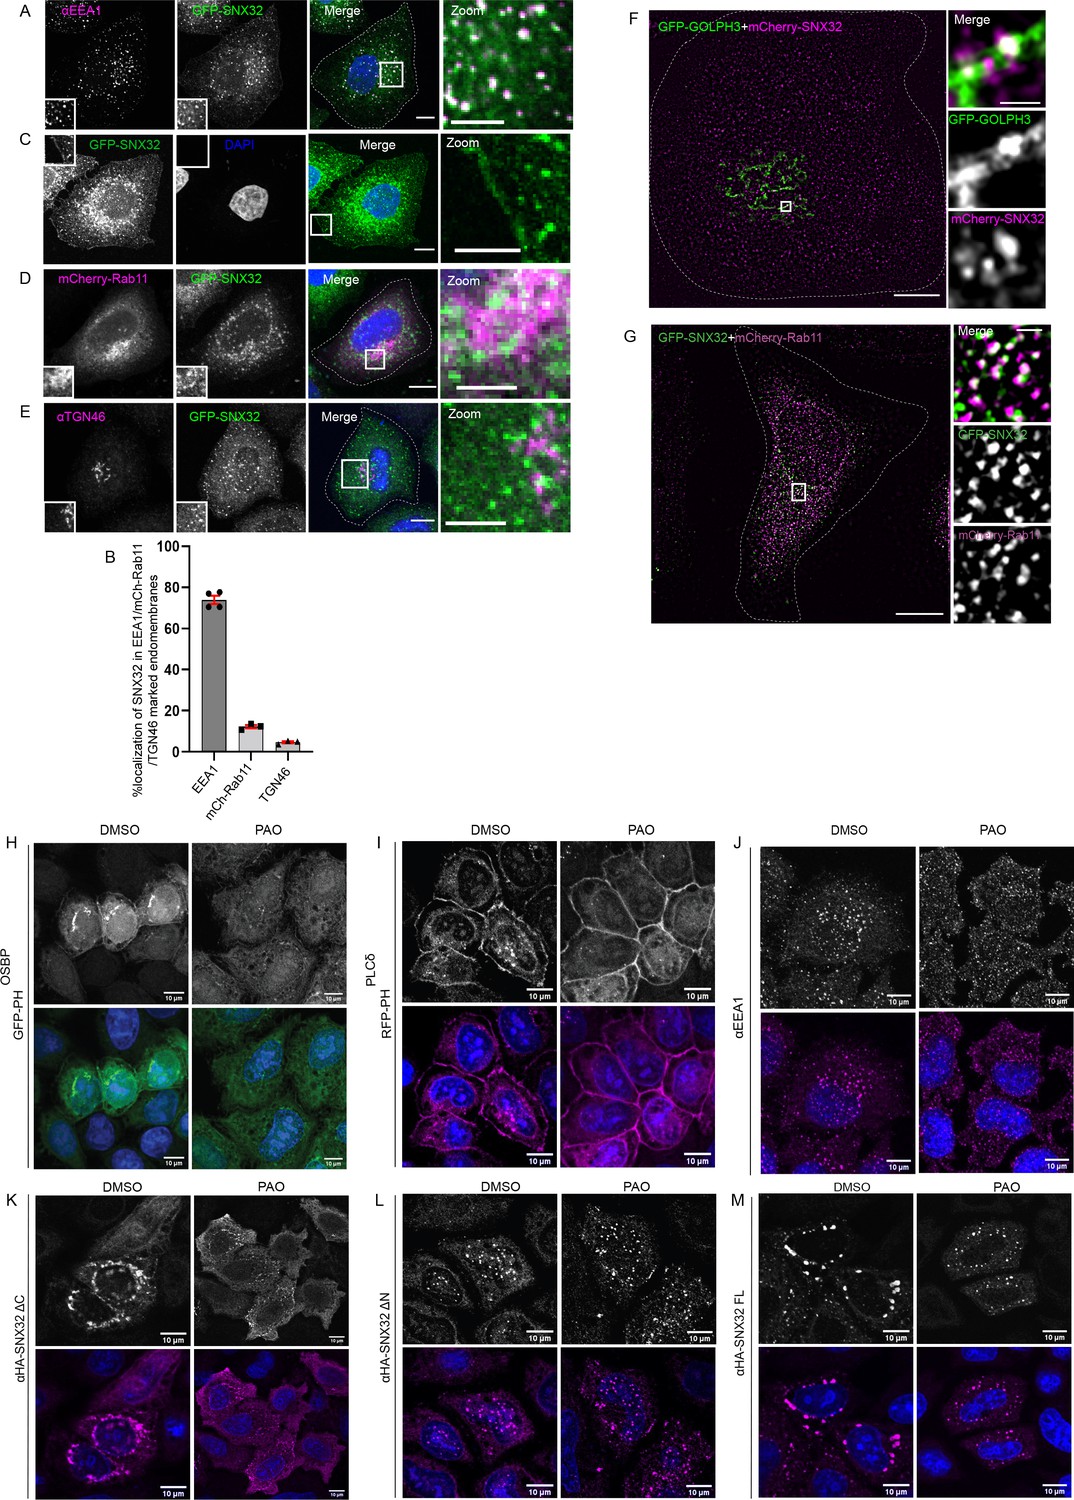
SNX32 undergoes PX domain-assisted localization to PI(4)P-enriched endosomal membranes in addition to early endosomes.
(A) GFP-SNX32 localization with early endosomal marker EEA1. (B) Quantifications showing percentage colocalization of GFP-SNX32 in HeLa cells, data represent mean ± SEM (N = 3, n ≥ 60 cells per independent experiments). (C) GFP-SNX32 localization at cell periphery (D) GFP-SNX32 colocalization with perinuclear recycling endosomal marker mCherry-Rab11, (E) Colocalization of GFP-SNX32 with Trans Golgi Network marker TGN46. Scale bar 10 μm, inset 5 μm (magnified regions are shown as insets, inset of the merge is magnified and represented as zoom). (F, G) SIM image showing colocalization of (F) GFP-GOLPH3 and mCherry-SNX32. (G) GFP-SNX32 and mCherry-Rab11. Scale bar 10 μm, inset 1 μm (magnified regions are shown as insets). (H–M) PAO/DMSO treatment in HeLa cells overexpressing (H) GFPPHOSBP, (I) RFP-PHPLCδ, (J) endogenous EEA1, (K) HA-SNX32ΔC, (L) HA-SNX32ΔN, and (M) HA-SNX32FL. Scale bar 10 μm.
Figure 2—figure supplement 1
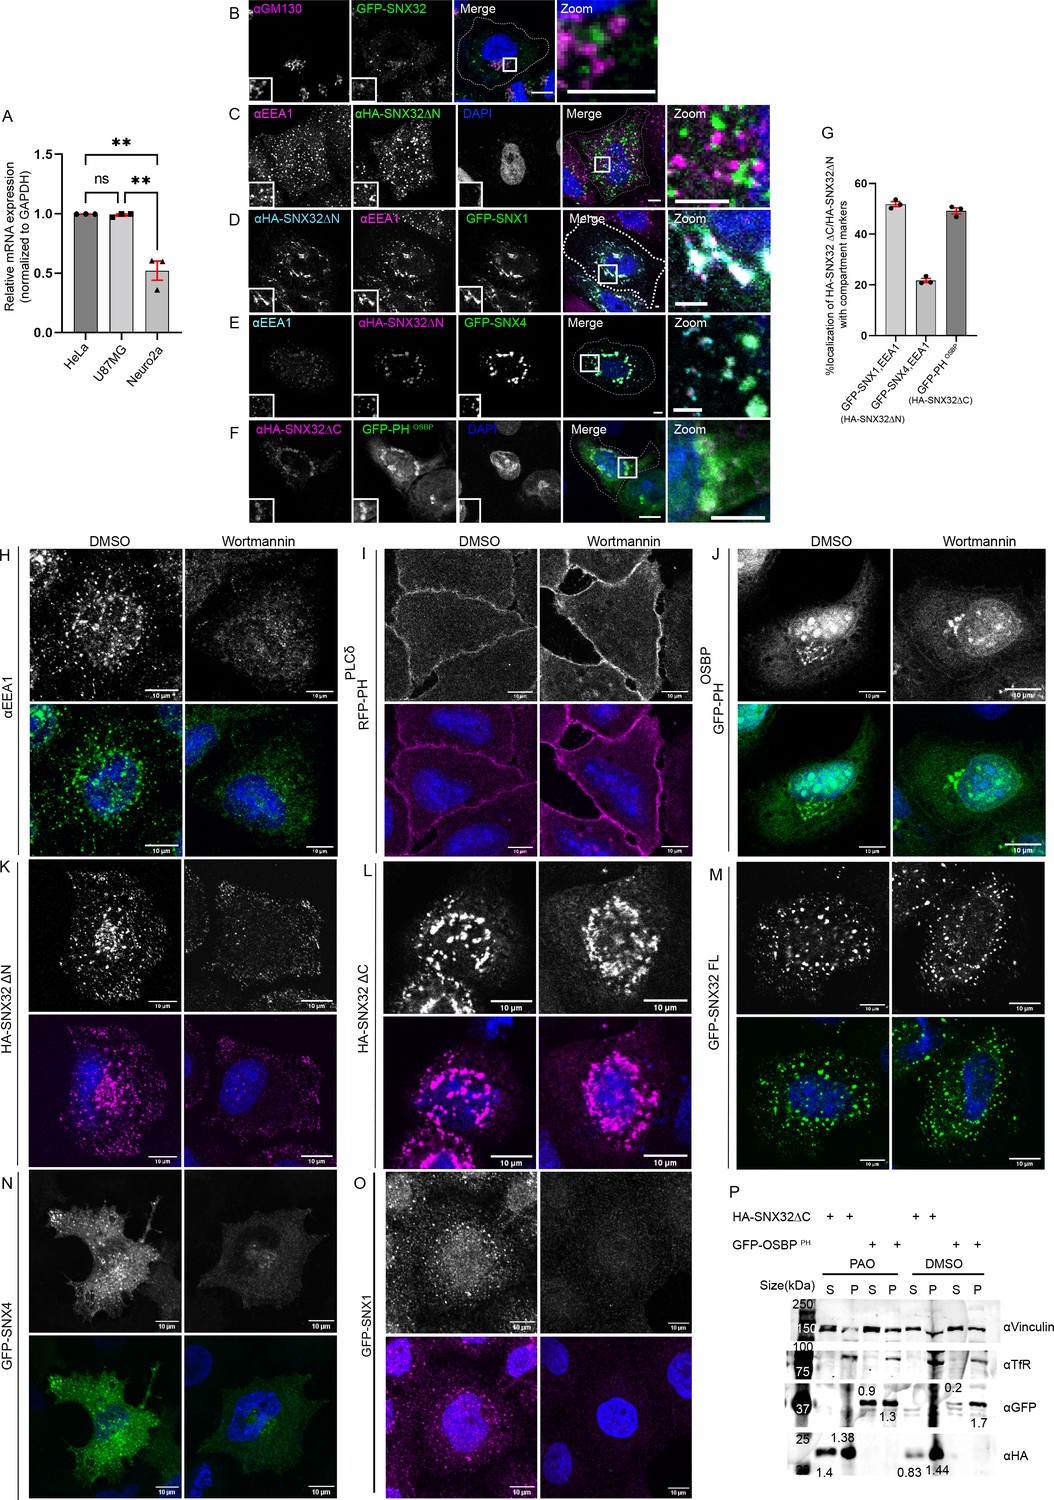
BAR domain of SNX32 undergoes protein–protein interactions and assist in the early endosomal localization of SNX32.
(A) Relative amount of SNX32 transcripts analyzed by quantitative PCR in different cell lines such as HeLa, U87MG, and Neuro2a normalized with respect to Gapdh. N = 3, values are means ± SEM, p-value 0.0006 (**p<0.01, ns, nonsignificant), ordinary one-way ANOVA Šídák’s multiple-comparisons test. (B) Localization of GFP-SNX32 with GM130. (C–E) Localization of HA SNX32ΔN with (C) early endosomal marker EEA1, (D) GFP-SNX1, EEA1, and (E) GFP-SNX4, EEA1: scale bar 10 μm, inset 5 μm (magnified regions are shown as insets, inset of the merge is magnified and represented as zoom). (F) HA SNX32ΔC colocalizes with GFP PHOSBP, protein module showing preferential association with PI(4)P. Scale bar 10 μm, inset 5 μm (magnified regions are shown as insets, inset of the merge is magnified and represented as zoom). (G) Quantifications showing percentage colocalization of HA SNX32ΔN/HA SNX32ΔC with respective compartment markers in HeLa cells, data represent mean ± SEM (N = 3, n ≥ 60 cells per independent experiments). (H–O) Wortmannin/DMSO treatment in HeLa cells overexpressing (H) endogenous EEA1, (I) RFP-PHPLCδ, (J) GFP-PHOSBP, (K) HA-SNX32ΔN, (L) HA-SNX32ΔC, (M) HA-SNX32FL, (N) GFP-SNX4, and (O) GFP-SNX1. Scale bar 10 μm. (P) Membrane-cytosol fractions of HeLa cells transiently transfected with HA-SNX32ΔC or GFP-PHOSBP showing PAO treatment causes delocalization of HA-SNX32ΔC and GFP-PHOSBP proteins to the cytosolic fraction, S-Cytosol, P-membrane fraction (representative immunoblot out of three biological replicates, values represent the ratio of S to P fractions normalized to vinculin).
-
Figure 2—figure supplement 1—source data 1
Membrane-cytosol fractions of HeLa cells transiently transfected with HA-SNX32ΔC or GFP-PHOSBP showing PAO treatment causes delocalization of HA-SNX32ΔC and GFP-PHOSBP proteins to the cytosolic fraction, S-cytosol, P-membrane fraction.
Immunoblot source data (values represent the ratio of S to P fractions normalized to vinculin).
- https://cdn.elifesciences.org/articles/84396/elife-84396-fig2-figsupp1-data1-v2.zip
Figure 2—figure supplement 2
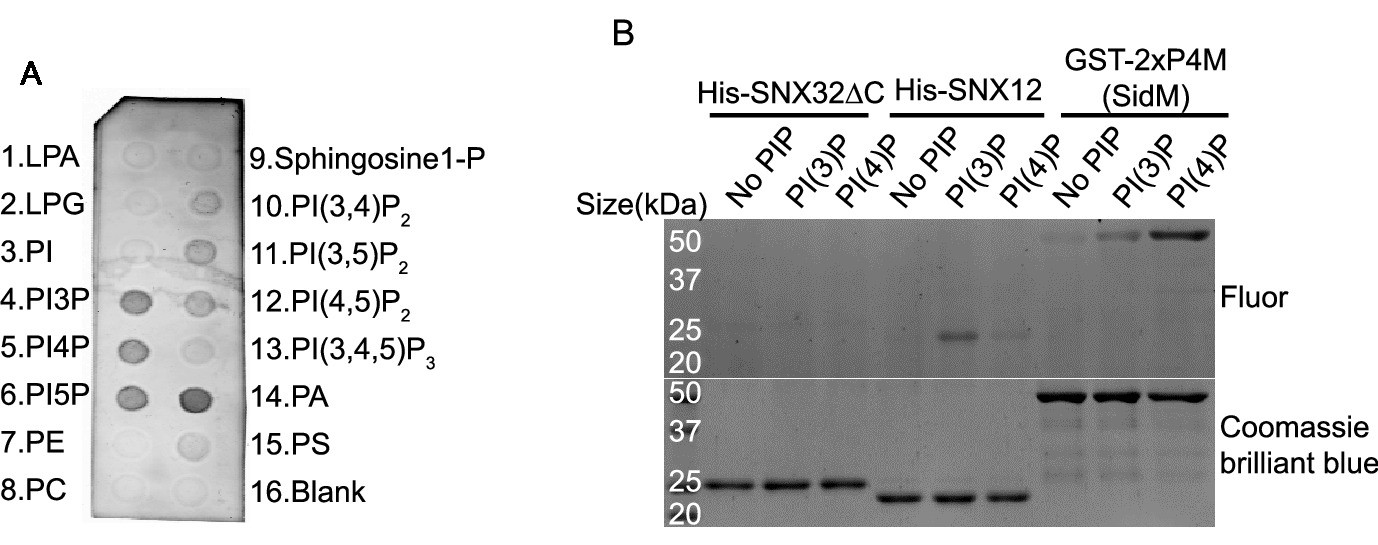
Lipid affinity of SNX32ΔN.
(A) PIP strip membrane immunoblotted using His antibody showing preferential binding of His-SNX32ΔC to PI(3)P, PI(4)P, PI(5)P, PA (representative immunoblot out of three biological replicates). (B) PLiMAP images showing in-gel fluorescence of BDPE-crosslinked (top) and Coomassie blue stained (bottom), His-SNX32ΔC, His-SNX12, and GST-2xP4M domain of SidM after PLiMAP. Source data of three biological replicates.
-
Figure 2—figure supplement 2—source data 1
PIP strip membrane immunoblotted using His antibody showing preferential binding of His-SNX32ΔC to PI(3)P, PI(4)P, PI(5)P, PA.
Immunoblot source data of three biological replicates.
- https://cdn.elifesciences.org/articles/84396/elife-84396-fig2-figsupp2-data1-v2.zip
-
Figure 2—figure supplement 2—source data 2
PLiMAP images showing in-gel fluorescence of BDPE-crosslinked (top) and Coomassie blue stained (bottom), His-SNX32ΔC, His-SNX12, and GST-2xP4M domain of SidM after PLiMAP.
Source data of three biological replicates.
- https://cdn.elifesciences.org/articles/84396/elife-84396-fig2-figsupp2-data2-v2.zip
Figure 3 with 1 supplement
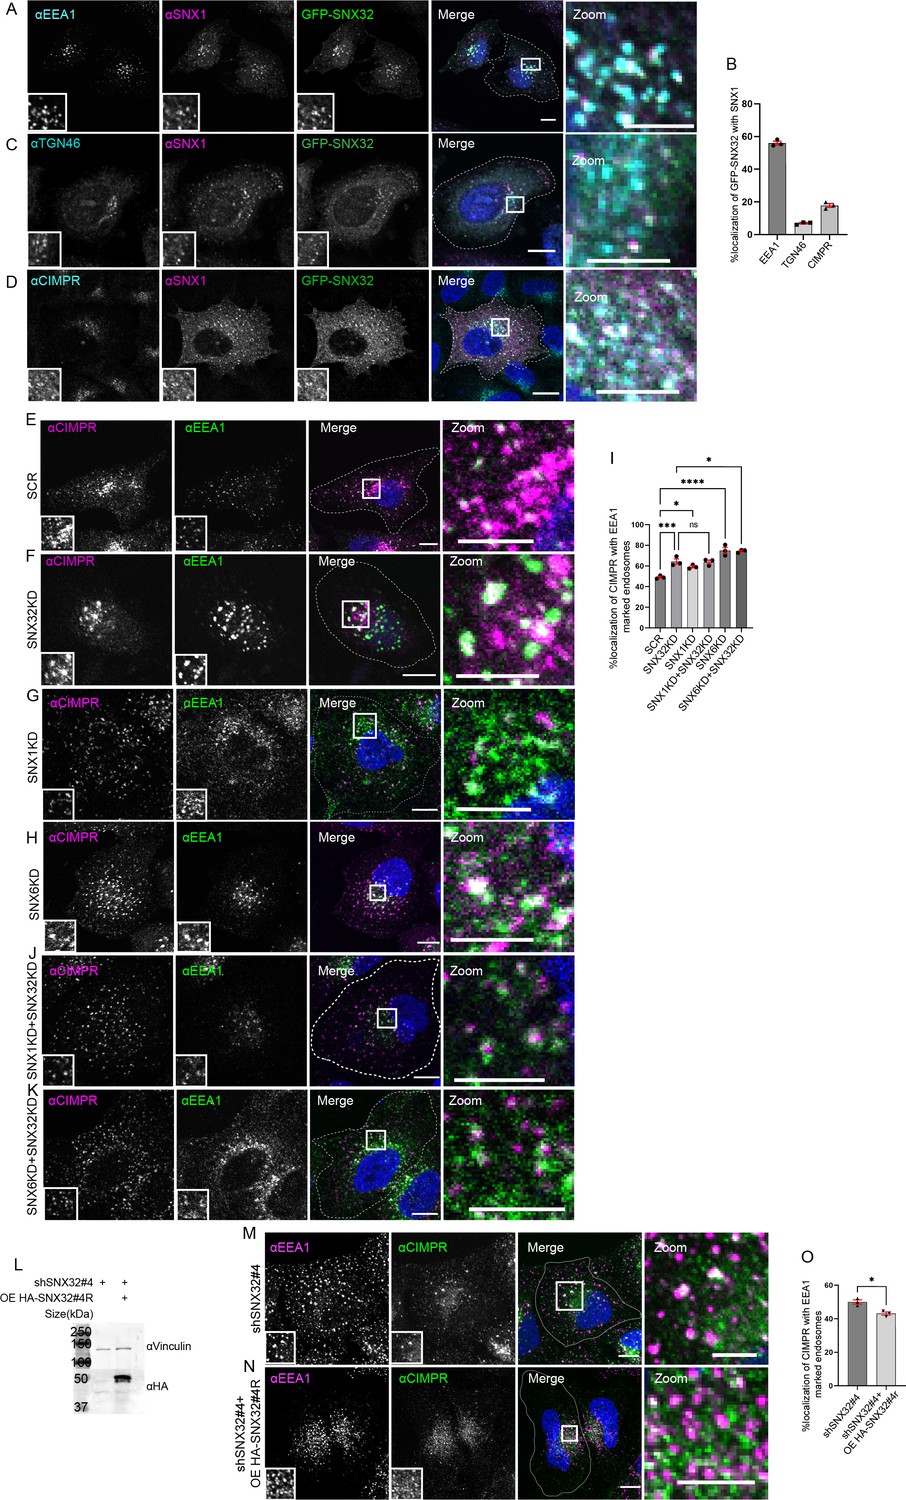
SNX32 interacts with and regulate the trafficking of CIMPR in HeLa cells.
(A–D) SNX32 and SNX1 colocalizes with (A) early endosome marker EEA1. (B) Percentage localization of SNX32-SNX1 heterodimer with EEA1, TGN46, and CIMPR, data represent mean ± SEM (N = 3, n ≥ 60 cells per independent experiments). (C) Trans Golgi Network marker TGN46. (D) CIMPR. Scale bar 10 μm, inset 5 μm (magnified regions are shown as insets, inset of the merge is magnified and represented as zoom), (E–K) Followed by SMART pool-mediated gene downregulation of (E) scrambled (SCR), (F) SNX32, (G) SNX1, and,(H) SNX6, HeLa cells were immunostained using CIMPR, EEA1 and nuclei were counterstained with DAPI (blue). Scale 10 μm, inset 5 μm (magnified regions are shown as insets, inset of the merge is magnified and represented as zoom). (I) Quantification of percentage localization of CIMPR with EEA1, data represent mean ± SEM (N = 3, n ≥ 60 cells per independent experiments), p-value<0.0001 (***p<0.001, ****p<0.0001, *p<0.05), one-way ANOVA, Šídák’s multiple-comparisons test. (J, K) Followed by SMART pool-mediated gene downregulation of (J) SNX32 and SNX1, (K) SNX32 and SNX6, HeLa cells were immunostained using CIMPR, EEA1 and nuclei were counterstained with DAPI (blue). Scale bar 10 μm, inset 5 μm (magnified regions are shown as insets, inset of the merge is magnified and represented as zoom). (L) Followed by shSNX32#4-mediated gene downregulation of SNX32 HASNX32#4r was overexpressed for 12 hr, immunoblotting was done using HA or vinculin antibody (representative immunoblot out of three biological replicates). (M) Followed by shRNA-mediated gene downregulation of SNX32 utilizing shRNA clone – shSNX32#4, HeLa cells were immunostained using CIMPR, EEA1 and nuclei were counterstained with DAPI (blue). (N) Followed by shSNX32#4-mediated gene downregulation of SNX32 HA-SNX32#4r was overexpressed for 12 hr, HeLa cells were immunostained using CIMPR, EEA1 and nuclei were counterstained with DAPI (blue). Scale bar 10 μm, inset 5 μm (magnified regions are shown as insets, inset of the merge is magnified and represented as zoom). (O) Quantification of percentage localization of CIMPR with EEA1, data represent mean ± SEM (N = 3, n ≥ 60 cells per independent experiments), p-value 0.0121 (*p<0.05), unpaired t test two-tailed.
Figure 3—figure supplement 1
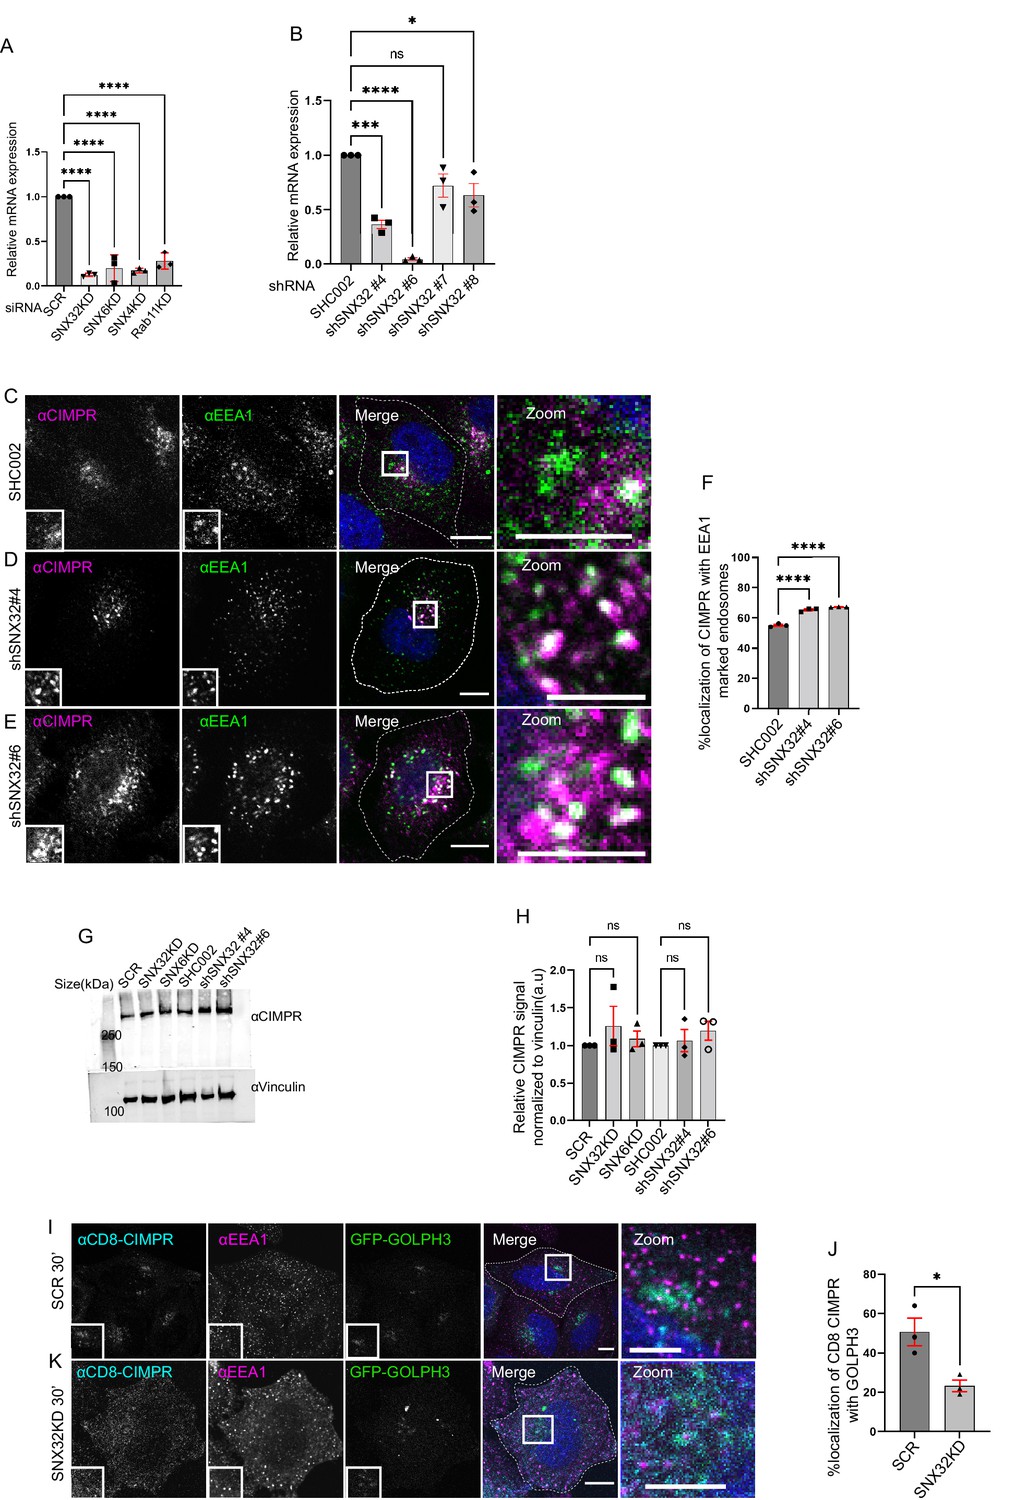
SNX32KD or SNX6 KD does not alter the total CIMPR protein in cells.
(A) Analysis of the relative gene expression levels of SNX32, SNX6, SNX4, and Rab11 by qRT-PCR in HeLa cells depleted for SNX32, SNX6, SNX4, and Rab11, respectively. Values of control were arbitrarily set as 1 against which experimental data were normalized. Gapdh was used as internal control, data represent mean ± SEM (N = 3), p-value <0.0001 (****p<0.0001),one-way ANOVA, Dunnett’s multiple-comparisons test. (B) Analysis of the relative gene expression levels of SNX32 by qRT-PCR in HeLa cells depleted for SNX32 utilizing different shRNA clones. Values of control were arbitrarily set as 1 against which experimental data were normalized. Gapdh was used as internal control, data represent mean ± SEM (N = 3), p-value <0.0001(*P< 0.05, ***P < 0.001, ****P< 0.0001, ns-non-significant), one-way ANOVA, Dunnett’s multiple-comparisons test. (C–F) Followed by shRNA-mediated gene downregulation of (C) scrambled (SHC002)/SNX32 shRNA clones ([D] shSNX32#4, [E] shSNX32#6) HeLa cells were immunostained using CIMPR, EEA1 and nuclei were counterstained with DAPI (blue). Scale bar 10 μm, inset 5 μm (magnified regions are shown as insets, inset of the merge is magnified and represented as zoom). (F) Quantification of percentage localization of CIMPR with EEA1, data represent mean ± SEM (N = 3, n ≥ 60 cells per independent experiments), p-value<0.0001 (****p<0.0001), one-way ANOVA, Dunnett’s multiple-comparisons test. (G) HeLa cells were transfected with scramble/SNX32/SNX6 siRNA or SHC002, shSNX32#4, shSNX32#6 shRNA followed by cycloheximide treatment of 10 μg/ml for 6 hr, immunoblotting was done using CIMPR or vinculin antibody (representative immunoblot out of three biological replicates). (H) Quantification of relative CIMPR signal normalized to vinculin (loading control), data represent mean ± SEM (N = 3) p-value 0.7104, one-way ANOVA Šídák’s multiple-comparisons test. (I–K) Followed by SMART pool-mediated gene downregulation of (I) scrambled (SCR)/(K) SNX32 in HeLa cells stably co-expressing GFP-GOLPH3 and CD8-CIMPR (CD8-CIMPR is a chimeric protein in which the cytoplasmic tail of CD8, cell surface protein, is replaced with the cytoplasmic tail of CIMPR, enabling CIMPR to shuttle from the plasma membrane to TGN). CD8 antibody uptake experiment was carried out as described in the ‘Materials and methods’ section, the cells were fixed at 30 min timepoint, immunostained using EEA1, and nuclei were counterstained with DAPI (blue). Scale bar 10 μm, inset 5 μm (magnified regions are shown as insets). (J) Quantification of percentage localization of CD8-CIMPR with GFP GOLPH3, data represent mean ± SEM (N = 3, n ≥ 60 cells per independent experiments), p-value 0.0233, unpaired t test two-tailed (*p<0.05).
-
Figure 3—figure supplement 1—source data 1
HeLa cells were transfected with Scramble/SNX32/SNX6 siRNA or SHC002, shSNX32#4, shSNX32#6 shRNA followed by cycloheximide treatment of 10 µg/ml for 6 hr.
Immunoblotting was done using CIMPR or vinculin antibody. Immunoblot source data of three biological replicates.
- https://cdn.elifesciences.org/articles/84396/elife-84396-fig3-figsupp1-data1-v2.zip
Figure 4 with 2 supplements
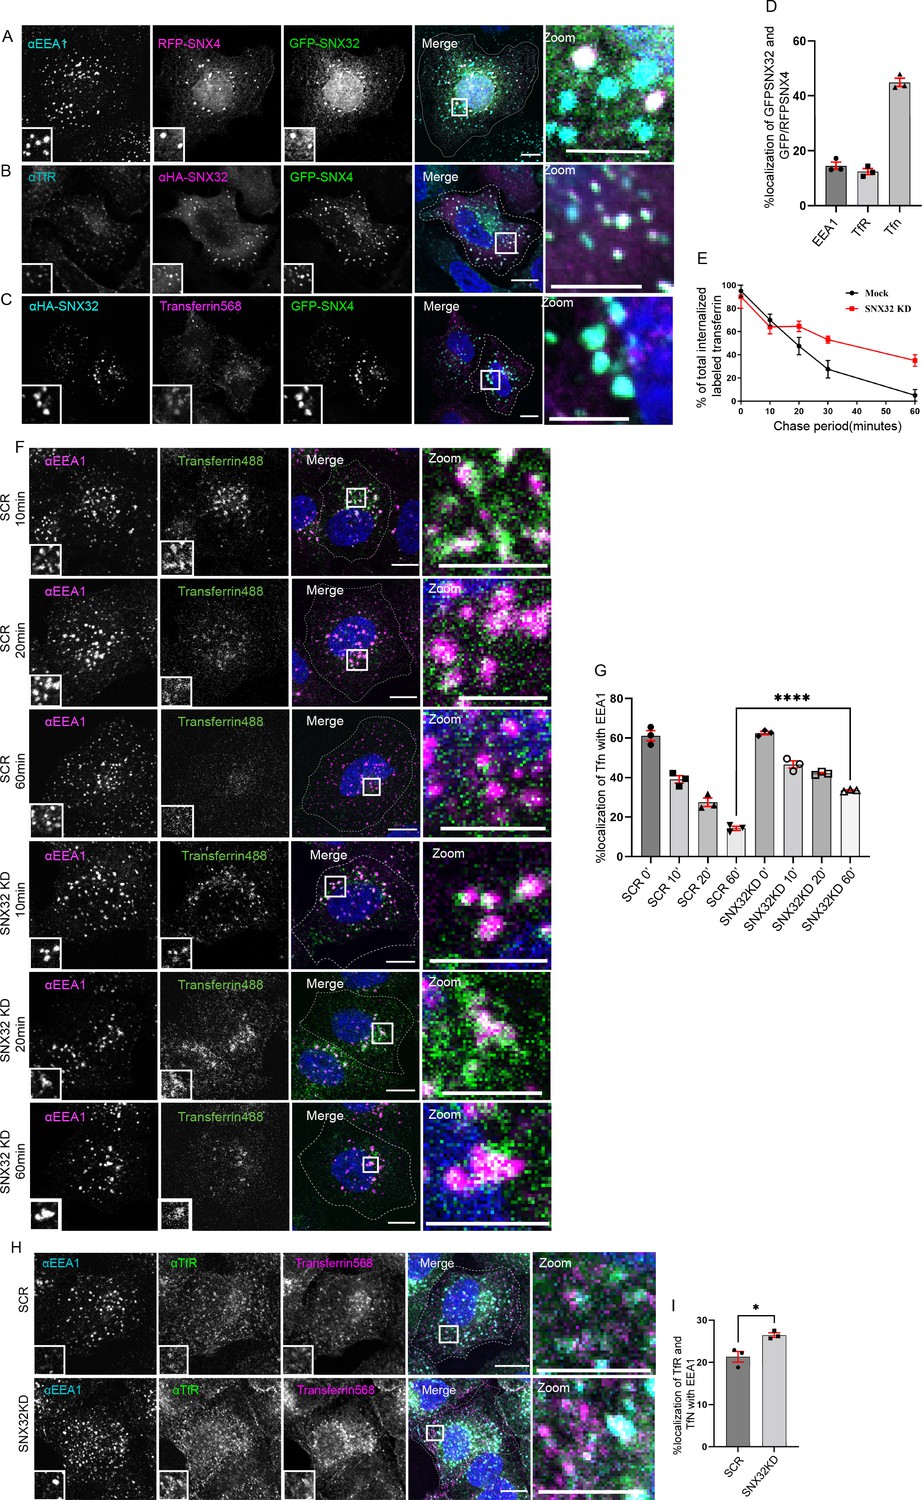
SNX32 interacts with and regulate the trafficking of transferrin-bound transferrin receptor in HeLa cells.
(A–D) SNX32 and SNX4 colocalize with (A) early endosome marker EEA1 and (B) perinuclear recycling endosomal marker TfR. (C) Alexa Fluor 568 conjugated transferrin. Scale bar 10 μm, inset 5 μm (magnified regions are shown as insets, inset of the merge is magnified and represented as zoom). (D) Percentage localization of SNX32 and SNX4 with EEA1, TfR, and transferrin, data represent mean ± SEM (N = 3, n ≥ 60 cells per independent experiments). (E) Quantitative estimation of the percentage of total internalized transferrin (Alexa Fluor 488 conjugated) in different chase periods measured by its total intensity of fluorescence in mock and SNX32-suppressed cells, data represent mean ± SEM (N = 3, n ≥ 60 cells per independent experiments). (F) Followed by SMART pool-mediated gene downregulation of scrambled (SCR) or SNX32, transferrin (Alexa Fluor 488 conjugated) pulse-chase experiment was carried out as described in the ‘Materials and methods’ section, the cells were fixed at specified timepoints, immunostained using early endosomal marker EEA1, and DAPI was used to stain nucleus. Scale bar 10 μm, inset 5 μm (magnified regions are shown as insets, inset of the merge is magnified and represented as zoom). (G) Quantification of percentage localization of transferrin (Alexa Fluor 488 conjugated) with EEA1 at corresponding timepoints, data represent mean ± SEM (N = 3, n ≥ 60 cells per independent experiments), p-value<0.0001 unpaired t test two-tailed (****p<0.0001). (H) Followed by SMART pool-mediated gene downregulation of scrambled (SCR) or SNX32, HeLa cells were allowed to uptake transferrin (Alexa Fluor 568 conjugated) for 30 min, 37°C, fixed and immunostained using EEA1, TfR, and DAPI was used to stain nucleus. Scale bar 10 μm, inset 5 μm (magnified regions are shown as insets, inset of the merge is magnified and represented as zoom). (I) Quantification of percentage localization of TfR with internalized transferrin and EEA1, data represent mean ± SEM (N = 3, n ≥ 60 cells per independent experiments), p-value 0.0206 (*p<0.05), unpaired t test two-tailed.
Figure 4—figure supplement 1
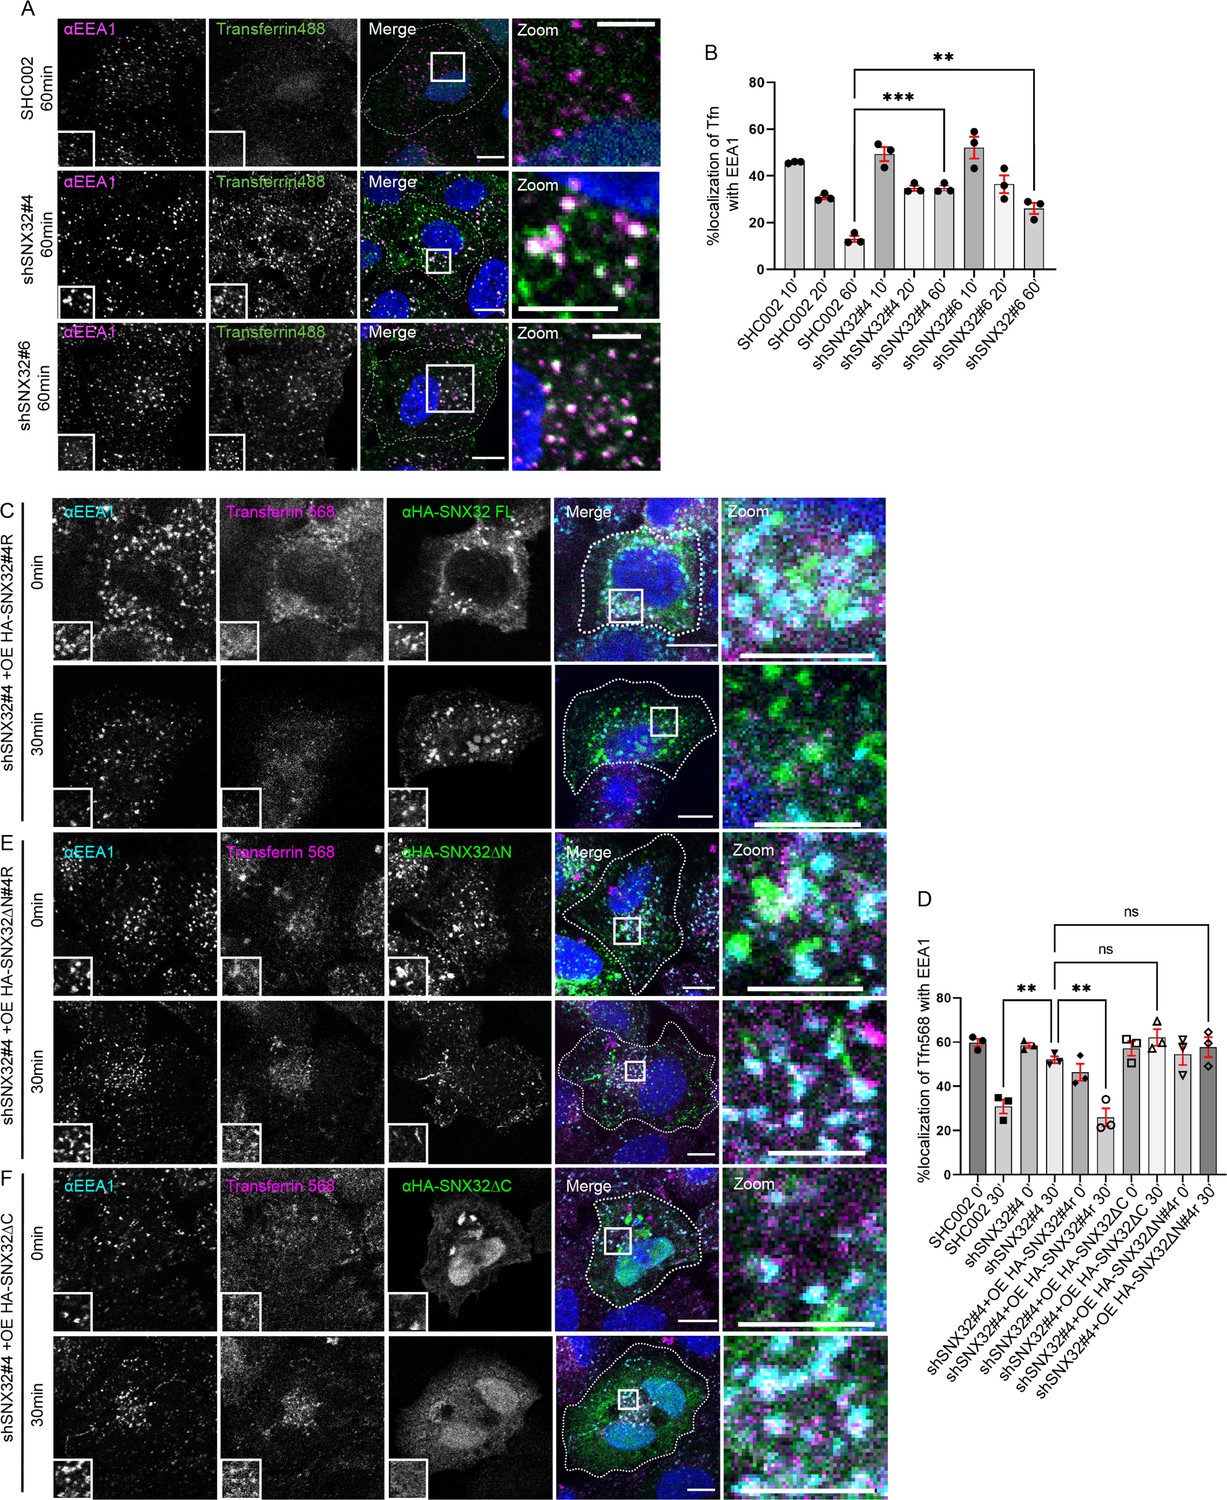
Transferrin stuck at EEA1 due to loss of SNX32 could be rescued by overexpressing shRNA-resistant SNX32.
(A, B) Followed by shRNA-mediated gene downregulation of scrambled (SHC002) or SNX32 shRNA clones (shSNX32#4, shSNX32#6) transferrin (Alexa Fluor 488 conjugated) pulse-chase experiment was carried out, the cells were fixed at timepoints specified, immunostained using EEA1, and DAPI was used to stain nucleus. Scale bar 10 μm, inset 5 μm (magnified regions are shown as insets, inset of the merge is magnified and represented as zoom). (B) Quantification of percentage localization of internalized transferrin with EEA1 at corresponding timepoints, data represent mean ± SEM (N = 3, n ≥ 60 cells per independent experiments), p-value 0.0003 (**p<0.01, ***p<0.001), one-way ANOVA, Dunnett’s multiple-comparisons test. (C–F) Followed by shSNX32#4-mediated gene downregulation of SNX32 (C) HA-SNX32#4r, (E) HASNX32ΔN#4r, or (F) HA-SNX32ΔC was overexpressed, the transferrin (Alexa Fluor 568 conjugated) pulse-chase experiment was carried out as described in the ‘Materials and methods’ section, the cells were fixed at specified timepoints, immunostained using early endosomal marker EEA1, and DAPI was used to stain nucleus. Scale bar 10 μm, inset 5 μm (magnified regions are shown as insets, inset of the merge is magnified and represented as zoom). (D) Quantification of percentage localization of transferrin (Alexa Fluor 568 conjugated) with EEA1 at corresponding timepoints, data represent mean ± SEM (N = 3, n ≥ 15 random frames per independent experiments), p-value<0.0001, ordinary one-way ANOVA, Šídák’s multiple-comparisons test (**p<0.01, ns, nonsignificant).
Figure 4—figure supplement 2
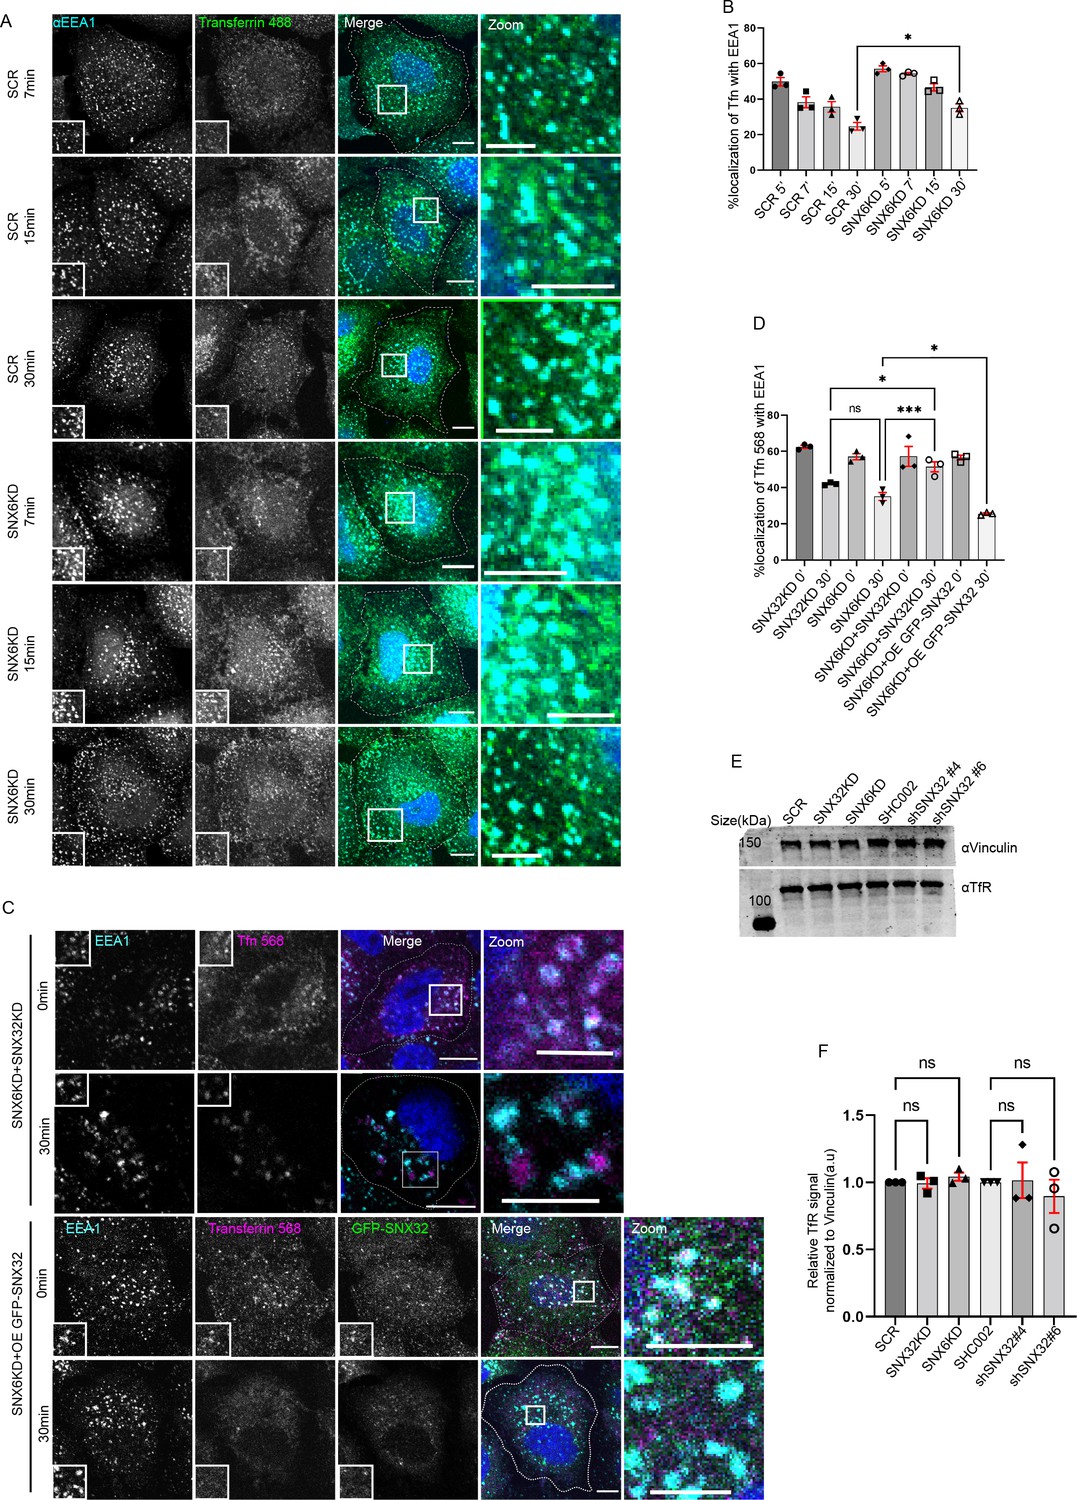
SNX6 and SNX32 show an overlapping role in regulating the trafficking of transferrin in HeLa cells.
(A) Followed by SMART pool-mediated gene downregulation of scrambled (SCR) or SNX6, transferrin (Alexa Fluor 488 conjugated) pulse-chase experiment was carried out as described in the ‘Materials and methods’ section, the cells were fixed at specified timepoints, immunostained using EEA1, and nuclei were counterstained with DAPI (blue) (blue). Scale bar 10 μm, inset 5 μm (magnified regions are shown as insets, inset of the merge is magnified and represented as zoom). (B) Quantification of percentage localization of transferrin (Alexa Fluor 488 conjugated) with EEA1 at corresponding timepoints, data represent mean ± SEM (N = 3, n ≥ 60 cells per independent experiments), p-value<0.0273 unpaired t test two-tailed (*p<0.05). (C) Followed by SMART pool-mediated gene downregulation of SNX6 and SNX32 or SNX6KD and overexpression of GFP-SNX32, the transferrin (Alexa Fluor 568 conjugated) pulse-chase experiment was carried out as described in the ‘Materials and methods’ section, the cells were fixed at specified timepoints, immunostained using early endosomal marker EEA1, and DAPI was used to stain nucleus. Scale bar 10 μm, inset 5 μm (magnified regions are shown as insets, inset of the merge is magnified and represented as zoom). (D) Quantification of percentage localization of transferrin (Alexa Fluor 568 conjugated) with EEA1 at corresponding timepoints, data represent mean ± SEM (N = 3, n ≥ 15 random frames per independent experiments) p-value<0.0001 one-way ANOVA Šídák’s multiple-comparisons test (*p<0.05, ***p<0.001, ns, nonsignificant). (E) HeLa cells were transfected with scramble/SNX32/SNX6 siRNA or shc002, shSNX32#4, shSNX32#6 shRNA followed by cycloheximide treatment of 10 μg/ml for 6 hr, immunoblotting was done using TfR or vinculin antibody (representative immunoblot out of three biological replicates). (F) Quantification of relative TfR signal normalized to vinculin (loading control), data represent mean ± SEM (N = 3) p-value 0.8254, one-way ANOVA Šídák’s multiple-comparisons test (ns, nonsignificant).
-
Figure 4—figure supplement 2—source data 1
HeLa cells were transfected with scramble/SNX32/SNX6 siRNA or shc002, shSNX32#4, shSNX32#6 shRNA followed by cycloheximide treatment of 10 µg/ml for 6 hr, immunoblotting was done using TfR or vinculin antibody.
Immunoblot source data of three biological replicates.
- https://cdn.elifesciences.org/articles/84396/elife-84396-fig4-figsupp2-data1-v2.zip
Figure 5
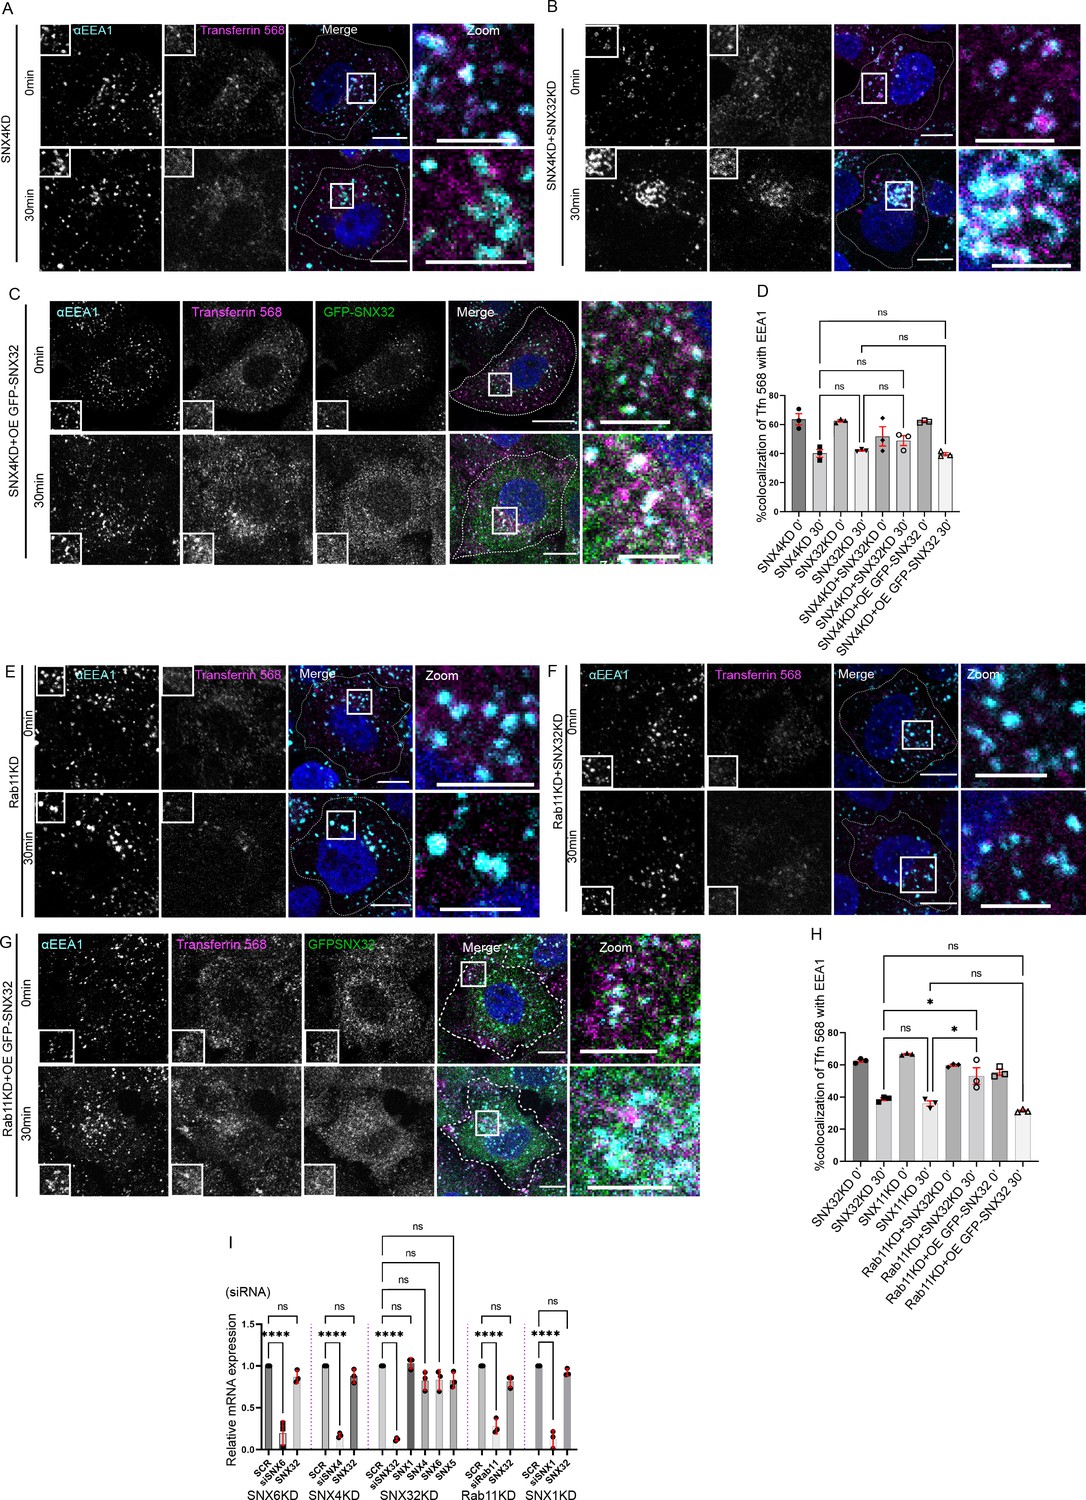
Interplay of SNX32, SNX4 and Rab11 in transferrin trafficking.
(A-C) Followed by SMARTpoolmediated gene down regulation of (A) SNX4, (B) SNX4 and SNX32 (C) SNX4KD and overexpression of GFP-SNX32, the transferrin (Alexa Fluor 568 conjugated) Pulse-Chase experimentwas carried out as described in materials and method section, the cells were fixed at specifiedtimepoints, immunostained using early endosomal marker EEA1, DAPI was used to stain nucleus,Scale 10μm, inset 5μm (magnified regions are shown as insets, inset of the merge is magnified andrepresented as zoom). (D) Quantification of percentage localization of transferrin (Alexa Fluor 568conjugated) with EEA1 at corresponding time points, data represent mean ± SEM (N=3, n≥15random frames per independent experiments), P value <0.0636, Ordinary one-way ANOVA,Šídák's multiple comparisons test (ns-nonsignificant). (E-G) Followed by SMARTpool mediatedgene down regulation of (E) Rab11, (F) Rab11 and SNX32 (G) Rab11KD and over expression ofGFP-SNX32, transferrin (Alexa Fluor 568 conjugated) Pulse-Chase experiment was carried out asdescribed in materials and method section, the cells were fixed at specified timepoints,immunostained using early endosomal marker EEA1, DAPI was used to stain nucleus, Scale10μm, inset 5μm (magnified regions are shown as insets, inset of the merge is magnified andrepresented as zoom). (H) Quantification of percentage localization of transferrin (Alexa Fluor 568conjugated) with EEA1 at corresponding time points, data represent mean ± SEM (N=3, n≥15random frames per independent experiments), P value <0.0030, Ordinary one-way ANOVA,Šídák's multiple comparisons test (* P < 0.05, ns-nonsignificant). (I) Analysis of the relative geneexpression levels of SNX1,SNX5, SNX6, SNX4 and SNX32 by qRT-PCR in HeLa cells depletedfor SNX4, SNX6, SNX32, Rab11 and SNX1. Values of control were arbitrarily set as 1 againstwhich experimental data were normalized. Gapdh was used as internal control, data represent mean ± SEM (N=3) P value <0.0001, Ordinary one-way ANOVA, Šídák's multiple comparisons test(**** P < 0.0001, ns-nonsignificant).
-
Figure 5—source data 1
GBP co-immunoprecipitation of GFP-tagged SNX4 and SNX32 transiently transfected in HEK293T cells showing GFP-SNX32 efficiently precipitating TfR.
GBP immunoprecipitation was carried out as described in the ‘Materials and methods’ section and immunoblotted using GFP and TfR antibody. Immunoblot source data (values represent the ratio of TfR to GFP band intensity).
- https://cdn.elifesciences.org/articles/84396/elife-84396-fig5-data1-v2.zip
-
Figure 5—source data 2
GBP co-immunoprecipitation of GFP-tagged SNX1 and SNX32 transiently transfected in HEK293T cells showing GFP-SNX32 efficiently precipitating CIMPR.
GBP immunoprecipitation was carried out as described in the ‘Materials and methods’ section and immunoblotted using GFP and TfR antibody. Immunoblot source data (values represent the ratio of CIMPR to GFP band intensity).
- https://cdn.elifesciences.org/articles/84396/elife-84396-fig5-data2-v2.zip
-
Figure 5—source data 3
His affinity chromatography-based pulldown showing His-SNX32ΔC precipitating TfR from membrane-enriched HeLa cell lysate fraction.
His pulldown was carried out as described in the ‘Materials and methods’ section and immunoblotted using His and TfR antibody. Immunoblot source data of two biological replicates (values represent the ratio of His to TfR band intensity).
- https://cdn.elifesciences.org/articles/84396/elife-84396-fig5-data3-v2.zip
-
Figure 5—source data 4
His affinity chromatography-based pulldown showing His-SNX32ΔC precipitating CIMPR from membrane-enriched HeLa cell lysate fraction.
His pulldown was carried out as described in the ‘Materials and methods’ section and immunoblotted using His and TfR antibody. Immunoblot source data.
- https://cdn.elifesciences.org/articles/84396/elife-84396-fig5-data4-v2.zip
-
Figure 5—source data 5
Co-immunoprecipitation of GFP-tagged SNX32 wild-type (WT) and GFP trap of GFP-tagged SNX32 WT/SNX32 F131D, showing both efficiently precipitating ESCPE-1 subunit SNX1, whereas SNX32 F131D failed to precipitate CIMPR, each transiently transfected in HEK293T cells.
The elute was resolved in SDS-PAGE and immunoblotted using GFP, SNX1, and CIMPR antibody. Immunoblot source data.
- https://cdn.elifesciences.org/articles/84396/elife-84396-fig5-data5-v2.zip
-
Figure 5—source data 6
GBP co-immunoprecipitation of GFP-tagged SNX-proteins transiently transfected in HeLa cells showing GFP-SNX32 but not GFP-SNX32 F131D efficiently pulling down TfR.
GBP immunoprecipitation was carried out as described in the ‘Materials and methods’ section and immunoblotted using GFP and TfR antibody. Immunoblot source data of three biological replicates (values represent the ratio of TfR to GFP band intensity).
- https://cdn.elifesciences.org/articles/84396/elife-84396-fig5-data6-v2.zip
Figure 6 with 1 supplement
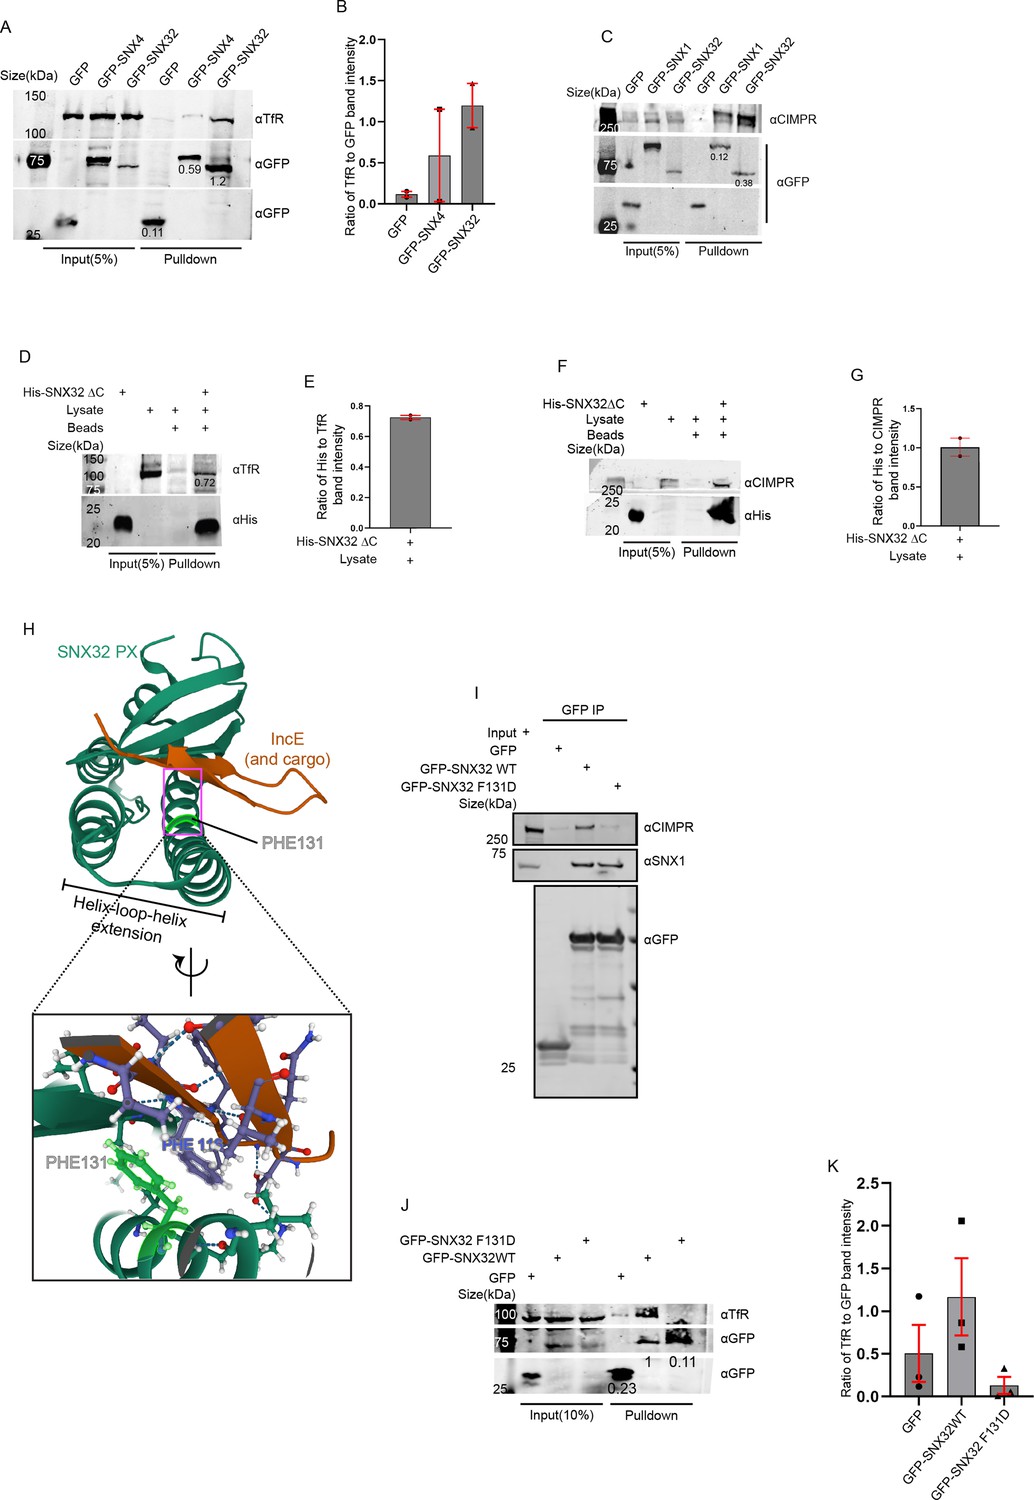
PX domain of SNX32 participates in the interaction with CIMPR and TfR, and F131 of SNX32 is critical for interaction with cargo.
(A) GBP co-immunoprecipitation of GFP-tagged SNX4 and SNX32 transiently transfected in HEK293T cells showing GFP-SNX32 efficiently precipitating TfR. GBP immunoprecipitation was carried out as described in the ‘Materials and methods’ section and immunoblotted using GFP and TfR antibody (representative immunoblot out of three biological replicates, values represent the ratio of TfR to GFP band intensity). (B) Plot representing quantifications of the three independent experiments of GBP co-immunoprecipitation of GFP/HA-tagged SNX-proteins represented in (A). (C) GBP co-immunoprecipitation of GFP-tagged SNX1 and SNX32 transiently transfected in HEK293T cells showing GFP-SNX32 efficiently precipitating CIMPR. GBP immunoprecipitation was carried out as described in the ‘Materials and methods’ section and immunoblotted using GFP and TfR antibody (representative immunoblot out of three biological replicates, values represent the ratio of CIMPR to GFP band intensity). (D) His affinity chromatography-based pulldown showing His-SNX32ΔC precipitating TfR from membrane-enriched HeLa cell lysate fraction. His pulldown was carried out as described in the ‘Materials and methods’ section and immunoblotted using His and TfR antibody (representative immunoblot out of three biological replicates, values represent the ratio of His to TfR band intensity). (E) Plot representing quantifications of the two independent experiments of GBP co-immunoprecipitation of GFP/HA-tagged SNX-proteins represented in (D). (F) His affinity chromatography-based pulldown showing His-SNX32ΔC precipitating CIMPR from membrane-enriched HeLa cell lysate fraction. His pulldown was carried out as described in the ‘Materials and methods’ section and immunoblotted using His and TfR antibody (representative immunoblot out of three biological replicates). (G) Plot representing quantifications of the two independent experiments of GBP co-immunoprecipitation of GFP/HA-tagged SNX-proteins represented in (F). (H) Cargo/IncE-binding site of SNX32 PX domain as observed in crystal structure (PDB ID: 6E8R) reported by Chandra et al., 2019, inset showing the stacking interaction between F131 of SNX32 and F116 of IncE. (I) Co-immunoprecipitation of GFP-tagged SNX32 wild-type (WT) and GFP trap of GFP-tagged SNX32 WT/ SNX32 F131D, showing both efficiently precipitating ESCPE-1 subunit SNX1, whereas SNX32 F131D failed to precipitate CIMPR, each transiently transfected in HEK293T cells. The elute was resolved in SDS-PAGE and immunoblotted using GFP, SNX1, and CIMPR antibody. (J) GBP co-immunoprecipitation of GFP-tagged SNX-proteins transiently transfected in HeLa cells showing GFP-SNX32 but not GFP-SNX32 F131D efficiently pulling down TfR. GBP immunoprecipitation was carried out as described in the ‘Materials and methods’ section and immunoblotted using GFP and TfR antibody (representative immunoblot out of three biological replicates, values represent the ratio of TfR to GFP band intensity). (K) Plot representing quantifications of the three independent experiments of GBP co-immunoprecipitation of GFP /HA-tagged SNX-proteins represented in (J).
-
Figure 6—source data 1
Co-immunoprecipitation of mCherry-tagged SNX-proteins transiently transfected in U87MG cells showing mCherry-SNX32 but not mCherry-SNX6 efficiently pulling down Basigin (BSG).
mCherry nanobody-mediated pulldown was carried out as described in the ‘Materials and methods’ section and immunoblotted using mCherry and BSG antibody. Immunoblot source data of two biological replicates (values represent the ratio of BSG to mCherry band intensity).
- https://cdn.elifesciences.org/articles/84396/elife-84396-fig6-data1-v2.zip
-
Figure 6—source data 2
Histidine (His) pulldown showing His SNX32ΔC efficiently pulling down BSG from membrane-enriched HeLa lysate.
Immunoblot source data of two biological replicates (values represent the ratio of BSG to His band intensity).
- https://cdn.elifesciences.org/articles/84396/elife-84396-fig6-data2-v2.zip
-
Figure 6—source data 3
GFP-tagged SNX-proteins transiently transfected in HeLa cells showing GFP-SNX32 WT but not GFP-SNX32 F131D efficiently pulling down Basigin (BSG).
GFP nanobody-mediated pulldown was carried out as described in the ‘Materials and methods’ section and immunoblotted using GFP and BSG antibody. Immunoblot source data of two biological replicates (values represent the ratio of BSG to GFP band intensity).
- https://cdn.elifesciences.org/articles/84396/elife-84396-fig6-data3-v2.zip
Figure 6—figure supplement 1
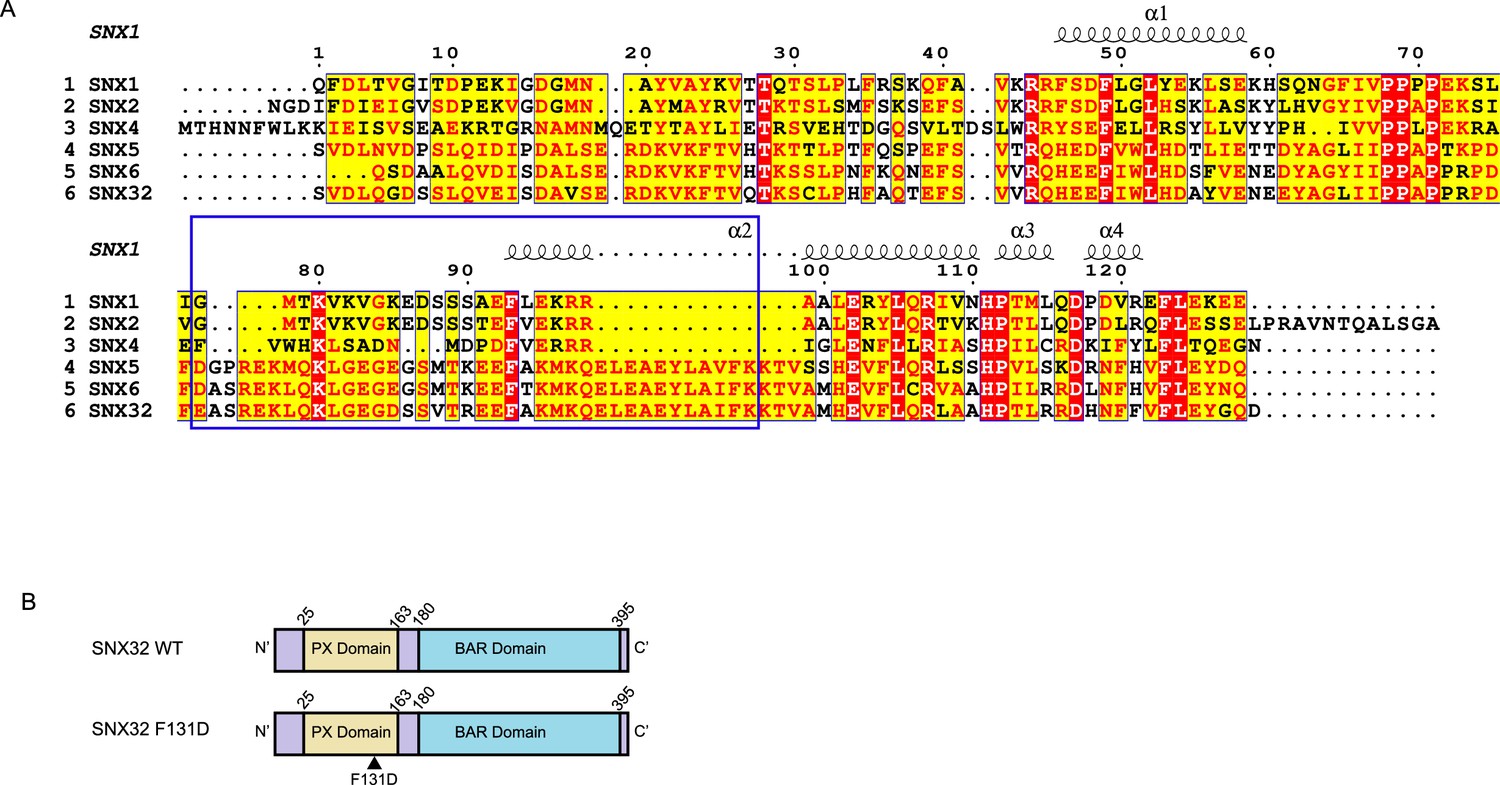
Mapping the interactome of SNX32, utilizing the conserved F131 residue.
(A) Alignment of the PX domain of SNX1, SNX2, SNX4, SNX5, SNX6, and SNX32. The blue box represents the αʹ and αʹʹ helices that compose the unique helix-turn-helix extension; the black arrow points to F131 residue of SNX32. (B) The domain architecture of SNX32 indicating the N- and C-terminal endpoints of SNX32FL, SNX32ΔC, and SNX32 F131D.
Figure 7 with 1 supplement

SNX32 plays a crucial role in neurite differentiation, and it interacts with immunoglobulin superfamily member BSG via its PX domain.
(A) Phase-contrast image of Neuro2a cells transfected with scrambled (SCR)/SNX32/SNX6 siRNA SMART pool followed by neurite induction as described in the ‘Materials and methods’ section, fixed, and imaged using Zeiss Axio vert. A1 microscope. Scale bar 50 μm. (B) Quantification of number of cells with elongated neurites, data represent mean ± SEM (N = 3, n ≥ 100 cells per independent experiments, values are means ± SEM), p-value 0.0025 (**p<0.01), ordinary one-way ANOVA Dunnett’s multiple-comparisons test. (C–E) Snapshots of SCR/SNX6/SNX32 SMART pool siRNA-transfected Neuro2a cells induced with RA for neurite induction showing neurite sprouting. Scale bar 50 μm (black arrows pointing to sprouting). (F–H) Snapshots of Neuro2a cells transfected with SCR/SNX6/SNX32 SMART pool siRNA-transfected Neuro2a cells induced with RA for neurite induction showing neurite extension, black arrows pointing to network formation/retraction of neurites. Scale bar 50 μm. (I) SHSY5Y cells showing colocalization of GFP-tagged SNX32 with EEA1 harboring endosomes. Scale bar 10 μm, inset 5 μm (magnified regions are shown as insets, inset of the merge is magnified and represented as zoom). (J) U87MG cells showing the colocalization of GFP-tagged SNX32 with Rab5 and EEA1 harboring endosomes. Scale bar 10 μm, inset 5 μm (magnified regions are shown as insets, inset of the merge is magnified and represented as zoom). (K) SILAC enrichment ratio (Log10) of SNX32 WT vs SNX32 F131D. SILAC was carried as described in the ‘Materials and methods’ section, the proteins consistently appearing in at least two experimental replicates were considered for the final analysis. (L) Co-immunoprecipitation of mCherry-tagged SNX-proteins transiently transfected in U87MG cells showing mCherry SNX32 but not mCherry SNX6 efficiently pulling down Basigin (BSG). mCherry nanobody-mediated pulldown was carried out as described in the ‘Materials and methods’ section and immunoblotted using mCherry and BSG antibody (representative immunoblot out of three biological replicates, values represent the ratio of BSG to mCherry band intensity). (M) Plot representing quantifications of the three independent experiments of GBP co-immunoprecipitation of GFP/HA-tagged SNX-proteins represented in (L). (N) Histidine (His) pulldown showing His SNX32ΔC efficiently pulling down BSG from membrane-enriched HeLa lysate (representative immunoblot out of three biological replicates, values represent the ratio of BSG to His band intensity). (O) Plot representing quantifications of the three independent experiments of GBP co-immunoprecipitation of GFP/HA-tagged SNX-proteins represented in (N). (P) GFP-tagged SNX-proteins transiently transfected in HeLa cells showing GFP SNX32 WT but not GFP SNX32 F131D efficiently pulling down Basigin (BSG). GFP nanobody-mediated pulldown was carried out as described in the ‘Materials and methods’ section and immunoblotted using GFP and BSG antibody (representative immunoblot out of three biological replicates, values represent the ratio of BSG to GFP band intensity). (Q) Plot representing quantifications of the three independent experiments of GBP co-immunoprecipitation of GFP/HA-tagged SNX-proteins represented in (P).
Figure 7—figure supplement 1
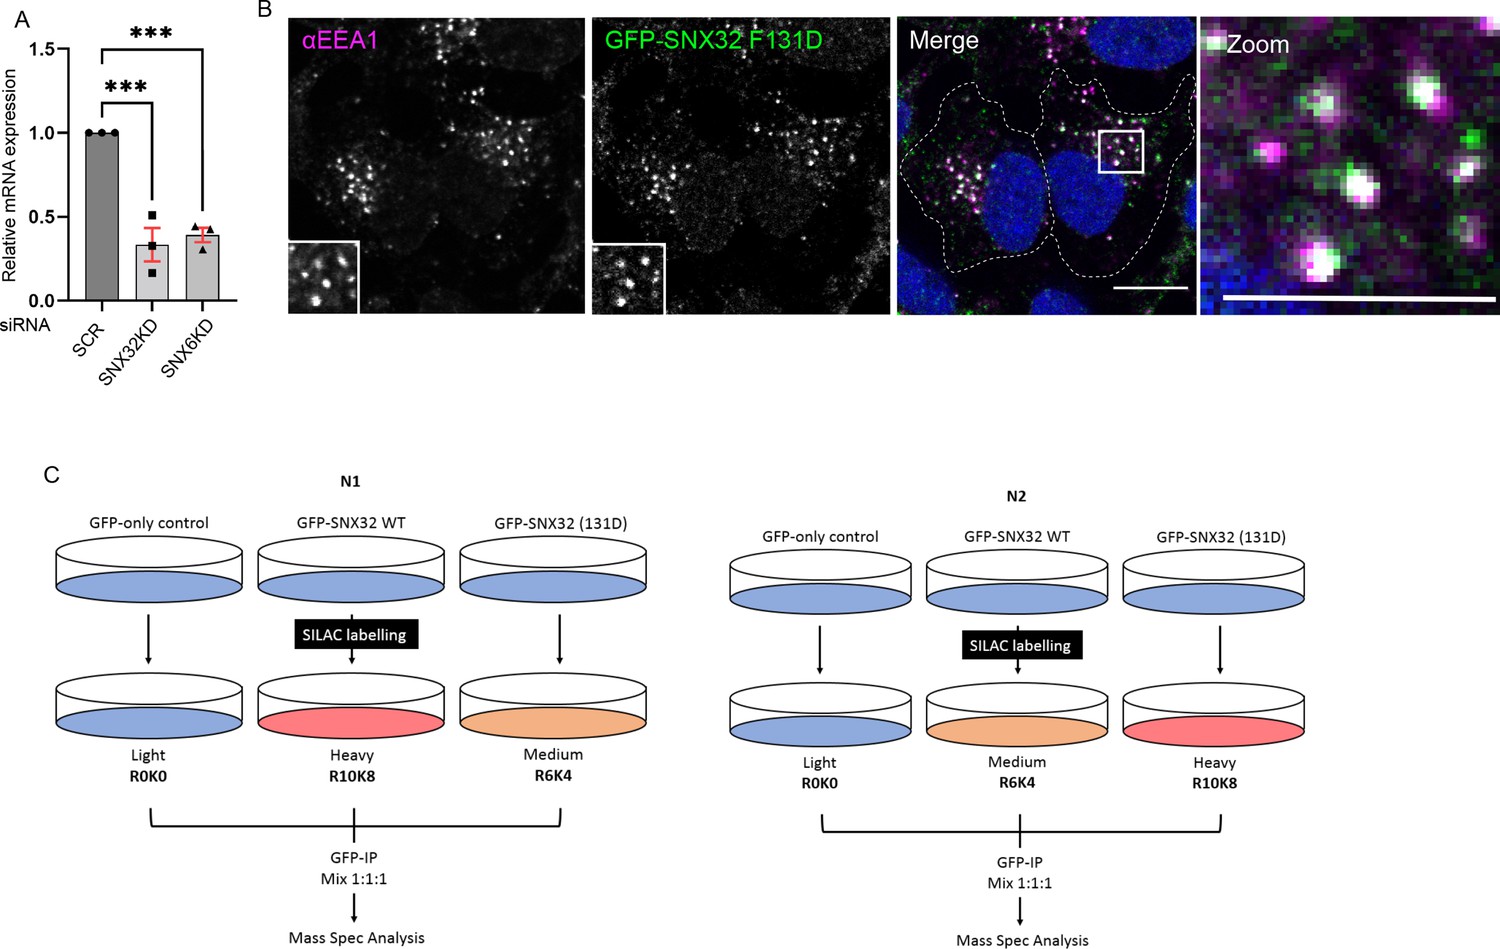
F131D mutation does not alter the endosomal localization of GFP-SNX32.
(A) Quantification of relative mRNA expression of SNX32 and SNX6 in Neuro2a cells treated with respective SMART Pool siRNAs, Values of control were arbitrarily set as 1 against which experimental data were normalized. Gapdh was used as internal control, (N = 3, values are means ± SEM), p-value 0.0005 (***p<0.001), ordinary one-way ANOVA Dunnett’s multiple-comparisons tests. (B) SHSY5Y cells showing colocalization of GFP-tagged SNX32 F131D with EEA1 harboring endosomes. Scale bar 10 μm, inset 5 μm (magnified regions are shown as insets, inset of the merge is magnified and represented as zoom). (C) Schematic representation of the SILAC methodology employed to obtain the differential proteomic dataset.
Figure 8 with 1 supplement
SNX32 and BSG play a crucial role in neurite network formation.
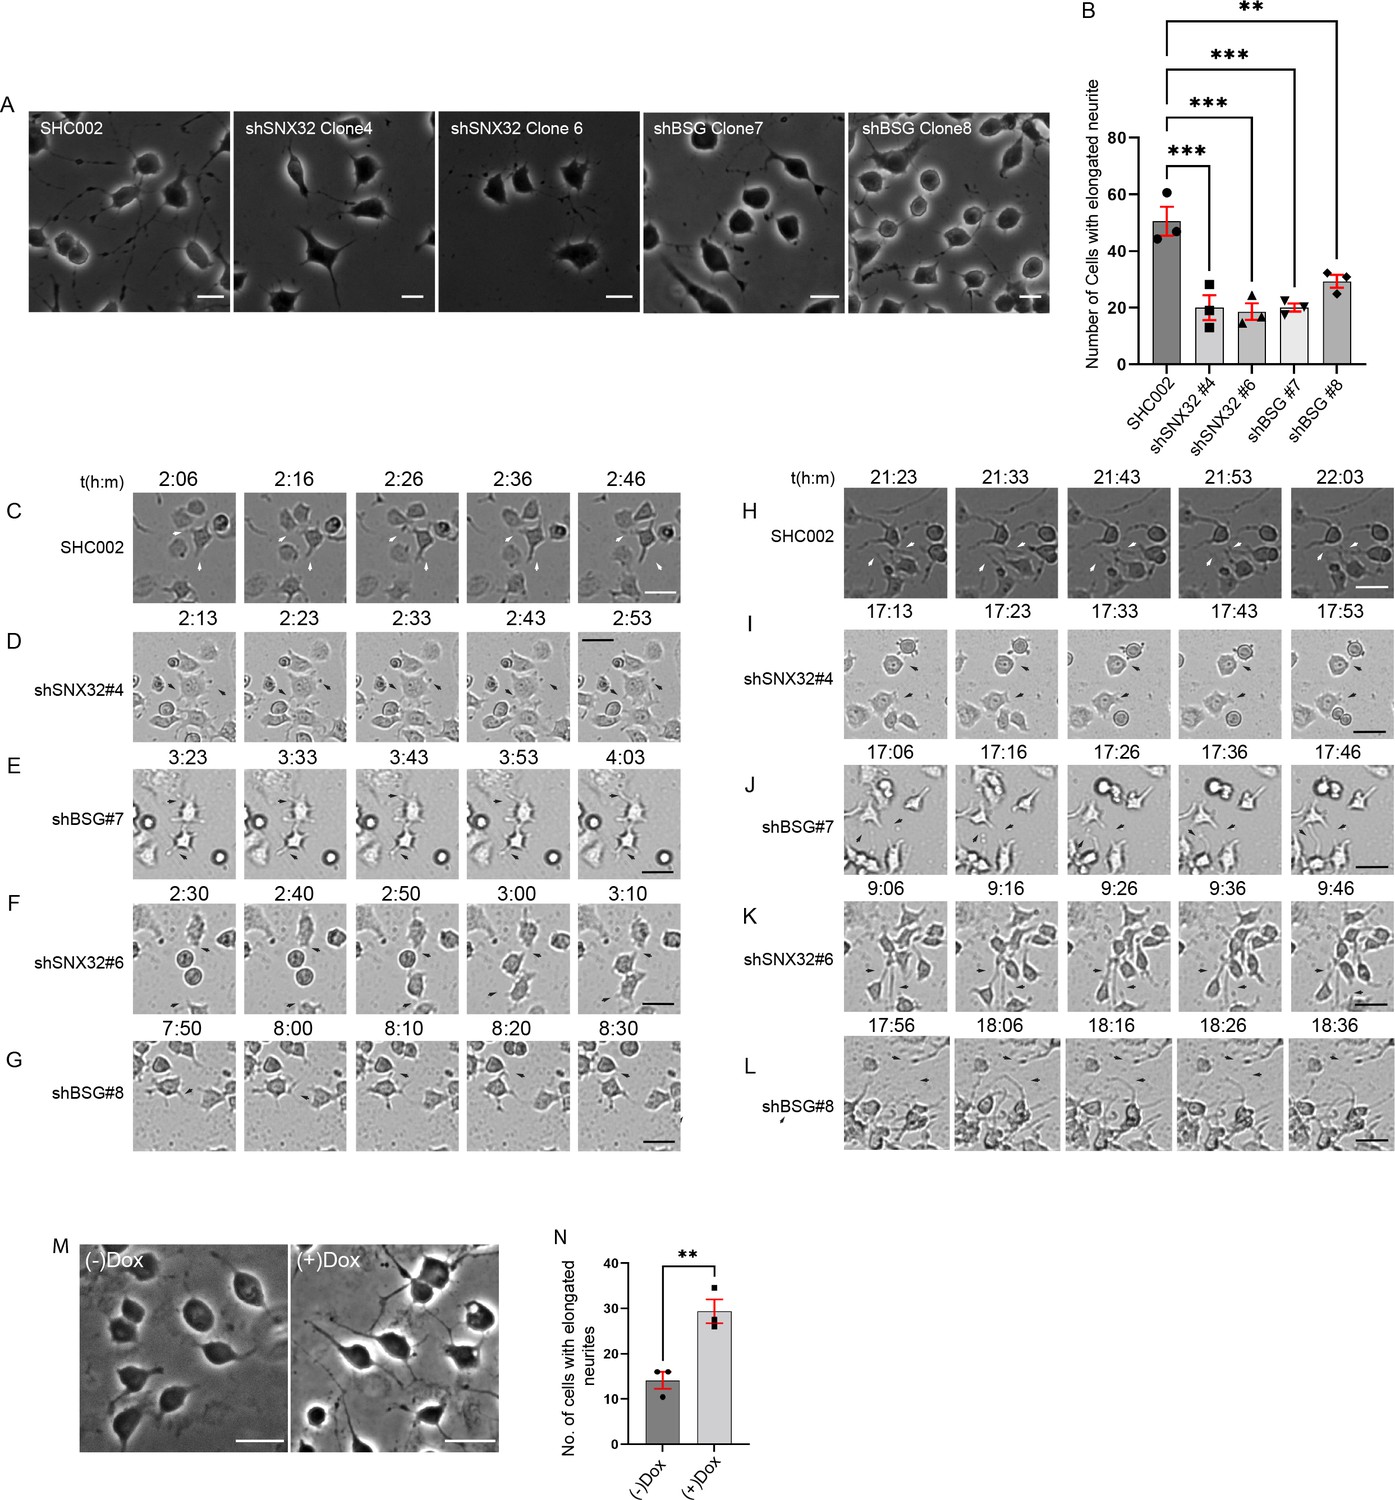
(A) Phase-contrast images of Neuro2a cells, which were transfected with scrambled (SHC002)/SNX32 (shSNX32#4, shSNX32#6)/BSG (shBSG#7, shBSG#8) shRNA clones followed by neurite induction as described in the ‘Materials and methods’ section, fixed, and imaged using Zeiss Axio vert. A1 microscope. Scale bar 50 μm. (B) Quantification of number of cells with elongated neurites, data represent mean ± SEM (N = 3, n ≥ 100 cells per independent experiments, values are means ± SEM), p-value 0.0003 (**p<0.01, ***p<0.001), ordinary one-way ANOVA Dunnett’s multiple-comparisons test. (C–G) Snapshots of Neuro2a cells transfected with scrambled (SHC002)/SNX32 (shSNX32#4, shSNX32#6)/BSG (shBSG#7, shBSG# 8) shRNA clones followed by neurite induction with RA for neurite induction showing neurite sprouting. Scale bar 50 μm (black arrows pointing to sprouting). (H–L) Snapshots of Neuro2a cells transfected with scrambled (SHC002)/SNX32 (shSNX32#4, shSNX32#6)/BSG (shBSG#7, shBSG# 8) shRNA clones followed by neurite induction with RA for neurite induction showing neurite extension, black arrows pointing to network formation/retraction of neurites. Scale bar 50 μm. (M) Phase-contrast image of Neuro2a cells stably expressing pLVX SNX32 transfected with shSNX32#4 followed by neurite induction with or without doxycyclin as described in the ‘Materials and methods’ section, fixed, and imaged using Zeiss Axio vert. A1 microscope. Scale bar 50 μm. (N) Quantification of number of cells with elongated neurites, data represent mean ± SEM (N = 3, n ≥ 100 cells per independent experiments), p-value 0.0091 (**p<0.01), unpaired t test.
Figure 8—figure supplement 1
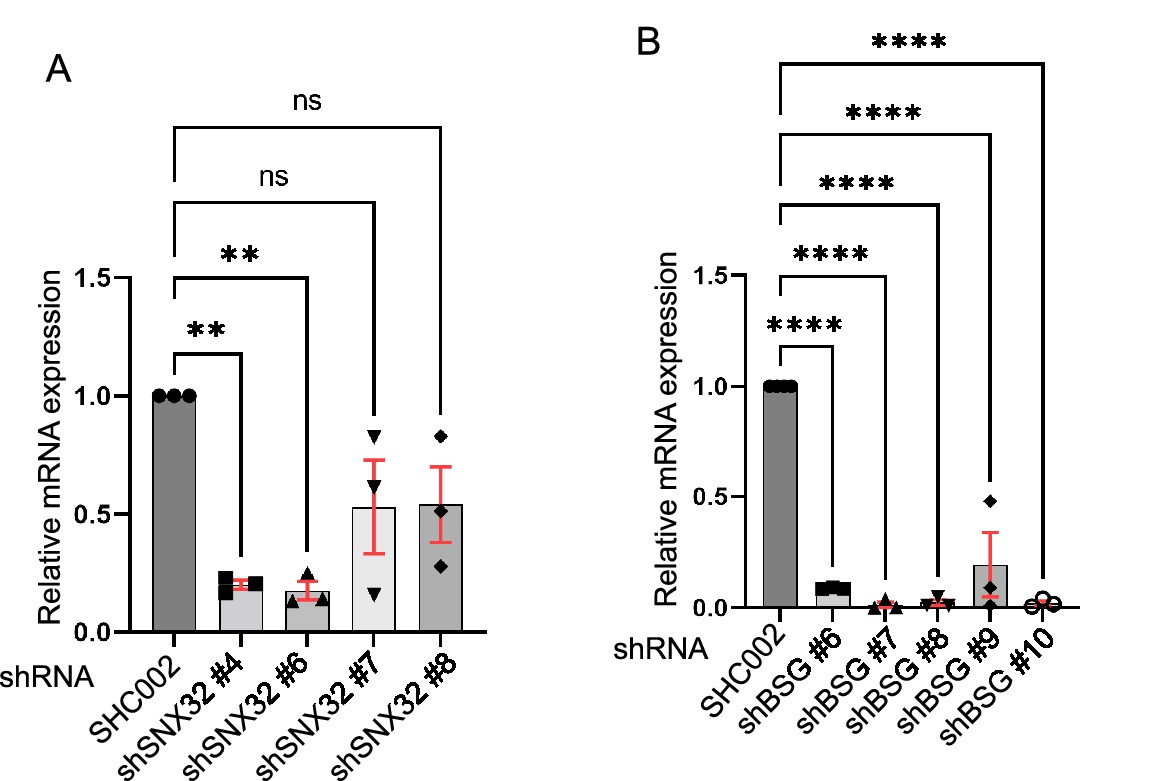
Relative mRNA expression quantification using RT-PCR.
(A, B) Relative mRNA expression of Neuro2a cells transfected with (A) SNX32 shRNA clones, p-value 0.0030 (N = 3, values are means ± SEM, **p<0.01, ns, nonsignificant), ordinary one-way ANOVA Dunnett’s multiple-comparisons tests. (B) BSG shRNA clones, p-value<0.0001, SMART Pool siRNAs (N = 3, values are means ± SEM, ****p<0.0001), ordinary one-way ANOVA Dunnett’s multiple-comparisons tests.
Figure 9 with 1 supplement
SNX32 but not SNX6 plays a significant role in surface localization of BSG.
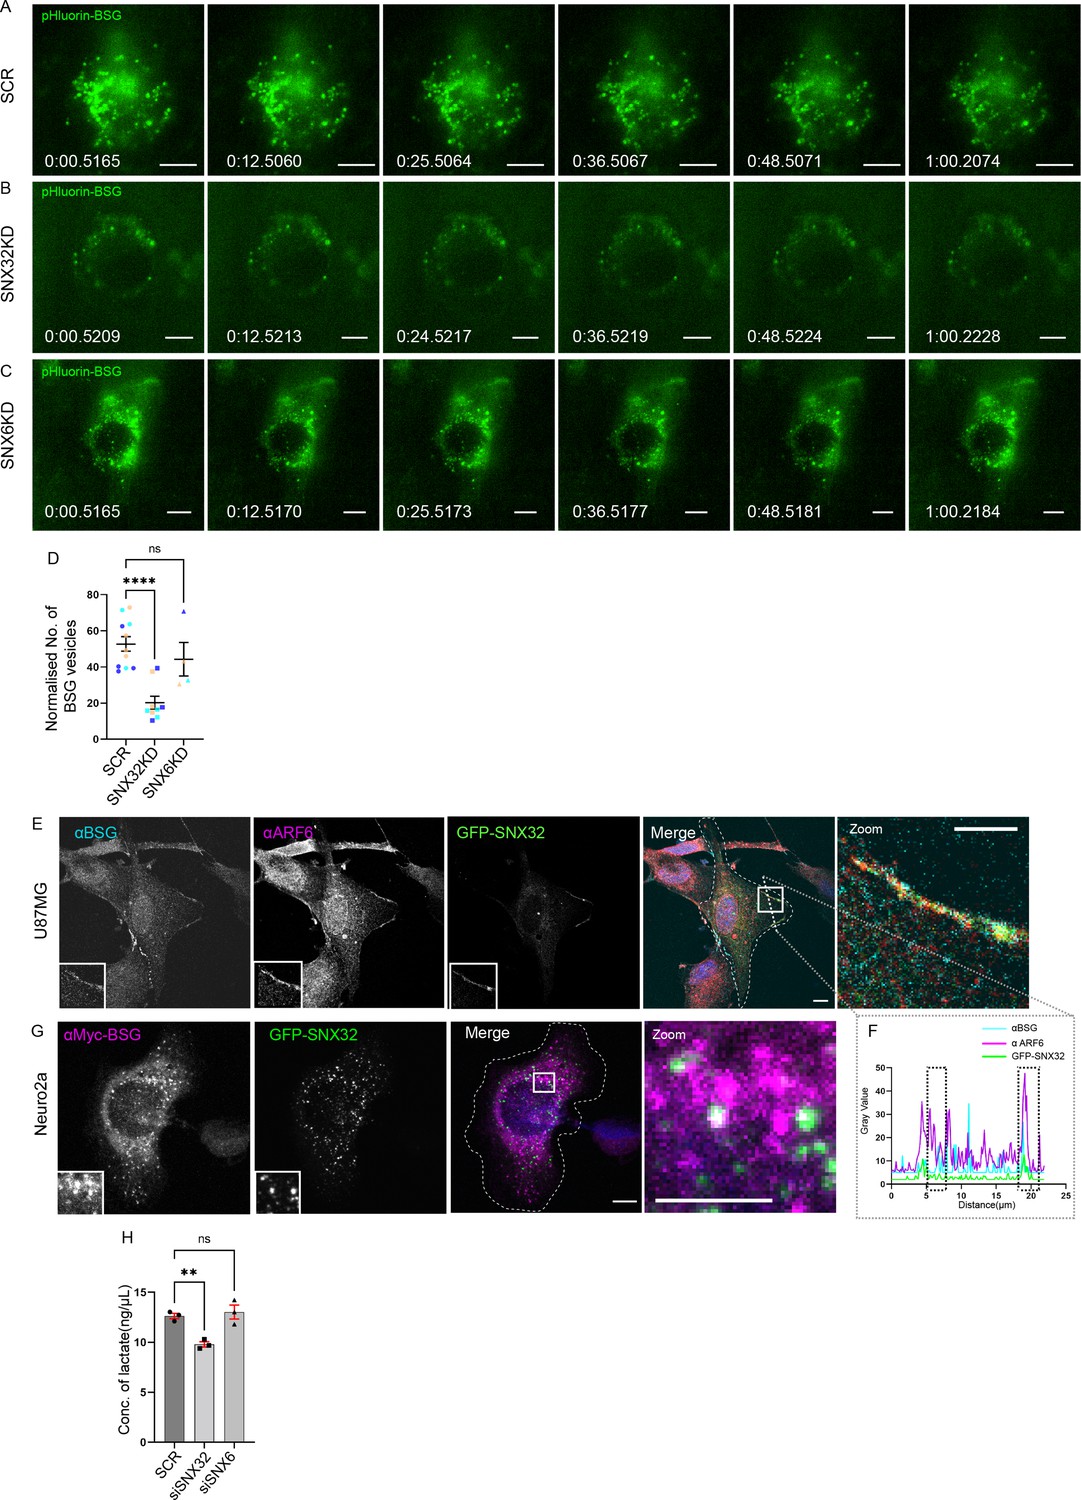
(A–C) Snapshots from live TIRF microscopic imaging of Neuro2a cells stably expressing pHluorin BSG transfected with (A) SCR, (B) SNX32, or (C) SNX6 siRNA SMART pool followed by doxycycline treatment for pHluorin BSG induction. Scale bar 10 μm. (D) Quantification of surface population of normalized number of BSG vesicles (N = 3, n ≥ 6 cells per independent experiments), represented as a SuperPlot20, prepared by superimposing summary statistics from repeated experiments on a graph of the individual measurements per cell. The samples per experiment are represented by color-coding the dots and the mean from each experiment is plotted as an error bar on top of the many smaller dots that denote individual measurements. The error bar is applied on the mean from each individual experiment. p-value 0.0003 (****p<0.0001, ns, nonsignificant), ordinary one-way ANOVA Dunnett’s multiple-comparisons test. (E) U87MG cells showing the colocalization of GFP-SNX32 with endogenous ARF6 and BSG on membrane. Scale bar 10 μm, inset 5 μm (magnified regions are shown as insets, inset of the merge is magnified and represented as zoom). (F) Representative line intensity plot of U87MG cell showing intensity overlap of GFP-SNX32, ARF6, and BSG. (G) Neuro2a cells showing colocalization of GFP SNX 32 with cMyc-BSG on vesicles. Scale bar 10 μm, inset 5 μm (magnified regions are shown as insets, inset of the merge is magnified and represented as zoom). (H) Quantification of concentration of lactate in the culture supernatant of U87MG cells transfected with SCR/SNX32/SNX6 SMART pool siRNA, N = 3, values are means ± SEM, p-value 0.0049 (**p<0.01, ns, nonsignificant), ordinary one-way ANOVA Dunnett’s multiple-comparisons test.
Figure 9—figure supplement 1
SNX32 regulates the surface population of BSG.
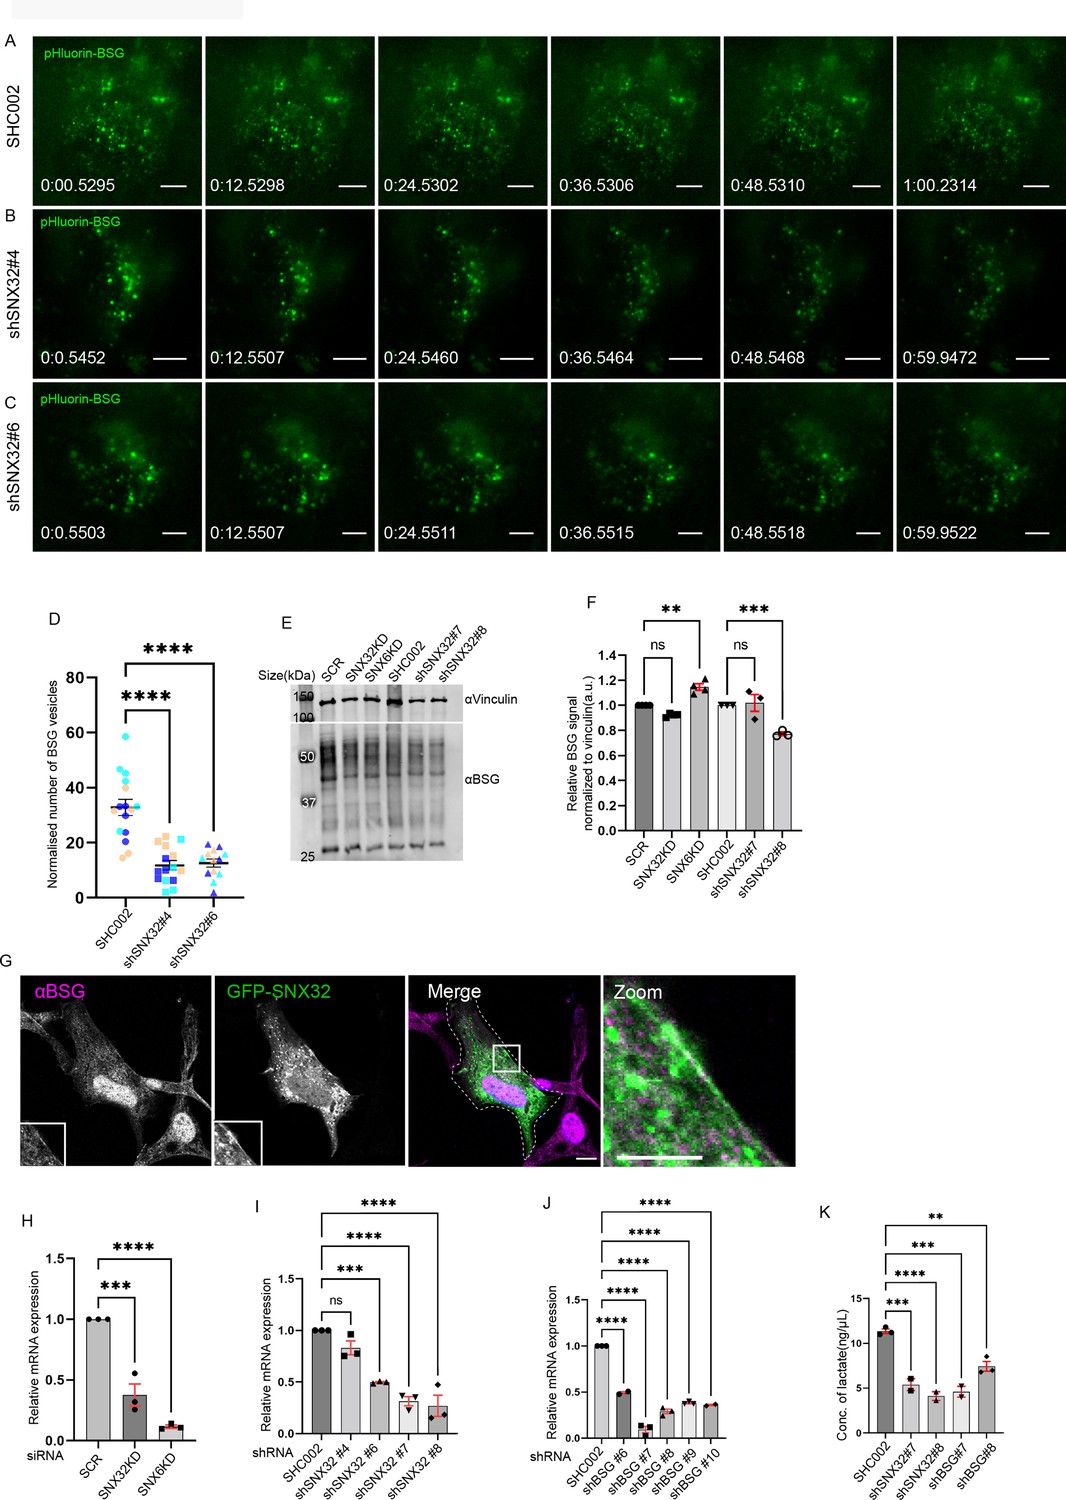
(A–C) Snapshots from live TIRF microscopic imaging of Neuro2a cells stably expressing pHluorin BSG transfected with (A) SHC002 or SNX32 shRNA clones (B) shSNX32#4, and (C) shSNX32#6 followed by doxycycline treatment for pHluorin BSG induction. Scale bar 10 μm. (D) Quantification of the surface population of the number of BSG vesicles (N = 3, n ≥ 8 cells per independent experiments), represented as a SuperPlot20, prepared by superimposing summary statistics from repeated experiments on a graph of the individual measurements per cell. The samples per experiment are represented by color-coding the dots and the mean from each experiment is plotted as an error bar on top of the many smaller dots that denote individual measurements. The error bar is applied on the mean from each individual experiment, p-value<0.0001 (****p<0.0001), ordinary one-way ANOVA Dunnett’s multiple-comparisons tests. (E) U87MG cells were transfected with scramble/SNX32/SNX6 siRNA or shc002, shSNX32#4, shSNX32#6 shRNA followed by cycloheximide treatment of 10 μg/ml for 6 hr, immunoblotting was done using BSG or vinculin antibody (representative immunoblot out of three biological replicates). (F) Quantification of relative BSG signal normalized to vinculin (loading control), data represent mean ± SEM (N = 3) p-value<0.0001 (**p<0.01, ***p<0.001) one-way ANOVA Šídák’s multiple-comparisons test. (G) U87MG cells showing membrane colocalization of GFP SNX32 and endogenous BSG. Scale bar 10 μm, inset 5 μm (magnified regions are shown as insets, inset of the merge is magnified and represented as zoom). (H) Quantification of relative mRNA expression of SNX32 and SNX6 in U87MG cells treated with respective SMART Pool siRNAs (N = 3), p-value<0.0001 (***p<0.001, ****p<0.0001), ordinary one-way ANOVA Dunnett’s multiple-comparisons tests. (I, J) Relative mRNA expression of U87MG cells transfected with (I) SNX32 shRNA clones, p-value<0.0001. (J) BSG shRNA clones, p-value<0.0001, SMART pool siRNAs (N = 3, values are means ± SEM, ***p<0.001, ****p<0.0001, ns, nonsignificant), ordinary one-way ANOVA Dunnett’s multiple-comparisons tests. (K) Quantification of concentration of lactate in the culture supernatant of U87MG cells transfected with scrambled (SHC002)/SNX32 shRNA clones (shSNX32#4, shSNX32#6)/ BSG shRNA clones (shBSG#7, shBSG#8), N = 2, p-value<0.0001 (**p<0.01, ***p<0.001, ****p<0.0001), ordinary one-way ANOVA Dunnett’s multiple-comparisons test.
-
Figure 9—figure supplement 1—source data 1
U87MG cells were transfected with scramble/SNX32/SNX6 siRNA or shc002, shSNX32#4, shSNX32#6 shRNA followed by cycloheximide treatment of 10 µg/ml for 6 hr.
Immunoblotting was done using BSG or vinculin antibody. Immunoblot source data of three biological replicates.
- https://cdn.elifesciences.org/articles/84396/elife-84396-fig9-figsupp1-data1-v2.zip
Figure 10
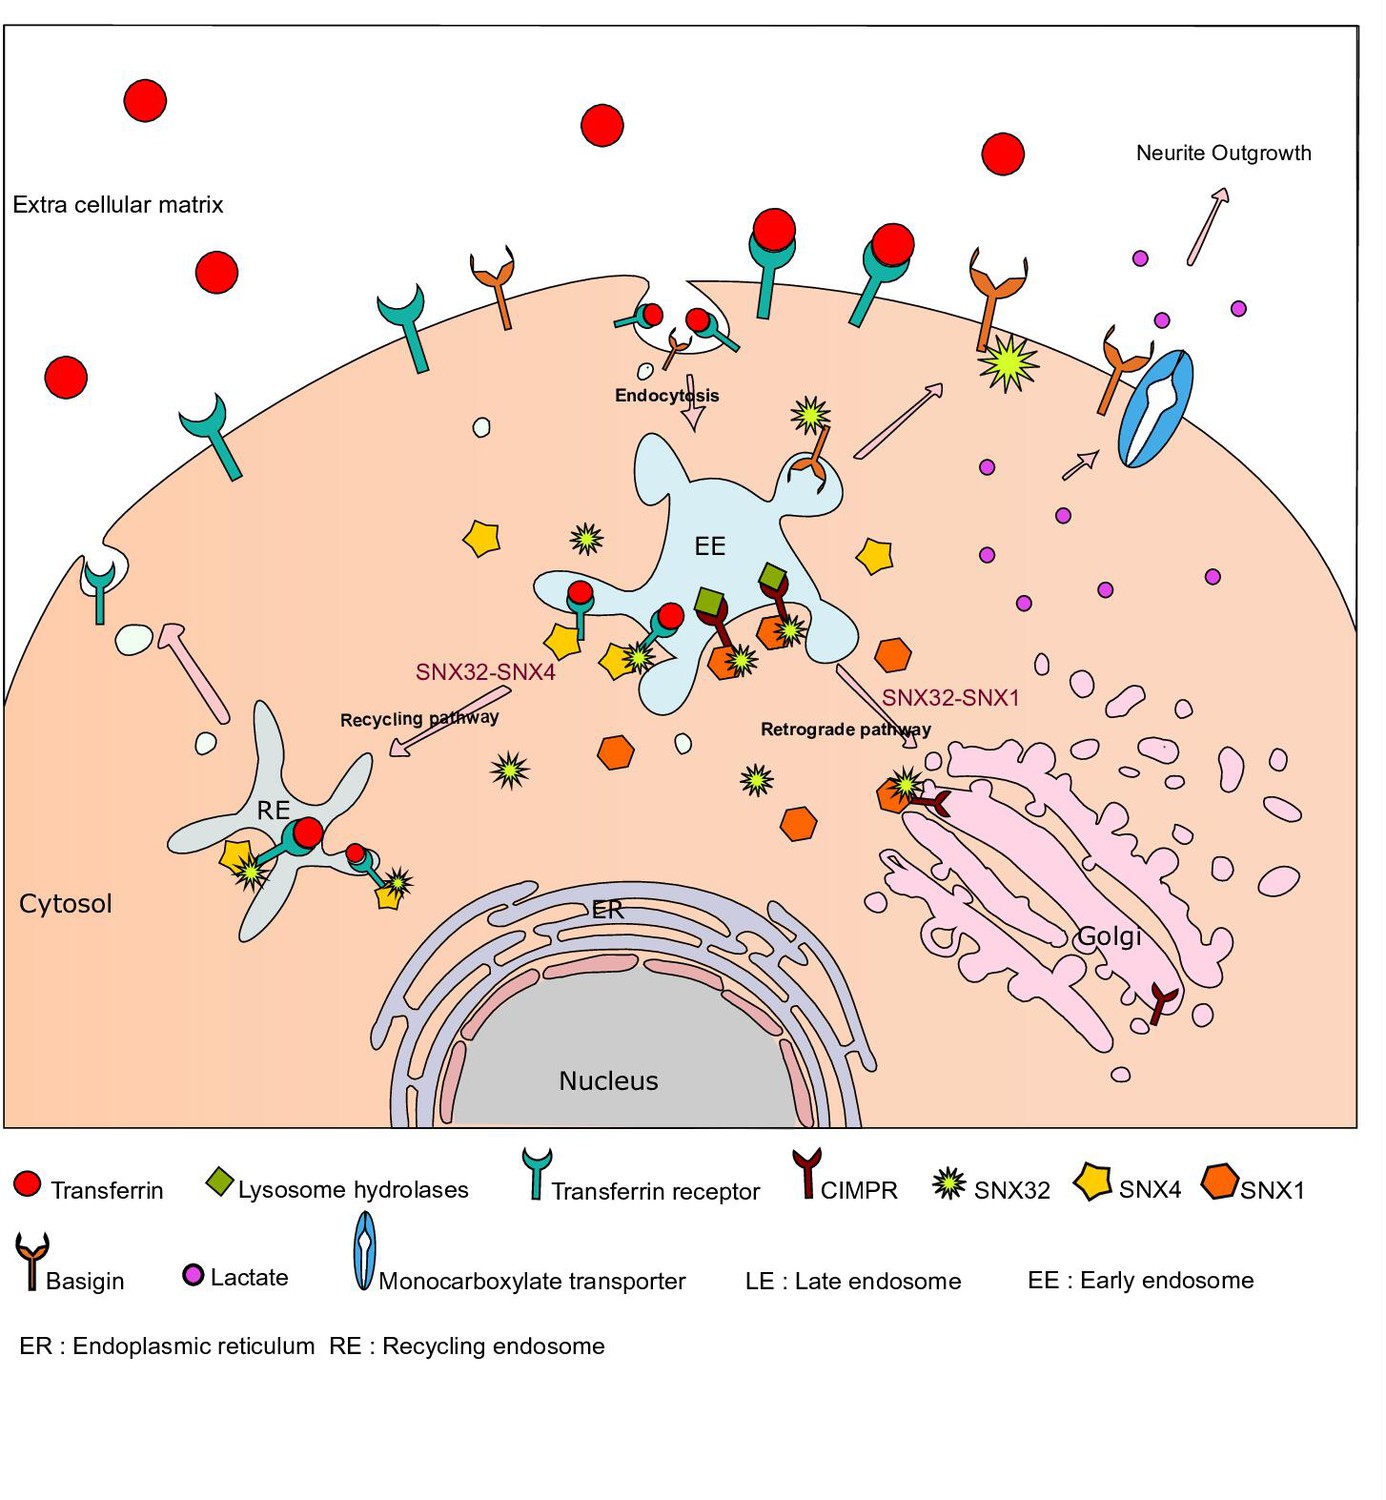
Graphical abstract showing SNX32’s multifaceted role in trafficking and neuroglial coordination.
SNX32 through its BAR domain associate with SNX4, co-traffic TfR from early endosome to recycling endosomes. Similarly, SNX32 interacts with SNX1, co-traffic CIMPR from early endosome to TGN. Further, the proposed role of SNX32 contributing to the endosome to surface trafficking of BSG. BSG being the co-chaperone of monocarboxylate transporter (MCT) 20, 26, 54 helps in the surface localization of MCTs. In conclusion, the derailing of SNX32-mediated BSG trafficking reduces the surface population of BSG as well as MCTs, disrupting the neuroglial coordination and manifests as neurite differentiation defect in cellulo. The model depicts the diverse cargo trafficking route in which SNX32 functions, and a glimpse of complexity introduced by means of its ability to participate into distinct protein complexes.
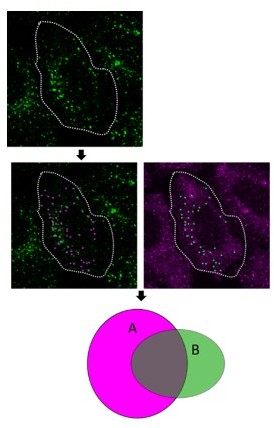
Author response image 1
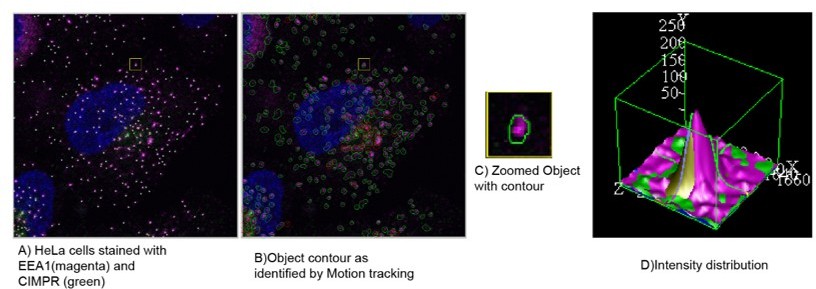
(A) HeLa cells stained with EEA1(magenta) and CIMPR (green), identified as objects by motion tracking and (B) their associated contour. (C) Inset is showing the magnified boxed region with one object. (D) The representative intensity distribution of this object as analysed by motion tracking. Further, the colocalisation in such a condition is calculated by analysing the total area overlap between the individual object.
Author response image 2
Videos
Video 1
On the left: live-cell imaging showing transient contact between SNX32 vesicles and Rab11-labeled recycling endosomes.
HeLa cells co-transfected with plasmids encoding mCherry-SNX32 (magenta) and GFP-Rab11 (green). Videos were captured in free run mode, without intervals in Olympus FV3000 confocal laser-scanning microscope at 37°C,5% CO2 with moisture control. ZDC-Z Drift compensation was used to correct focus drift during time courses. Frames were collected every 6.44 s for 9 min 58 s. Playback rate is 3 frames/s. The transient contact events are indicated by white arrowheads. On the right: live-cell imaging showing transient contact between SNX32 vesicles and GOLPH3-labeled Golgi compartment: HeLa cells stably expressing GFP-GOLPH3 (green) were transfected with plasmid encoding mCherry-SNX32 (magenta). Videos were captured in free run mode, without intervals in Olympus FV3000 confocal laser-scanning microscope at 37°C,5% CO2 with moisture control. ZDC-Z Drift compensation was used to correct focus drift during time courses. Frames were collected every 12.24 s for 9 min 59 s. The transient contact events are indicated by white arrowheads.
Video 2
SNX32 colocalize with Rab11-positive recycling endosomes.
3D-reconstructed SIM movie (Nikon N-SIM S) of HeLa cell showing colocalization of mCherry-Rab11-positive recycling endosomes (red) and GFP-SNX32 (green). A total of 26 Z planes of 0.25 µm step size was captured. For each Z plane and each wavelength, 15 images were captured (three different angle and five different phases) Scale bar 10 μm.
Video 3
SNX32 vesicles colocalize with GOLPH3-positive Golgi compartment.
3D-reconstructed SIM movie (Nikon N-SIM S) of HeLa cell showing colocalization of GFP-GOLPH 3 (green)-positive Golgi compartment and mCherry-SNX32 (red). A total of 28 Z planes of 0.30 µm step size was captured. For each Z plane and each wavelength, 15 images were captured (three different angles and five different phases),Scale bar 10 μm.
Video 4
On the left: SNX32, SNX4 co-traffic transferrin.
HeLa cells co-transfected with plasmids encoding mCherry-SNX32 (magenta) and GFP-SNX4 (green) were allowed to uptake Alexa 647-labeled transferrin (blue) for 2 min. Videos were captured in free run mode, without intervals in Olympus FV3000 confocal laser-scanning microscope at 37°C,5% CO2 with moisture control. ZDC-Z Drift compensation was used to correct focus drift during time courses. Frames were collected every 9.58 s for 4 min 47 s. Playback rate is 2 frames/s. The co-trafficking events are indicated by white arrowheads.On the right: SNX32, SNX1 co-traffic CD8-CIMPR: HeLa cells co-transfected with plasmids encoding mCherry-SNX1 (magenta) and GFP-SNX32 (green) and CD8-CIMPR (blue) were processed as detailed in the ‘Materials and methods’ section. Videos were captured in free run mode, without intervals in Olympus FV3000 confocal laser-scanning microscope at 37°C,5% CO2 with moisture control. ZDC-Z Drift compensation was used to correct focus drift during time courses. Frames were collected every 6.520 s for 4 min 49 s. Playback rate is 3 frames/s. The co-trafficking events are indicated by white arrowheads.
Video 5
SNX32 depletion hinders neurite outgrowth and network formation.
Neuro2a cells were transfected with scrambled/SNX32/SNX6 siRNA SMART pools. Following 24 hr of transfection, the medium was replaced with MEM containing 1% fetal bovine serum supplemented with 10 μmol/l retinoic acid (RA) to induce neurite outgrowth. Frames were captured every 1 min for 48 hr using a ×4 objective and a CMOS camera utilizing incubator-compatible JuLIBr Live cell analyzer. Playback rate 24 frames/s.
Video 6
SNX32 depletion phenocopies the neurite outgrowth defect observed in BSG downregulated condition.
Neuro2a cells were transfected with SHC002/shSNX32 (#4,#6)/shBSG clones (#7,#8). Following 6 hr (shRNA) of transfection, the medium was replaced with MEM containing 1% fetal bovine serum supplemented with 10 μmol/l retinoic acid (RA) to induce neurite outgrowth. Frames were captured every 1 min for a maximum of 48 hr using a ×4 objective and a CMOS camera utilizing incubator-compatible JuLIBr Live cell analyzer. Playback rate 24 frames/s.
Video 7
shRNA-resistant SNX32, shSNX32#4r overexpression could rescue the neurite outgrowth defect observed in BSG downregulated condition.
Neuro2a cells stably transfected with pLVXshSNX32#4r were transfected with shSNX32#4. Following 6 hr (shRNA) of transfection, the medium was replaced with MEM containing 1% fetal bovine serum supplemented with 10 μmol/l retinoic acid (RA) to induce neurite outgrowth. Frames were captured every 15 min for a maximum of 48 hr using a ×4 objective and a CMOS camera utilizing incubator-compatible JuLIBr Live cell analyzer. Playback rate 3 frames/s.
Video 8
Surface population of pHluorin BSG is reduced in SNX32-deficit condition.
Neuro2a cells stably expressing TET-inducible pHluorin BSG were transfected with scrambled/SNX32/SNX6 siRNA SMART pools for a maximum of 72 hr. 13 hr prior to imaging the cells were induced with doxycycline for pHluorin BSG induction. Frames were collected every 3.3 s for 1 min. Playback rate is 3 frames/s.
Video 9
Surface population of pHluorin BSG is reduced in SNX32-deficit condition.
Neuro2a cells stably expressing TET-inducible pHluorin BSG were transfected with SHC002/SNX32(#4, #6) shRNA clones for a maximum of 42 hr. 13 hr prior to imaging, the cells were induced with doxycycline for pHluorin BSG induction. Frames were collected every 3.3 s for 1 min. Playback rate is 3 frames/s.
Video 10
SNX32 co-traffic with BSG.
Neuro2a cells stably expressing cMyc-BSG (magenta) were co-transfected with plasmid encoding and GFP-SNX32 (green) was processed as detailed in the ‘Materials and methods’ section. Videos were captured in free run mode, without intervals in Olympus FV3000 confocal laser-scanning microscope at 37°C,5% CO2 with moisture control. ZDC-Z Drift compensation was used to correct focus drift during time courses. Frames were collected every 6.4 s for 4 min 49 s. Playback rate is 3 frames/s. The co-trafficking events are indicated by white arrowheads.
Additional files
-
Supplementary file 1
Sequence details of the primers, siRNA/shRNAs, used in the study.
Sheet 1: the primer sequences used to carry out RT PCR, Sheet 2: the sequence details of the shRNA clones used in the study, Sheet 3: the siRNA sequences and product details.
- https://cdn.elifesciences.org/articles/84396/elife-84396-supp1-v2.xlsx
-
MDAR checklist
- https://cdn.elifesciences.org/articles/84396/elife-84396-mdarchecklist1-v2.docx
-
Source data 1
- https://cdn.elifesciences.org/articles/84396/elife-84396-data1-v2.pdf
-
Source data 2
- https://cdn.elifesciences.org/articles/84396/elife-84396-data2-v2.pdf
Download links
A two-part list of links to download the article, or parts of the article, in various formats.
Downloads (link to download the article as PDF)
Open citations (links to open the citations from this article in various online reference manager services)
Cite this article (links to download the citations from this article in formats compatible with various reference manager tools)
Insights into cargo sorting by SNX32 and its role in neurite outgrowth
eLife 12:e84396.
https://doi.org/10.7554/eLife.84396


