Resting mitochondrial complex I from Drosophila melanogaster adopts a helix-locked state
- Department of Molecular and Cellular Biology, University of California, Davis, United States
- Department of Physiology and Cellular Biophysics, Columbia University Irving Medical Center, United States
- The Robert N. Butler Columbia Aging Center, Columbia University Irving Medical Center, United States
Figures
Figure 1 with 7 supplements
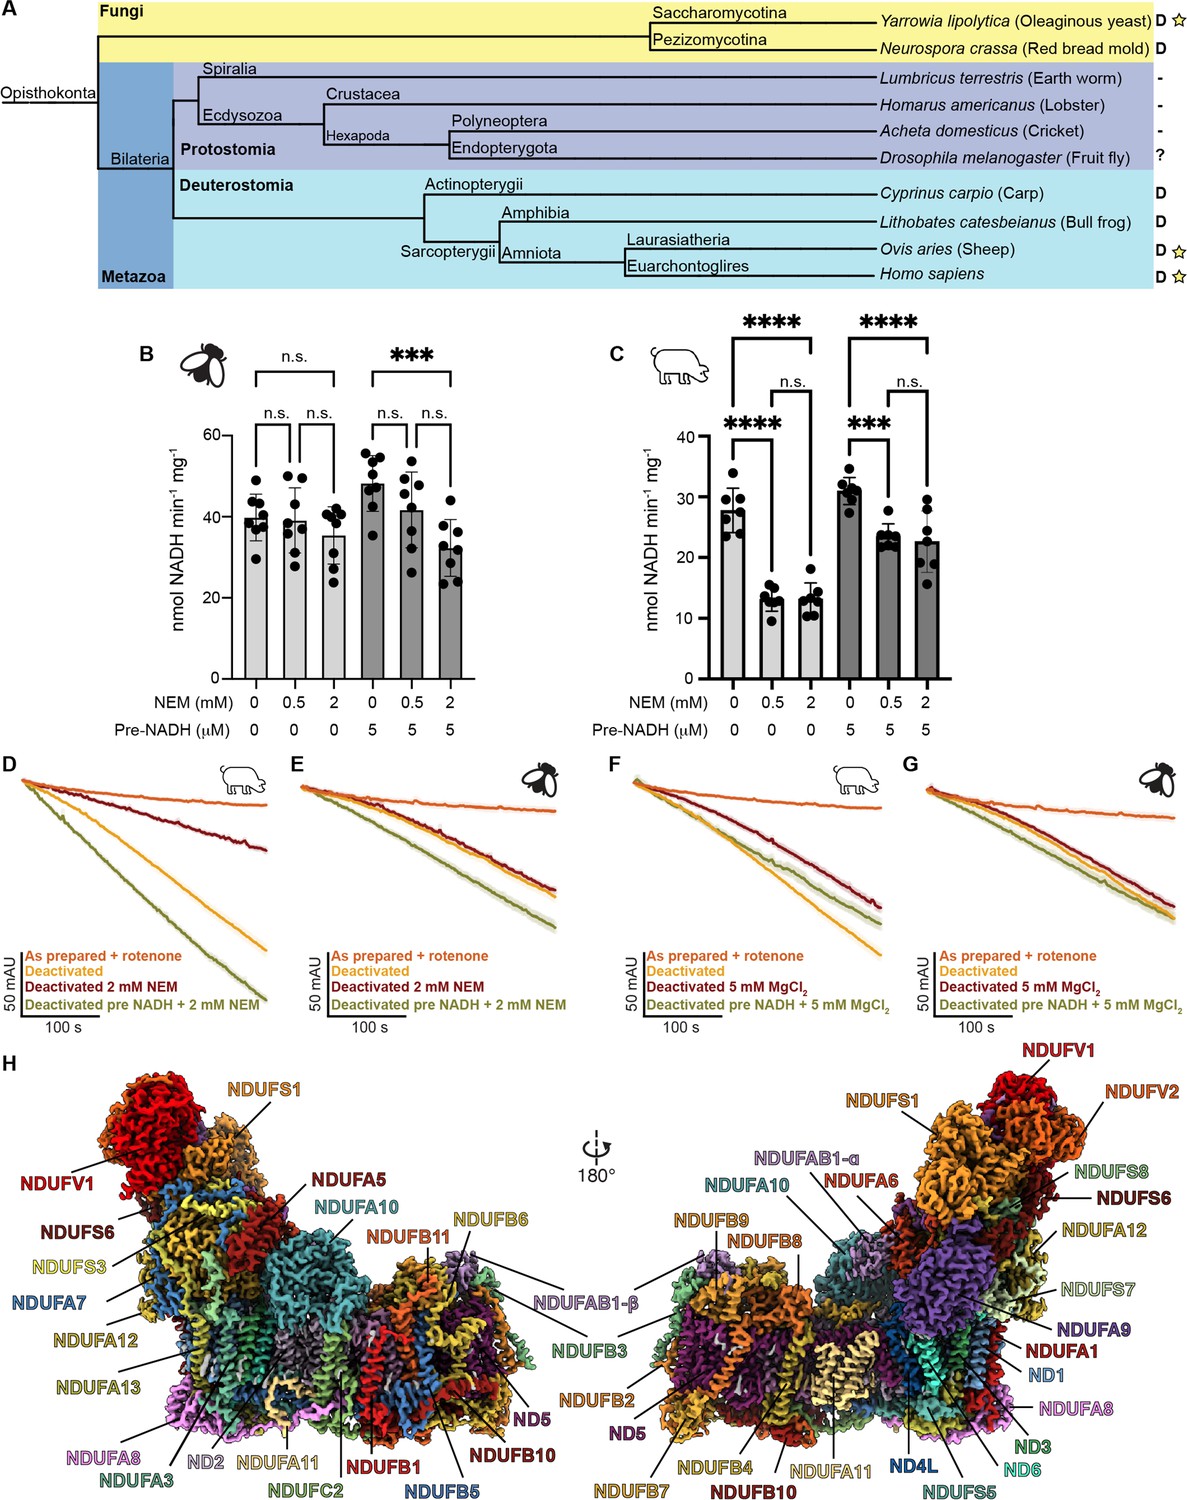
Evolution, biochemical characterization, and structure of D. melanogaster mitochondrial CI.
(A) Dendrogram showing biochemically characterized CI from Opisthokonts. Distinct groups are highlighted with Fungi in yellow and metazoans in blue (Protostomia in dark blue and Deuterostomia in cyan). ‘D’ indicates the presence of a NEM-sensitive deactive state in the CI of the species. A minus sign indicates the absence of a NEM-sensitive deactive state in the CI of the species. A question mark indicates that the species has not been biochemically characterized for the presence of the deactive state. A star indicates that structures of CI from that species are currently available. (B, C) Functional characterization of A-to-D transition in isolated mitochondrial membranes of D. melanogaster (B) and S. scrofa (C) by spectroscopic measurement of NADH dehydrogenase activity at 340 nm in the presence of the indicated concentrations of N-ethylmaleimide (NEM) and pre-activation with 5 μM NADH or water. Individual values, average, and SEM are shown, n=7–8. Statistical analysis with ANOVA with Šídák’s multiple comparisons tests. **p<0.01; ****p<0.0001; n.s. denotes not significant. (D–G) Time courses of NADH oxidation reveal an off-pathway resting state in Dm-CI. NADH oxidation was measured by the change in absorbance at 340 nm of deactivated CI in mitochondrial membranes with or without pre-activation with 5 µM NADH. (D) S. scrofa with or without 2 mM NEM (n=3–4). (E) D. melanogaster with or without 2 mM NEM (n=3–5). (F) S. scrofa with or without 5 mM MgCl2 (n=3). (G) D. melanogaster with or without 5 mM MgCl2 (n=3–4). The average time course is plotted for each condition with standard error for each timepoint shown as the shaded boundary. (H) Cryo-EM reconstruction of Dm-CI colored by subunit.
Figure 1—figure supplement 1
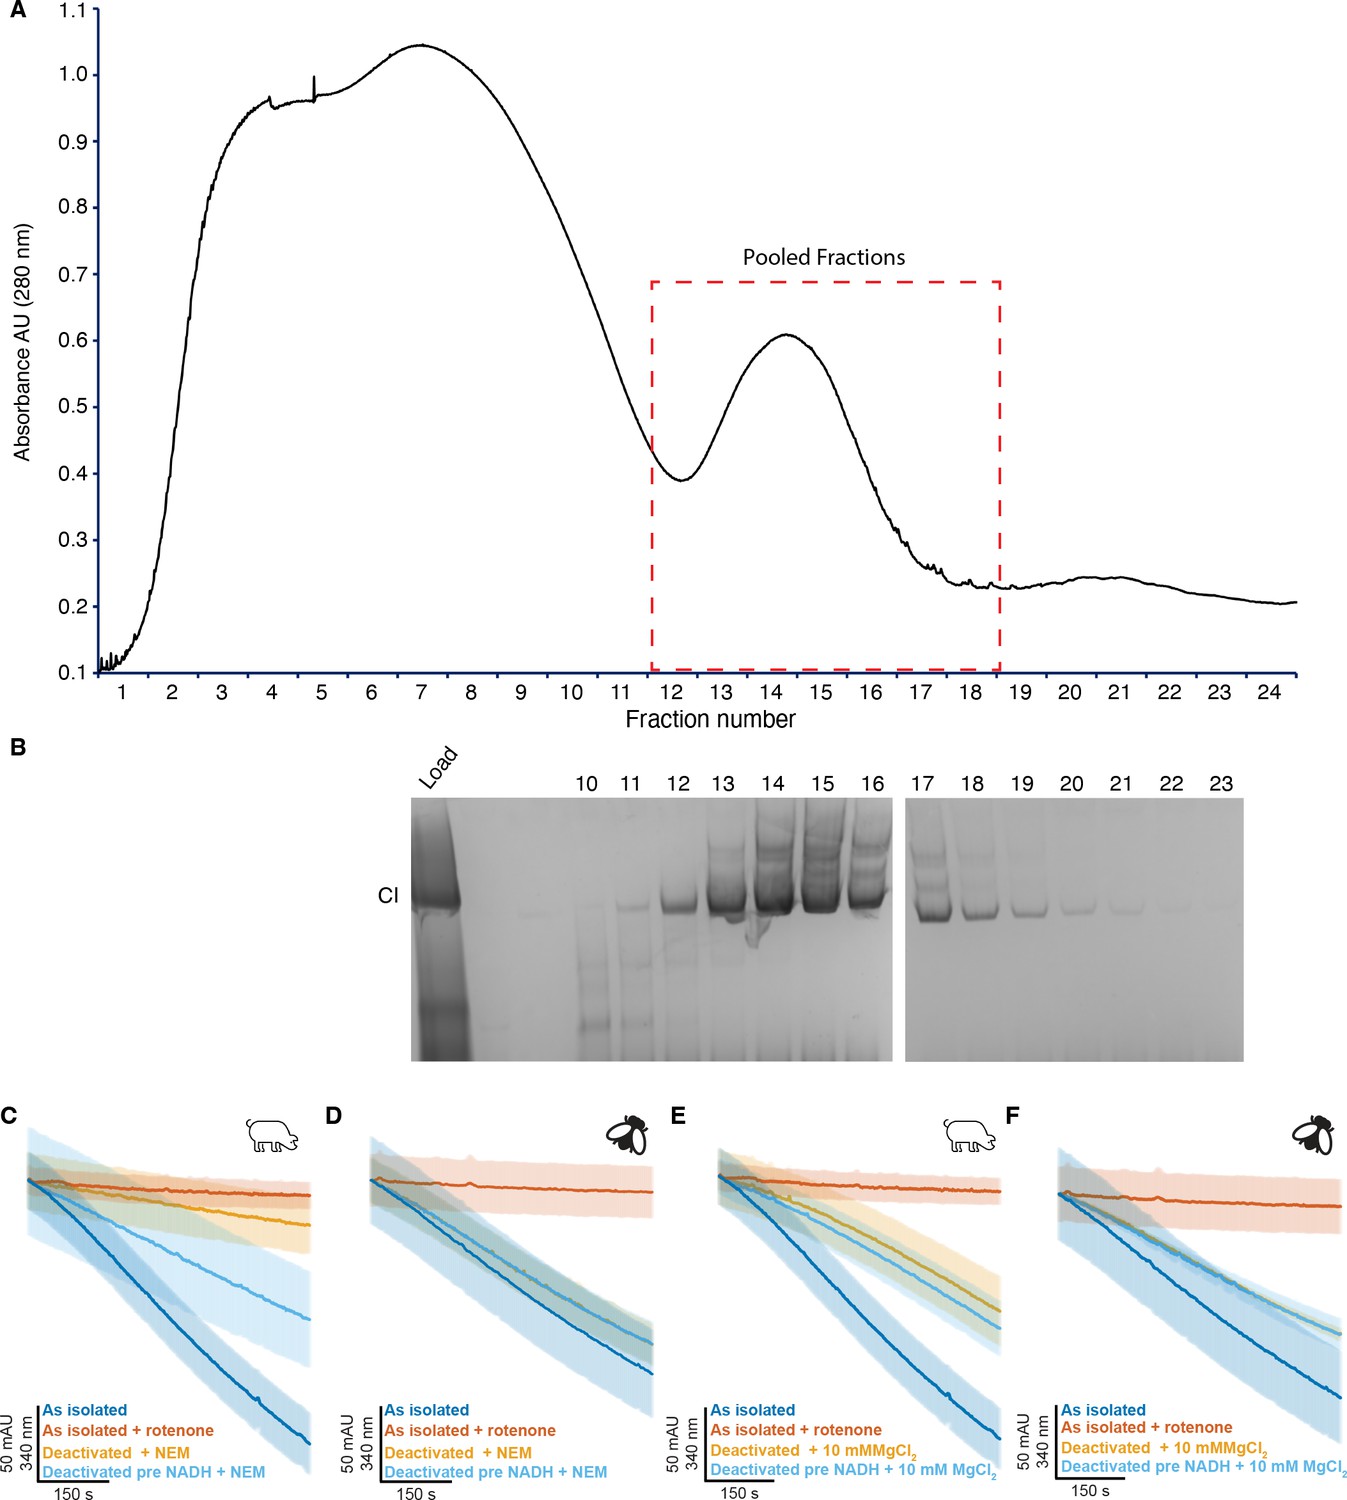
Isolation and characterization of detergent solubilized CI from D. melanogaster thoracic mitochondria.
(A) Representative chromatogram of two sucrose gradient fractionations of digitonin-extracted and amphopol A8-35-exchanged D. melanogaster mitochondrial complexes. The sucrose gradient profile of Dm-CI purified in glyco-diosgenin (GDN), without exchange into A8-35 looked similar. (B) Blue-native PAGE (BN-PAGE) of fractions from (A) visualized by CI in gel activity staining. (C–F) Representative traces of A-to-D transition of partially purified detergent extracted deactivated CI samples with or without pre-activation with 5 µM NADH. (C) S. scrofa treated with 2 mM NEM (n=4–5), (D) D. melanogaster treated with 2 mM NEM (n=4), (E) S. scrofa treated with 10 mM MgCl2 (n=3–5), and (F) D. melanogaster treated with 10 mM MgCl2 (n=3–4). The average time course is plotted for each condition with standard error for each timepoint shown as the shaded boundary.
-
Figure 1—figure supplement 1—source data 1
Source data for Blue-native PAGE (BN-PAGE) of fractions from (Figure 1—figure supplement 1A) visualized by CI in gel activity staining.
- https://cdn.elifesciences.org/articles/84415/elife-84415-fig1-figsupp1-data1-v1.zip
Figure 1—figure supplement 2
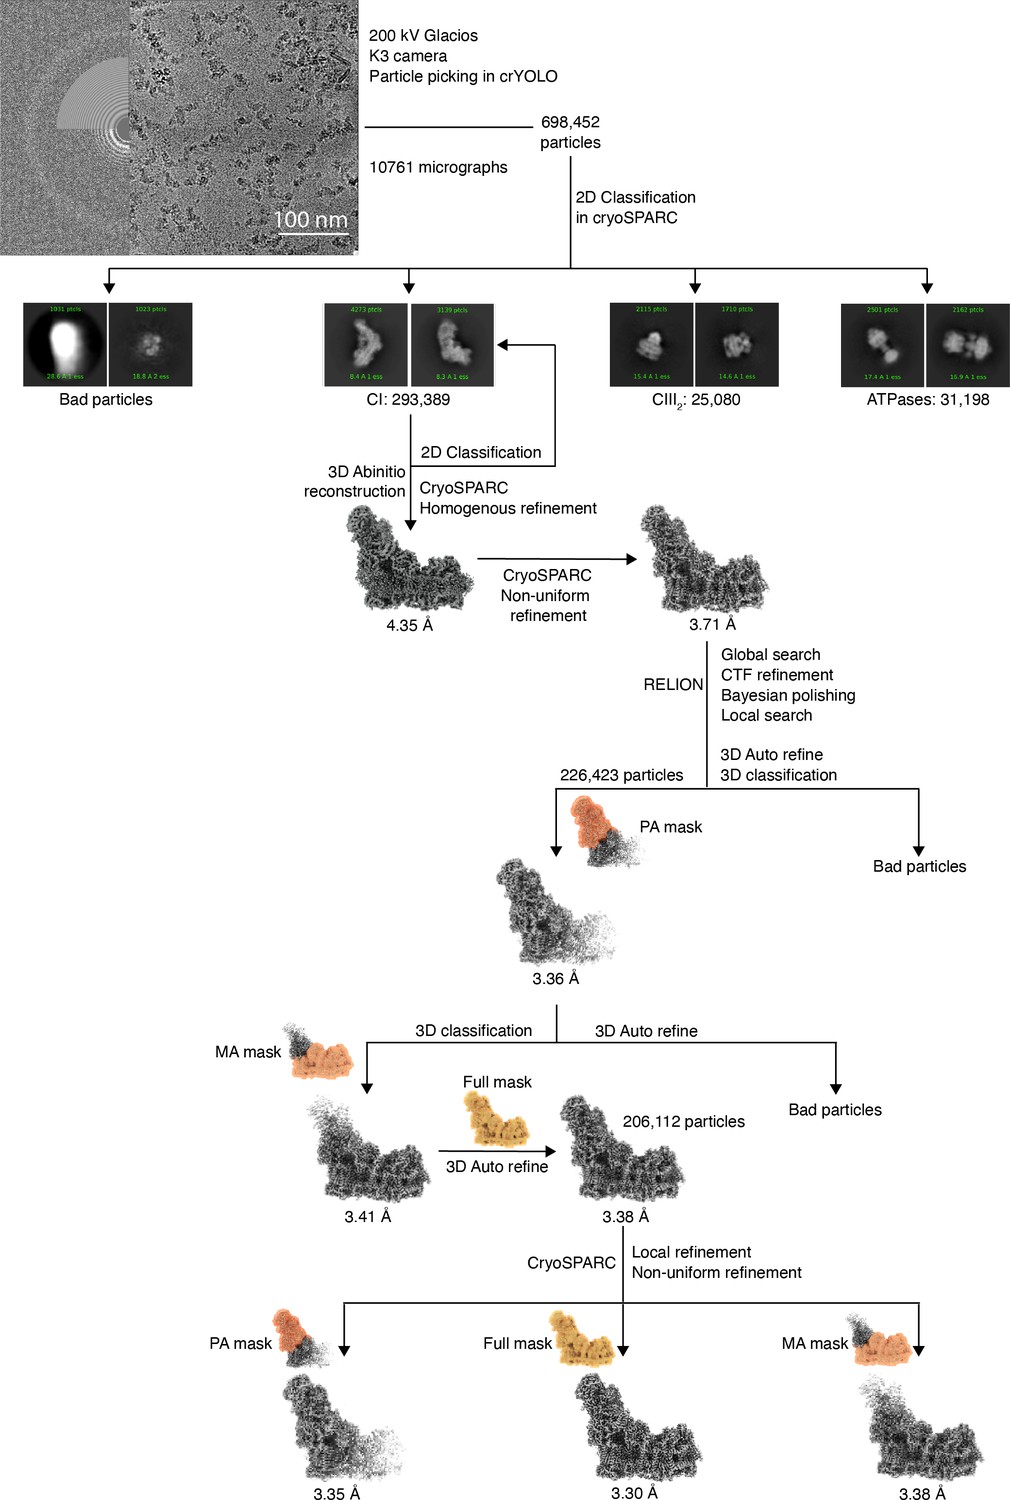
Cryogenic electron microscopy (CryoEM) image processing and refinement.
A total of 10,761, movies were collected on a 200 kV Glacios microscope with K3 detector, from which 698,452 particles were initially picked using CrYOLO (Wagner et al., 2019). In CryoSPARC (Punjani et al., 2017), 2D classification revealed classes corresponding to CI, CIII2, and ATPase. After further particle classification via 3D ab initio reconstruction, a total of 293,389 Dm-CI particles were obtained. Homogenous refinement followed by non-uniform refinement (Punjani et al., 2020) resulted in an initial map of 3.7 Å. Further refinement with global and local CTF corrections and Bayesian polishing in RELION Zivanov et al., 2020; Zivanov et al., 2019 followed by local refinement using masks around the Dm-CI peripheral arm, membrane arm, and full mask in CryoSPARC, resulted in a final map of 3.3 Å.
Figure 1—figure supplement 3

Overall structure of Dm-CI.
(A) Dm-CI’s 14 core subunits are in colored surface; accessory subunits are shown as gray cartoons. (B) Dm-CI’s 29 accessory subunits are in colored surface; 14 core subunits are shown as gray cartoon. The subunits are colored as in Figure 1.
Figure 1—figure supplement 4
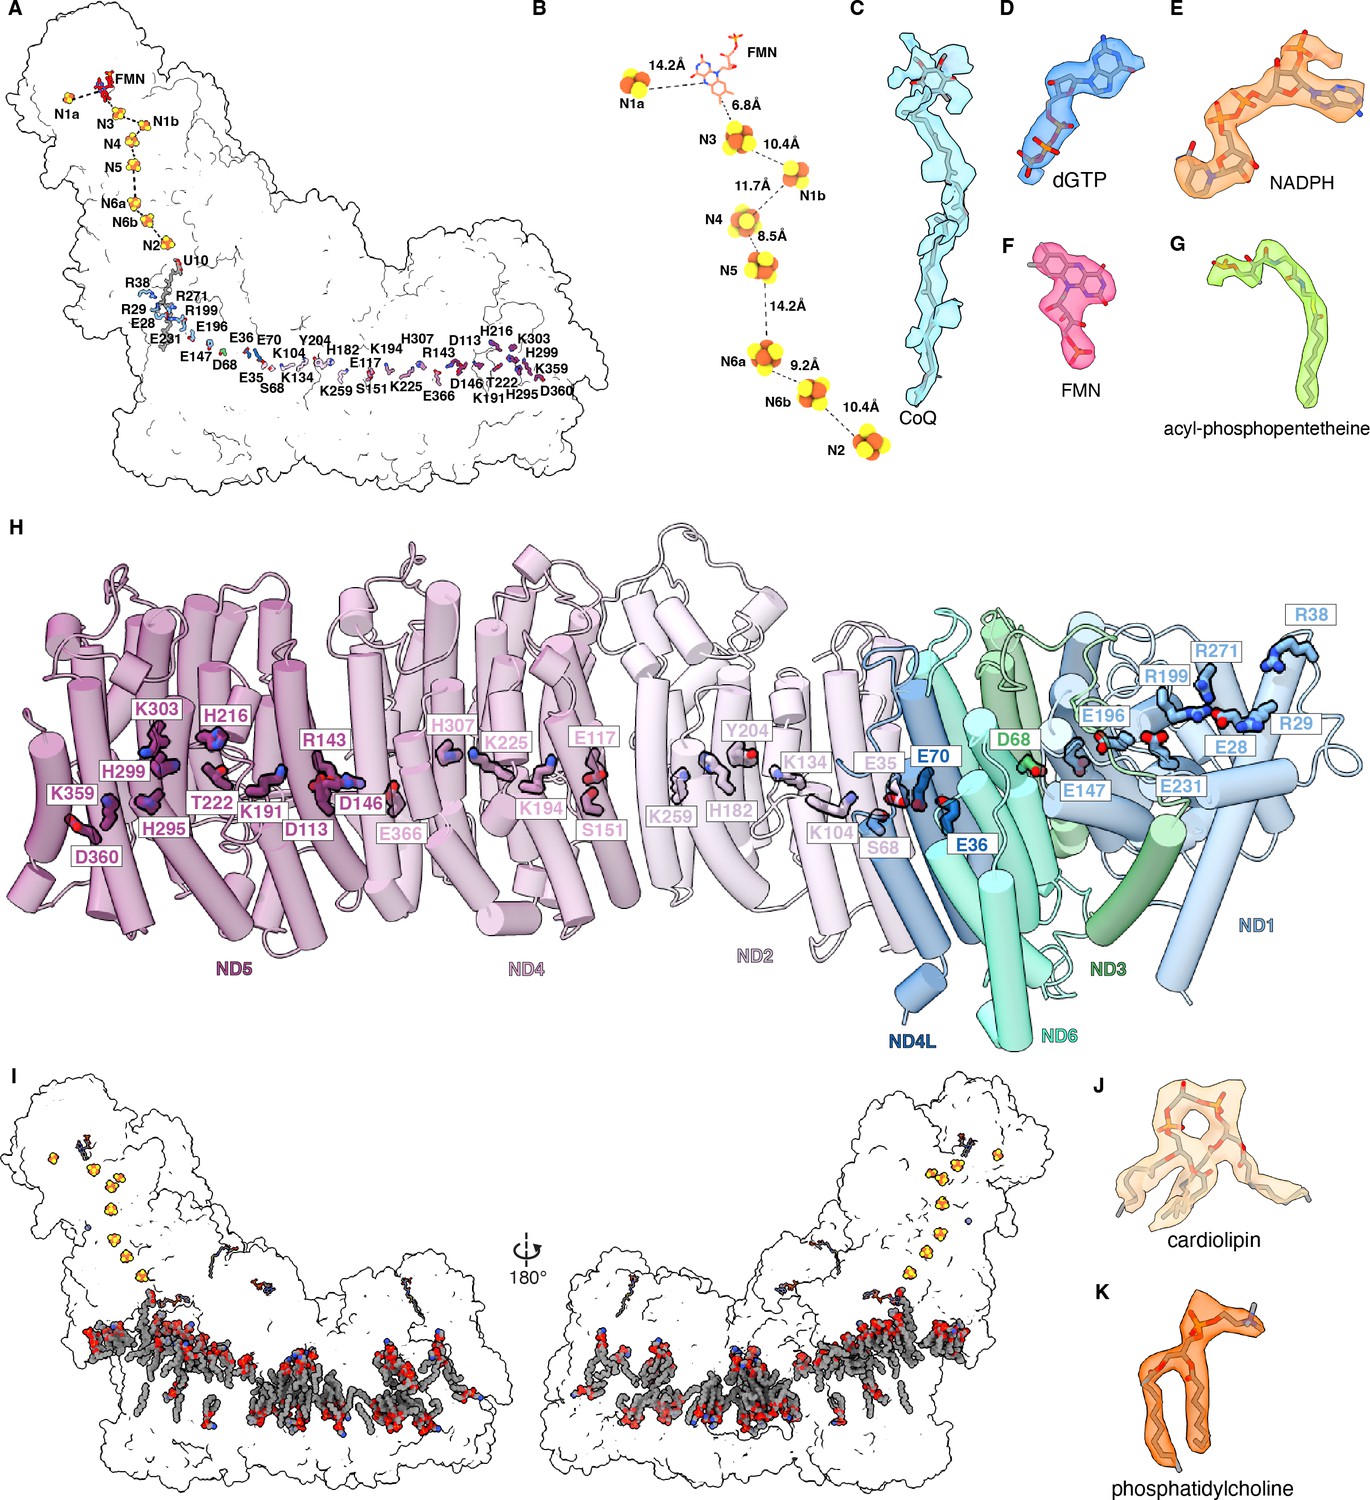
Dm-CI electron transfer pathway, co-factors, and hydrophilic axis.
(A) The electron transfer pathway and the conserved hydrophilic axis are shown on a transparent surface of the overall structure. (B) The redox cofactors of the electron transfer pathway of Dm-CI are shown. The FES clusters are shown as spheres colored by the element. The dashed lines indicate the edge-to-edge distances. (C-G) Density of Dm-CI co-factors: ubiquinone (CoQ), 2′-deoxyguanosine-5′-triphosphate (dGTP) in NDUFA10, NADPH in NDUFA9, flavin mononucleotide (FMN) in NDUFV1, and acyl-phosphopantetheine in NDUFAB1-α, respectively. (H) The hydrophilic axis along the membrane arm of Dm-CI is show. Core subunits that form the membrane arm are shown as cylinders, colored as in Figure 1. The conserved residues that constitute the hydrophilic axis are shown in stick colored by subunit. (I) The distribution of lipids is shown. (J, K) Representative density of lipids cardiolipin (CDL) (J) 1,2-diacyl-SN-glycero-3-phosphocholine (PC1) (K).
Figure 1—figure supplement 5
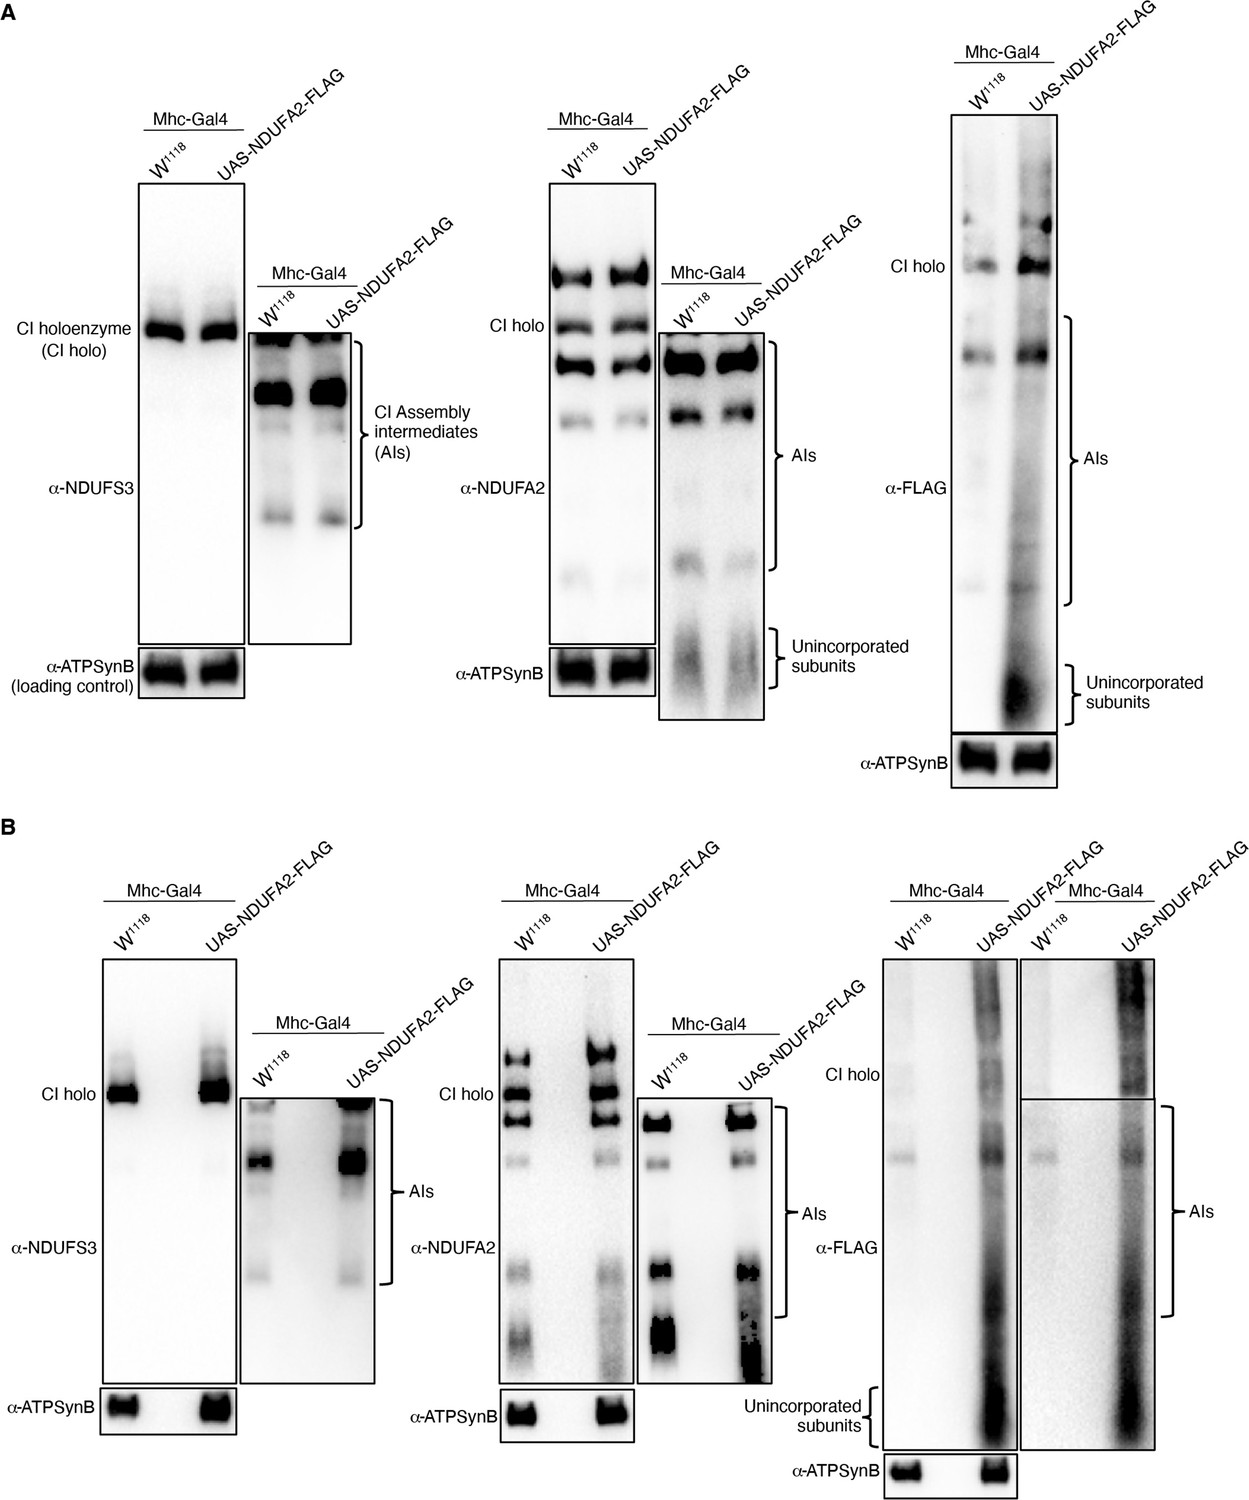
Detection of NDUFA2 by Western blotting.
(A, B) Mitochondrial preparations from thoraces of two-day-old flies with the genotypes indicated were analyzed by BN-PAGE, followed by Western blotting with the antibodies shown. Panels A and B are biological replicates.
-
Figure 1—figure supplement 5—source data 1
Source data for mitochondrial preparations from thoraces of 2-day-old flies with the genotypes indicated were analyzed by BN-PAGE, followed by Western blotting with the antibodies shown.
Panels A and B are biological replicates.
- https://cdn.elifesciences.org/articles/84415/elife-84415-fig1-figsupp5-data1-v1.zip
Figure 1—figure supplement 6
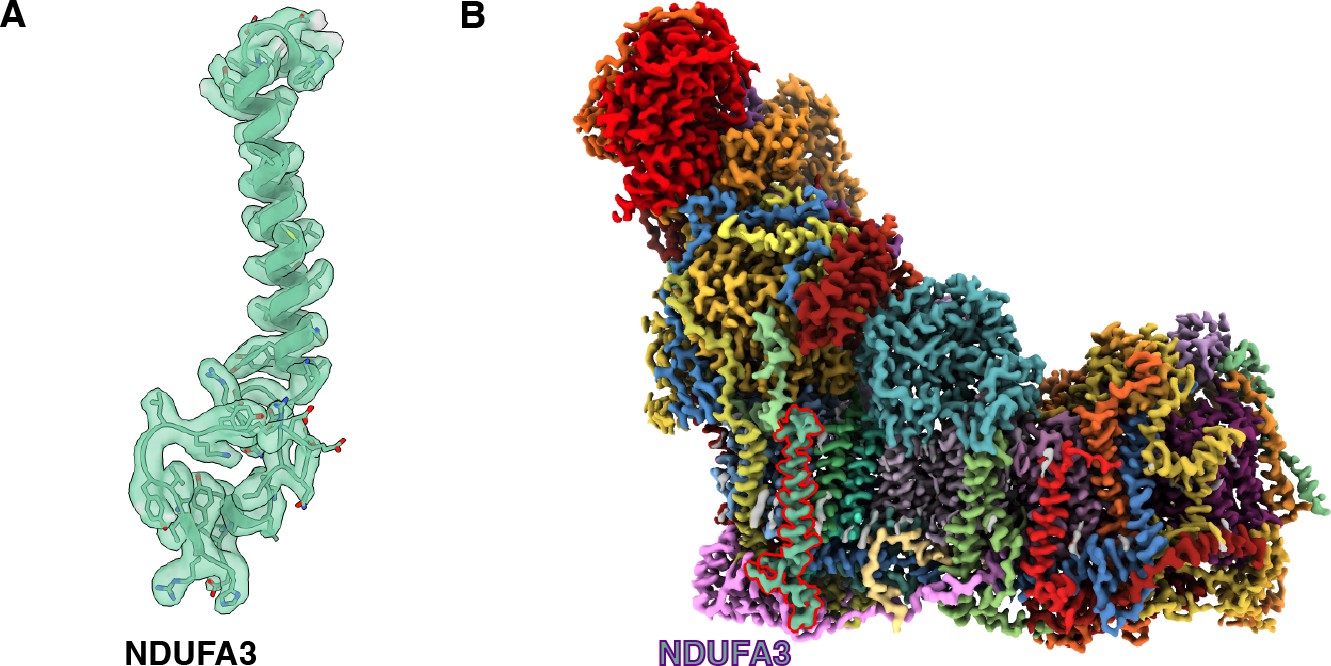
NDUFA3 of Dm-CI.
(A) Newly identified NDUFA3 of Dm-CI is shown as a cartoon embedded in the colored density. (B) The position of NDUFA3 density as identified in the overall Dm-CI is highlighted in red. The cryogenic electron microscopy (CryoEM) map is colored according to the subunits as in Figure 1.
Figure 1—figure supplement 7
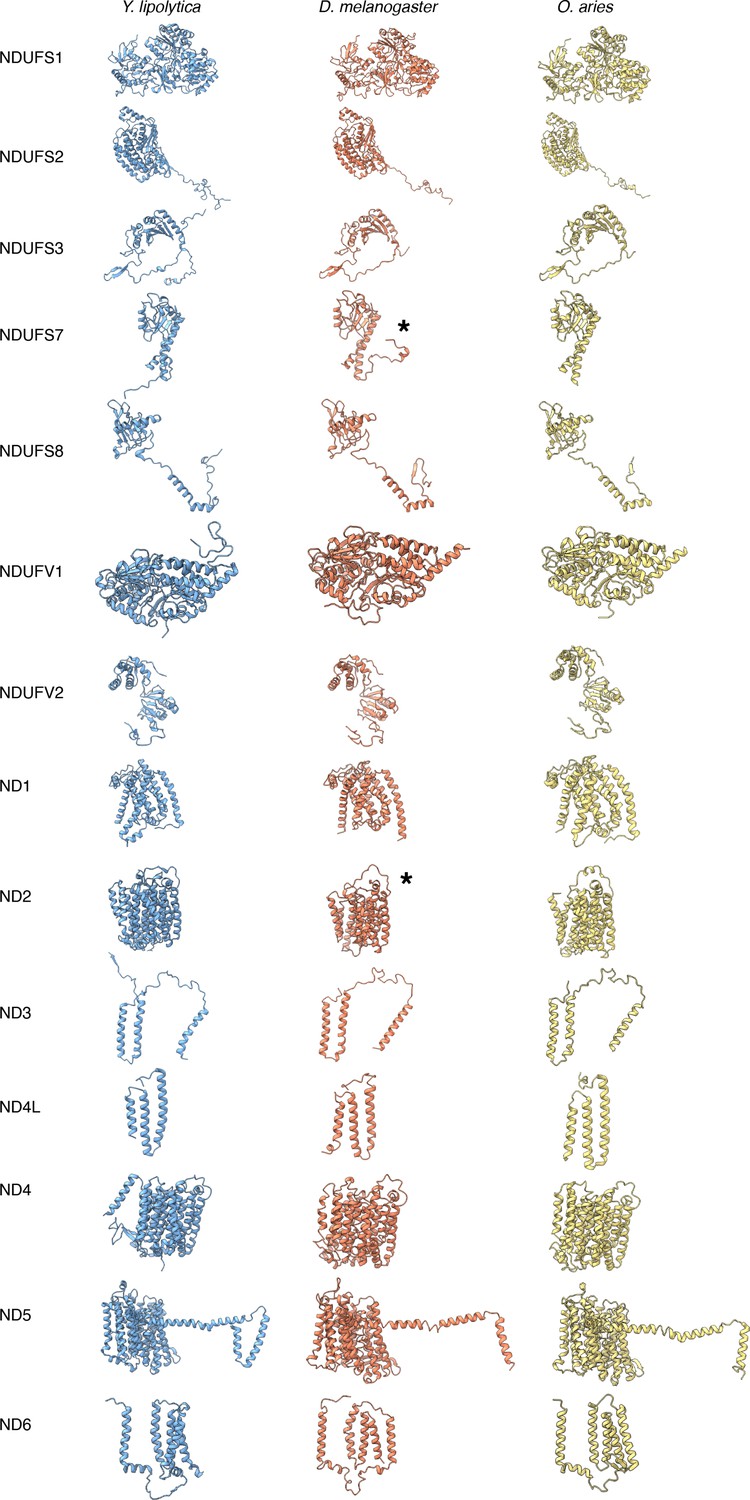
Structural comparison of CI core subunits from Y.lipolytica (PDB: 6RFR), D. melanogaster (this study), and O. aries (PDB:6ZKC).
The subunits are shown as colored cartoons Y. lipolytica (blue), D. melanogaster (orange), and O. aries (yellow).
Figure 2 with 4 supplements
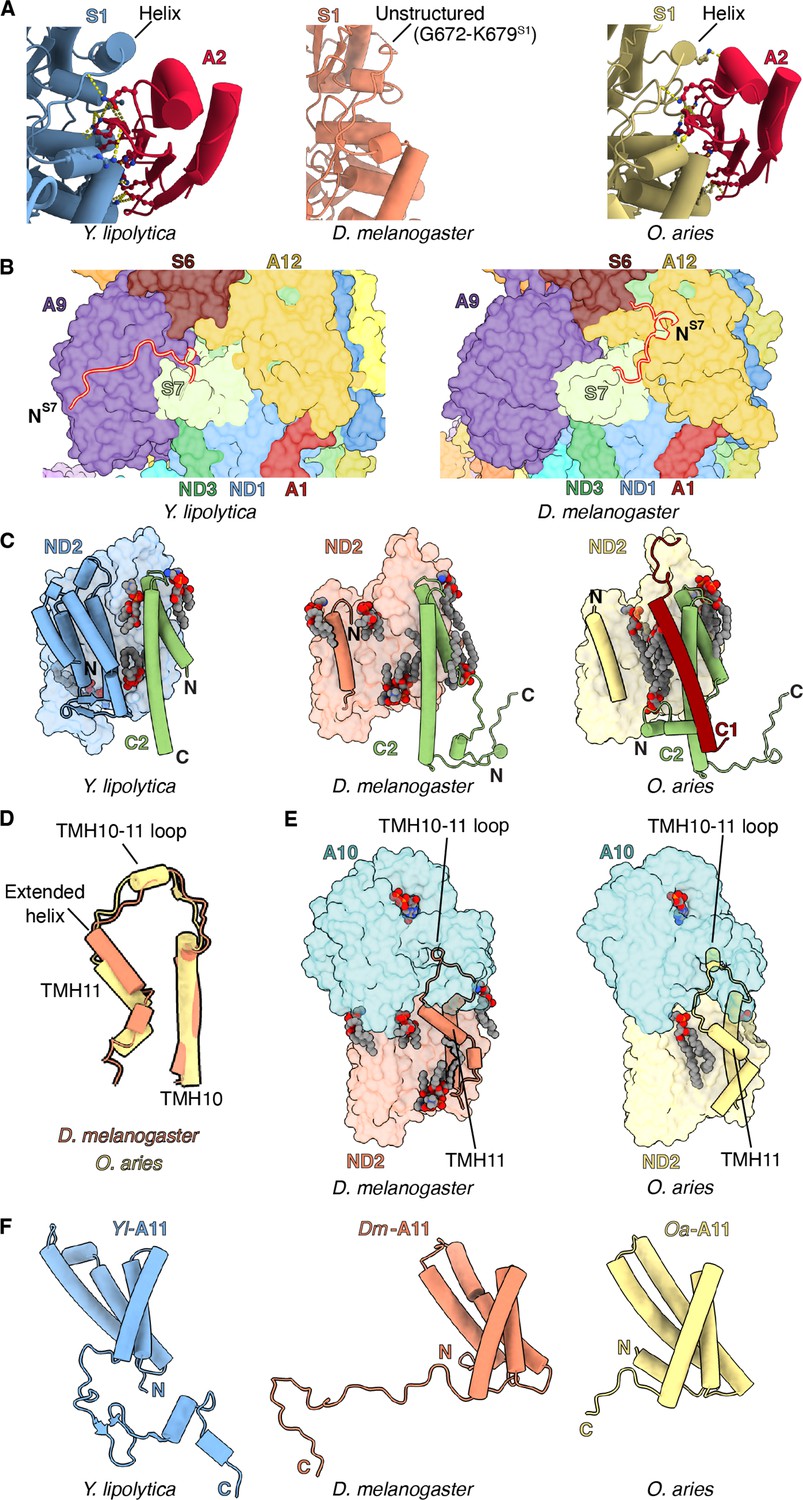
Features of Dm-CI subunits that may impact assembly and stability.
(A) NDUFS1-NDUFA2 interface in Y. lipolytic (PDB: 6YJ4), D. melanogaster (this study), and O. aries (PDB:6ZKC) are shown. (B) The N-terminal extension of NDUFS7 in Y. lipolytica (PDB:6YJ4) and D. melanogaster are shown as cartoons. The other subunits are shown in surface colored as in Figure 1. (C) Y. lipolytic (PDB: 6YJ4), D. melanogaster (this study), and O. aries (PDB:6ZKC) ND2 is shown as surface. The N-terminal helices of ND2 are shown as cartoons. NDUFC2 and NDUFC1 are shown as cartoons. Lipids are shown as spheres colored by element. (D) TMH10ND2, TMH11ND2, and TMH10-11ND2 loop of D. melanogaster and O. aries (PDB:6ZKC) are shown as cartoons. (E) ND2-NDUFA10 interface in D. melanogaster (this study) and O. aries (PDB:6ZKC) is shown. ND2, NDUFA10 are shownas surface. TMH10ND2 TMH11ND2 and TMH10-11ND2 loop are shown as cartoons. Lipids are shown as spheres colored by the element. (F) NDUFA11 in Y. lipolytic (PDB: 6YJ4) (blue), D. melanogaster (this study) (orange), and O. aries (PDB:6ZKC) (yellow) is shown as cartoons.
Figure 2—figure supplement 1

Structural analysis of NDUFS1-NDUFA2 interface.
(A) NDUFS1 region 665–685 of Dm-CI is shown as a cartoon embedded in the cryoEM density. (B) Domain architecture of NDUFS1 in E. coli (PDB: 7NZ1) and T. thermophilus (PDB: 4HEA). (C) Domain architecture of NDUFS1 in Y. lipolytica (PDB: 6YJ4), D. melanogaster (this study), and O. aries (PDB: 6ZKC). (D) Sequence alignment of C-terminal region of NDUFS1 from Y. lipolytica, D. melanogaster, and O. aries. Numbered according to Dm-S1. The unstructured region of Dm-S1 is boxed green. (E) Sequence alignment of NDUFA2 from Y. lipolytica, D. melanogaster, and O. aries. Numbered according to Dm-A2. Cysteines forming the di-sulfide bonds in the oxidized form of NDUFA2 are boxed green.
Figure 2—figure supplement 2
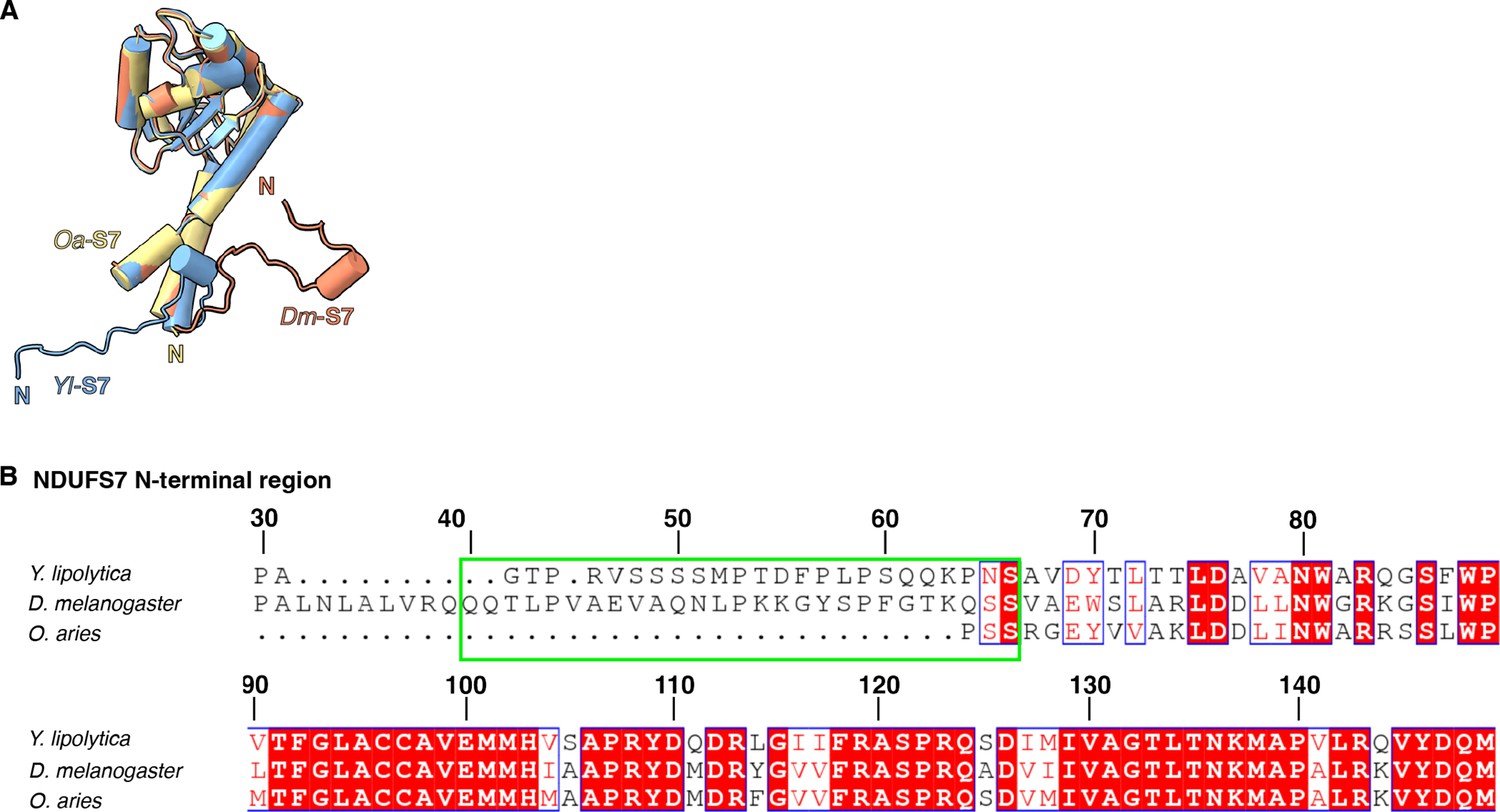
Structural analysis of NDUFS7.
(A) Structural alignment of NDUFS7 from Y. lipolytica (PDB: 6YJ4), D. melanogaster (this study), and O. aries (PDB: 6ZKC) is shown. (B) Sequence alignment of N-terminal region of NDUFS7 from Y. lipolytica, D. melanogaster, and O. aries. Numbered according to Dm-NDUFS7. The sequence in the N terminal extension is boxed green.
Figure 2—figure supplement 3
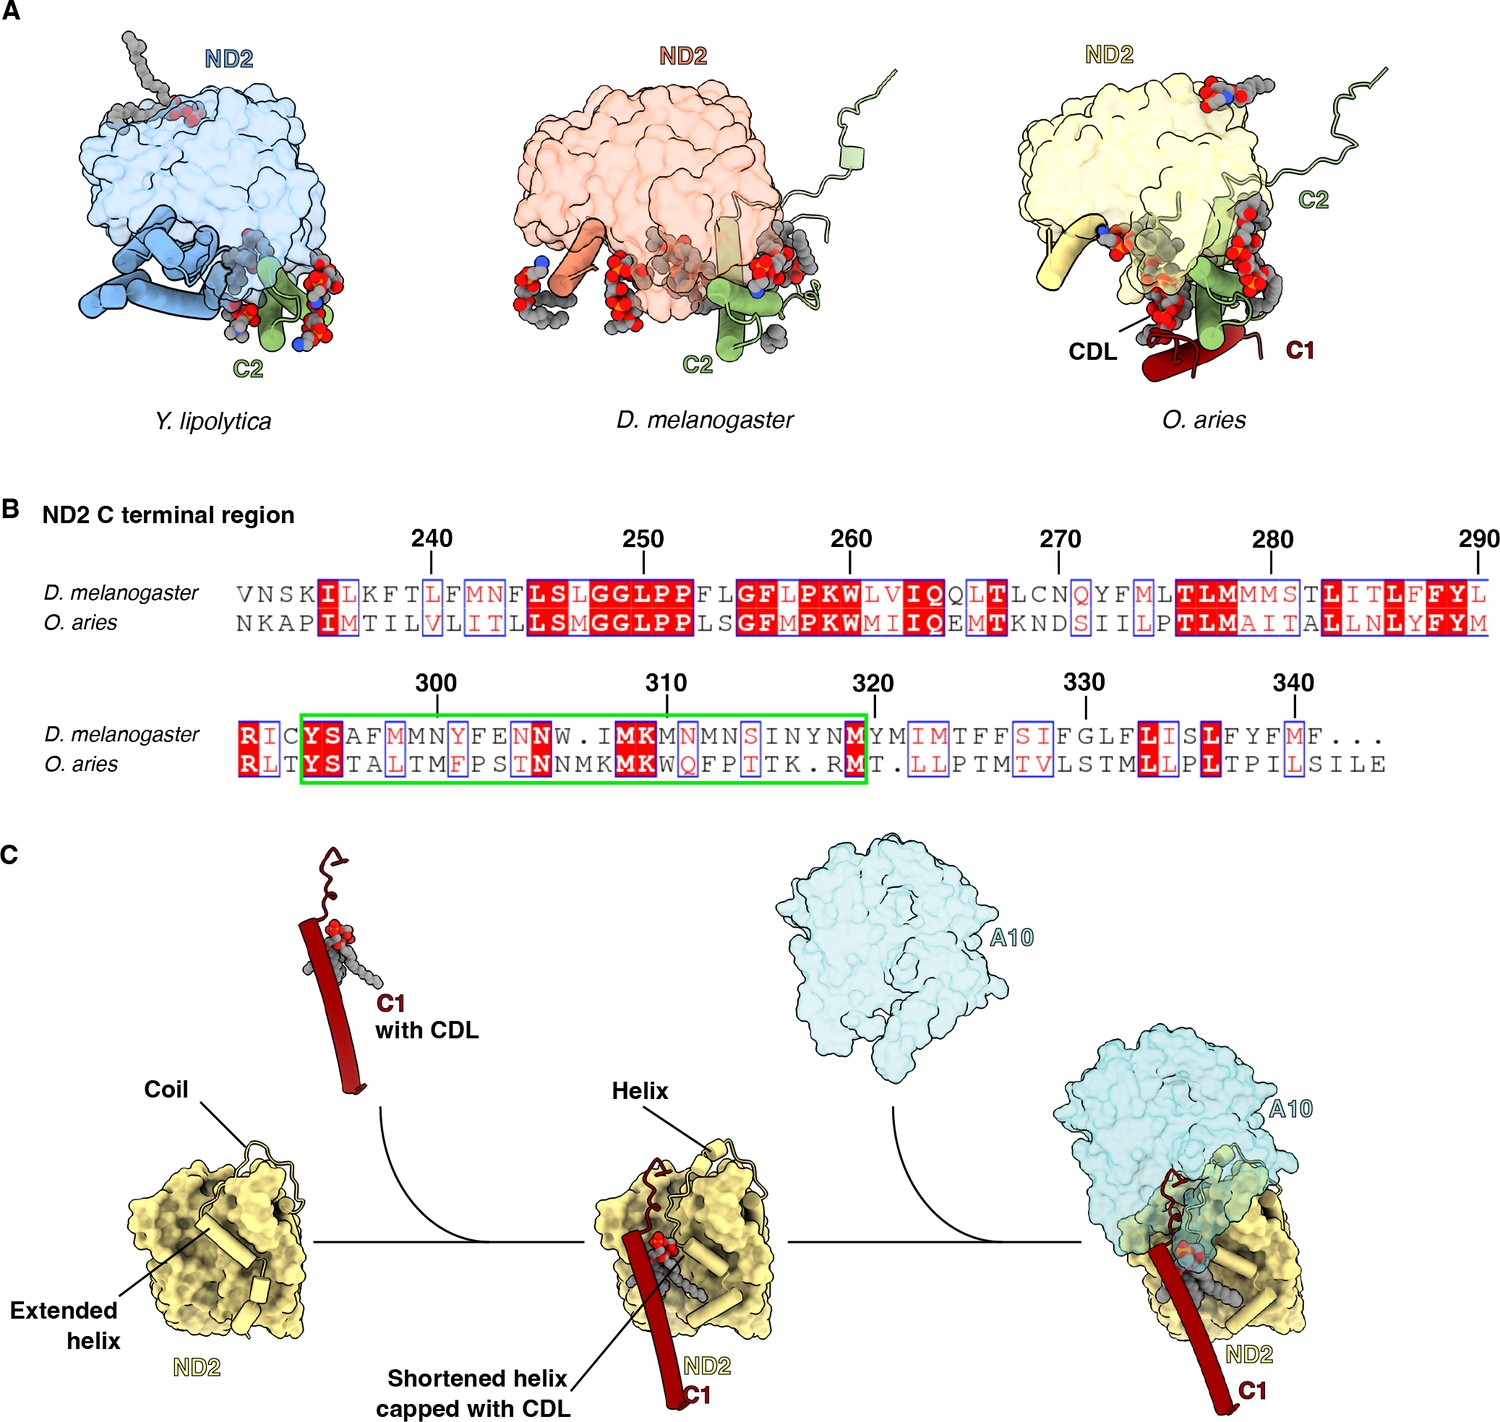
Structural analysis of ND2-NDUFA10 interface.
(A) Y. lipolytic (PDB: 6YJ4), D. melanogaster (this study), and O. aries (PDB:6ZKC) ND2 are shown in surface representation. The N-terminal helices of ND2 are shown as cartoons. NDUFC2 and NDUFC1 are shown as cartoons. Lipids are shown as spheres colored by the element. (B) Sequence alignment of C-terminal region of ND2 from D. melanogaster and O. aries. Numbered according to Dm-ND2. The sequence of TMH10-11 loop region is boxed green. (C) Schematic representation of the role of NDUFC1 in mammalian CI assembly. TMH11ND2 has an extended helix. NDUFC1 brings in a cardiolipin to cap the shortened TMH11ND2, inducing the formation of short helices in the erstwhile coiled TMH10-11ND2 loop. The short helices form the interface for NDUFA10 to bind to complex I. NDUFC2 is not shown for clarity.
Figure 2—figure supplement 4
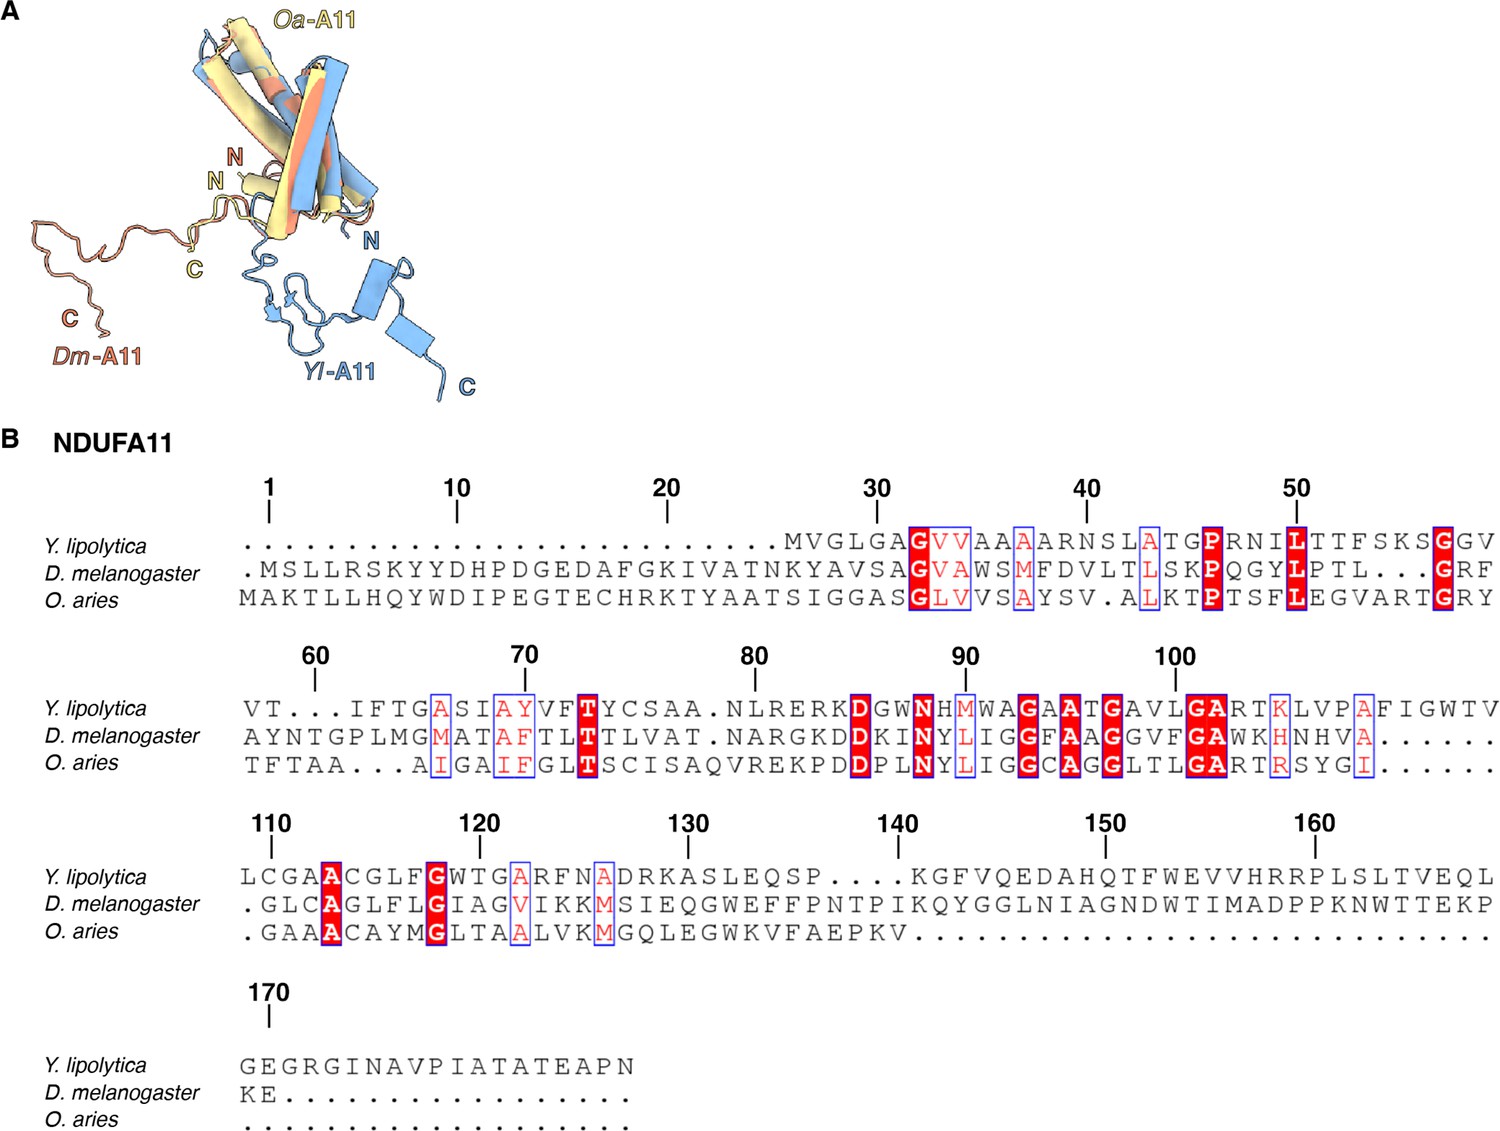
NDUFA11.
(A) Structural alignment of NDUFA11 from Y. lipolytica (PDB: 6YJ4), D. melanogaster (this study), and O. aries (PDB: 6ZKC) is shown. (B) Sequence alignment of NDUFA11 from Y. lipolytica, D. melanogaster, and O. aries. Numbered according to Dm-NDUFA11.
Figure 3 with 5 supplements
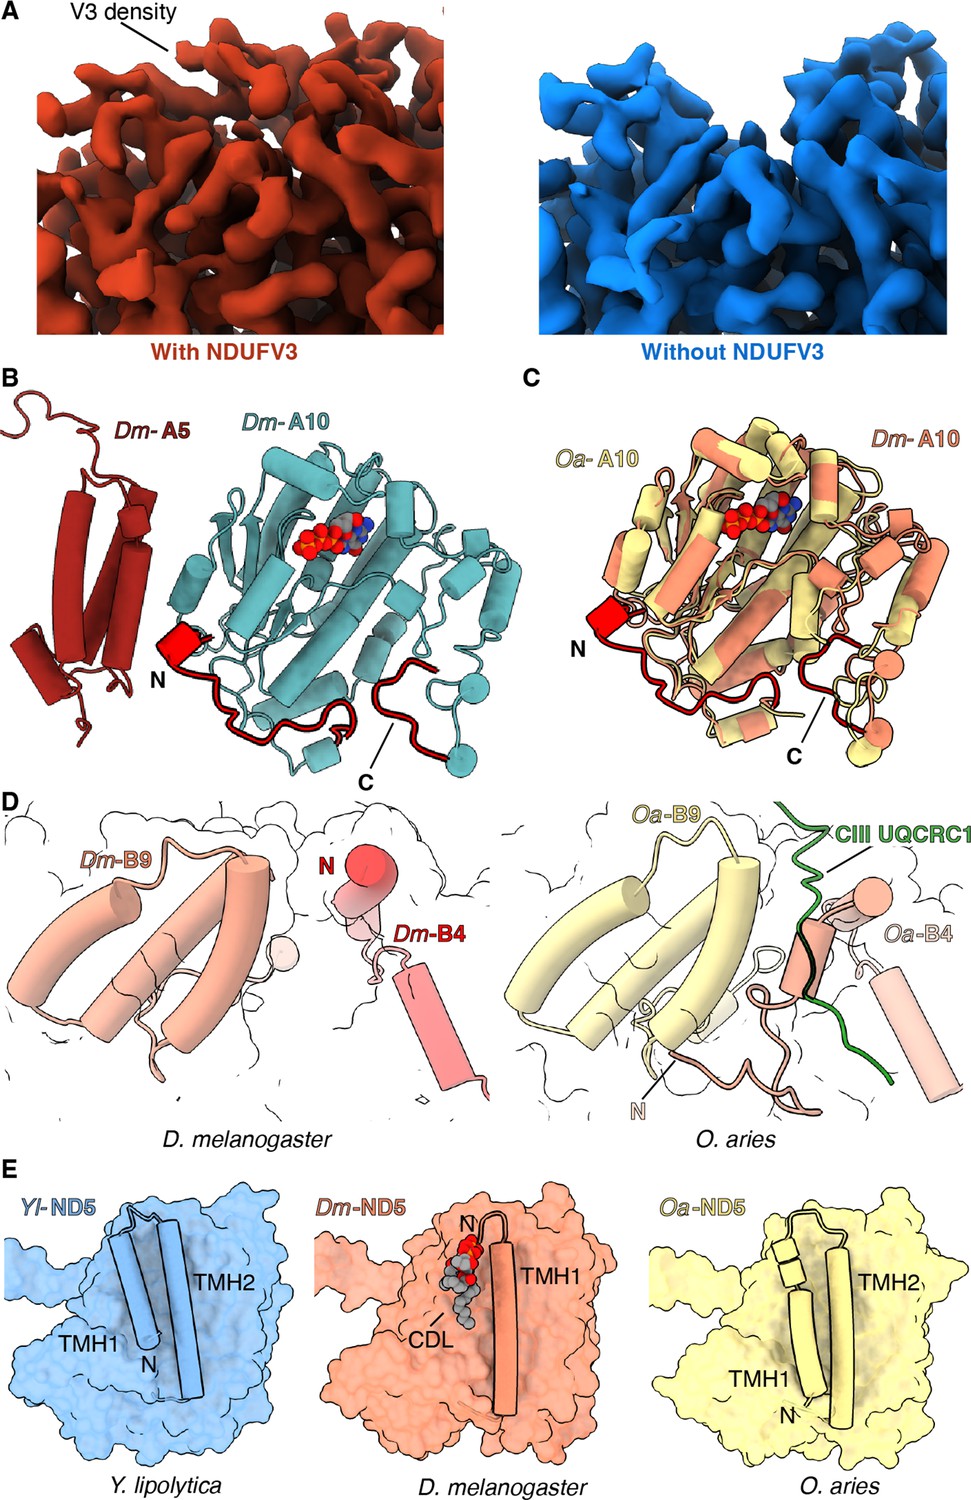
Features of Dm-CI subunits that may impact regulation, SC formation, or lipid binding.
(A) Cryo-EM map with (red) and without (blue) NDUFV3 density is shown. (B) NDUFA10-NDUFA5 interface in Dm-CI is shown. The subunits are shown in cartoons colored as in Figure 1. The N and C terminal extension of Dm-NDUFA10 are colored red. (C) Structural alignment of NDUFA10 from O. aries (yellow) (6ZKC) and D. melanogaster (orange) is shown. The N and C-terminal extensions of Dm-NDUFA10 are shown in red. (D) N-terminal region of NDUFB4 and NDUFB9 in D. melanogaster (this study) and O. aries (PDB:6QC3) is shown as cartoons. Loop region of Oa-CIII subunit UQCRC1 forming interface with Oa-CI subunit is shown as cartoon colored in green. (E) ND5 in Y. lipolytic (PDB: 6YJ4), D. melanogaster (this study) and O. aries (PDB:6ZKC) is shown as surface. The N-terminal helices of ND5 are shown as cartoons. Lipids are shown as spheres colored by the element.
Figure 3—figure supplement 1
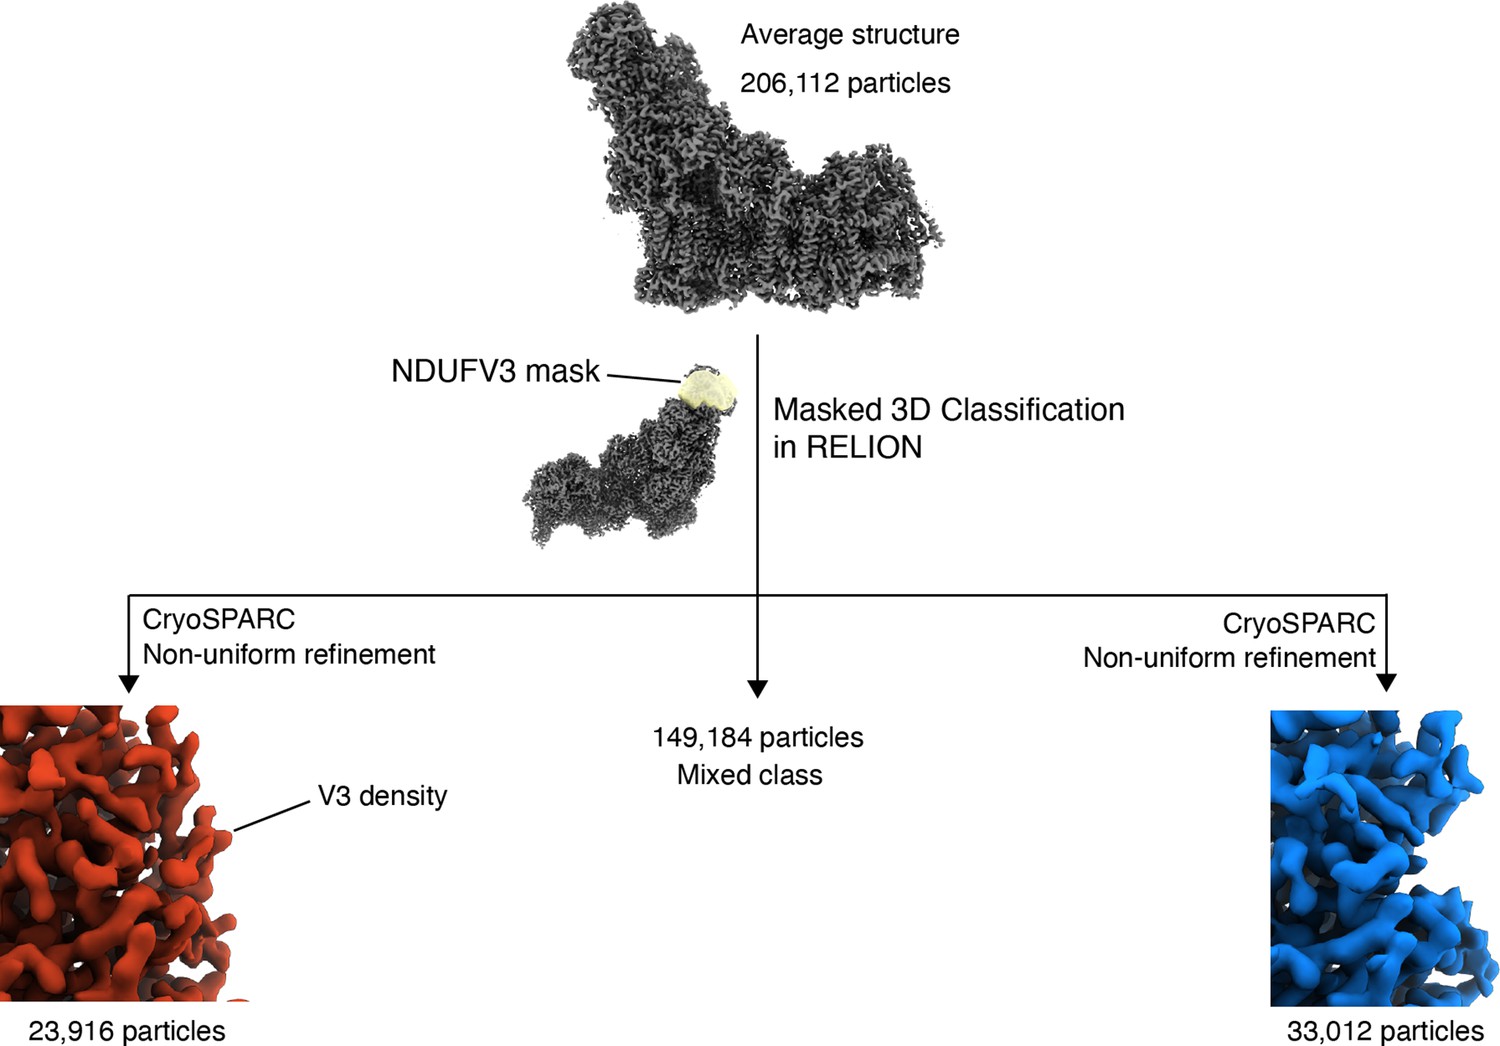
NDUFV3 is sub-stoichiometric.
Masked classification of 206,112 Dm-CI particles using a mask around the tip of the peripheral arm resulted in three distinct classes of particles, Class I with clear NDUFV3 density, Class II a set of mixed particles, Class III with a clear absence of NDUFV3 density.
Figure 3—figure supplement 2

State-dependent interactions between NDUFA5 and NDUFA10.
(A) Transparent surface of open D-state (PDB:6ZKD) and closed A-state (PDB:6ZKC) of Oa-CI showing NDUFA10 and NDUFA5 as cartoons. (B) Transparent surface of Helix-locked and flexible class 1 state of Dm-CI showing NDUFA10 and NDUFA5 as cartoons (this study).
Figure 3—figure supplement 3
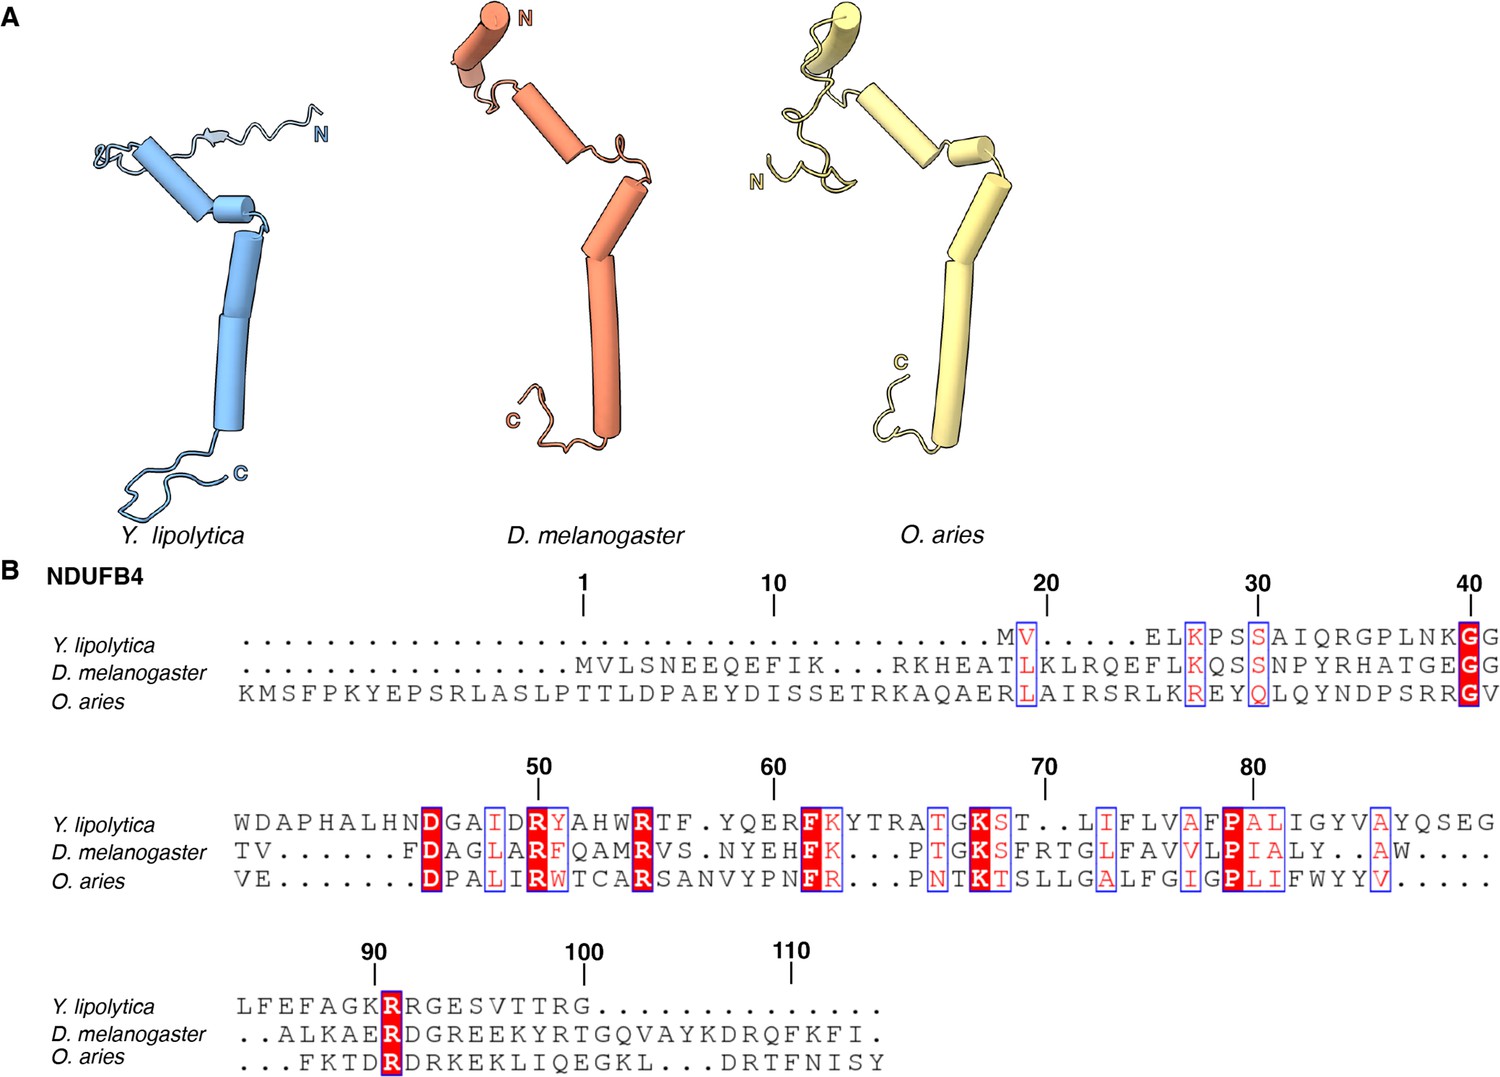
NDUFB4.
(A) Structural comparison of NDUFAB4 from Y. lipolytica (PDB: 6YJ4), D. melanogaster (this study), and O. aries (PDB: 6ZKC) is shown. (B) Sequence alignment of NDUFB4 from Y. lipolytica, D. melanogaster, and O. aries. Numbered according to Dm-NDUFB4.
Figure 3—figure supplement 4

Dm-ND5 has a truncated N-terminus.
(A) Structural comparison of N-terminal helices of ND5 in Y. lipolytica (PDB: 6YJ4), D. melanogaster (this study), and O. aries (PDB: 6ZKC). (B) Dm-ND5 TMH1 is shown as a cartoon embedded in the density map. (C) Sequence alignment of N-terminal region of ND5 from Y. lipolytica, D. melanogaster, and O. aries. Numbered according to Dm-ND5.
Figure 3—figure supplement 5
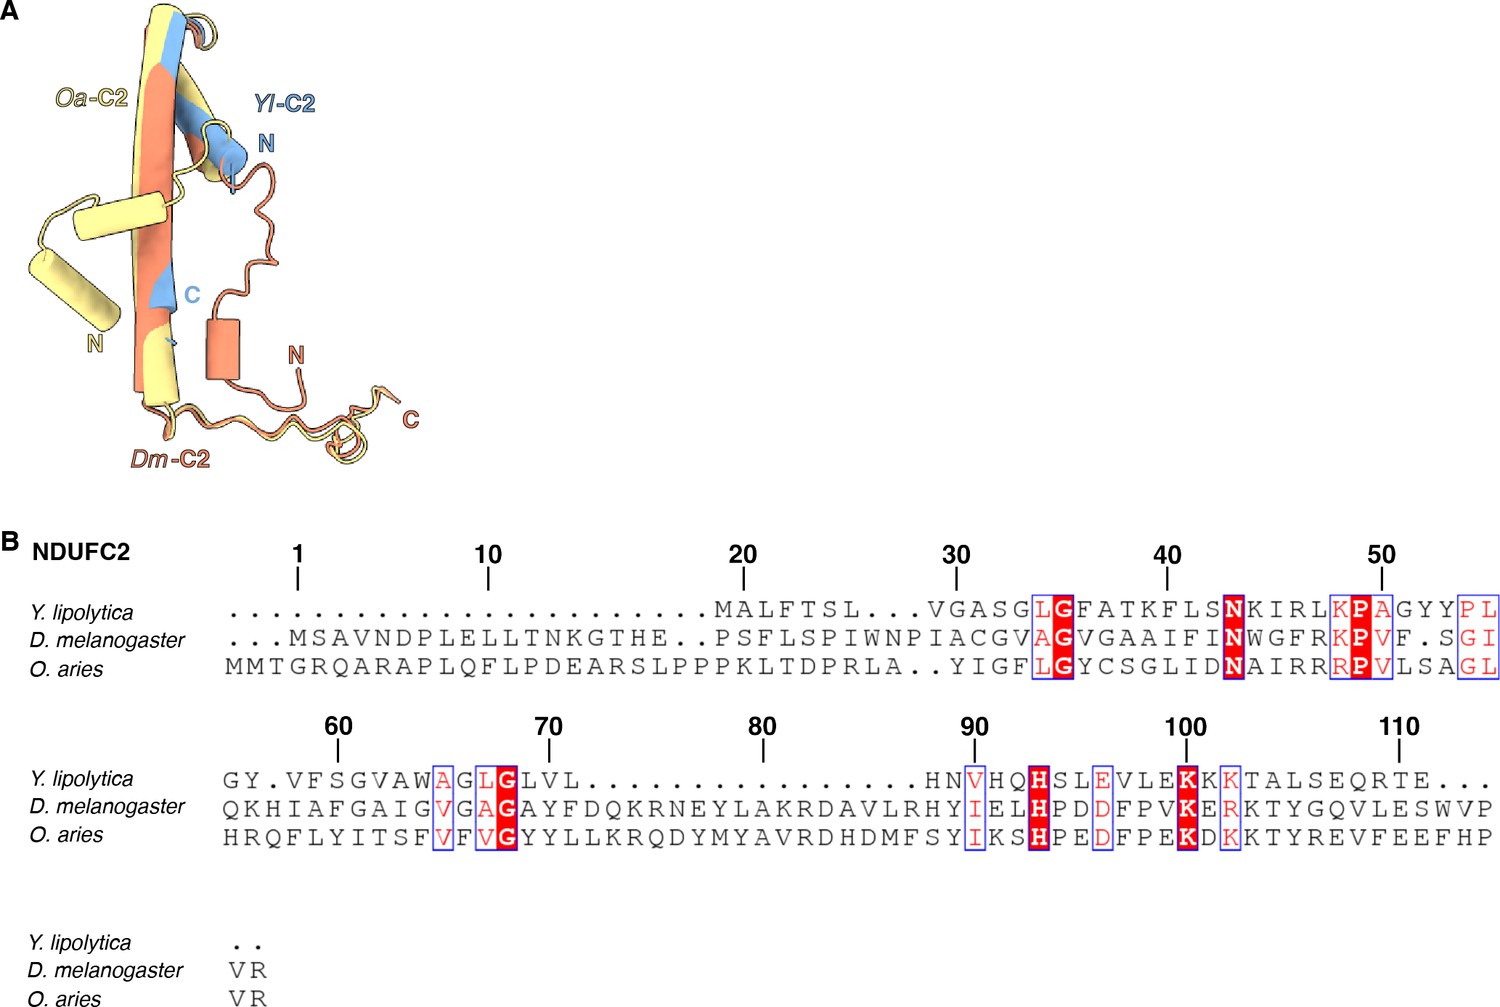
NDUFC2.
(A) Structural alignment of NDUFC2 from Y. lipolytica (PDB: 6YJ4), D. melanogaster (this study), and O. aries (PDB: 6ZKC) is shown. (B) Sequence alignment of NDUFC2 from Y. lipolytica, D. melanogaster, and O. aries. Numbered according to Dm-NDUFC2.
Figure 4 with 5 supplements
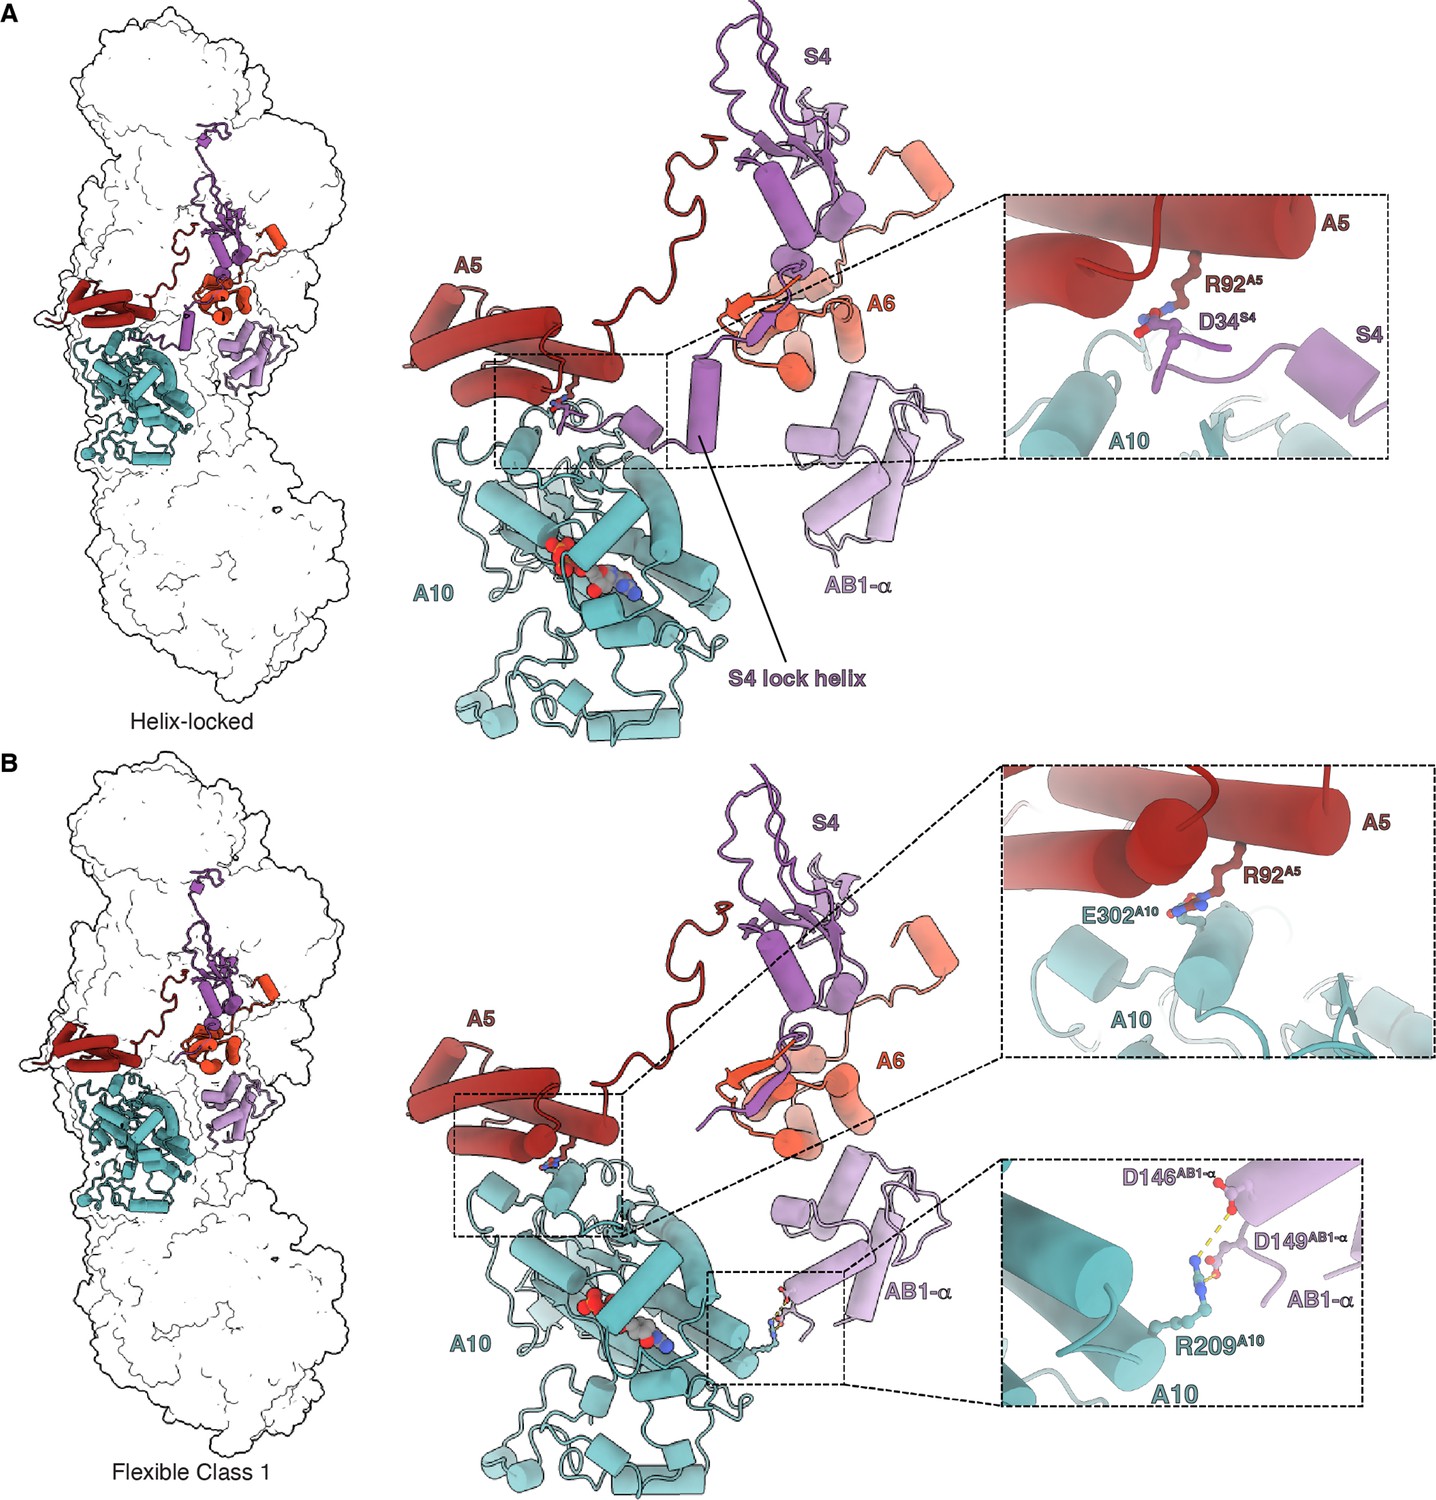
Matrix interactions in the helix-locked and flexible class 1 states of Dm-CI.
(A) Dm-CI subunits forming the bridge at the peripheral arm (PA)/membrane arm (MA) interface in the helix-locked state are shown as cartoons colored as in Figure 1. The interaction between NDUFA5 and the N-terminal region of NDUFS4 is shown in the inset. (B) Dm-CI subunits forming the hinge at the PA/MA interface in the flexible class 1 state are shown as cartoons colored as in Figure 1. NDUFA5, NDUFA10, and NDUFA10, NDUFAB1-α interactions are shown in insets.
Figure 4—figure supplement 1

Identification of helix-locked state.
(A) Masked classification of 206,112 Dm-CI particles using mask around the hinge region (NDUFA10, NDUFA5, NDUFA6, and NDUFAB1-α) at the peripheral arm (PA)/membrane arm (MA) interface of Dm-CI resulted in four distinct classes of particles, two major classes (Class1 and Class 4) and two minor classes (Class 2 and Class 3). Major class 1 has no density for the N-terminal region of NDUFS4 (shown in the inset) (flexible class 1 state) and major class 4 has a clear density for the N-terminal region of NDUFS4 (helix-locked state). Minor classes 2 and 3 have no density for the N-terminal region of NDUFS4 (shown in inset). (B, C) Local resolution maps and Fourier shell correlation (FSC) curves: Flexible class 1 state (B) and helix-locked state (C). Local resolution plotted on refined maps and FSC curves (gold standard FSC = 0.143 for resolution estimation). Resolution scale bars are shown.
Figure 4—figure supplement 2

NDUFS4 comparison.
(A) Structural alignment of N-terminal region NDUFS4 from Y. lipolytica (PDB: 6YJ4), D. melanogaster (this study), and O. aries (PDB: 6ZKC) . (B) Sequence alignment of NDUFS4 from Y. lipolytica, D. melanogaster, and O. aries with signal sequence removed. Numbered according to Dm-NDUFS4.
Figure 4—figure supplement 3
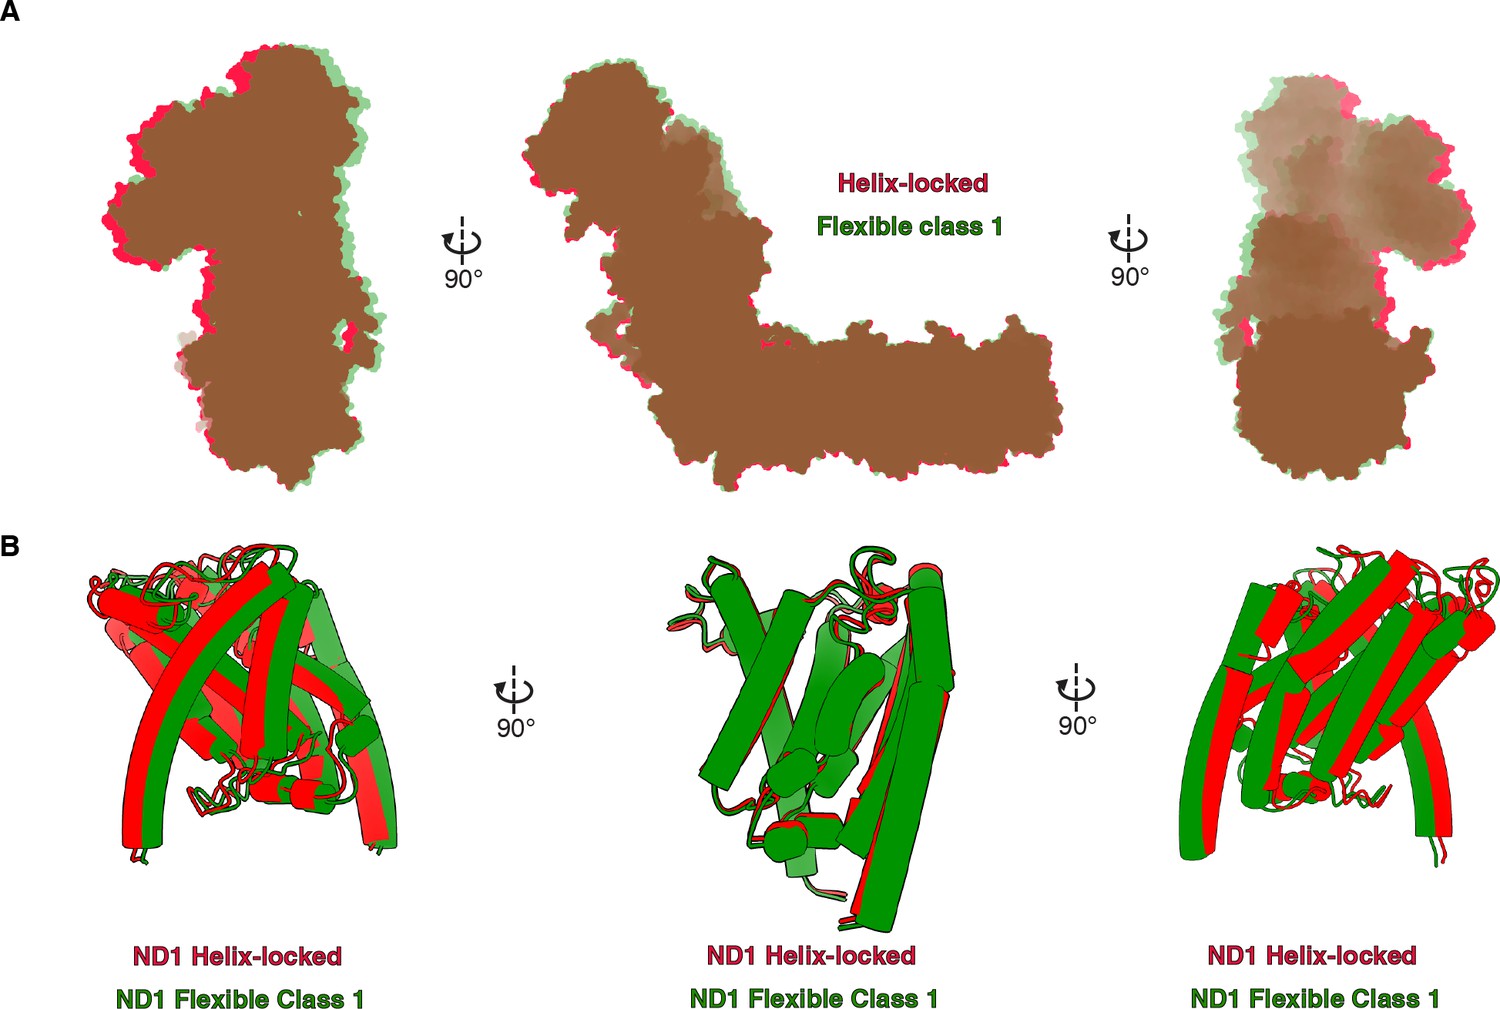
Comparison of Dm-CI states.
(A) Structural alignment of the Helix-locked state of Dm-CI (red) with the flexible class 1 state of Dm-CI (green). The structures are aligned by the ND5 subunit. (B) ND1 of Dm-CI in the helix-locked state (red) and flexible class 1 state (green) as seen in structures aligned by ND5 (above) are shown as cartoons.
Figure 4—figure supplement 4
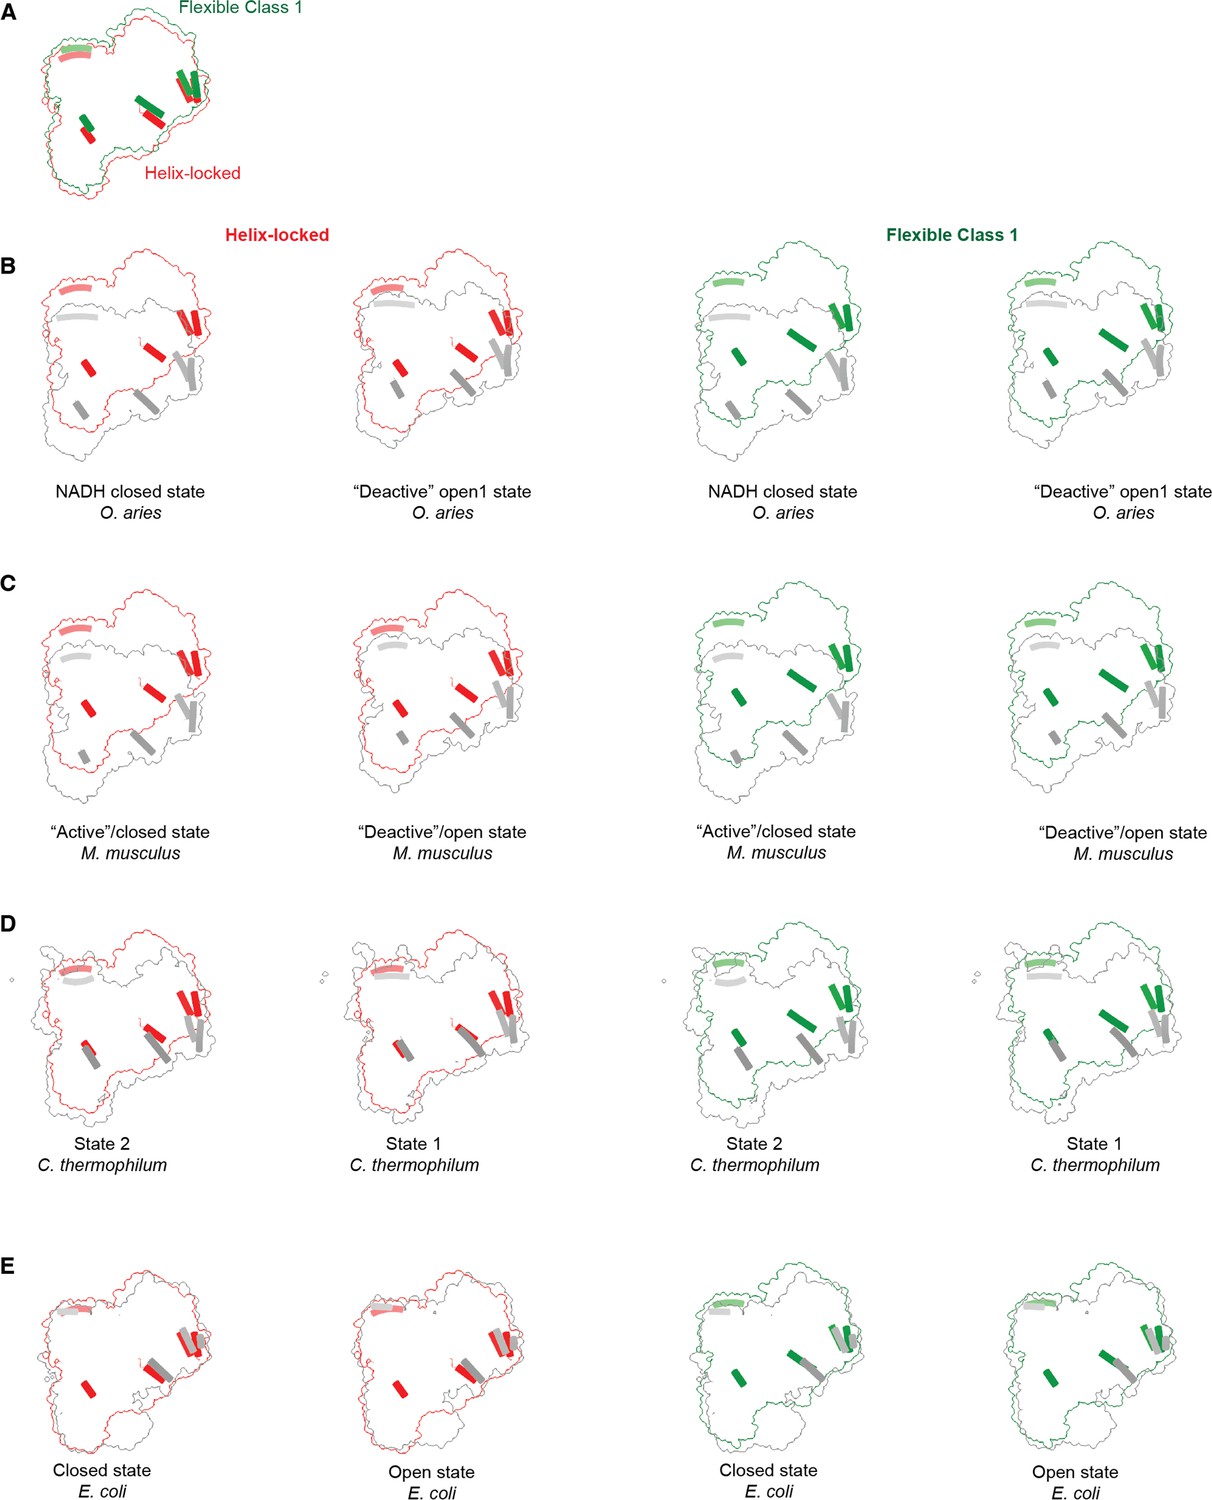
Comparison of helix-locked state and flexible class 1 state from Dm-CI to states of CI from representative organisms.
(A) Comparison of peripheral arm alignment relative to the membrane arm in helix-locked state (red) and flexible class 1 state (green). Only the peripheral arm (top view) is shown for clarity. Structurally conserved representative helices of various peripheral arm subunits are show for comparison. (B) Comparison of peripheral arm alignment of helix-locked state (red) from Dm-CI with NADH closed state (PDB ID: 6ZKG, gray) and “deactive” open1 state (PDB ID: 6ZKS, gray) of O. aries CI and comparison of peripheral arm alignment of flexible class 1 state (green) from Dm-CI with NADH closed state (PDB ID: 6ZKG, gray) and ‘deactive’ open1 state (PDB ID: 6ZKS, gray) of O. aries CI. (C) Comparison of peripheral arm alignment of helix-locked state (red) from Dm-CI with ‘active’/closed state (PDB ID: 6G2J, gray) and ‘deactive’/open state (PDB ID: 6G72, gray) of M. musculus CI and comparison of peripheral arm alignment of flexible class 1 state (green) from Dm-CI with ‘active’/closed state (PDB ID: 6G2J, gray) and ‘deactive’/open state (PDB ID: 6G72, gray) of M. musculus CI. (D) Comparison of peripheral arm alignment of helix-locked state (red) from Dm-CI with State 2 (PDB ID: 7ZMB, gray) and State 1 (PDB ID: 7ZMG, gray) of C. thermophilum CI and comparison of peripheral arm alignment of flexible class 1 state (green) from Dm-CI with State 2 (PDB ID: 7ZMB, gray) and State 1 (PDB ID: 7ZMG, gray) of C. thermophilum CI. (E) Comparison of peripheral arm alignment of helix-locked state (red) from Dm-CI with closed state (PDB ID: 7Z80, gray) and open state (PDB ID: 7Z83, gray) of E. coli CI and comparison of peripheral arm alignment of flexible class 1 state (green) from Dm-CI with closed (PDB ID: 7Z80, gray) and open state (PDB ID: 7Z83, gray) of E. coli CI.
Figure 4—figure supplement 5
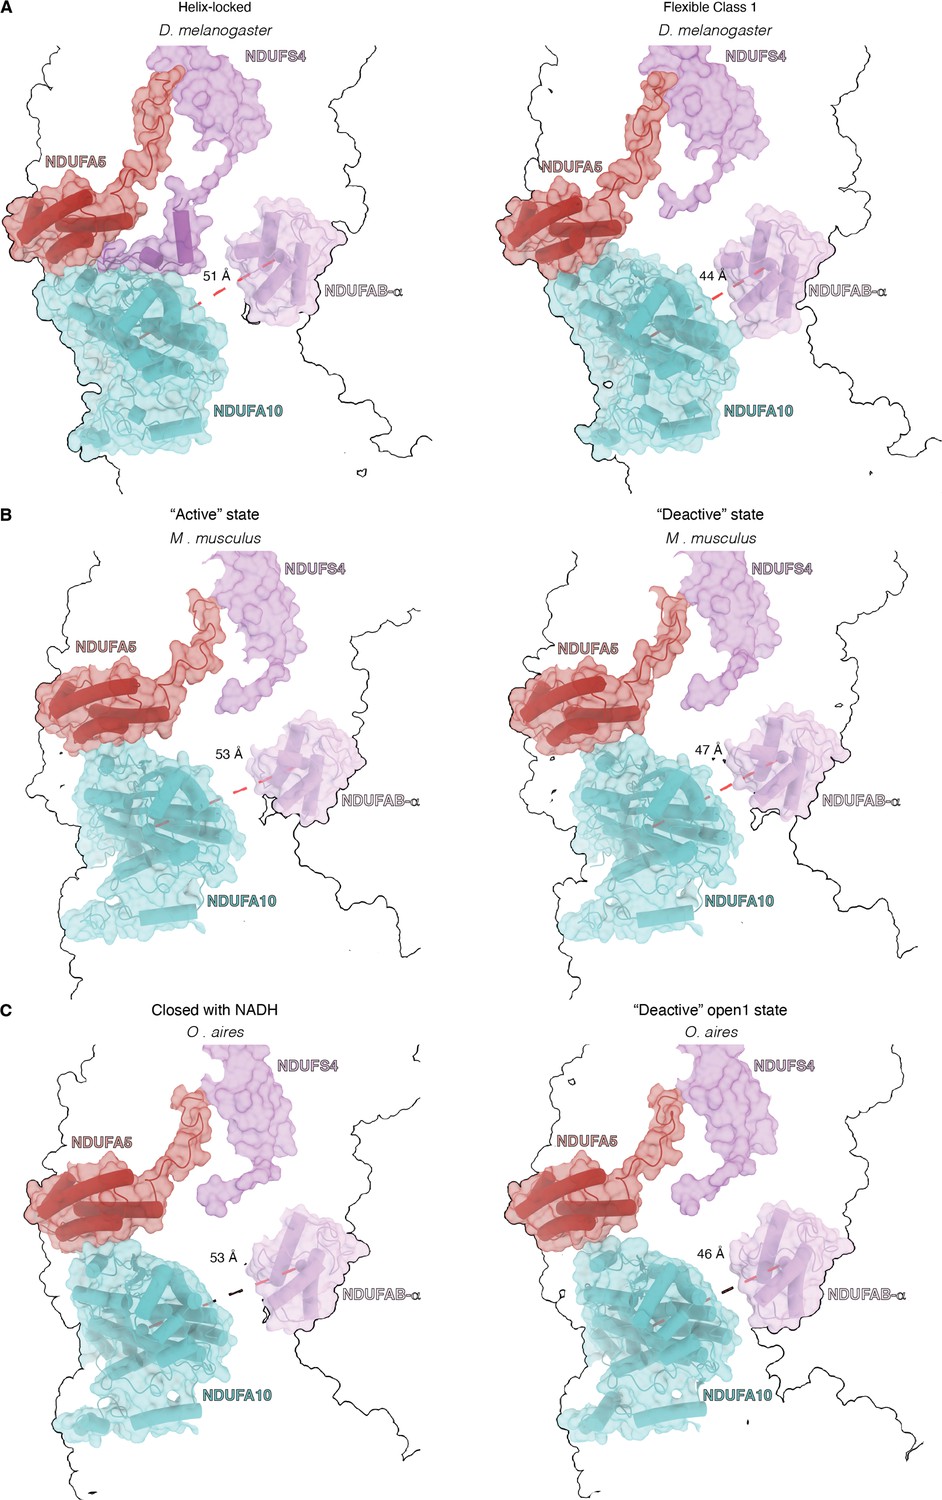
Comparison of relative positions of NDUFA10 and NDUDAB1-α in different CI states.
(A) Comparison of the hinge region – subunits NDUFA5, NDUFA10, NDUFS4 and NDUFAB1-α, in helix-locked and flexible class 1 states of D. melanogaster CI. The distance between centers of mass of NDUFA10 and NDUFAB1 is indicated. (B) Comparison of the hinge region – subunits NDUFA5, NDUFA10, NDUFS4 and NDUFAB1-α, in ‘Active’ state (PDB ID: 6G2J) and ‘Deactive’ (PDB ID: 6G72) of M. musculus CI. The distance between the centers of mass of NDUFA10 and NDUFAB1 is indicated. (C) Comparison of the hinge region – subunits NDUFA5, NDUFA10, NDUFS4, and NDUFAB1-α, in closed with NADH state (PDB ID: 6ZKG) and ‘Deactive’ open (PDB ID: 6ZKS) of O. aries CI. The distance between the centers of mass of NDUFA10 and NDUFAB1-α is indicated.
Figure 5 with 2 supplements
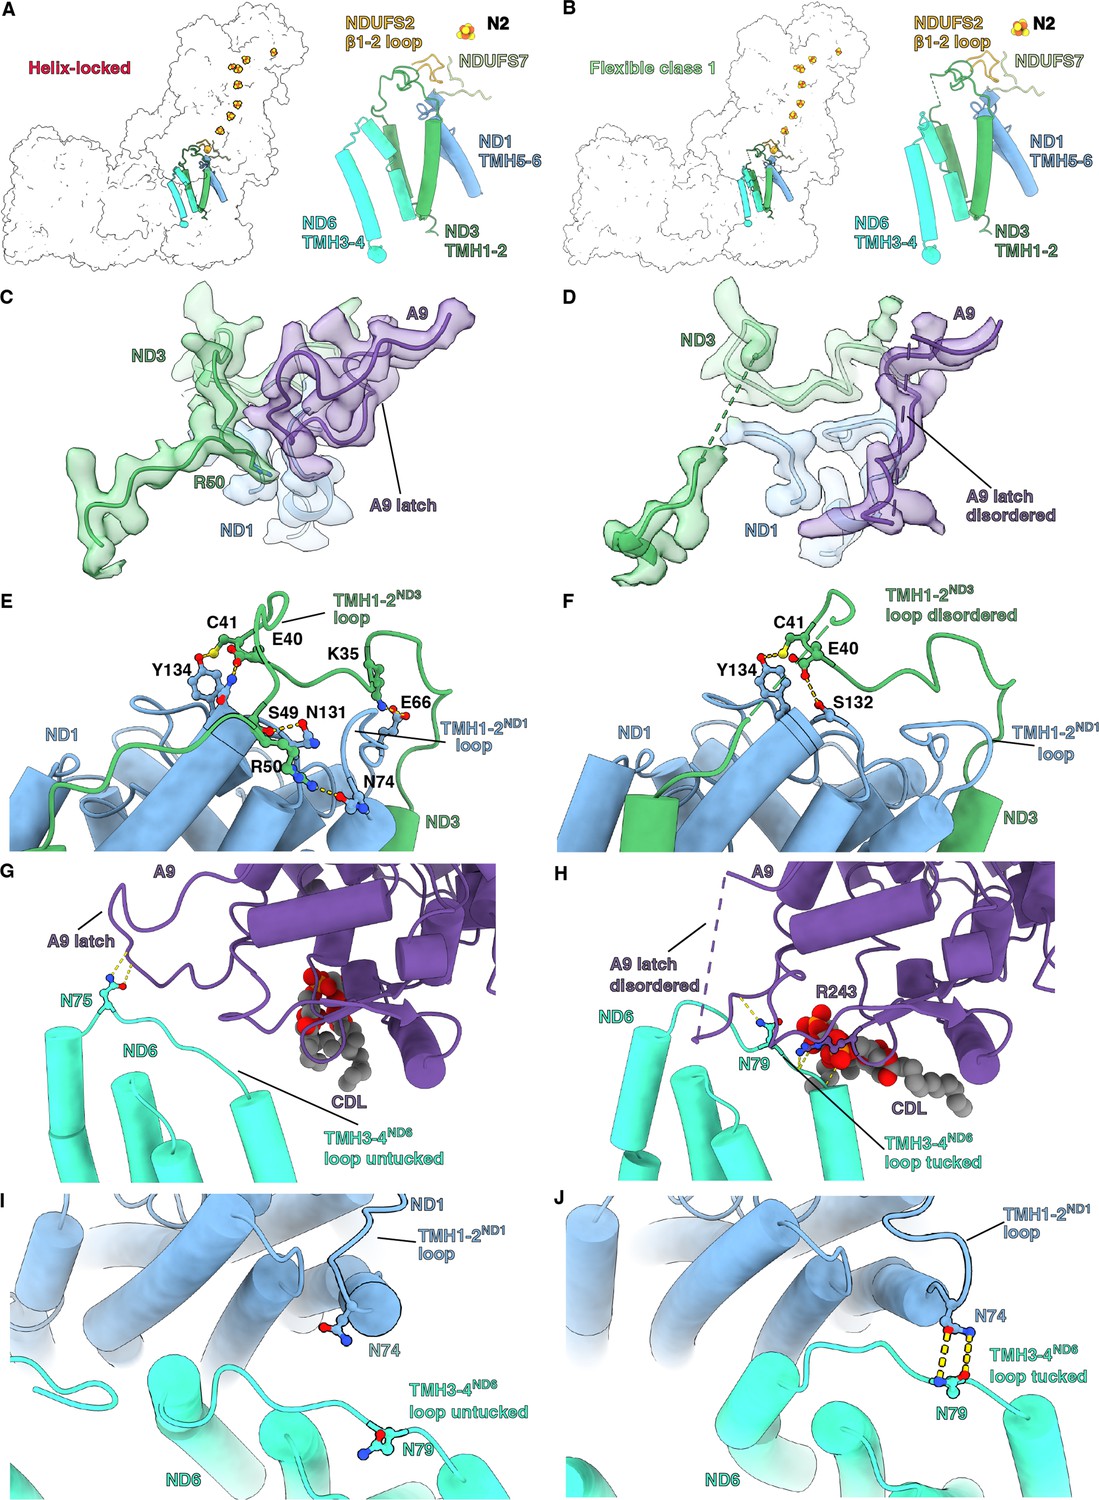
Q-site adjacent loops at the peripheral arm (PA)/membrane arm (MA) interface.
(A, B) The Q-site adjacent loops in the (A) helix-locked state and (B) flexible class 1 state are shown as cartoon colored as in Figure 1. (C, D) Interface between ND3, ND1, and NDUFA9 in the (C) helix-locked and (D) flexible class 1 state is shown. ND3, ND1, and NDUFA9 are shown as colored cartoons embedded in density colored as in Figure 1. (E, F) ND1 interaction with TMH1-2ND3 loop in the (E) helix-locked and (F) flexible class 1 states are shown. ND1 and ND3 are shown as cartoons colored as in Figure 1. (G, H) TMH3-4ND6 loop interaction with NDUFA9 in the (G) helix-locked and (H) flexible class 1 states are shown. ND6 and NDUFA9 are shown as cartoons colored as in Figure 1. (I, J) Interactions at the interface of ND1 and ND6 in the (I) helix-locked and (J) flexible class 1 states are shown. ND1 and ND6 are shown as cartoons colored as in Figure 1. Figure-figure supplements.
Figure 5—figure supplement 1

Structural comparison of the Q-site adjacent loops of Dm-CI in the helix-locked and flexible class 1 states with the confirmations of O.aries, E. coli, and C. thermophilum CI.
(A) NDUFS7 loops of D. melanogaster CI in helix-locked and flexible class 1 (this study), flipped confirmation of PSST loops from O. aries CI (native open1, PDB: 6ZKP), raised confirmation of PSST loops from O. aries CI (rotenone closed, PDB: 6ZKK), NuoB loops from E. coli (open, 7Z83), (closed, 7Z80) states, flipped confirmation of S7 loops from C. thermophilum CI (State 1, PDB: 7ZMG) and raised confirmation of S7 loops from C. thermophilum CI (State 2, PDB:7ZMB). (B) NDUFS2 β1–2 loop. NDUFS2 β1–2 loop of D. melanogaster in helix-locked state and flexible class 1 state (this study), disordered confirmation of O. aries CI (native open1, PDB: 6ZKP), extended confirmation of O. aries CI (NADH open1, PDB: 6ZKH), retracted confirmation of 49 kDa subunit loop from O. aries CI (native closed, PDB: 6ZKO), extended confirmation of NuoC β1–2 loop from E. coli CI (open, 7Z83) and retracted confirmation of NuoC β1–2 from E. coli CI (closed, 7Z80), extended confirmation of S2 β1–2 loop of C. thermophilum CI (State 1, PDB: 7ZMG) and retracted confirmation of S2 β1–2 loop of C. thermophilum CI (State 2, PDB: 7ZMB). (C) ND1 TMH5-6. D. melanogaster ND1 TMH5-6 loop in helix-locked state and flexible class 1 state (this study), the disordered state of ND1 loop of O. aries CI (native open1, PDB: 6ZKP), up confirmation of O. aries CI (NADH open1, PDB: 6ZKH), down confirmation of ND1 subunit of O. aries (native closed, PDB: 6ZKO), the disordered state of NuoH loop of E. coli CI (open, 7Z83),down confirmation of NuoH loop of E. coli CI (closed, 7Z80) states, down confirmations of ND1 loops of C. thermophilum CI (State 1, PDB:7ZMG, State 2,PDB:7ZMB). (D) ND3 TMH1-2 loop. ND3 TMH1-2 loop of D. melanogaster in helix-locked state and flexible class 1 state (this study), disordered confirmation of ND3 TMH1-2 loop from O. aries (deactive open1, PDB:6ZKS), ordered confirmation of ND3 TMH1-2 loop from O. aries (native closed, PDB 6ZKO), disordered confirmation of NuoA TMH1-2 loop from E. coli CI (open, 7Z83), ordered confirmation of NuoA TMH1-2 loop from E. coli CI (closed, 7Z80) states, disordered confirmation of C. thermophilum CI (State 1, PDB:7ZMG) and ordered confirmation of C. thermophilum CI (State 2, PDB:7ZMB). (E) ND6 TMH3-4 loop. D. melanogaster ND6 TMH3-4 loop in helix-locked and flexible class 1 states, the tilted configuration of CI from O. aries ND6 TMH4 with π-bulge as seen in the open state of deactive CI (deactive open 1, PDB: 6ZKS), disordered confirmation of CI with π-bulge of O. aries (native open1, PDB: 6ZKP), ordered confirmation of O. aries (native closed, PDB: 6ZKO), NuoJ TMH 3–4 from E. coli CI (open, 7Z83), (closed, 7Z80) states, and ND6 TMH3-4 loops from C. thermophilum CI (State 1, PDB ID: 7ZMG), (State 2, PDB ID:7ZMB).
Figure 5—figure supplement 2

Comparison of TMH4ND6 orientation in the open and closed states across different organisms.
(A) TMH4ND6 orientation in the ‘deactive’ open (PDB:6GCS) state of Y. lipolytica. (B) TMH4ND6 orientation in helix-locked and flexible class 1 states (this study) of D. melanogaster. ND6 TMH4 relative orientation in structurally aligned ND6 of the two states is shown in the right panel. (C) TMH4ND6 orientation in open (PDB:7Z83) and closed state (PDB:7Z80) of E. coli. TMH4ND6 relative orientation in structurally aligned ND6 of the two states is shown in the right panel. (D) TMH4ND6 orientation in open (PDB:6ZKS) and closed state (PDB:6ZKG) of O. aries. TMH4ND6 relative orientation in structurally aligned ND6 of the two states is shown in the right panel. (E) TMH4ND6 orientation in T. thermophilus (PDB:7Z83) is shown. TMH4ND6 is shown as a cartoon, the rest of CI is shown in colored surface. (F) TMH4ND6 orientation in open (PDB:6G72) and closed state (PDB:6G2J) of M. musculus. TMH4ND6 relative orientation in structurally aligned ND6 of the two states is shown in the right panel. (G) TMH4ND6 orientation in open (PDB:5O31) and closed state (PDB:5LC5) of B. taurus. TMH4ND6 relative orientation in structurally aligned ND6 of the two states is shown in the right panel.
Videos
Video 1
Cryogenic electron microscopy (CryoEM) density map and model of D. melanogaster CI.
The subunits are colored as in Figure 1.
Video 2
Cryogenic electron microscopy (CryoEM) density map of D. melanogaster CI.
Subunit NDUFA3 identified from the map is highlighted. The subunits are colored as in Figure 1.
Video 3
Structural analysis and comparison of NDUFS1-NDUFA2 interface in Y. lipolytica (PDB:6YJ4), D. melanogaster (this study), and O. aries (PDB:6ZKC).
Video 4
Structural analysis of ND2, comparison of ND2-NDUFA10 interface and comparison of ND2-NDUFC2 interface in D. melanogaster (this study) and O. aries (PDB:6ZKC).
Video 5
Structural analysis of NDUFA11 subunit of Dm-CI and structural comparison of NDUFA11 in Y. lipolytica (PDB:6YJ4), D. melanogaster (this study), and O. aries (PDB:6ZKC).
Video 6
3D variability analysis of D. melanogaster CI, component 1.
The 3DVA volumes are shown as a continuous movie. The movie emphases on the hinge region of peripheral arm (PA)/membrane arm (MA) interface. Dm-CI subunits are colored as in Figure 1.
Video 7
3D variability analysis of D. melanogaster CI, component 1.
The 3DVA volumes are shown as a continuous movie. The movie emphasizes the Q-site and interface loops at the peripheral arm (PA)/membrane arm (MA) interface. Dm-CI subunits are colored as in Figure 1.
Tables
Table 1
Data collection and image processing.
| Data collection and image processing | ||
|---|---|---|
| Microscope | TFS Glacios | |
| Voltage(kV) | 200 | |
| Camera | K3 | |
| Data collection software | Serial EM | |
| Magnification | 56818 | |
| Electron exposure (e/Å2) | 60 | |
| Exposure time (s) | 3 | |
| Frame number | 75 | |
| Defocus range (μm) | –0.5 to –3.0 | |
| Super resolution pixel size (Å) | 0.44 | |
| Number of micrographs | 11066 | |
| EMPIAR accession code | ||
| Helix-locked state | Flexible class 1 state | |
| Number of particles for final reconstruction | 64,806 | 72,611 |
| Resolution focused refinement (Å) | 3.4 Å | 3.4 Å |
| EMDB accession code | 28582 | 28581 |
| Model refinement statistics | ||
| Manual modelling software | Coot | |
| Refinement software | Phenix | |
| Cross-correlation Mask Volume | 0.84 0.81 | 0.84 0.80 |
| Model composition | ||
| Non-hydrogen atoms Protein residues Ligands | 67,760 8141 68 | 66,739 8090 49 |
| Ramachandran | ||
| Favored (%) Allowed (%) Outlier (%) | 97.00 3.00 0.00 | 97.0 3.00 0.00 |
| Rotamer outliers (%) | 0.9 | 0.7 |
| Clash score | 6 | 5 |
| RMSD | ||
| Bond length(Å) Bond angle (°) | 0.005 0.973 | 0.005 0.962 |
| B factors (Å2 min/max/mean) | ||
| Protein Ligands | 24.39/136.88/57.00 26.80/91.61/59.37 | 5.74/81.66/25.84 7.72/57.56/30.70 |
| MolProbity score | 1.44 | 1.42 |
| Average atom inclusion | 0.69 | 0.68 |
| Q-score | 0.50 | 0.50 |
| PDB Accession Code | 8ESZ | 8ESW |
Table 2
Sequence homology between CI subunits of D. melanogaster and D. suzukii.
| Subunit Name | Uniprot Annotation | Ds Homology with Dm (%) |
|---|---|---|
| NDUFV1 | NADH dehydrogenase [ubiquinone] flavoprotein 1, mitochondrial | 94.30% |
| NDUFV2 | NADH dehydrogenase (Ubiquinone) 24 kDa subunit, isoform A | 97.93% |
| NDUFS1 | NADH-ubiquinone oxidoreductase 75 kDa subunit, mitochondrial | 96.85% |
| NDUFS2 | Complex I-49kD | 91.03% |
| NDUFS3 | NADH dehydrogenase [ubiquinone] iron-sulfur protein 3, mitochondrial | 97.58% |
| NDUFS7 | LD31474p/NADH dehydrogenase (Ubiquinone) 20 kDa subunit, isoform A | 96.85% |
| NDUFS8 | NADH dehydrogenase (ubiquinone) 23 kDa subunit | 96.77% |
| ND1 | NADH-ubiquinone oxidoreductase chain 1 | 98.13% |
| ND2 | NADH-ubiquinone oxidoreductase chain 2 | 97.06% |
| ND3 | NADH-ubiquinone oxidoreductase chain 3 | 99.00% |
| ND4 | NADH-ubiquinone oxidoreductase chain 4 | 95.57% |
| ND4L | NADH-ubiquinone oxidoreductase chain 4 L | 98.96% |
| ND5 | NADH-ubiquinone oxidoreductase chain 5 | 94.23% |
| ND6 | NADH-ubiquinone oxidoreductase chain 6 | 93.10% |
| NDUFA1 | Complex I-MWFE | 98.61% |
| NDUFA2 | NADH dehydrogenase (Ubiquinone) B8 subunit | 91.58% |
| NDUFA3 | uncharacterized protein Dmel_CG9034, isoform B | 97.40% |
| NDUFA5 | NADH dehydrogenase (Ubiquinone) 13 kDa B subunit | 93.55% |
| NDUFA6 | Complex I-B14 | 100.00% |
| NDUFA7 | Complex I-B14.5a | 91.35% |
| NDUFA8 | NADH dehydrogenase [ubiquinone] 1 alpha subcomplex subunit 8 | 96.57% |
| NDUFA9 | NADH dehydrogenase (Ubiquinone) 39 kDa subunit, isoform A | 99.04% |
| NDUFA10 | NADH dehydrogenase [ubiquinone] 1 alpha subcomplex subunit 10 | 92.87% |
| NDUFA11 | Complex I-B14.7 | 95.81% |
| NDUFA12 | NADH dehydrogenase [ubiquinone] 1 alpha subcomplex subunit 12 | 96.48% |
| NDUFA13 | NADH dehydrogenase [ubiquinone] 1 alpha subcomplex subunit 13 | 98.05% |
| NDUFAB1-α | Acyl carrier protein | 96.71% |
| NDUFAB1-β | Acyl carrier protein | 96.71% |
| NDUFB1 | Complex I-MNLL | 91.07% |
| NDUFB2 | GEO11417p1/NADH dehydrogenase (Ubiquinone) AGGG subunit, isoform A | 72.83% |
| NDUFB3 | Complex I-B12 | 90.70% |
| NDUFB4 | Complex I-B15 | 93.81% |
| NDUFB5 | Complex I-SGDH | 93.55% |
| NDUFB6 | Complex I-B17 | 94.55% |
| NDUFB7 | NADH dehydrogenase [ubiquinone] 1 beta subcomplex subunit 7 | 94.02% |
| NDUFB8 | NADH dehydrogenase [ubiquinone] 1 beta subcomplex subunit 8 | 92.00% |
| NDUFB9 | NADH dehydrogenase [ubiquinone] 1 beta subcomplex subunit 9 | 90.97% |
| NDUFB10 | NADH dehydrogenase [ubiquinone] 1 beta subcomplex subunit 10 | 96.86% |
| NDUFB11 | Complex I-ESSS | 90.67% |
| NDUFC2 | NADH dehydrogenase [ubiquinone] 1 subunit C2 | 87.07% |
| NDUFS4 | NADH dehydrogenase [ubiquinone] iron-sulfur protein 4 | 87.10% |
| NDUFS5 | Complex I-15 kDa | 100.00% |
| NDUFS6 | NADH dehydrogenase [ubiquinone] iron-sulfur protein 6 | 91.27% |
| NDUFV3 | NADH dehydrogenase [ubiquinone] flavoprotein 3, mitochondrial | 72.48% |
Additional files
Download links
A two-part list of links to download the article, or parts of the article, in various formats.
Downloads (link to download the article as PDF)
Open citations (links to open the citations from this article in various online reference manager services)
Cite this article (links to download the citations from this article in formats compatible with various reference manager tools)
Resting mitochondrial complex I from Drosophila melanogaster adopts a helix-locked state
eLife 12:e84415.
https://doi.org/10.7554/eLife.84415


