Cryo-EM structures of mitochondrial respiratory complex I from Drosophila melanogaster
- The Medical Research Council Mitochondrial Biology Unit, University of Cambridge, The Keith Peters Building, Cambridge Biomedical Campus, United Kingdom
Figures
Figure 1 with 6 supplements
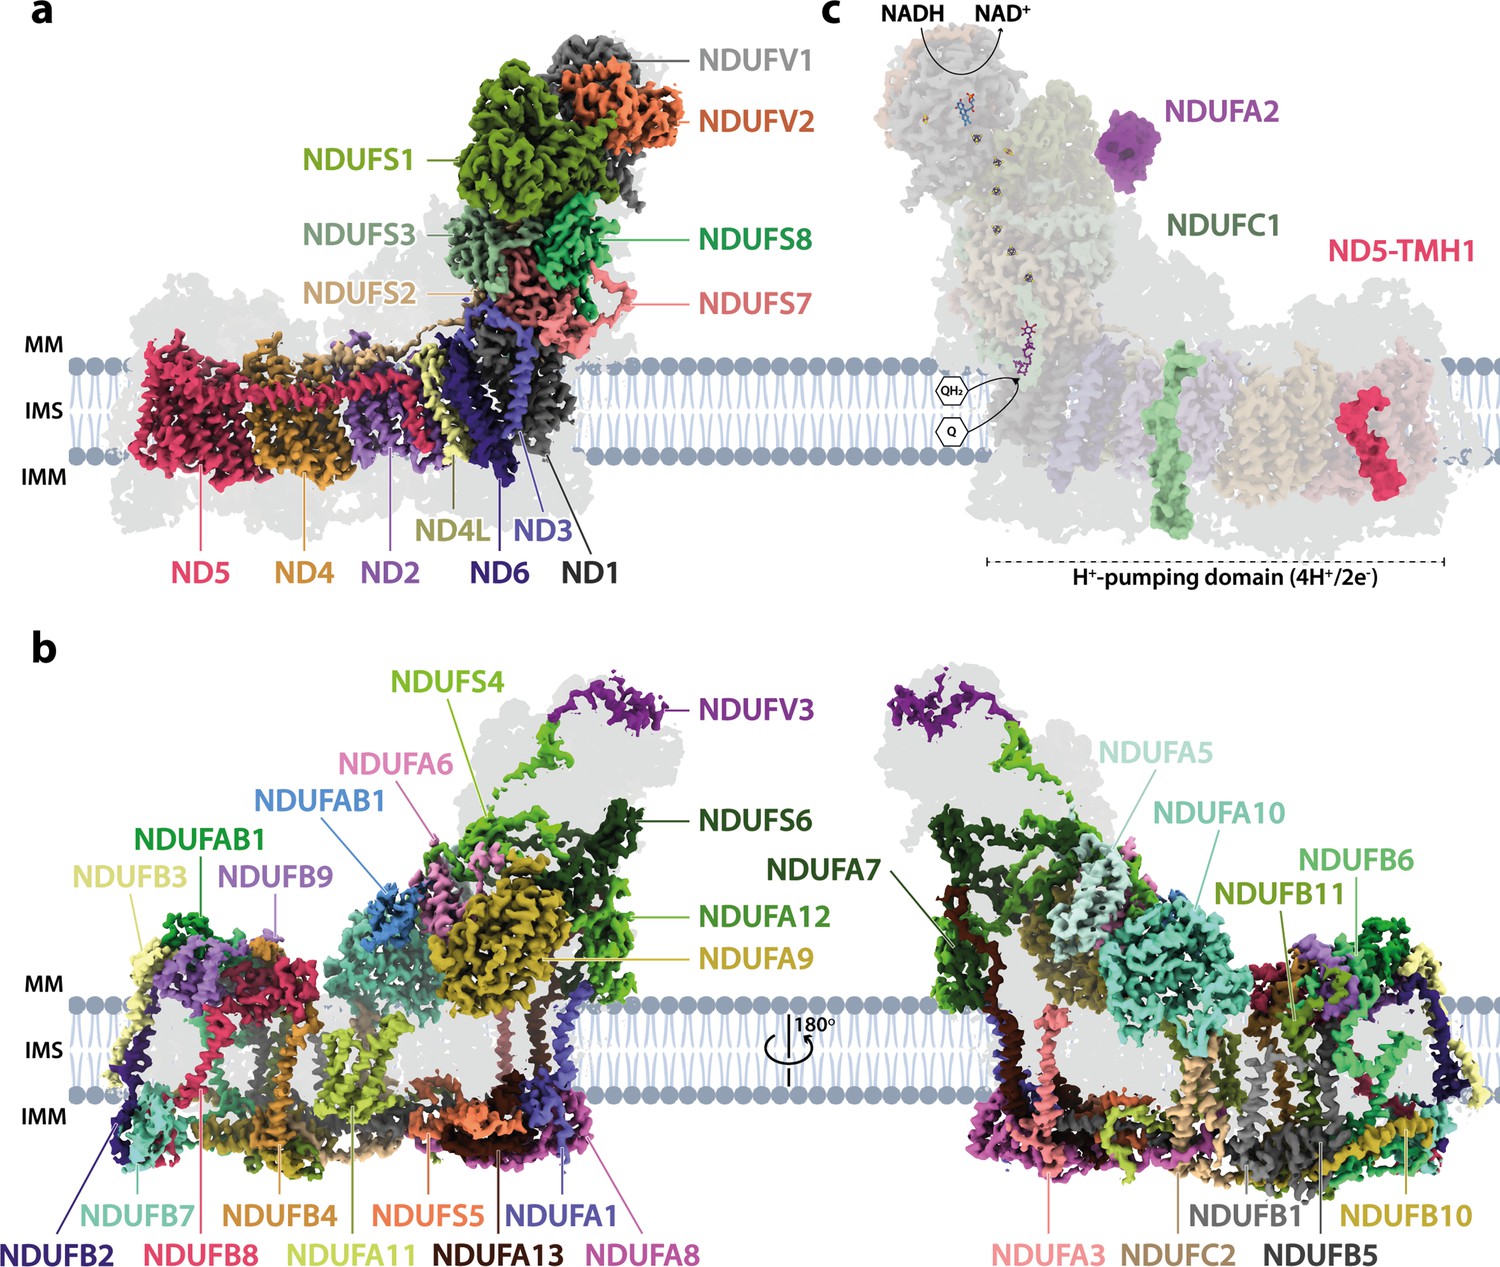
The architecture of complex I from Drosophila melanogaster.
(a) The 14 core subunits are shown in colour and labelled accordingly, and the 29 supernumerary subunits are shaded in grey. (b) The 29 supernumerary subunits are shown in colour and labelled accordingly, and the 14 core subunits are shaded in grey. (c) Drosophila complex I shown in transparent colour (as in a) with NDUFA2 (purple), NDUFC1 (green), and ND5-TMH1 (red), which are absent in Drosophila but present in mammalian complex I, indicated in solid colour from the structure of bovine complex I (PDB ID: 7QSK) (Chung et al., 2022b). The NADH-binding site at the flavin mononucleotide (FMN) cofactor, iron-sulphur clusters, the ubiquinone-binding site (Q9; purple), and the proton-pumping domain are indicated. All structures are of the Dm1 active-state Drosophila cryo-EM map, shown at a map threshold of 0.013 in UCSF ChimeraX (Pettersen et al., 2021). MM, mitochondrial matrix; IMS, intermembrane space; IMM, inner mitochondrial membrane; TMH, transmembrane helix; Q, ubiquinone; QH2, ubiquinol.
Figure 1—figure supplement 1
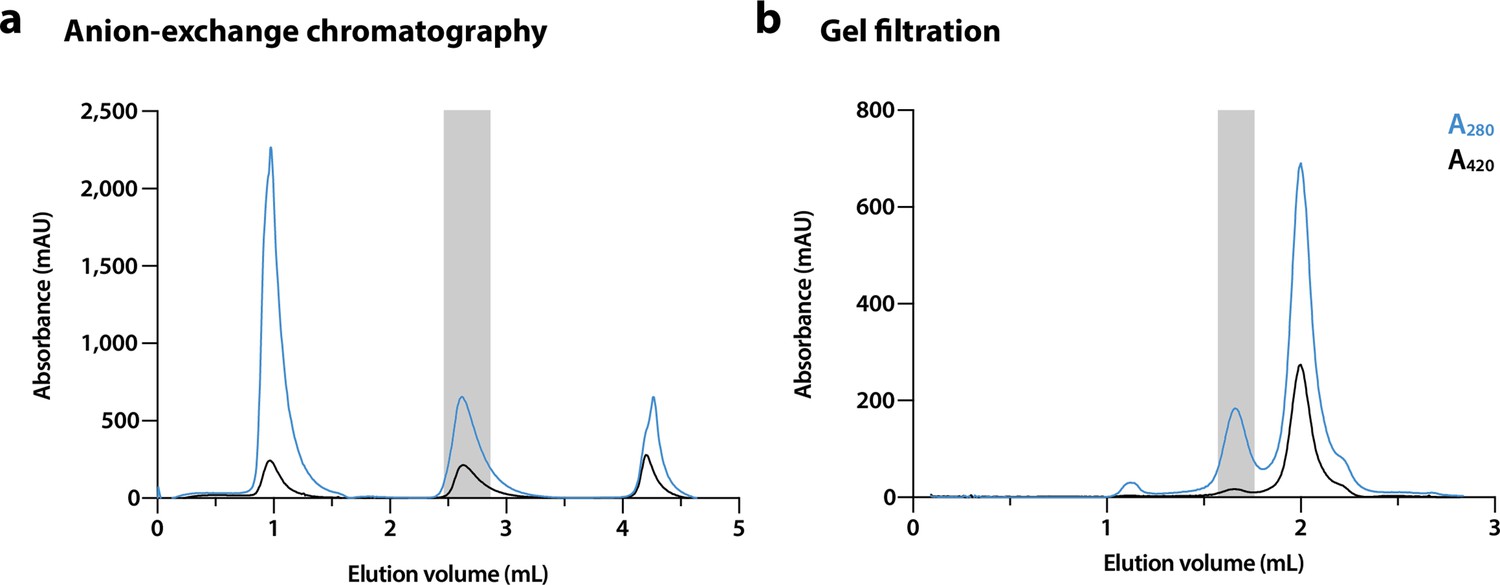
Example of a preparation of Drosophila complex I.
Elution of complex I-containing fractions (shaded in grey) from (a) a 1 mL Hi-Trap Q HP anion-exchange column followed by (b) a Superose 6 increase 5/150 size-exclusion column (see 'Materials amd methods' for details). Blue and black lines indicate absorbance at 280 and 420 nm, respectively.
Figure 1—figure supplement 2
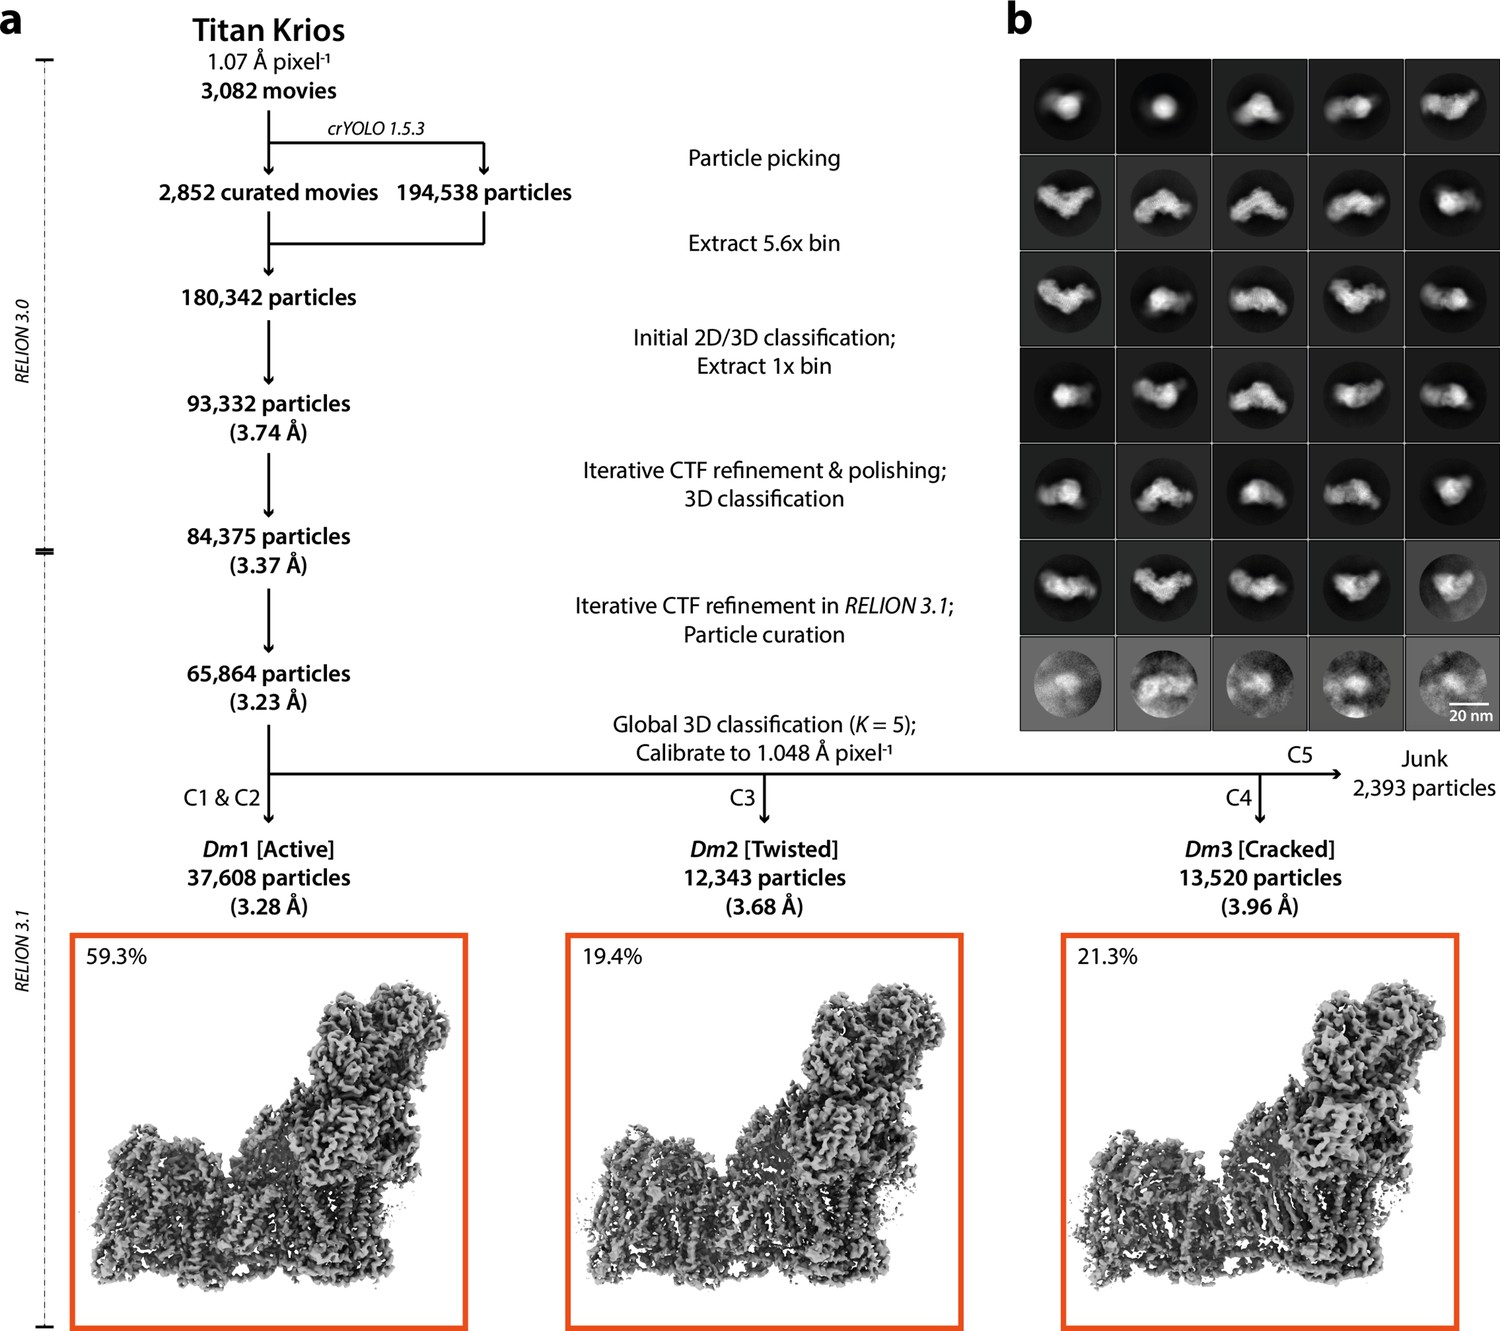
Cryo-EM data processing and particle classification.
(a) A flow chart of cryo-EM data processing leading to three distinct classes. Red boxes denote the final map for each class, and the percentages of the total particle number in each class are indicated. The maps were calibrated to a pixel size of 1.048 Å pixel–1 during the postprocessing procedure (see 'Materials and methods'). (b) Representative 2D class averages. The example view was selected following 2D classification of the final 3D refined particles to show classes of particles in different orientations.
Figure 1—figure supplement 3
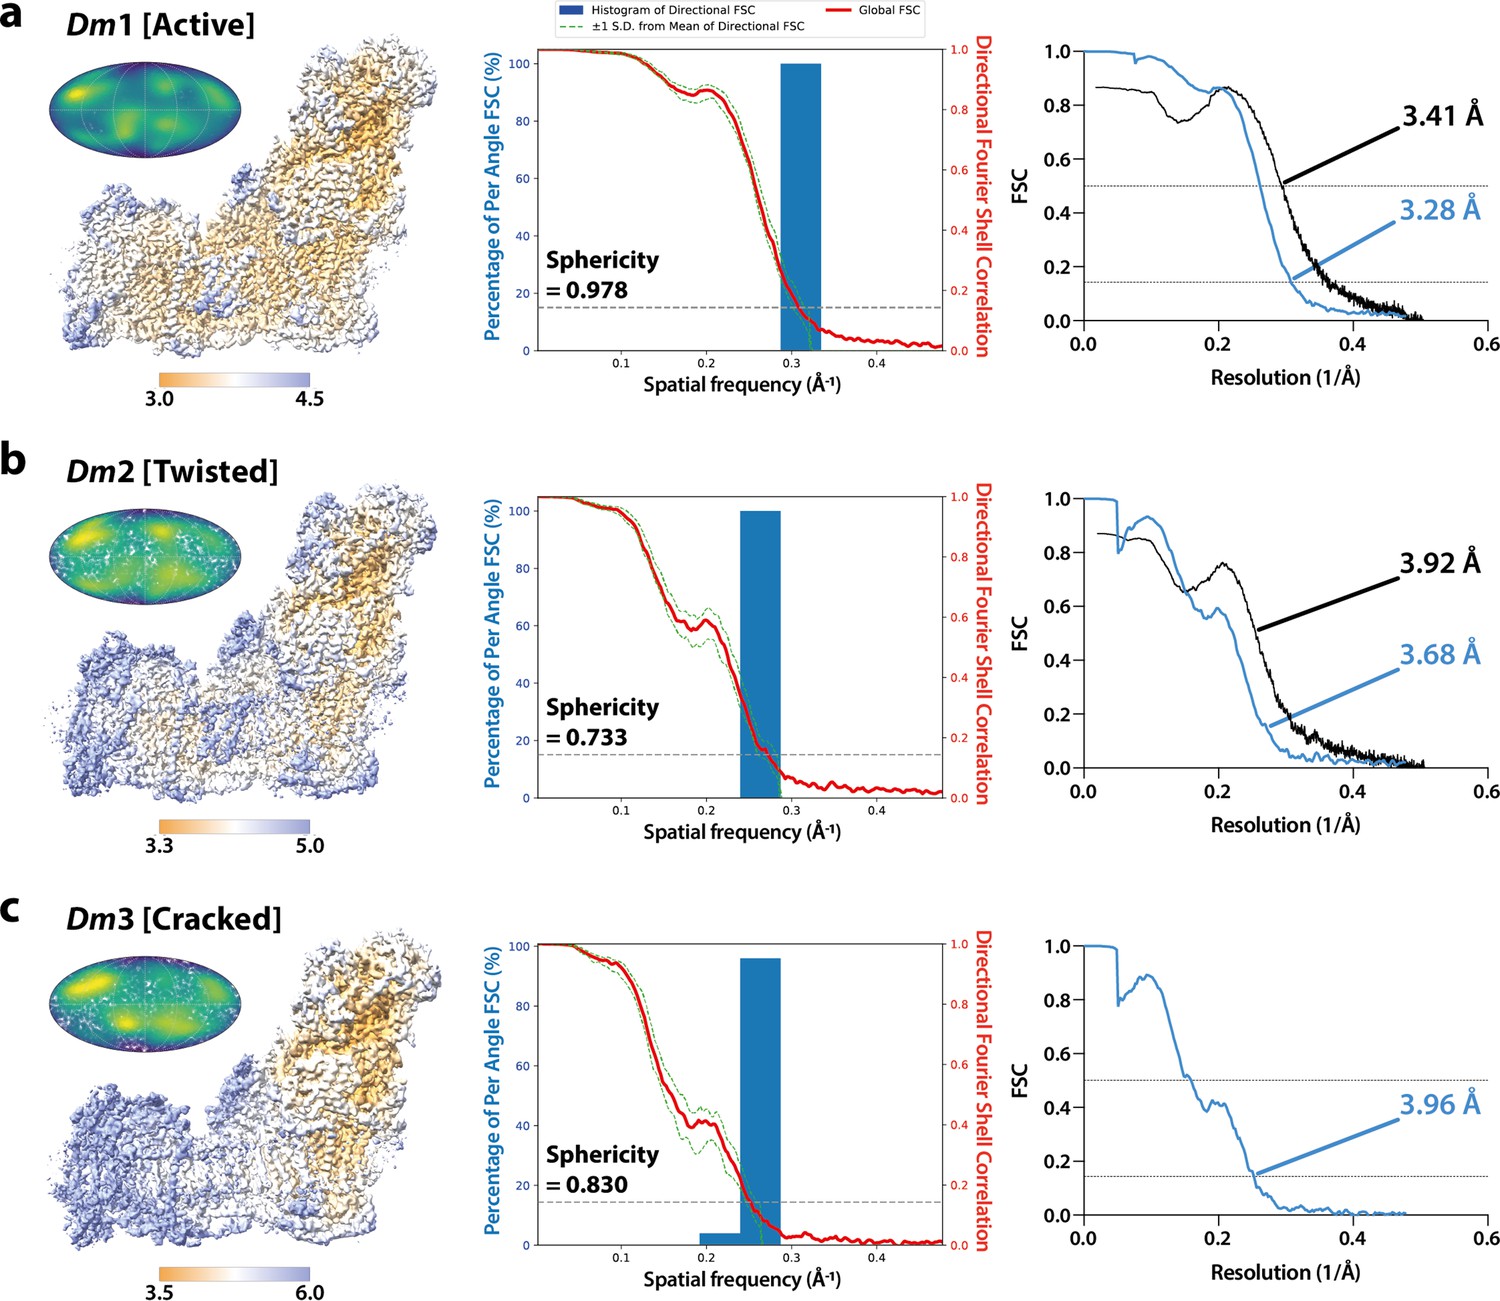
Local resolution maps, Mollweide projections, 3DFSC plots, and Fourier shell correlation (FSC) curves for three states of Drosophila complex I.
Local resolution consensus maps (left), Mollweide projections (left inset), histogram and directional FSC (3DFSC) plots (middle), and FSC curves (right) are shown for the (a) Dm1 (active), (b) Dm2 (twisted), and (c) Dm3 (cracked) states of Drosophila complex I. Local resolutions were estimated using the Local resolution function in RELION-3.1 (Zivanov et al., 2018) and plotted using UCSF ChimeraX (Pettersen et al., 2021) with map thresholds of 0.013, 0.014, and 0.015, respectively. Coloured keys indicate resolution in Å. Mollweide projections were plotted using Python and Matplotlib, and the degree of directional resolution anisotropy calculated using the 3DFSC program suite (Tan et al., 2017). RELION half-map (sky blue) and model-map (black) FSC curves are shown.
Figure 1—figure supplement 4
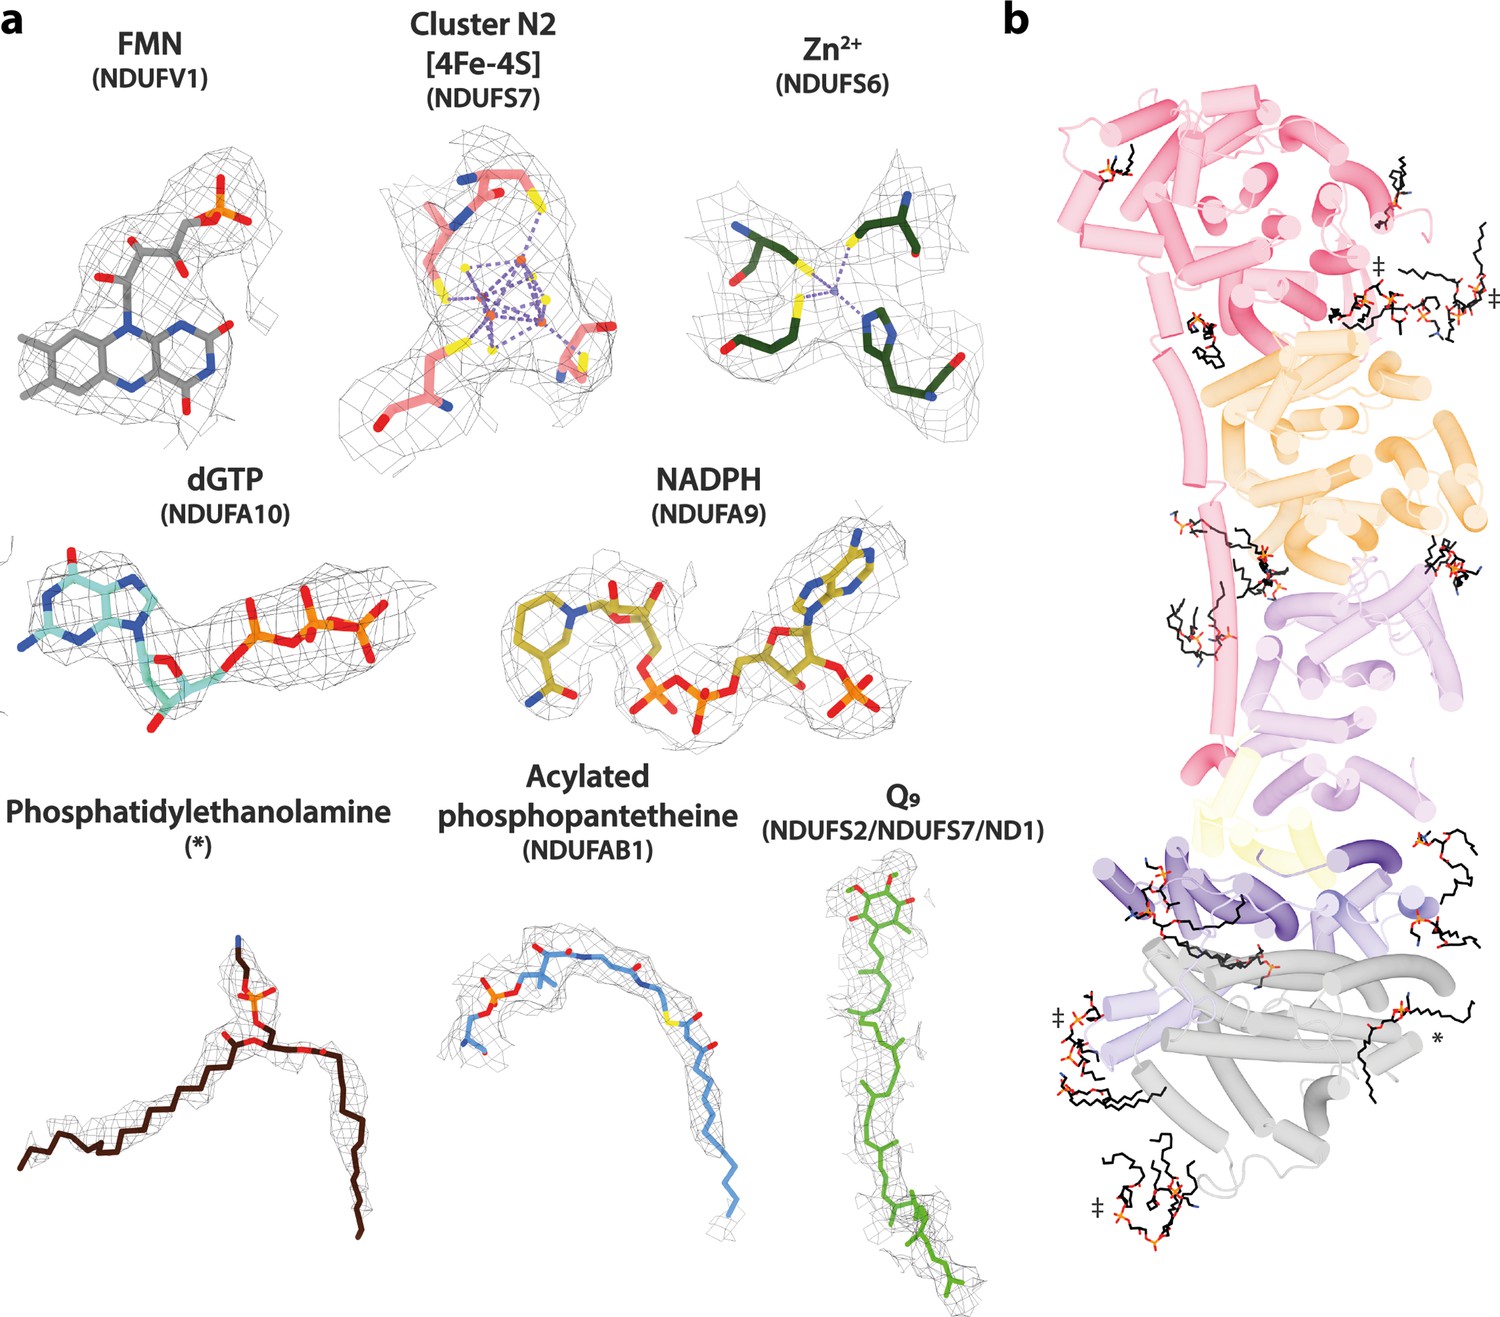
Cryo-EM densities and models for ligands and phospholipids observed in Drosophila complex I.
The densities and models shown are all from the Dm1 active state structure. (a) Cryo-EM densities of cofactors, ions, post-translational modifications, and phospholipids. Cryo-EM densities are shown at map thresholds of 0.006–0.013 in UCSF ChimeraX (Pettersen et al., 2021). (b) A top-down view from the matrix of 23 phospholipid molecules (black) modelled in the Dm1 structure. Asterisk (*) indicates the phosphatidylethanolamine shown in panel (a). Diesis (‡) indicates modelled cardiolipins. Only core membrane subunits are shown and coloured as in Figure 1.
Figure 1—figure supplement 5
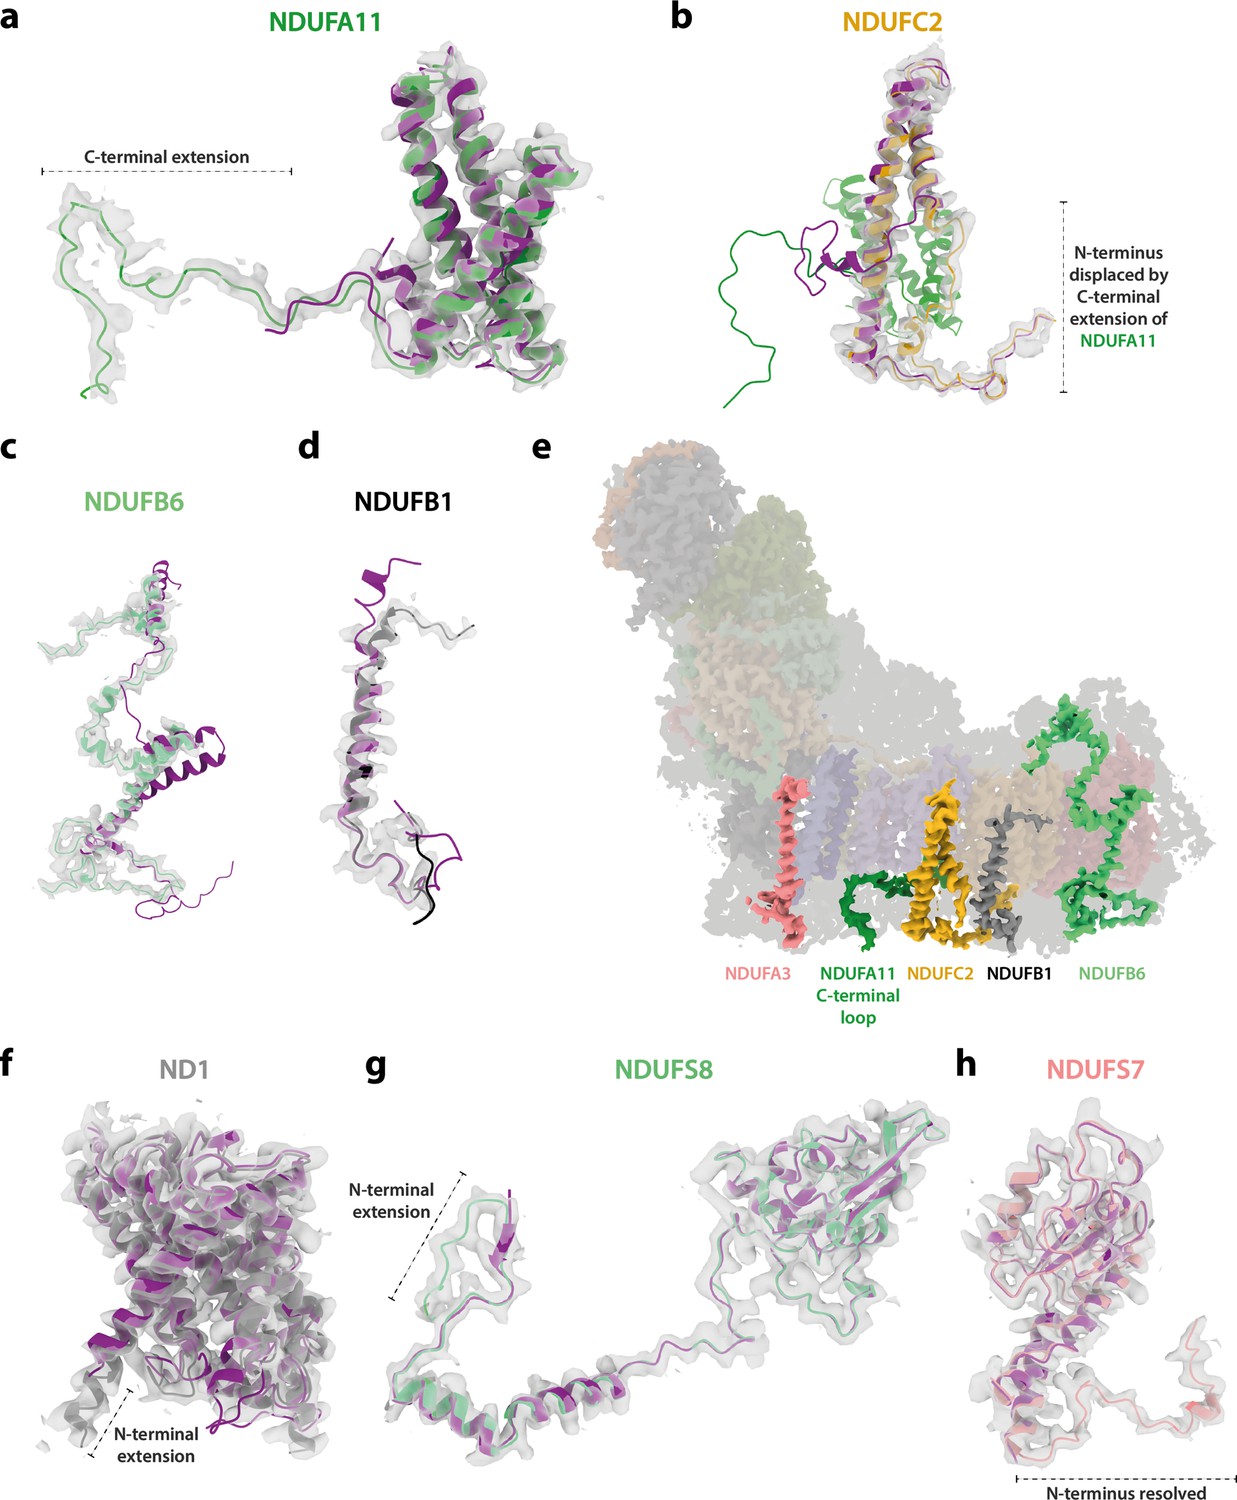
Cryo-EM densities and models for Drosophila-specific subunit extensions and conformations.
The densities and models shown are all from the Dm1 active state structure. (a) C-terminal extension of subunit NDUFA11 in comparison to the mammalian enzyme. (b) The N-terminus of NDUFC2, at the interface between ND2 and NDUFB5 in the mammalian enzyme, is displaced by the extended C-terminal loop of NDUFA11. (c, d) Conformational differences between the active-state structures of mammalian and Drosophila complex I at subunits (c) NDUFB6 and (d) NDUFB1. (e) Subunits that differ substantially between the mammalian and Drosophila complexes (panels b–d) and subunit NDUFA3, (see Figure 1—figure supplement 6) are on the same side of the membrane domain of complex I. The 14 core subunits are shown in transparent colour, and supernumerary subunits are in grey. (f–, g) N-terminal extensions of subunits (f) ND1 and (g) NDUFS8 in Drosophila with respect to the mammalian subunits. (h) The conserved N-terminal loop of subunit NDUFS7 is well-resolved and modelled for the first time. In all panels (except for e), the active-state bovine complex I model (purple; PDB ID: 7QSK) (Chung et al., 2022b) is aligned to the respective Dm1 active-state Drosophila subunit model (coloured). Cryo-EM densities of the Drosophila map are shown at a map threshold of 0.013 in UCSF ChimeraX (Pettersen et al., 2021).
Figure 1—figure supplement 6
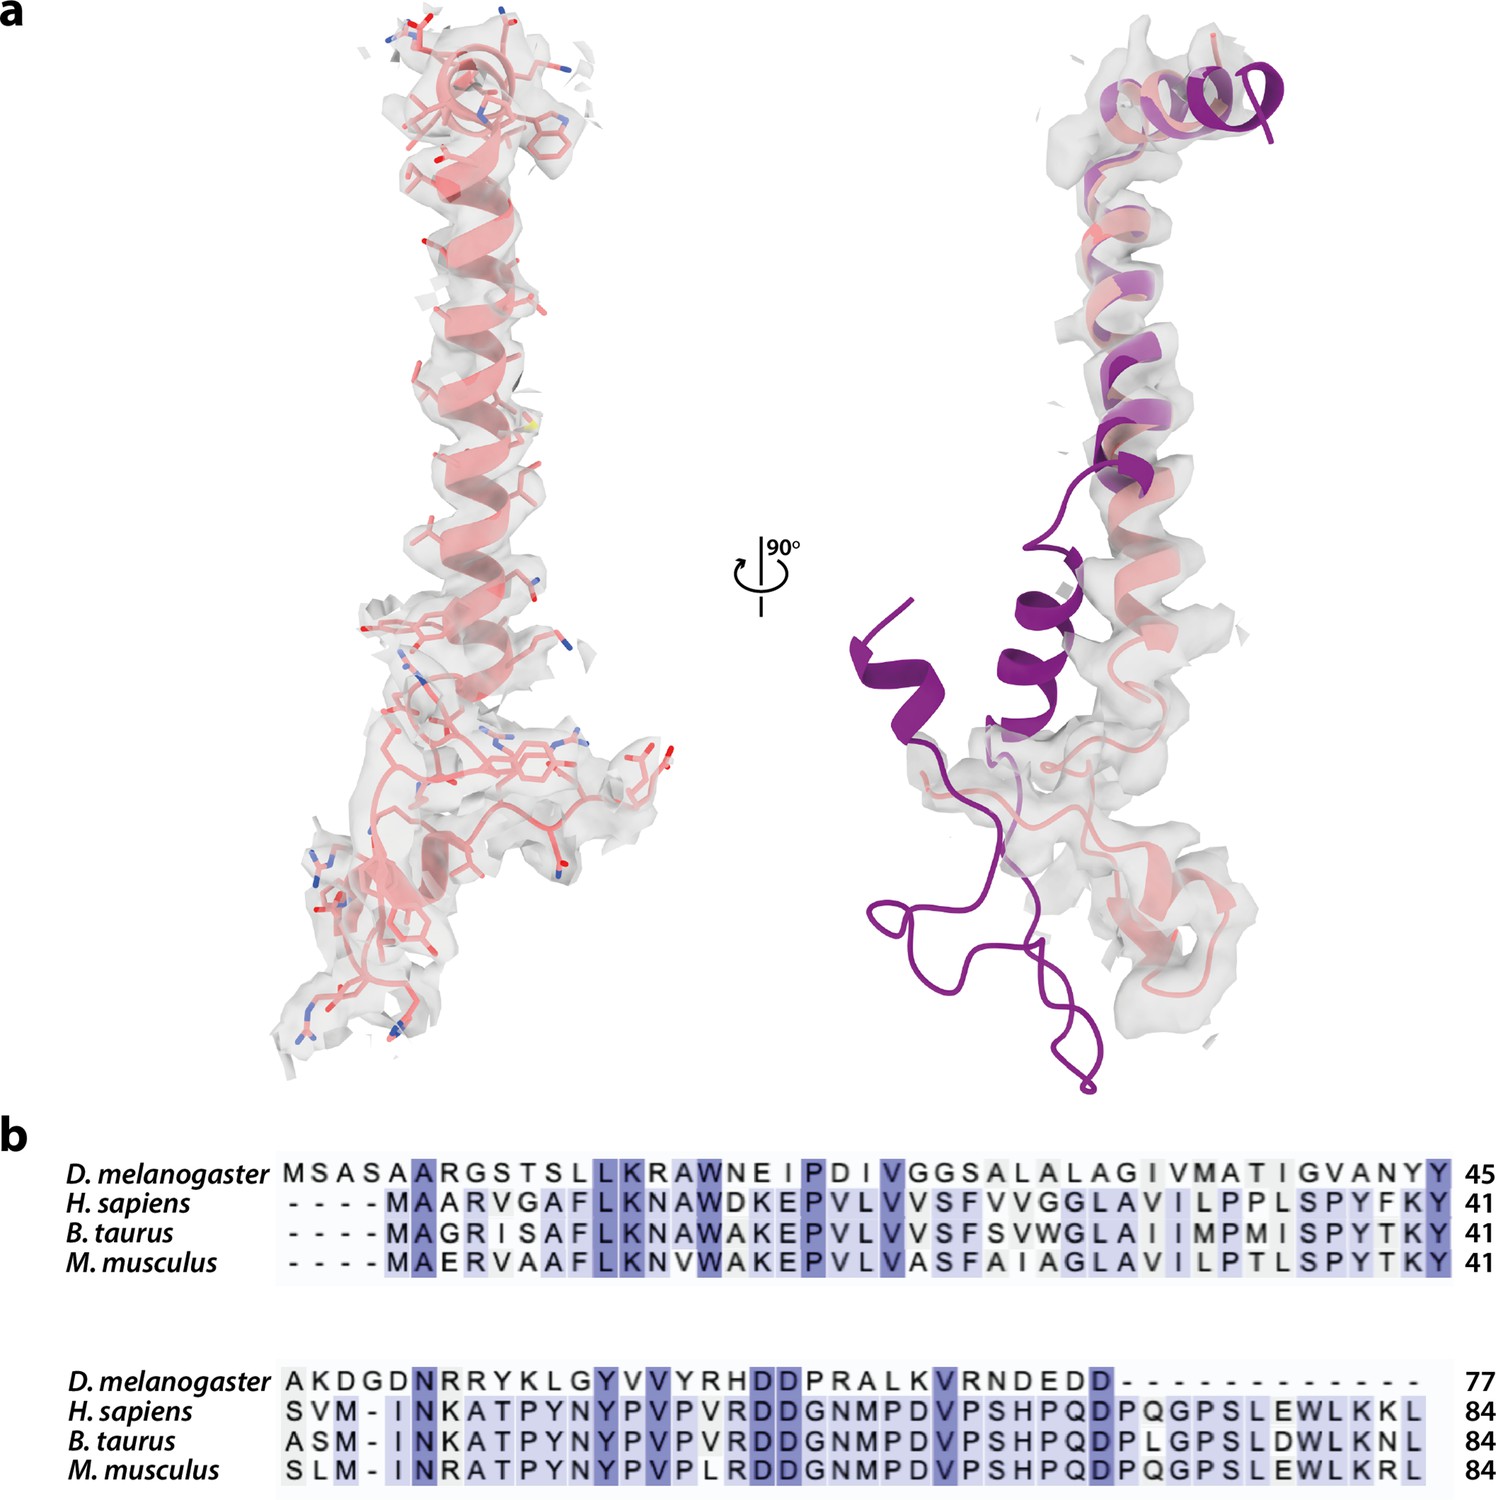
Cryo-EM density and model for subunit NDUFA3 in Drosophila complex I.
The density and model are from the Dm1 active state. (a) Cryo-EM density of Drosophila NDUFA3 in two orthogonal views at a map threshold of 0.013 in UCSF ChimeraX (Pettersen et al., 2021). Left: the structure of Drosophila NDUFA3 (pink) with side chains shown. Right: the structure of mammalian NDUFA3 (purple; PDB ID: 7QSK) (Chung et al., 2022b) aligned to the Drosophila subunit. (b) Sequence alignment of the Drosophila NDUFA3 subunit with a selection of mammalian species. Residues are coloured by similarity. UniProt IDs used for multiple sequence alignment in Clustal Omega 1.2.4 (Sievers et al., 2011): Drosophila melanogaster, Q9W380 (Dmel gene CG9034), Homo sapiens, O95167, Bos taurus, Q02371, Mus musculus, Q9CQ91.
Figure 2 with 2 supplements
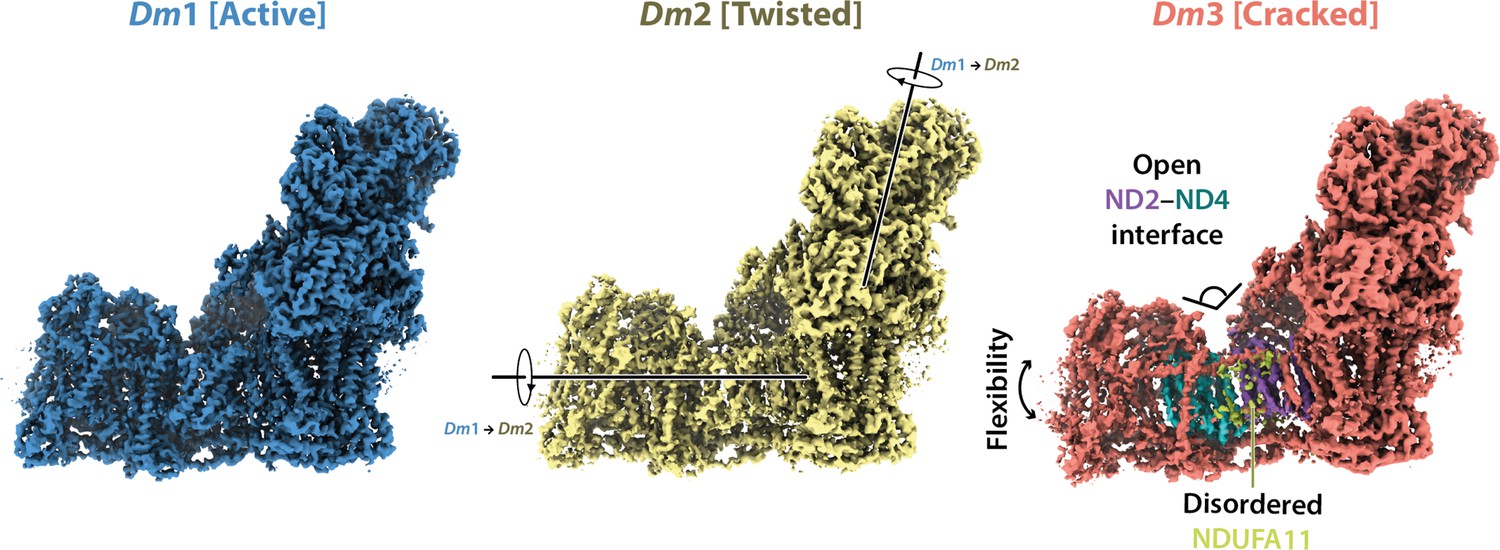
Global comparison between the three states of Drosophila complex I.
Side views of the three Drosophila complex I cryo-EM maps identified by 3D classification are shown with global motions between the three states indicated. States Dm1 and Dm2 are related by a twisting motion of the hydrophilic and membrane domains about the ND1-containing ‘heel’ subdomain. States Dm2 and Dm3 are related by ‘cracking’ open of the ND2–ND4 interface in Dm3. Cryo-EM densities are shown at map thresholds of 0.013 (Dm1), 0.014 (Dm2), and 0.015 (Dm3) in UCSF ChimeraX (Pettersen et al., 2021).
Figure 2—figure supplement 1
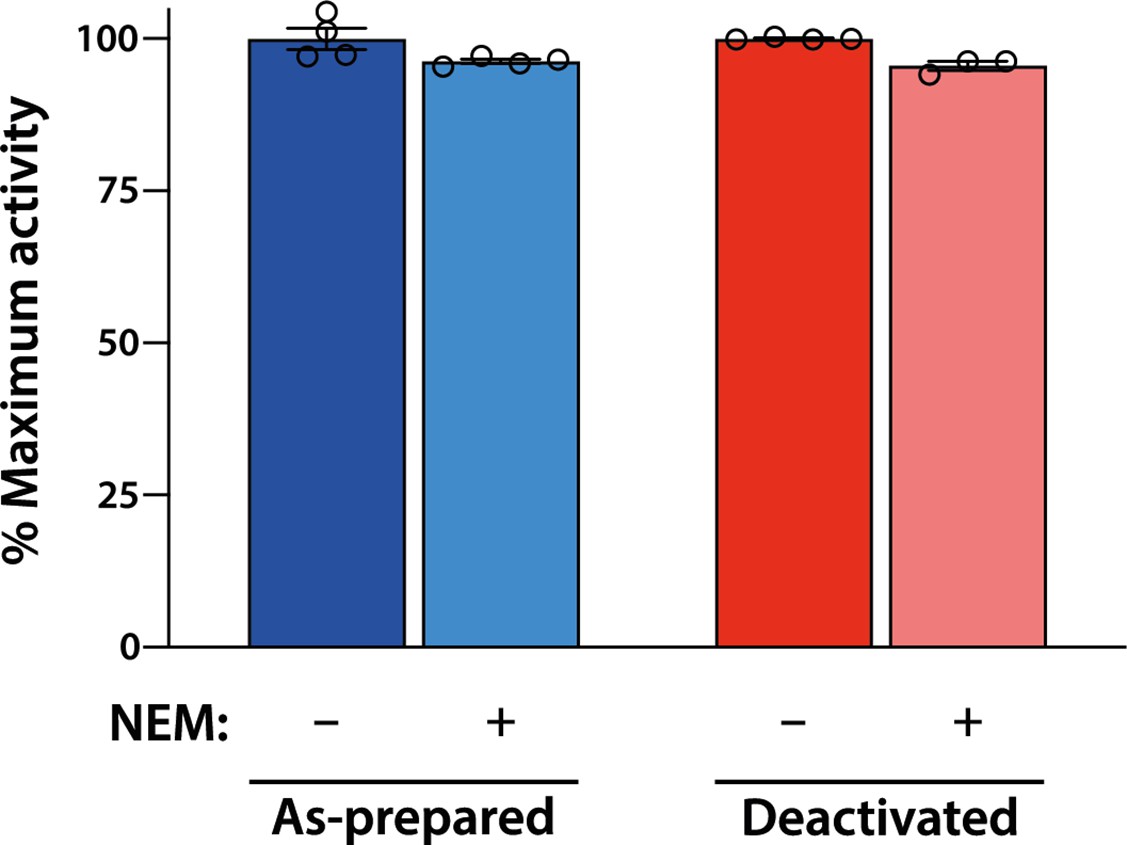
The N-ethylmaleimide (NEM) assay does not reveal a mammalian-type deactive state for Drosophila complex I.
Samples of ‘as-prepared’ (blue) or ‘deactivated’ (red) Drosophila mitochondria were treated with NEM to determine the sensitivity of the rate of catalysis (see 'Materials and methods' for details). The rates observed did not change materially following NEM treatment, indicating that a mammalian-type deactive state is not present, even following a deactivation treatment (incubation at 37°C for 30 min). All measurements are normalised to the maximum NADH:O2 rate for each set (as-prepared = 0.16 μmol min−1 mg−1, deactivated = 0.14 μmol min−1 mg−1) and shown as mean averages with error (± S.E.M.) values from three or four technical replicates.
Figure 2—figure supplement 2
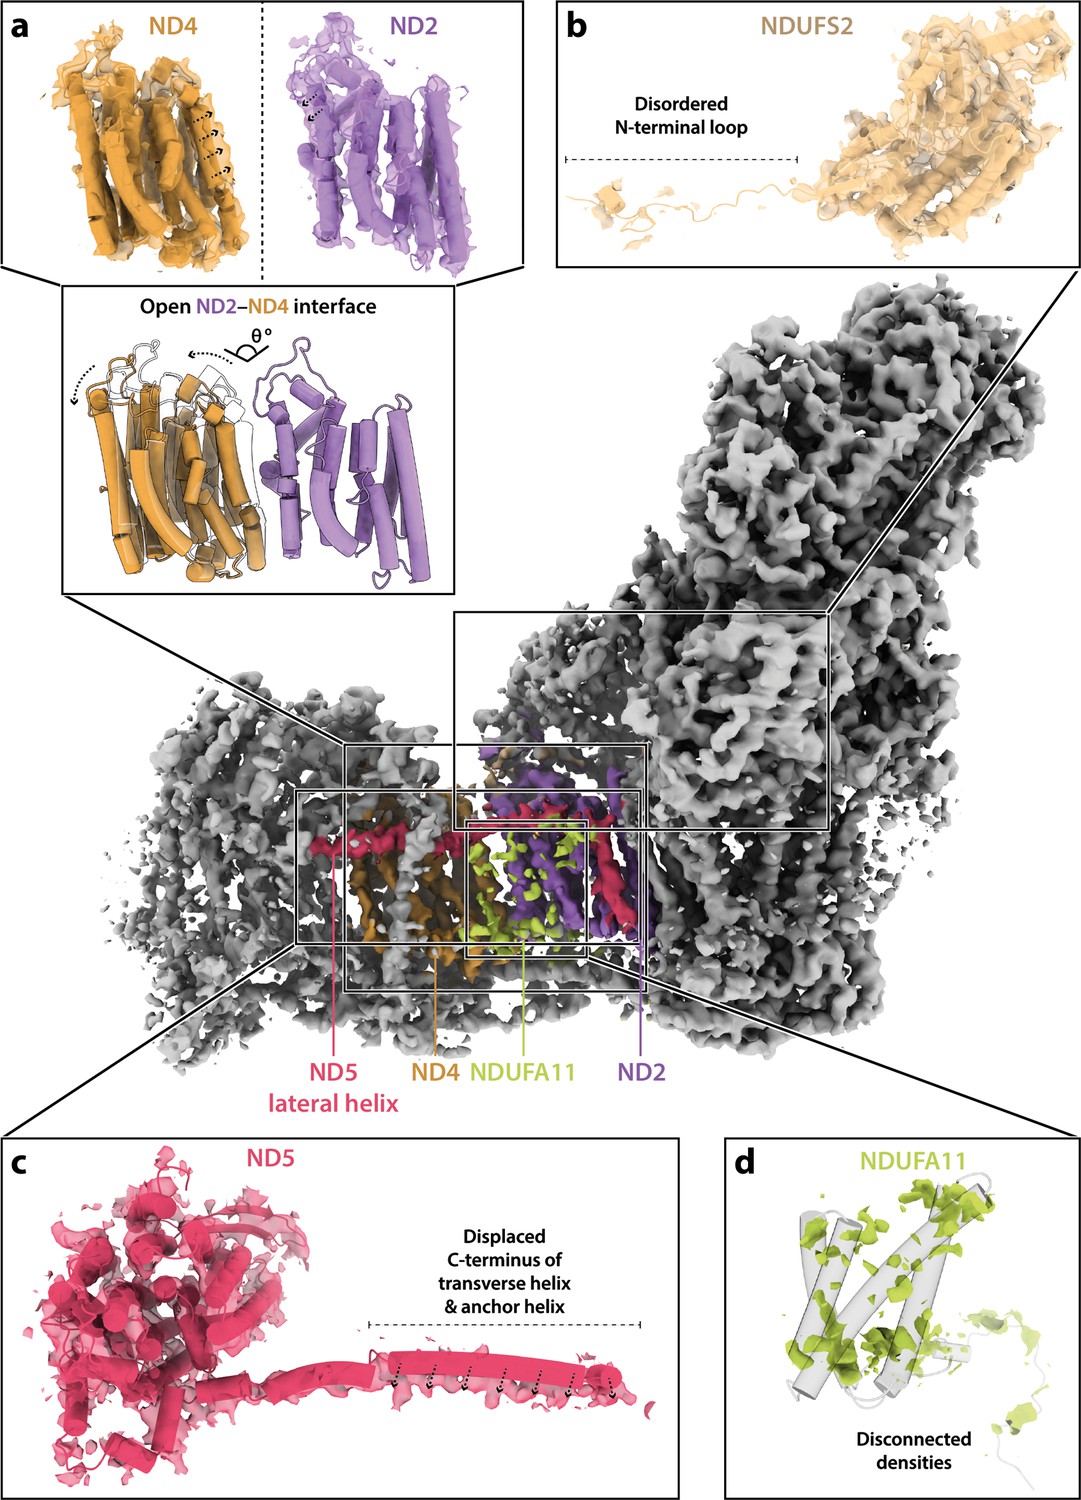
Structural features of the Dm3 state of Drosophila complex I.
In all panels. Dm2 subunit models are shown rigid-body fitted into the Dm3 cryo-EM map. (a) The ND2 and ND4 subunits rotate against each other and move apart in the Dm3 state. In the top panels, the arrows indicate the inward collapse of the interface helices, and in the bottom panel the white transparent structure shows the ND2 subunit in the Dm2 state (with the structures aligned to ND4) to show the extent of the movement. (b) The N-terminal loop of NDUFS2, which is ordered in the Dm1 and Dm2 states, is disordered in the Dm3 structure. (c) As the ND2–ND4 interface opens, the C-terminal section of the ND5 transverse helix and the anchor transmembrane helix (TMH) are displaced. (d) The density for subunit NDUFA11 in the Dm3 state is disordered and fragmented. Cryo-EM densities are shown at map thresholds of 0.013–0.015 in UCSF ChimeraX (Pettersen et al., 2021).
Figure 3 with 1 supplement
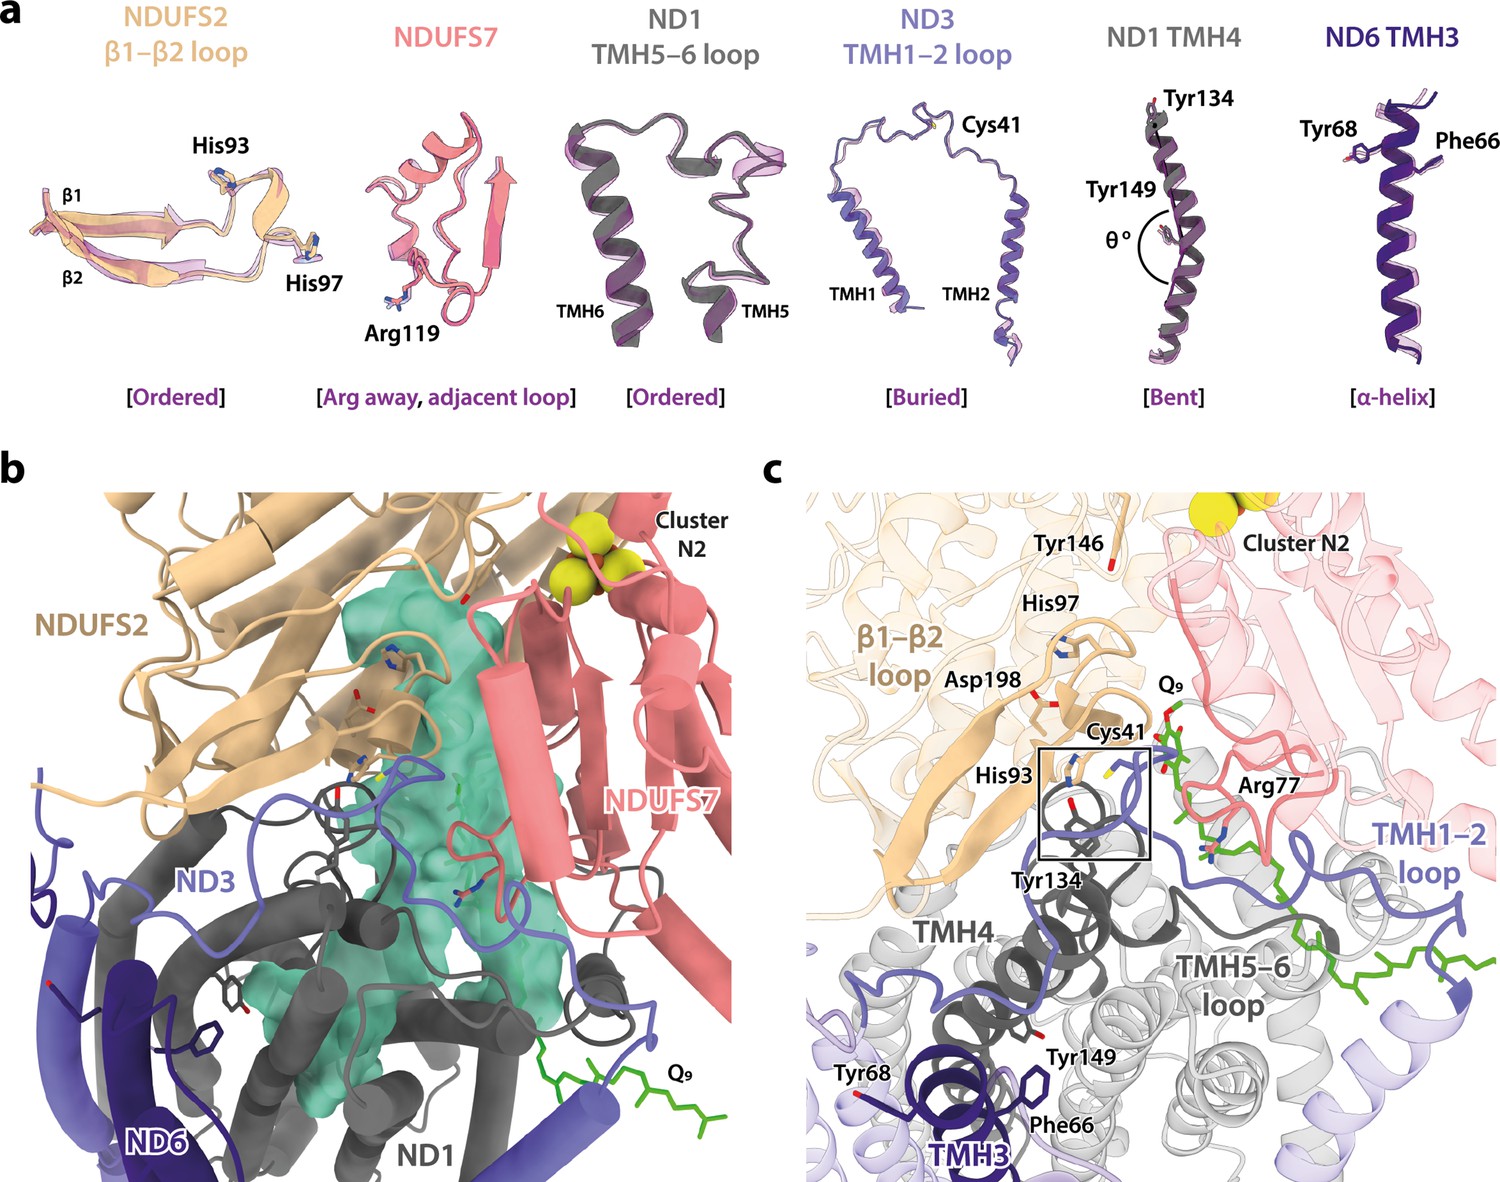
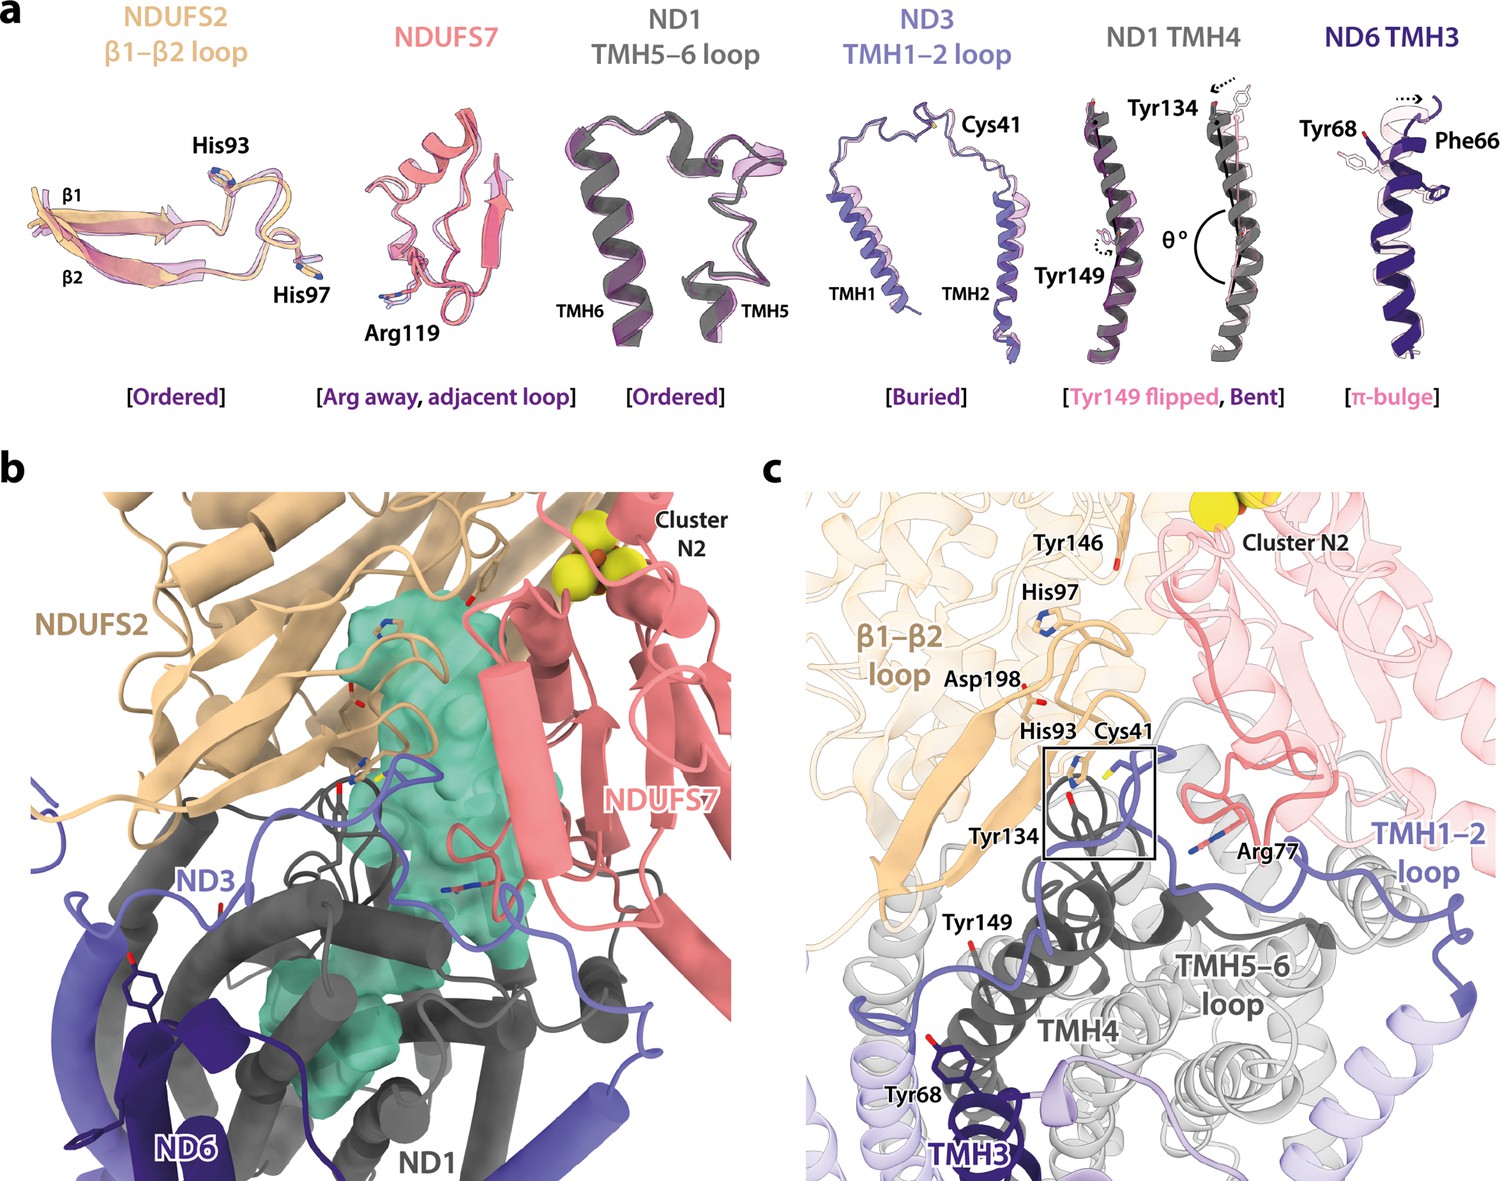
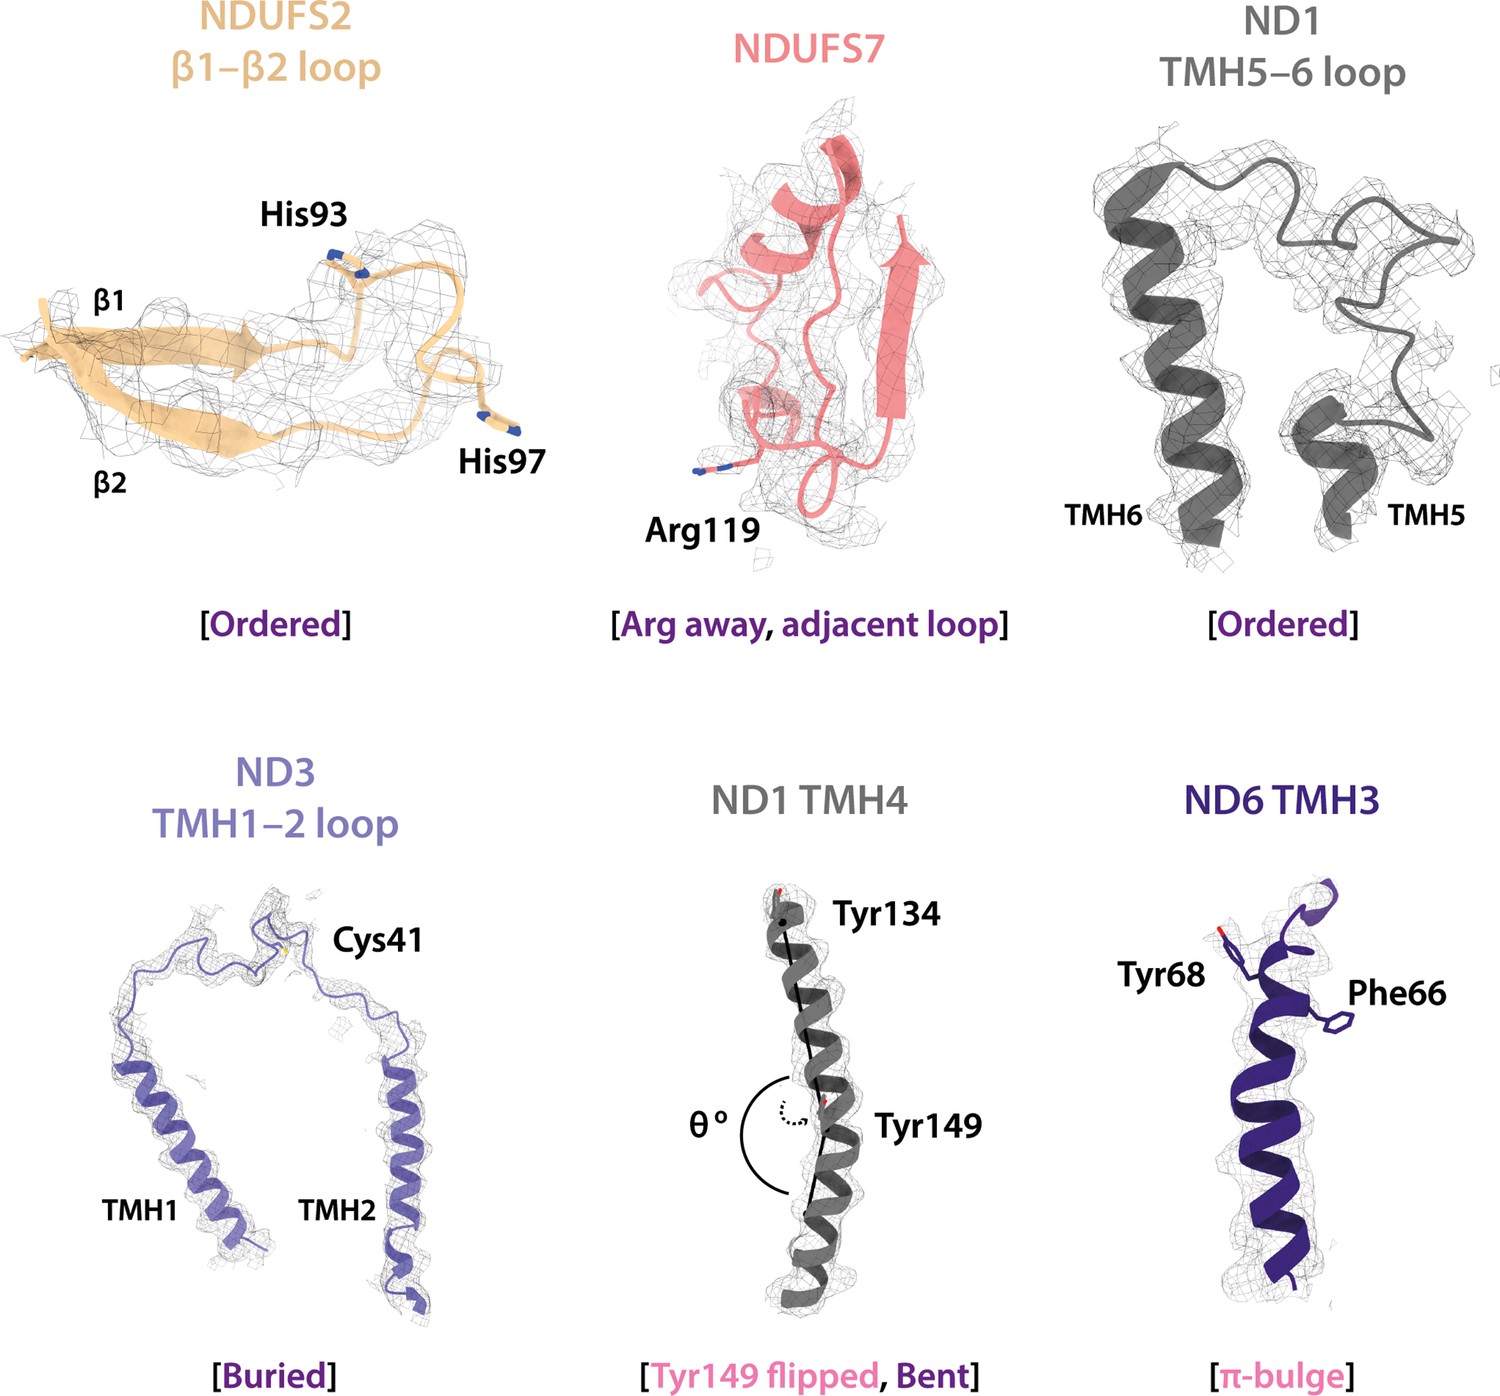
Local structural elements show that Dm1 is the active resting state of Drosophila complex I.
(a) The local elements in the core subunits that show the Dm1 complex is in the active state are individually compared against an active-state bovine structure (transparent purple; PDB ID: 7QSK) (Chung et al., 2022b). Active state-specific key local features are indicated in square brackets. The same features are highlighted and labelled in (b) and (c), respectively, showing that subunits NDUFS2, NDUFS7, ND1, ND3, and ND6 encapsulate a fully structured and sealed Q-binding cavity (aquamarine surface; detected by CASTp; Tian et al., 2018) with a Q9 molecule bound. The Coulomb potential density for Q9 is shown in Figure 1—figure supplement 4. The box in (c) denotes the trigonal junction (ND3-Cys41, NDUFS2-His93, and ND1-Tyr134).
Figure 3—figure supplement 1
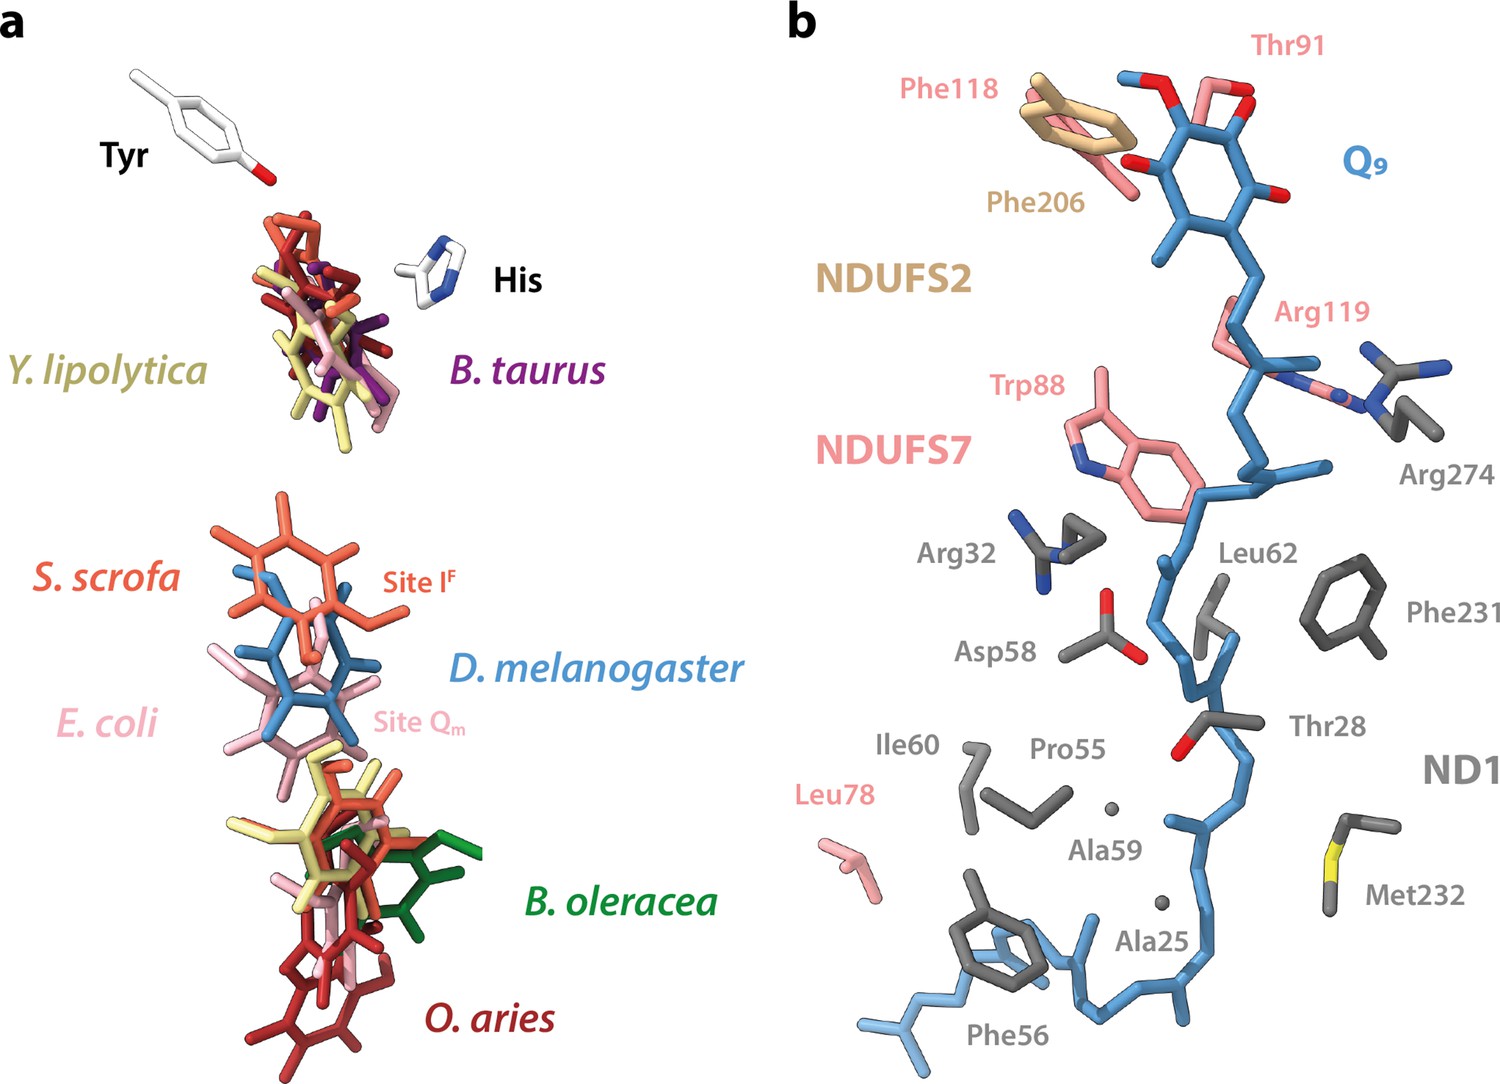
Comparison of the position of the bound ubiquinone in the Dm1 state with the positions of ubiquinone molecules bound in other structures.
(a) Ubiquinone headgroups from Q10, Q9, Q1, and dQ bound in cryo-EM structures of complex I. Q9 bound in Dm1 is shown in blue. Models are overlaid on subunit NDUFS2. Positions of Tyr and His are from the bovine active-state model. PDB IDs: 7QSK (Chung et al., 2022b) (Bos taurus, purple), 6ZKC and 6ZKD (Kampjut and Sazanov, 2020) (Ovis aries, red), 7V2R (Gu et al., 2022) (Sus scrofa, orange), 7A23 (Soufari et al., 2020) (Brassica oleracea var. botrytis, green), 6RFR (Parey et al., 2019) and 7O6Y (Parey et al., 2021) (Yarrowia lipolytica, beige), and 7Z7S and 7P64 (Kravchuk et al., 2022) (Escherichia coli, light pink). (b) The environment of the bound Q9 in the Dm1 structure, showing residues within 4 Å of the substrate.
Figure 4
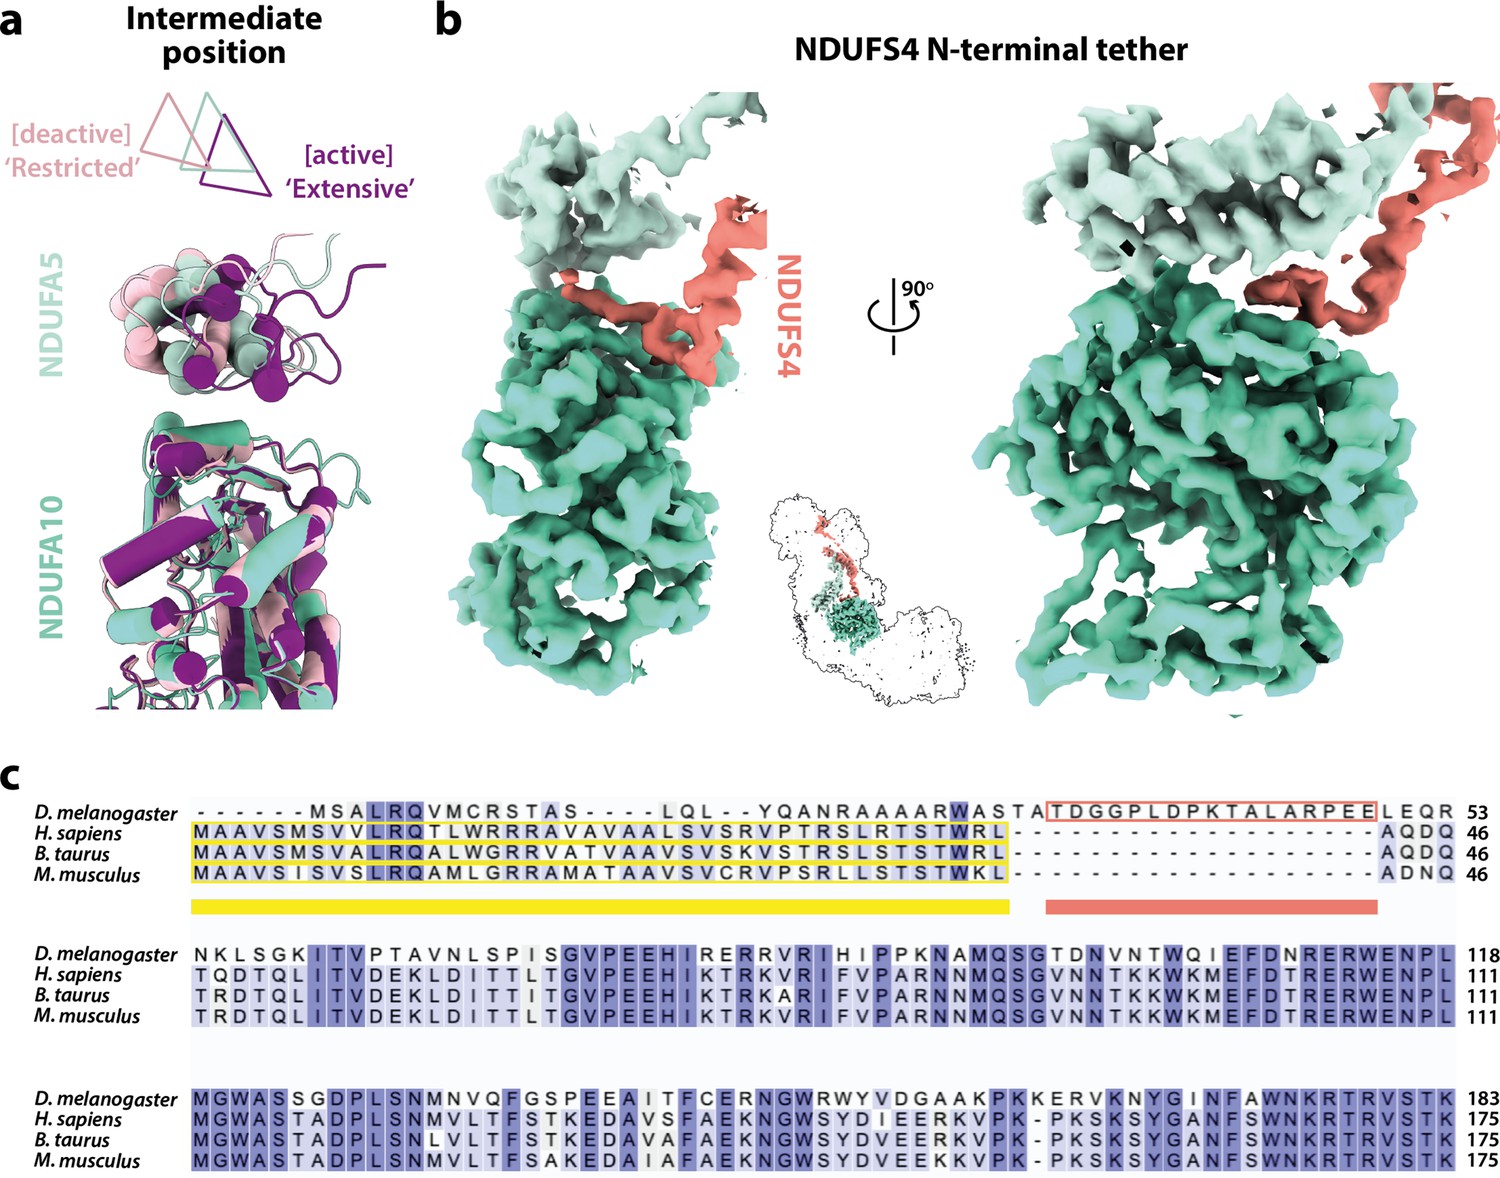
The domain interface between subunits NDUFA5, NDUFA10, and NDUFS4 in Drosophila complex I.
(a) The interface between subunits NDUFA5 (mint) and NDUFA10 (turquoise) of Drosophila complex I is compared against the active (purple; PDB ID: 7QSK) and deactive (light pink; PDB ID: 7QSM) states of bovine complex I (Chung et al., 2022b), displaying an ‘intermediate’ conformation. Triangles indicate positions of the three-helix bundles in NDUFA5. The structures are aligned to subunit NDUFA10. (b) The extended N-terminal loop of NDUFS4 (salmon) specific to Drosophila complex I is tethered between NDUFA5 and NDUFA10, locking them in place. Inset shows the positions of the three subunits in complex I. The active-state (Dm1) Drosophila complex I map is shown at a threshold of 0.013 in UCSF ChimeraX (Pettersen et al., 2021). (c) Sequence alignment of NDUFS4 across a selection of NDUFA5/NDUFA10-containing organisms. Residues are coloured by similarity. Known mitochondrial targeting sequences are highlighted in yellow, and the modelled N-terminal extension of NDUFS4 in the Dm1 active-state structure is highlighted in salmon. UniProt IDs used for the alignment in Clustal Omega 1.2.4 (Sievers et al., 2011): Drosophila melanogaster, Q9VWI0, Homo sapiens, O43181, Bos taurus, Q02375, Mus musculus, Q9CXZ1.
Figure 5 with 1 supplement
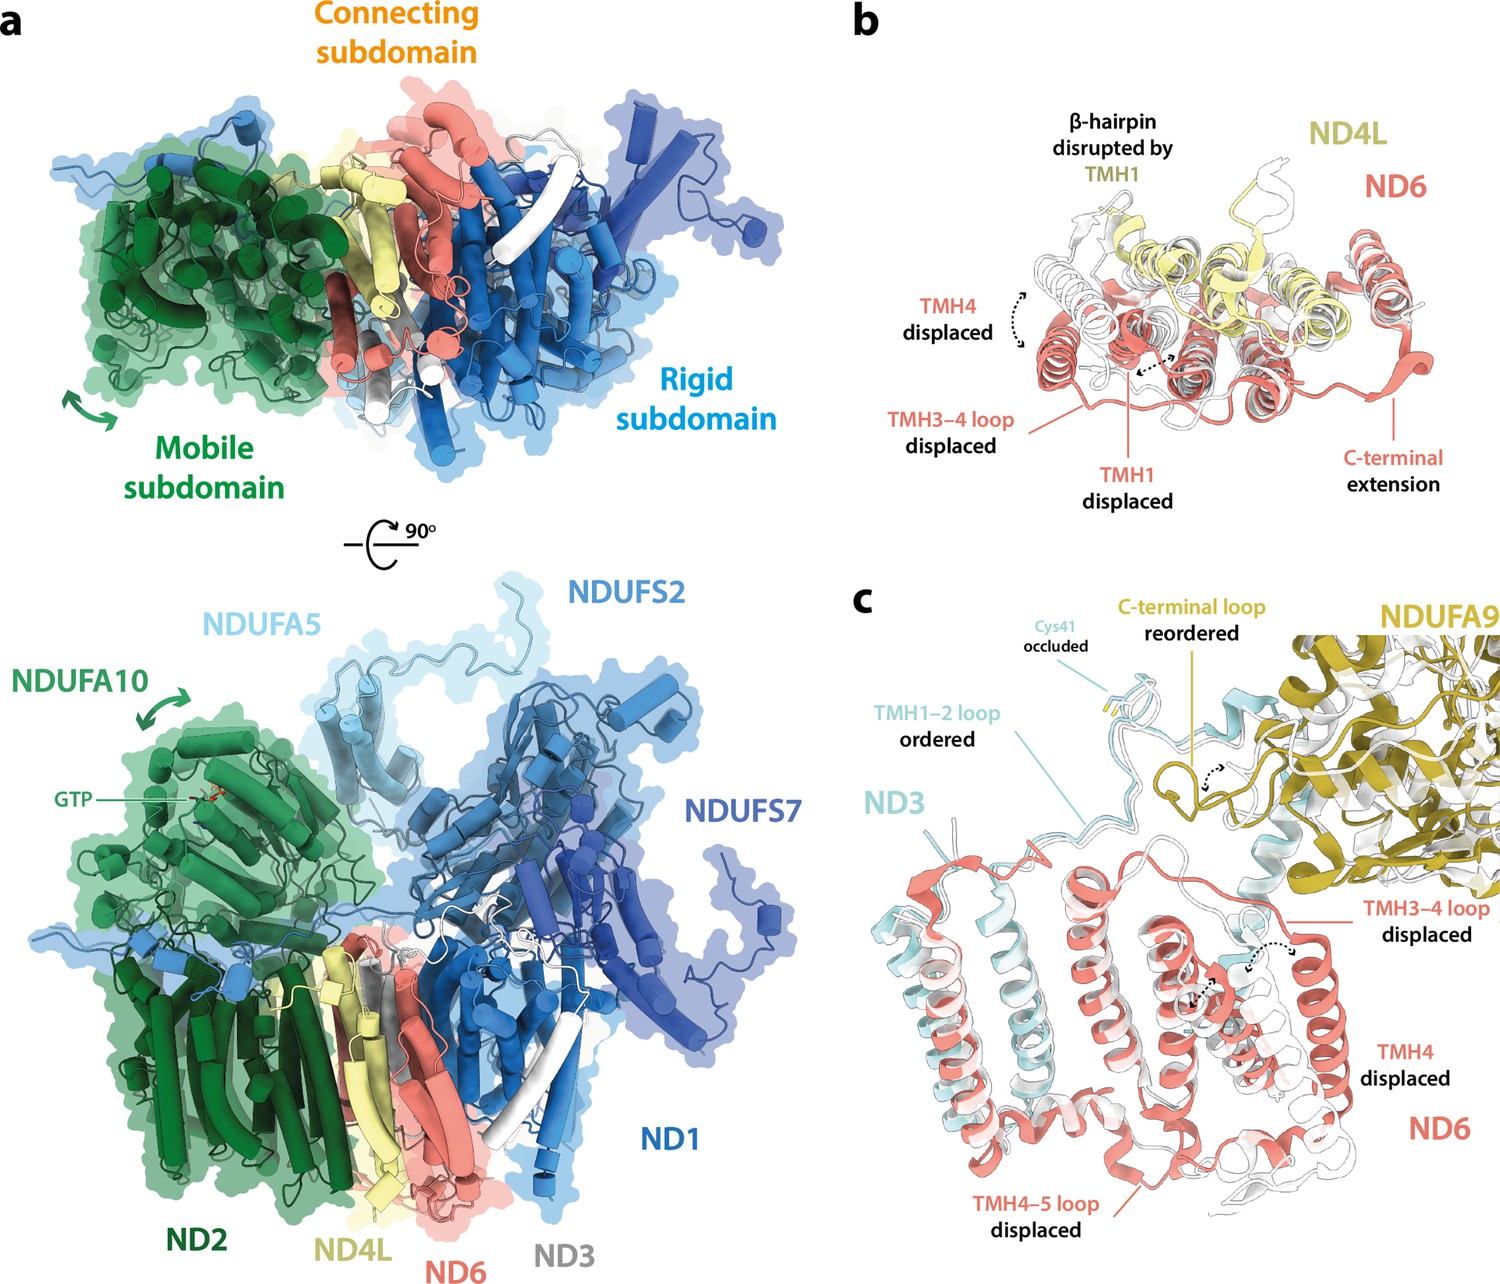
The structure of subunit ND6 and the connecting subdomain between subunits ND1 and ND2 alters the relative domain dispositions in the Drosophila active state relative to the mammalian active state.
(a) The structures of subunits NDUFS2, NDUFS7, NDUFA5, and ND1 are tightly conserved between the Drosophila (Dm1, solid cartoon) and mammalian (PDB ID: 7QSK [Chung et al., 2022b], transparent cartoon) active states, forming a rigid subdomain. Subunits ND3, ND6, and ND4L form a connecting subdomain that differs, shifting the position and orientation of the mobile subdomain containing subunits ND2 and NDUFA10. The altered connecting domain changes the domain interface between NDUFA5 and NDUFA10. The models for the Drosophila and mammalian complexes are aligned on subunit NDUFS2 and shown alongside a flat surface representation of the Drosophila model. (b, c) Changes to the structure of the ND6 subunit, plus structural changes in adjacent subunits. The models for the Drosophila (Dm1, coloured) and mammalian (PDB ID: 7QSK [Chung et al., 2022b], white) active states are overlaid on subunit ND6.
Figure 5—figure supplement 1
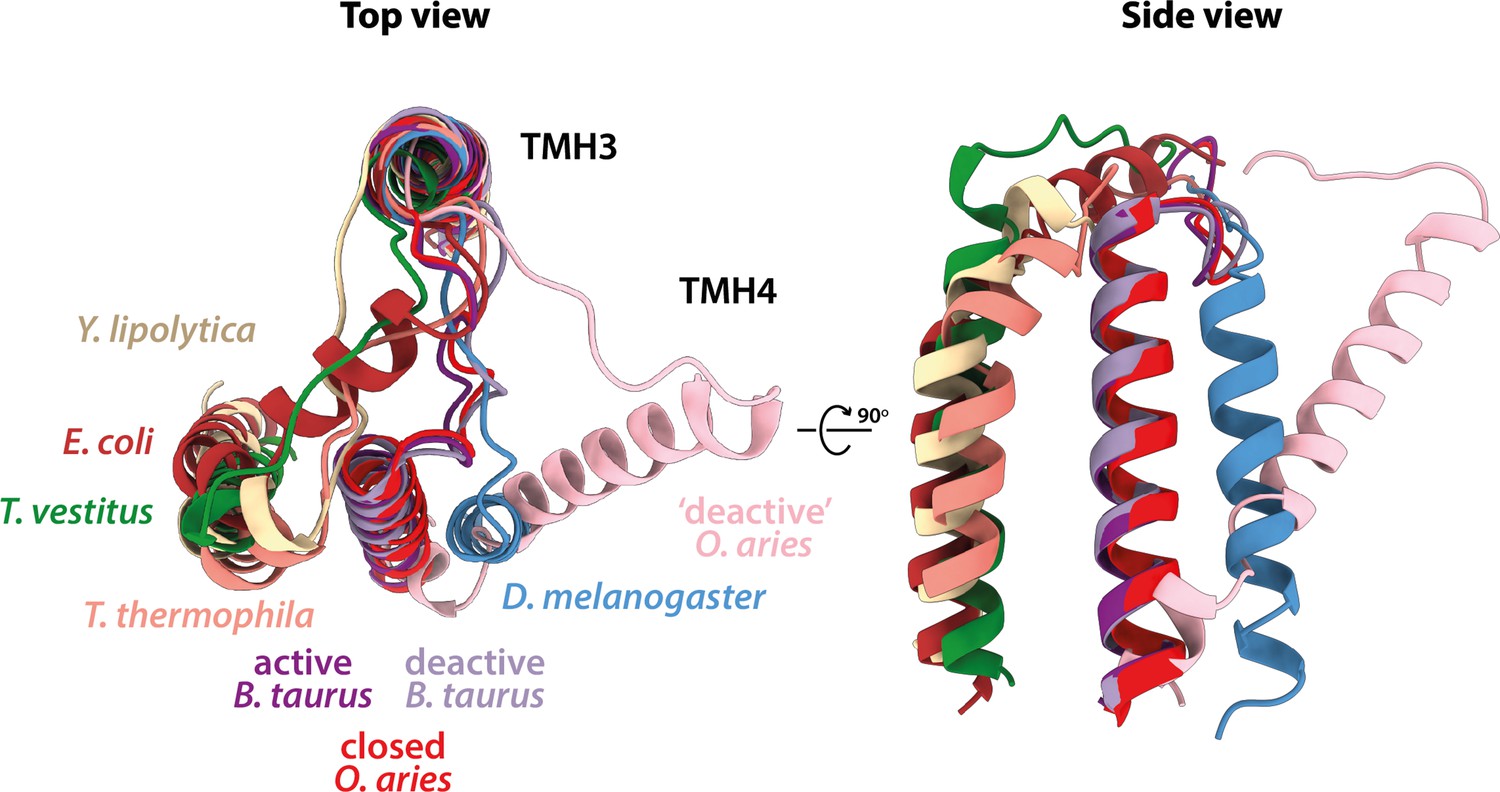
Comparison of the position of ND6-TMH4 in the Dm1 state with the positions of ND6-TMH4 in other structures.
Truncated ND6 models of Drosophila melanogaster (Dm1, blue), Bos taurus (PDB ID: 7QSK, active state, purple; 7QSM, deactive state, light purple Chung et al., 2022b), Ovis aries (PDB ID: 6ZKO, closed state, red; 6ZKS, open1 state of the ‘deactive’ dataset, light pink Kampjut and Sazanov, 2020), Yarrowia lipolytica (PDB ID: 6YJ4, beige Grba and Hirst, 2020), Tetrahymena thermophila (PDB ID: 7TGH, orange Zhou et al., 2022), Thermosynechococcus vestitus (PDB ID: 6HUM, green Schuller et al., 2019), and Escherichia coli (PDB ID: 7Z7S, closed, brick red Kravchuk et al., 2022), showing TMH3 and TMH4 only (left) and TMH4 only (right). All models are aligned to the Drosophila ND6 subunit.
Figure 6 with 1 supplement
Local structural elements show that the Dm2 state of Drosophila complex I most closely resembles the mammalian active state, with only two deactive-like features in the membrane domain.
(a) The local elements in the core subunits, individually compared against an active-state bovine structure (transparent purple; PDB ID: 7QSK) (Chung et al., 2022b), show that all ubiquinone-binding site features of the Dm2 complex are in the active state, whereas in the membrane domain ND1-Tyr149 and ND6-TMH3 match the bovine deactive state (transparent pink; PDB ID: 7QSM) (Chung et al., 2022b). Active state-specific key local features are indicated in square brackets in purple and deactive state-specific features in pink. The same features are highlighted and labelled in (b) and (c), respectively, showing that subunits NDUFS2, NDUFS7, ND1, ND3, and ND6 encapsulate a fully structured and sealed Q-binding cavity (aquamarine surface; detected by CASTp; Tian et al., 2018). The box in (c) denotes the trigonal junction (ND3-Cys41, NDUFS2-His93, and ND1-Tyr134).
Figure 6—figure supplement 1
Local structural elements in the Dm2 state are conserved in Dm3.
The local elements in the core subunits that indicate the active/deactive status of the Dm3 complex are highlighted and labelled, compared against the respective cryo-EM densities. Only two deactive features are observed (ND1-Tyr149 and ND6-TMH3). Subunit models shown are the Dm2 model rigid-body fitted into the Dm3 cryo-EM map. Active (purple) and deactive (light pink) state-specific key local features are indicated in square brackets. Cryo-EM densities are shown at map thresholds of 0.013–0.015 in UCSF ChimeraX (Pettersen et al., 2021).
Figure 7
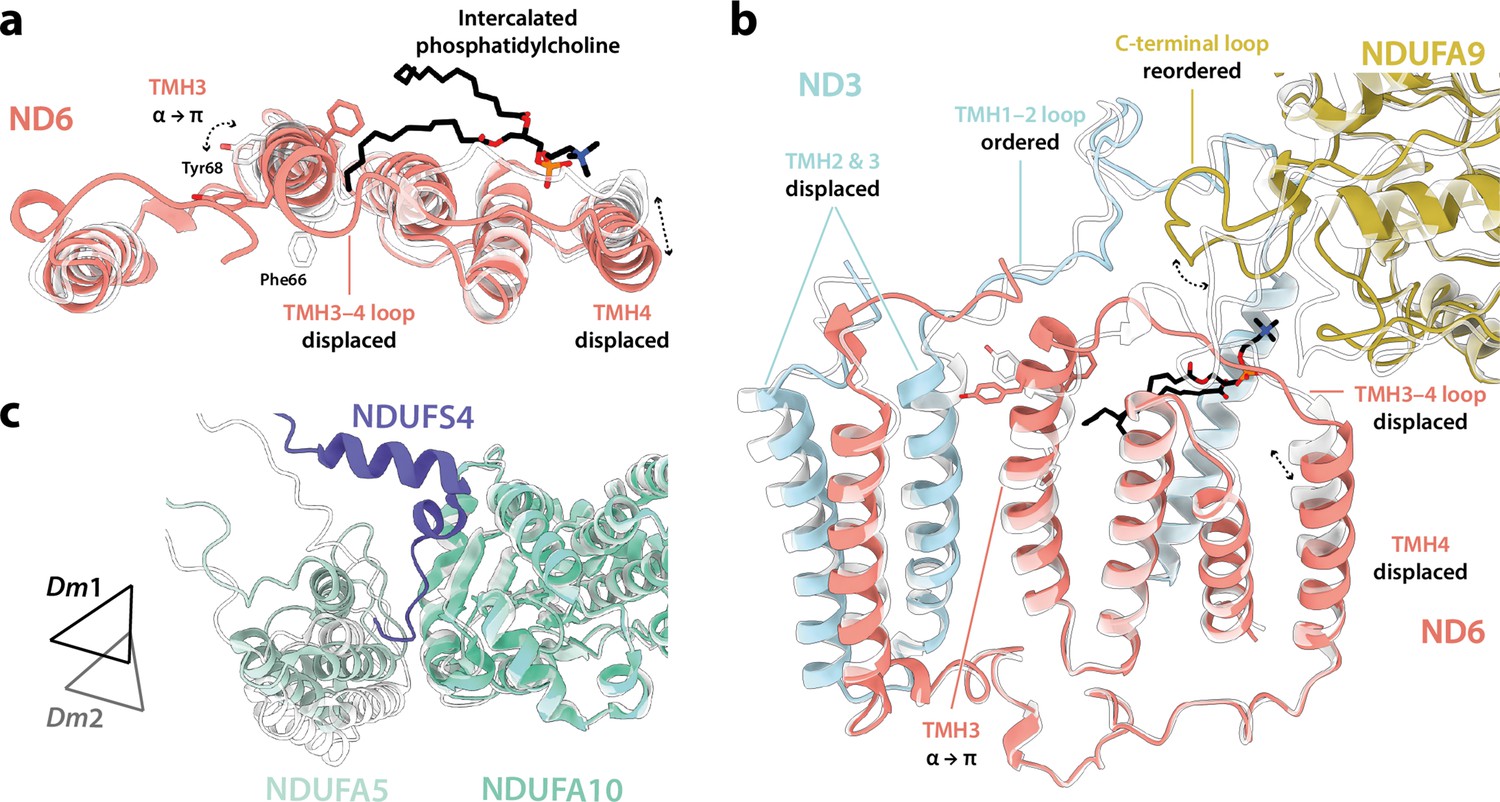
Differences between the Dm1 and Dm2 states at the connecting subdomain and at the domain interface between subunits NDUFA5, NDUFA10, and NDUFS4.
(a, b) Changes to the structure of the ND6 subunit, plus structural changes in adjacent subunits. The intercalated phosphatidylcholine molecule is present in the Dm1 state only. (c) The interface between subunits NDUFA5 (mint), NDUFA10 (turquoise), and NDUFS4 (slate) of the Dm1 state is compared against Dm2 (white). Triangles indicate positions of the three-helix bundles in NDUFA5. The N-terminal NDUFS4 tether occupies the interface in Dm1 only, and the NDUFA5/NDUFA10 interface area is decreased in Dm2. The models for the Dm1 (coloured) and Dm2 (white) states are overlaid on subunit ND6 in (a) and (b), and on subunit NDUFA10 in (c).
Figure 8
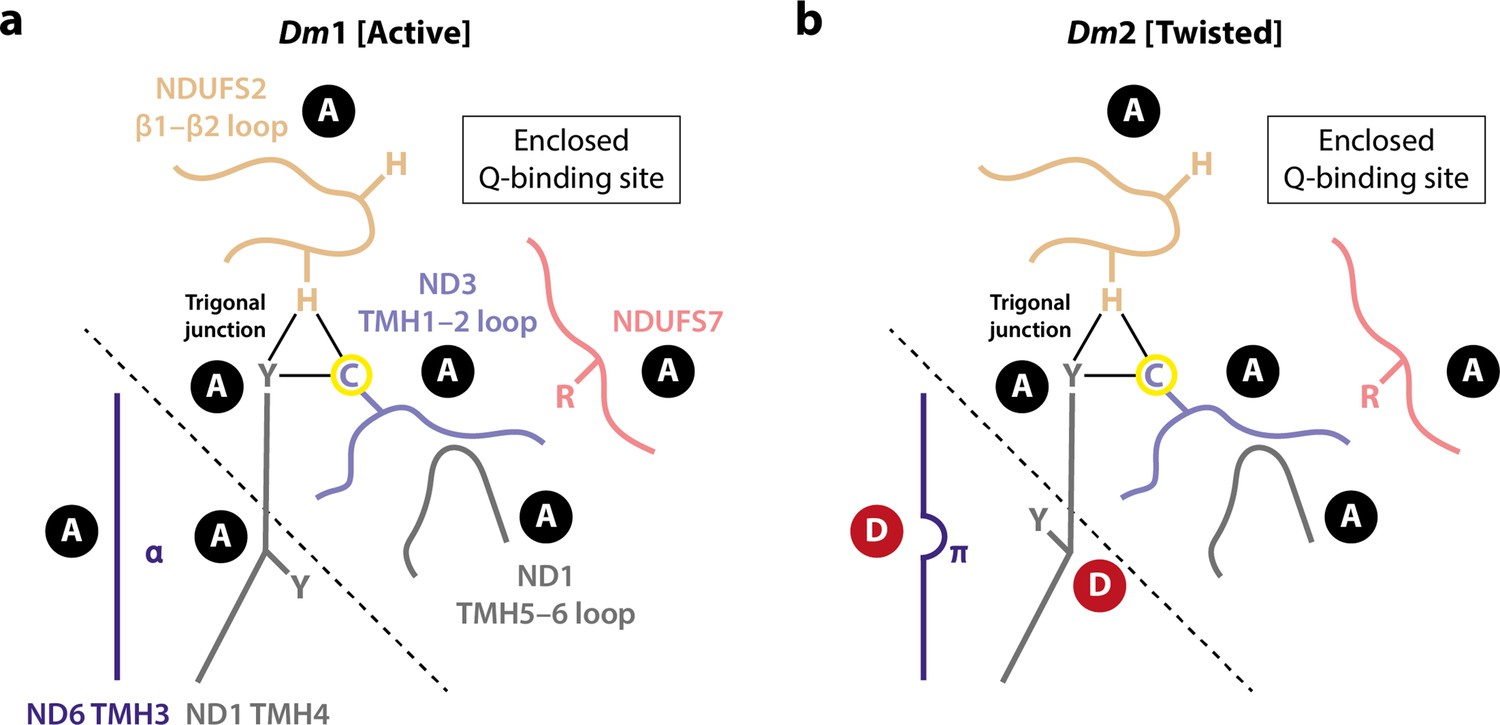
Schematic representation of the status of local active/deactive elements in the (a) Dm1 and (b) Dm2 states of Drosophila complex I.
Local elements that change conformation in the mammalian active/deactive transition are shown and labelled as A for active and D for deactive, respectively. In the Dm2 state, ND6-TMH3 and ND1-TMH4-Tyr149 are in the D conformation. The boundary of the A and D regions is marked with a dashed line. In the mammalian deactive state, the top section of ND1-TMH4 moves, straightening the helix and resulting in loss of the trigonal junction (ND3-Cys41, NDUFS2-His93, and ND1-Tyr134), destructuring of the NDUFS2, ND3, and ND1 loops and restructuring of the NDUFS7 loop and NDUFS7-Arg119. ND3-Cys41, the derivatisable marker of the deactive state in mammalian/eukaryotic complex I (Galkin et al., 2008), is indicated with a yellow circle.
Tables
Table 1
Cryo-EM data collection, refinement, and validation statistics for the three states of Drosophila complex I.
| Drosophila melanogaster complex I dataset | |||
|---|---|---|---|
| Data collection and processing | |||
| Magnification | 130,000 | ||
| Voltage (kV) | 300 | ||
| Electron exposure (e–/Å2) | 42 | ||
| Defocus range (μm) | –1.0 to –2.0 | ||
| Nominal pixel size (Å) | 1.07 | ||
| Calibrated pixel size (Å) | 1.048 | ||
| Symmetry imposed | C1 | ||
| Initial particle images (no.) | 194,538 | ||
| Final particle images (no.) | 63,471 | ||
| Classes | Dm1 [Active] | Dm2 [Twisted] | Dm3 [Cracked] |
| EMD-15936 | EMD-15937 | EMD-15938 | |
| PDB-8B9Z | PDB-8BA0 | ||
| Final particle images (no.) | 37,608 | 12,343 | 13,520 |
| Map resolution (Å) | |||
| FSC threshold: 0.143 | 3.28 | 3.68 | 3.96 |
| Map resolution range (Å) | 2.98–6.19 | 3.33–9.40 | 3.51–11.35 |
| Map sharpening B-factor (Å2) | 0 | 15 | 20 |
| Model statistics | |||
| Initial model (PDB ID) | 6G2J | 6G2J | |
| Model resolution (Å) | |||
| FSC threshold: 0.5 | 3.41 | 3.92 | |
| Model composition | |||
| Non-hydrogen atoms | 66,970 | 65,912 | |
| Protein residues | 8,178 | 8,136 | |
| Ligands | 39 | 22 | |
| Average B-factors (Å2) | |||
| Protein | 99 | 110 | |
| Ligand | 103 | 115 | |
| Root mean square deviations | |||
| Bond lengths (Å) | 0.006 | 0.007 | |
| Bond angles (°) | 0.726 | 0.783 | |
| MolProbity score | 1.60 | 2.04 | |
| All-atom clash score | 6.24 | 10.90 | |
| EMRinger score | 3.18 | 1.68 | |
| Rotamer outliers (%) | 0.00 | 0.00 | |
| Ramachandran plot | |||
| Favoured (%) | 96.18 | 91.97 | |
| Allowed (%) | 3.80 | 8.01 | |
| Outliers (%) | 0.02 | 0.02 | |
Key resources table
| Reagent type (species) or resource | Designation | Source or reference | Identifiers | Additional information |
|---|---|---|---|---|
| Gene (Drosophila melanogaster) | NDUFA3, Dmel gene CG9034 | FlyBase | UniProt ID: Q9W380 FlyBase ID: FBgn0040931 | |
| Biological sample (D. melanogaster) | isogenic w1118 | Bloomington Drosophila Stock Center | RRID:BDSC_6326 | |
| Chemical compound, drug | Fatty acid-free bovine serum albumin | Merck Millipore | CAS number: 9048-46-8 | |
| Chemical compound, drug | EDTA-free cOmplete protease inhibitor cocktail | Roche | COEDTAF-RO | |
| Chemical compound, drug | Dodecyl-β-D-maltoside (DDM) | Merck Milipore | CAS number: 69227-93-6 | |
| Chemical compound, drug | Asolectin from soy bean | Avanti | CAS number: 8030-76-0 | |
| Chemical compound, drug | CHAPS (3-((3-cholamidopropyl) dimethylammonio)–1-propanesulfonate) | Calbiochem | CAS number: 75621-03-3 | |
| Chemical compound, drug | NADH | Merck Millipore | CAS number: 606-68-8 | |
| Chemical compound, drug | Decylubiquinone (dQ) | Merck Millipore | CAS number: 55486-00-5 | |
| Chemical compound, drug | N-ethylmaleimide (NEM) | Merck Millipore | CAS number: 128-53-0 | |
| Chemical compound, drug | 11-Mercaptoundecyl hexaethylene glycol | SensoPath Technologies | SPT-0011P6 | |
| Software, algorithm | EPU | Thermo Fisher Scientific | ||
| Software, algorithm | RELION-3.0 | Zivanov et al., 2018 | RRID:SCR_016274 | |
| Software, algorithm | RELION-3.1 | Zivanov et al., 2020 | RRID:SCR_016274 | |
| Software, algorithm | MotionCor2 | Zheng et al., 2017 | RRID:SCR_016499 | |
| Software, algorithm | CTFFIND-4.1 | Rohou and Grigorieff, 2015 | RRID:SCR_016732 | |
| Software, algorithm | crYOLO 1.5.3 | Wagner et al., 2019 | https://cryolo.readthedocs.io/en/stable/ | |
| Software, algorithm | UCSF ChimeraX | Pettersen et al., 2021 | RRID:SCR_015872 | |
| Software, algorithm | 3DFSC | Tan et al., 2017 | https://github.com/LyumkisLab/3DFSC; LyumkisLab, 2019 version 3.0 | |
| Software, algorithm | SWISS-MODEL | Waterhouse et al., 2018 | RRID:SCR_018123 | |
| Software, algorithm | UCSF Chimera | Pettersen et al., 2004 | RRID:SCR_004097 | |
| Software, algorithm | MODELLER | Webb and Sali, 2016 | RRID:SCR_008395 | |
| Software, algorithm | Coot | Casañal et al., 2020 | RRID:SCR_014222 | |
| Software, algorithm | ISOLDE | Croll, 2018 | https://isolde.cimr.cam.ac.uk/ | |
| Software, algorithm | PyMOL 2.5.2 | Schrodinger, 2022 | RRID:SCR_000305 | |
| Software, algorithm | Phenix 1.18.2–3874 | Liebschner et al., 2019 | RRID:SCR_014224 | |
| Software, algorithm | MapQ | Pintilie et al., 2020 | ||
| Software, algorithm | MolProbity | Chen et al., 2010 | RRID:SCR_014226 | |
| Software, algorithm | EMRinger | Barad et al., 2015 | ||
| Software, algorithm | CASTp | Tian et al., 2018 | http://sts.bioe.uic.edu/castp/ | |
| Other | UltrAuFoil gold grids | Quantifoil; Russo and Passmore, 2014 | R 0.6/1 Gold foil on Gold 300 mesh grid |
Additional files
Download links
A two-part list of links to download the article, or parts of the article, in various formats.
Downloads (link to download the article as PDF)
Open citations (links to open the citations from this article in various online reference manager services)
Cite this article (links to download the citations from this article in formats compatible with various reference manager tools)
Cryo-EM structures of mitochondrial respiratory complex I from Drosophila melanogaster
eLife 12:e84424.
https://doi.org/10.7554/eLife.84424


