The SARS-CoV-2 accessory protein Orf3a is not an ion channel, but does interact with trafficking proteins
- Janelia Research Campus, United States
- Physiology Institute and Millennium Nucleus of Ion Channel-Associated Diseases, Universidad Austral de Chile, Chile
- Department of Biology, University of Pennsylvania, United States
Figures
Figure 1 with 2 supplements
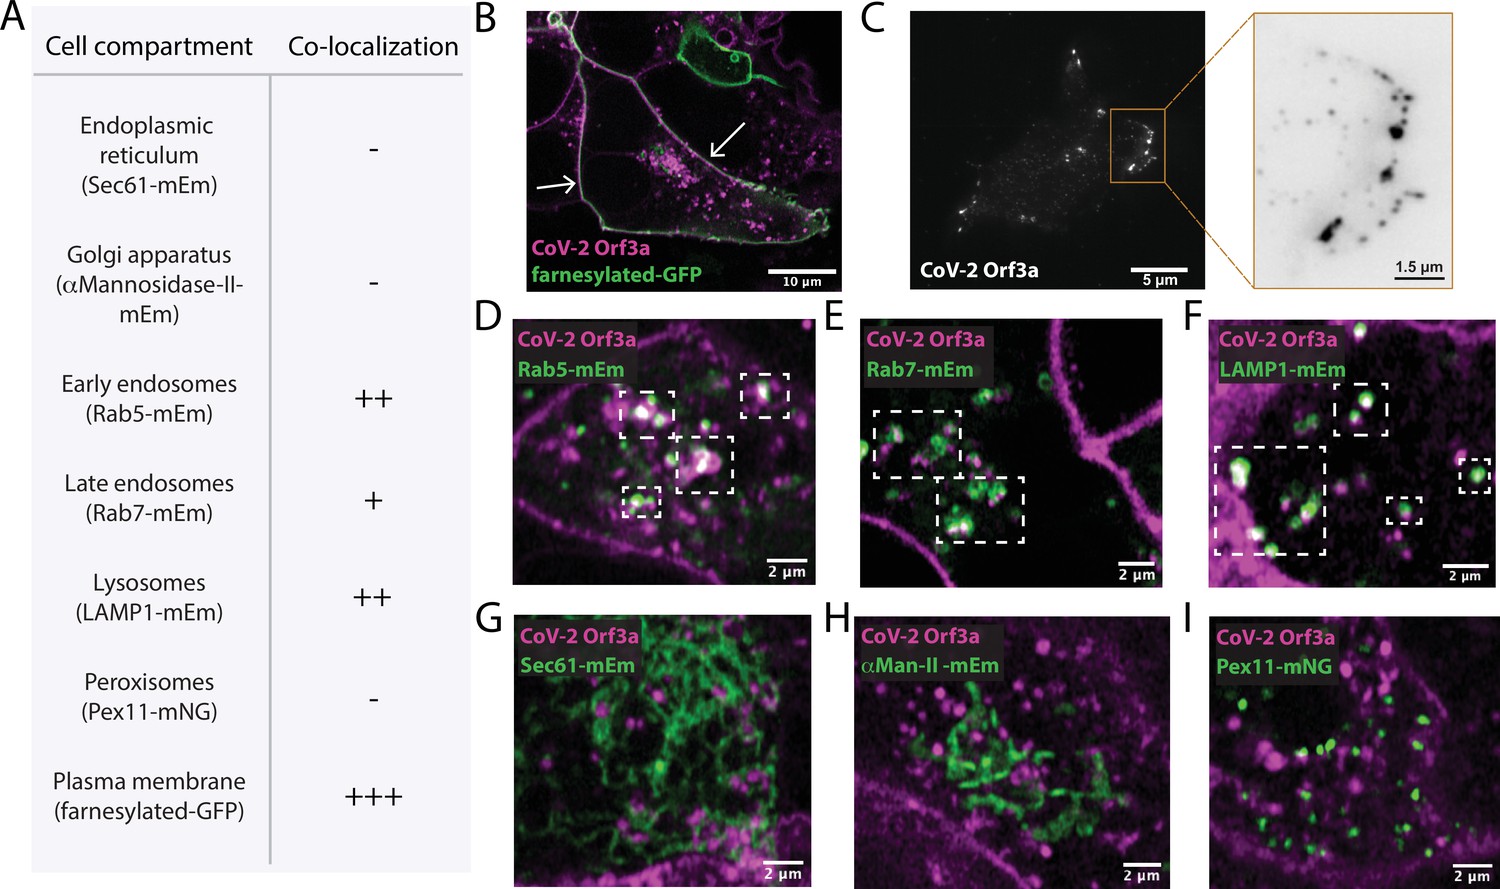
SARS-CoV-2 Orf3a colocalizes with markers for the plasma membrane and the endocytic pathway by live-cell imaging.
(A) Summary table of SARS-CoV-2 (CoV-2) Orf3aHALO colocalization with subcellular protein markers. All markers used to identify cellular compartments are listed in the table in A and are transiently expressed (mEm, mEmerald; mNG, mNeonGreen; GFP, green fluorescent protein). (B) Live-cell image of transiently expressed farnesylated-GFP (green) and CoV-2 Orf3aHALO (magenta) using a HEK293 doxycycline-inducible CoV-2 Orf3aHALO stable cell line. White arrows indicate co-localization. (C) Total Internal Reflection Fluorescence (TIRF) imaging of HEK293 cell with transient expression of CoV-2 Orf3aHALO (white). Orange box, magnification of the surface to highlight CoV-2 Orf3aHALO (black). (D–I) Live-cell image of transiently expressed (D) Rab5-mEm, (E) Rab7-mEm, (F) LAMP1-mEm, (G) Sec61-mEm, (H) αMannosidase-II-mEm, or (I) Pex11-mNG (green) with CoV-2 Orf3aHALO (magenta) as described in (B). White boxes indicate regions of co-localization. All confocal images are representative of three to six independent experiments.
Figure 1—figure supplement 1
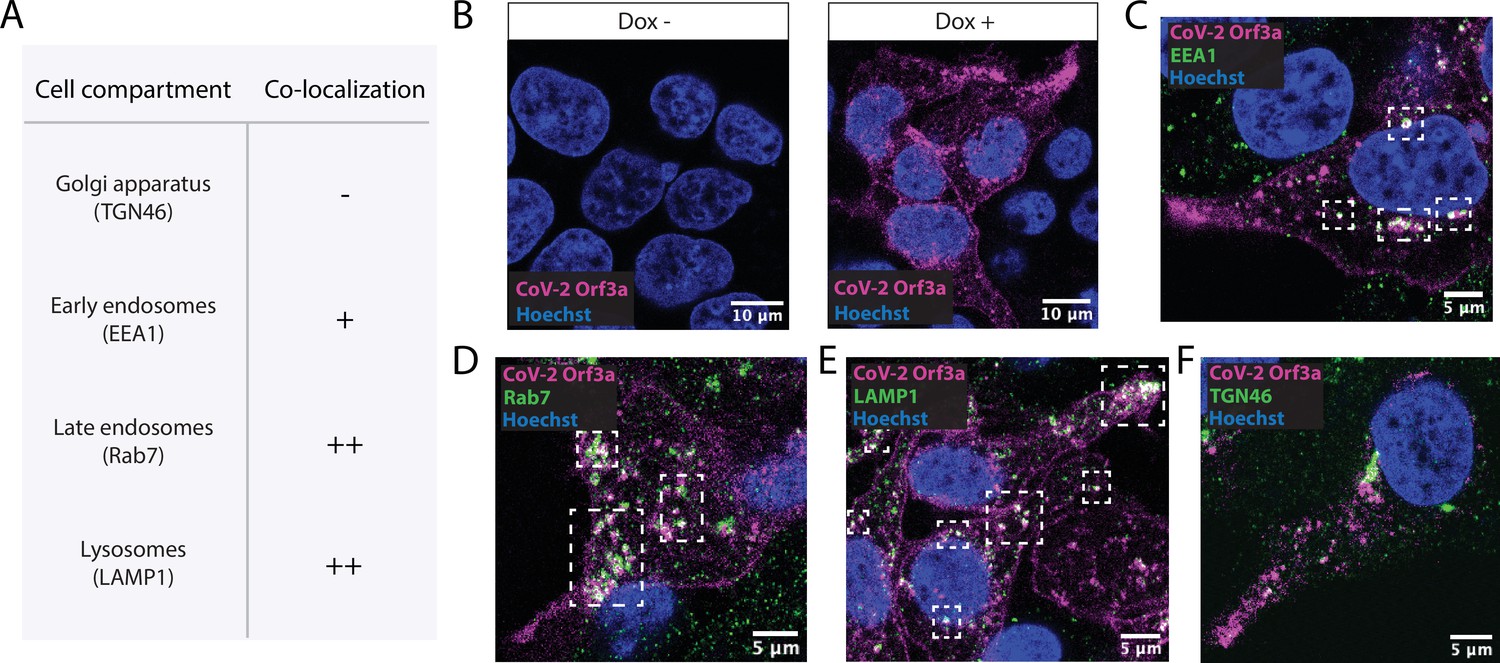
SARS-CoV-2 Orf3a colocalizes with markers of the endocytic pathway, but not with a Golgi marker, by immunostaining.
(A) Summary table of SARS-CoV-2 (CoV-2) Orf3aHALO colocalization with subcellular antibody markers. All markers used to identify cellular compartments are listed in the table in A. (B) Fixed HEK293 cells without (Dox -) and with (Dox +) doxycycline to induce expression of CoV-2 Orf3aHALO (magenta). Cell nuclei are visualized with Hoechst 33342 stain (blue). (C–F) Fixed HEK293 cells treated with doxycycline to induce expression of CoV-2 Orf3aHALO (magenta) stained with (C) EEA1, (D) Rab7, (E) LAMP1, and (F) TGN46 (green). Nuclei are labeled with Hoechst 33342 (blue). All images are representative of three independent experiments.
Figure 1—figure supplement 2
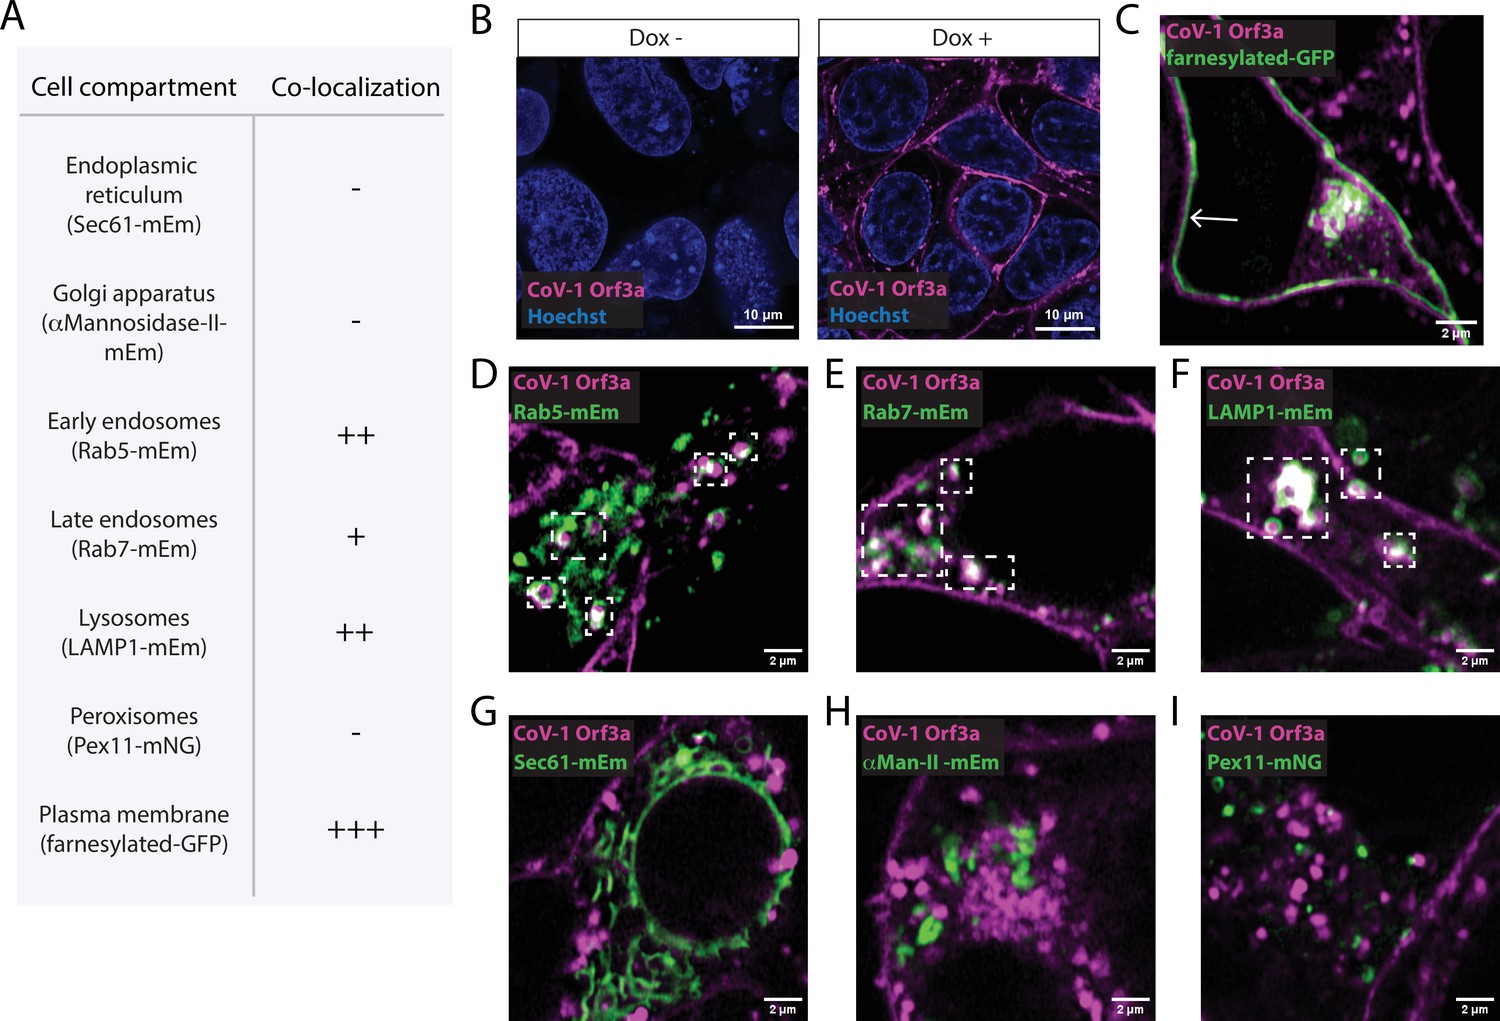
SARS-CoV-1 Orf3a colocalizes with markers for the plasma membrane and the endocytic pathway by live-cell imaging.
(A) Summary table of SARS-CoV-1 (CoV-1) Orf3aHALO colocalization with subcellular protein markers. All markers used to identify cellular compartments are listed in the table (A) and are transiently expressed (mEm, mEmerald; mNG, mNeonGreen; GFP, green fluorescent protein). (B) Live-cell imaging of HEK293 cells without (Dox -) and with (Dox +) doxycycline to induce expression of CoV-1 Orf3aHALO (magenta). Cell nuclei are visualized with Hoechst 33342 stain. (C–I) Live-cell image of transiently expressed (C) farnesylated-GFP, (D) Rab5-mEm, (E) Rab7-mEm, (F) LAMP1-mEm, (G) Sec61-mEm (H) αMannosidase-II-mEm or (I) Pex11-mNG (green) with CoV-1 Orf3aHALO (magenta) using the HEK293 stable cell line in (B). White arrows and boxes indicate regions of co-localization. All images are representative of three independent experiments.
Figure 2 with 3 supplements
SARS-CoV-2 Orf3a is not a viroporin.
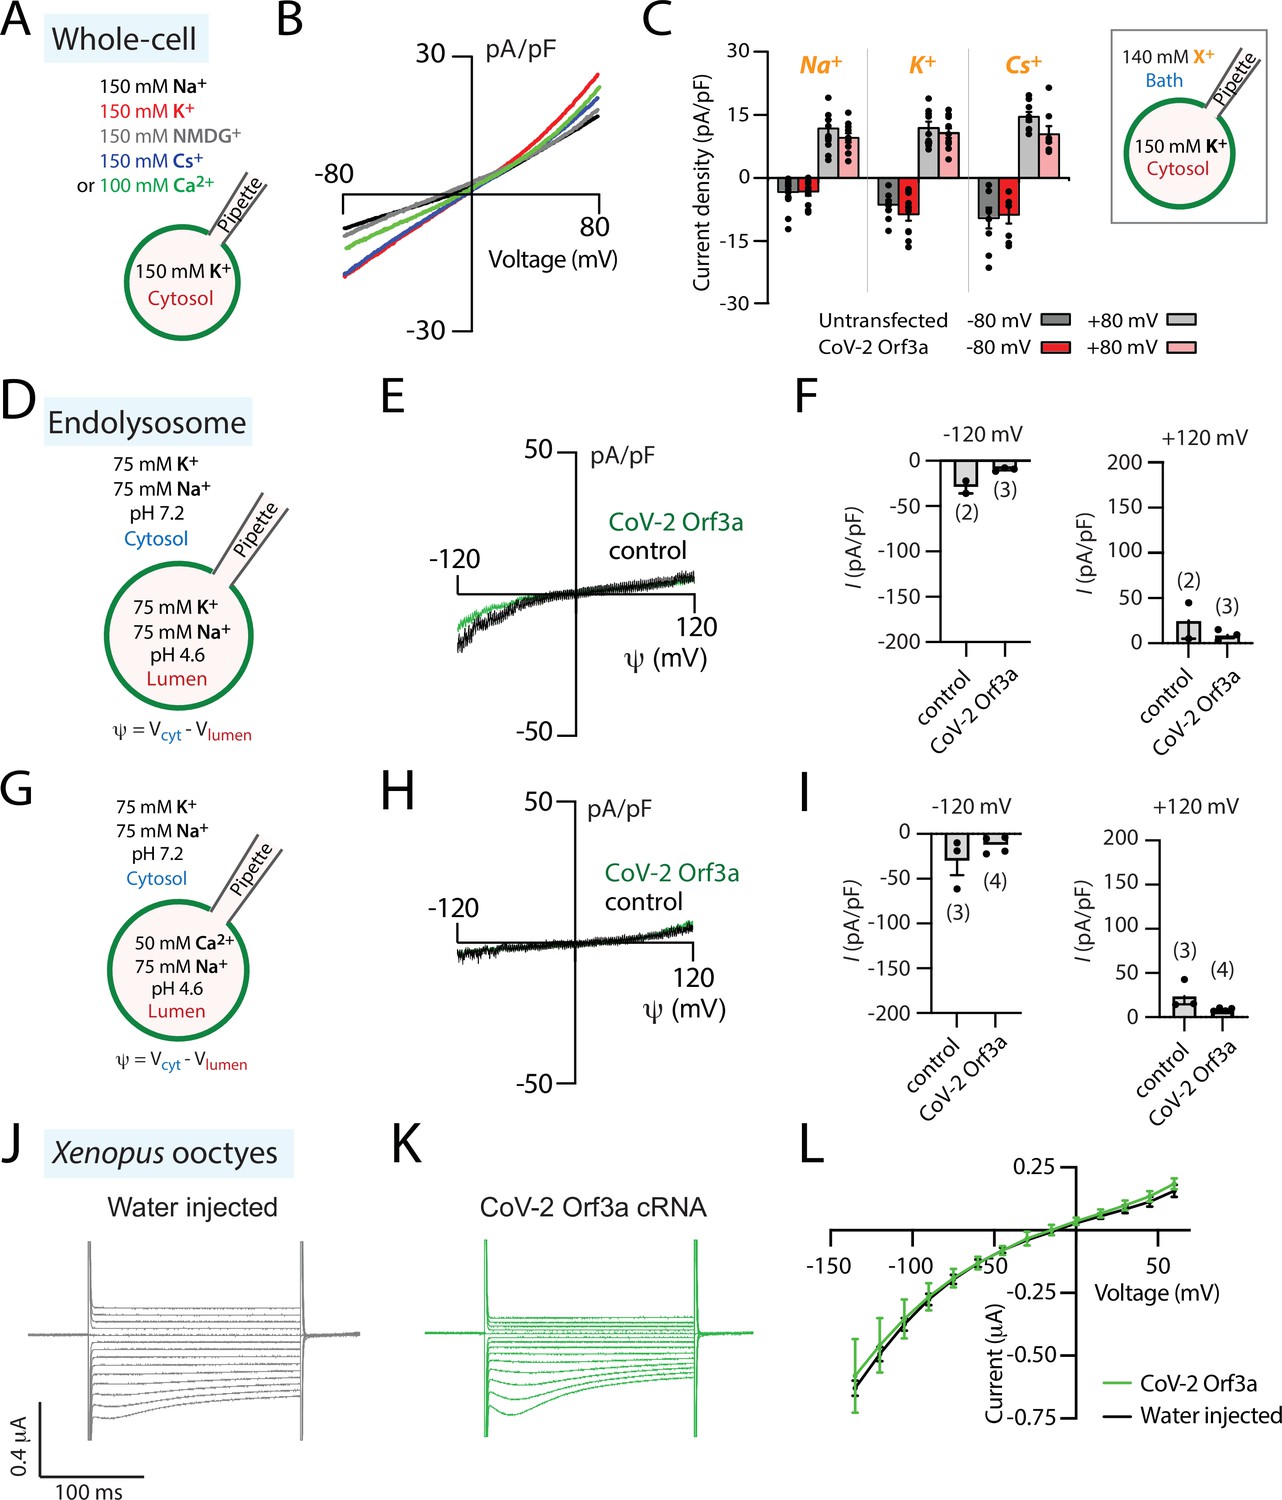
(A–C) SARS-CoV-2 (CoV-2) Orf3a does not elicit a cation current at the plasma membrane. (A) Solutions used for whole-cell patch-clamp experiments. (B) I-V relationship for HEK293 cells expressing CoV-2 Orf3aSNAP by doxycycline induction in various external cationic solutions (Na+, n=26; K+, n=5; Cs+, n=8; NMDG+, n=8; Ca2+, n=5). Mean traces are colored based on Figure 2A. (C) Average current density for untransfected HEK293 cells (gray bars) and cells transfected with CoV-2 Orf3aSNAP (red bars) at –80 and +80 mV recorded in Na+ (n=11), K+ (n=8), and Cs+ (n=8) solutions. (D–I) CoV-2 Orf3a does not elicit a Na+, K+, or Ca2+-selective current in endolysosomes. (D, G) Solutions used in the endolysosomal patch-clamp experiments. All the bath solutions contained 150 mM Cl- and pipette solutions contained 5 mM Cl- (E, H) I-V relationship for endolysosomes from HEK293 cells expressing GFP (control, black) or CoV-2 Orf3aHALO (green). (F, I) Average current density for control and CoV-2 Orf3aHALO expressing HEK293 cells at –120 mV and +120 mV from (D, G). (J–L) CoV-2 Orf3a does not elicit a current in Xenopus oocytes when recorded in high K+ external solution. (J–K) Representative current traces from Xenopus oocytes injected with (J) water or (K) CoV-2 Orf3a2x-STREP cRNA (20 ng). Recordings are done in high external K+ (96 mM KCl) that reproduces published methods. (L) I-V relationship for water-injected (black, n=7) or CoV-2 Orf3a (green, n=7) following protocol described in (J–K).
Figure 2—figure supplement 1
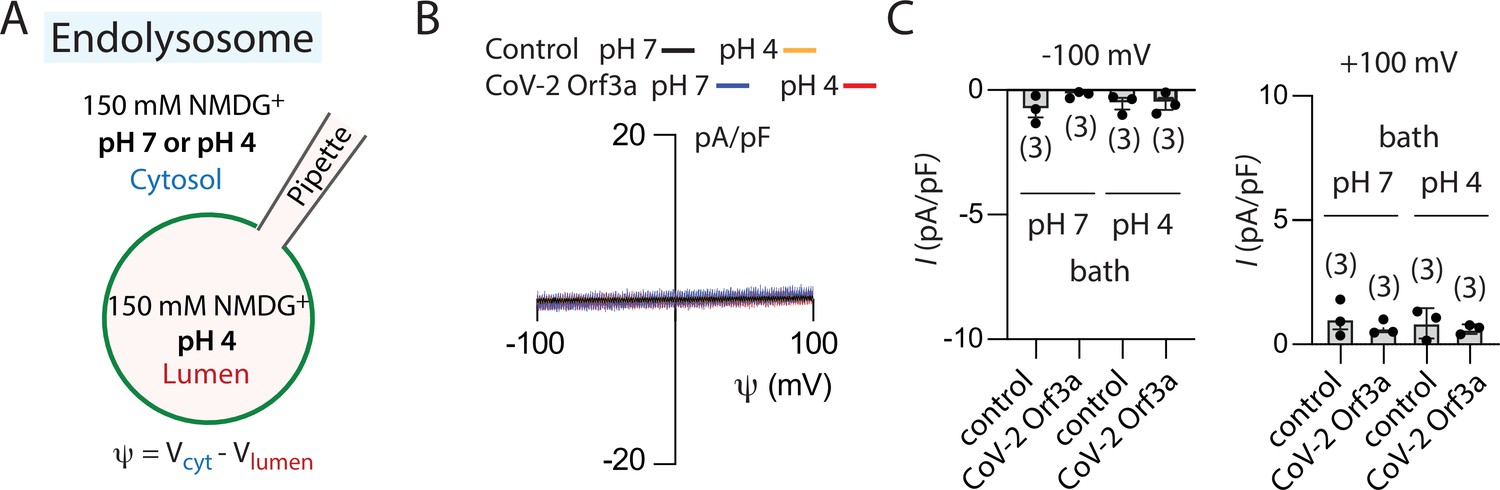
SARS-CoV-2 Orf3a does not elicit a H+-selective current in endolysosomes.
(A) Internal and external recording solutions used in the endolysosomal patch-clamp experiment. (B) I-V relationship for untransfected HEK293 cells (control, black and orange traces) and transiently expressing SARS-CoV-2 Orf3aHALO (CoV-2 Orf3a, blue and red traces). (C) Average current density for untransfected HEK293 cells (control) and SARS-CoV-2 Orf3aHALO (CoV-2 Orf3a) at –100 mV and +100 mV.
Figure 2—figure supplement 2
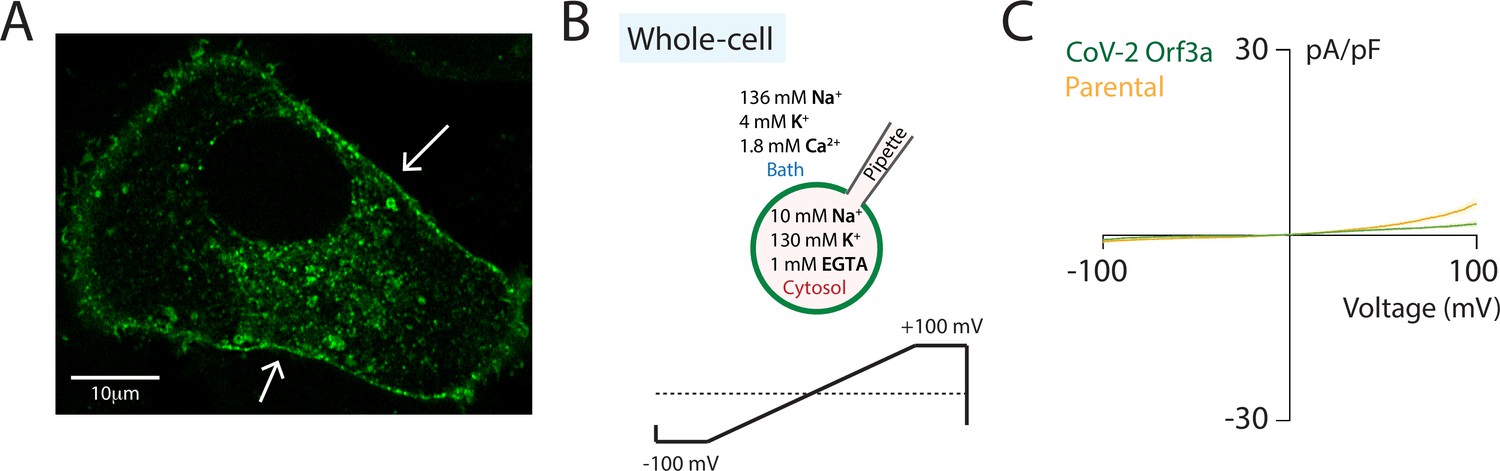
SARS-CoV-2 Orf3a does not elicit a cation selective current at the plasma membrane of A549 lung alveolar cells.
(A) Plasma membrane localization of SARS-CoV-2 (CoV-2) Orf3a is observed in A549 cells. Live-cell image of CoV-2 Orf3aGFP (green) using a A549 doxycycline-inducible CoV-2 Orf3aGFP stable cell line. White arrows indicate plasma membrane localization. (B–C) CoV-2 Orf3a does not elicit a current at the surface of A549 cells. (B) Solutions and voltage ramp protocol for A549 whole-cell patch-clamp experiments. (C) I-V relationship for A549 parental cells (yellow, n=10) and doxycycline-inducible CoV-2 Orf3aGFP stable cell line (green, n=11), both treated with doxycycline, from three independent experiments. A minimal intrinsic outward current observed in both populations is likely due to background volume regulated anion current (VRAC) conductance elicited during whole-cell access.
Figure 2—figure supplement 3
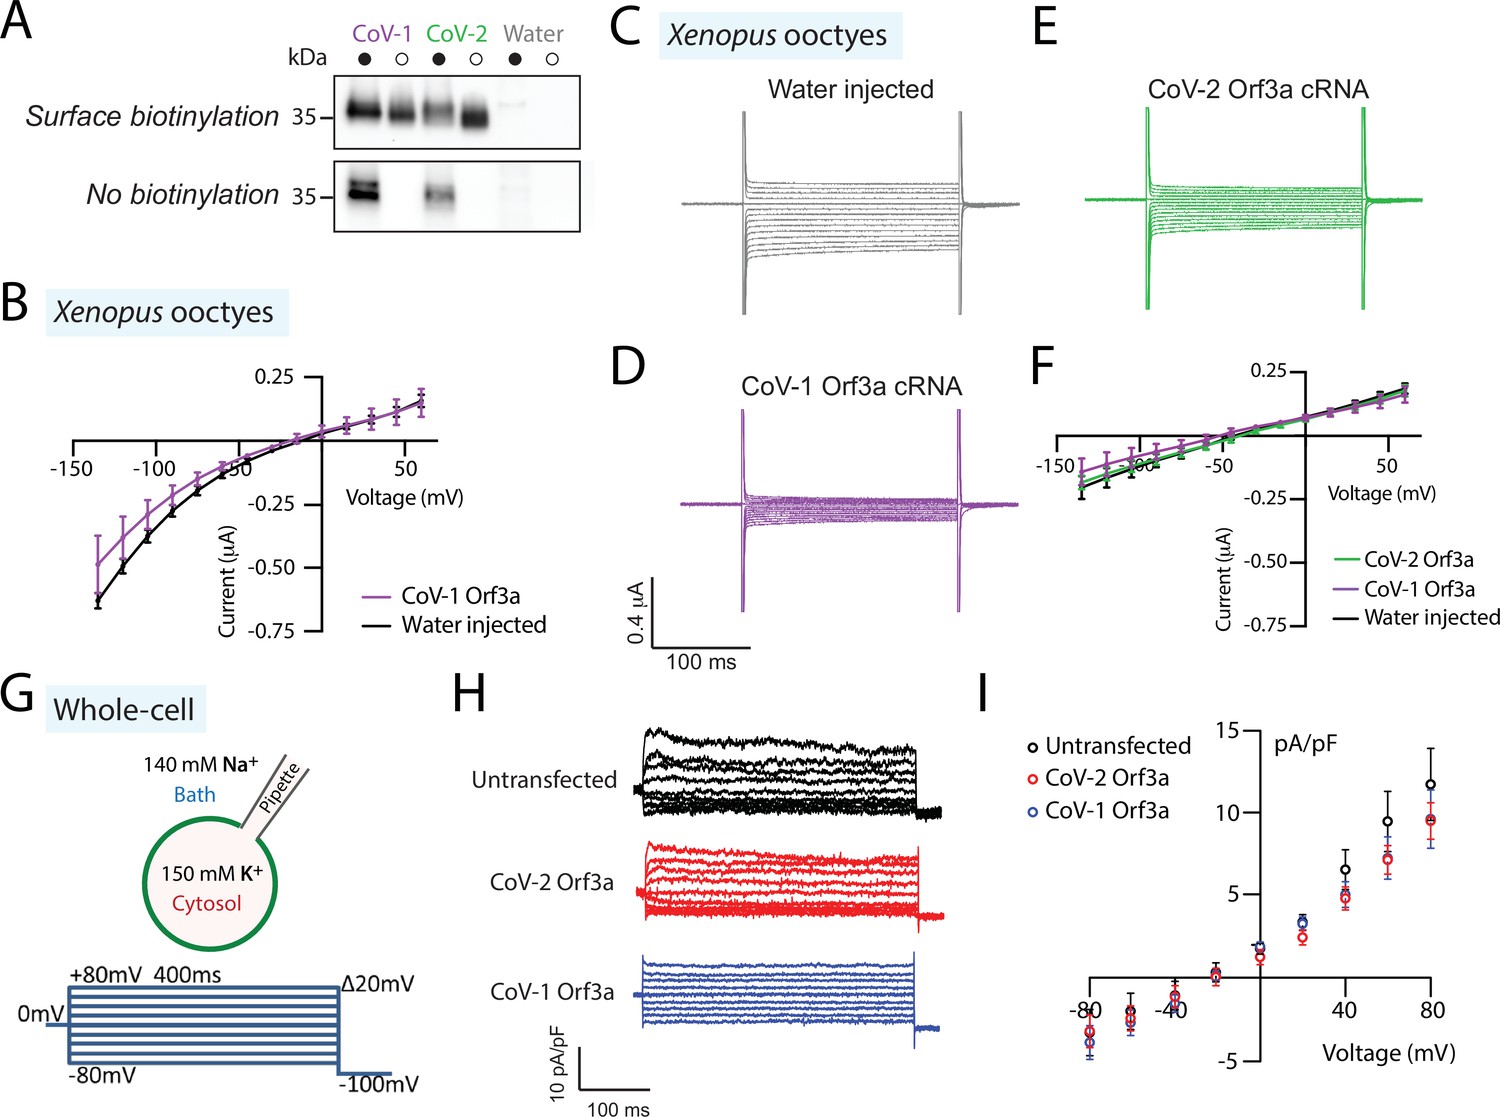
SARS-CoV-1 Orf3a is not a cationic ion channel at the plasma membrane of HEK293 cells and Xenopus oocytes.
(A) Surface biotinylation experiments using Xenopus oocytes injected with SARS-CoV-1 (CoV-1) Orf3a2x-STREP, SARS-CoV-2 (CoV-2) Orf3a2x-STREP, or water demonstrates PM localization of Orf3a constructs used for two-electrode voltage clamp studies. Western blot detecting Orf3a2x-STREP, which migrates at ~35 kDa. Total cell lysate was used as an input (filled circles). CoV-1 and CoV-2 Orf3a Xenopus oocytes surface biotinylation was detected when exposed to the biotin probe (open circles, surface biotinylation versus no biotinylation). (B) I-V relationship for water injected (black, n=7) or CoV-1 Orf3a2x-STREP mRNA injected (purple, n=7) Xenopus oocytes following protocol described in (Figure 2J–K). Water injected I-V trace is the same trace as in Figure 2L. (C–F) CoV-2 Orf3a does not elicit a current in Xenopus oocytes in ND-96 external solution (Methods). Representative current traces from Xenopus oocytes injected with (C) water, (D) CoV-1 Orf3a2x-STREP or (E) CoV-2 Orf3a2x-STREP mRNA (20 ng). Recordings are done in ND-96 solution (96 mM NaCl) following a voltage protocol that recapitulates published methods. (F) I-V relationship for water injected (black, n=7), CoV-1 Orf3a2x-STREP (purple, n=7), or CoV-2 Orf3a2x-STREP (green, n=7) following protocol described in (C–E). (G–I) Neither CoV-1 nor CoV-2 Orf3a elicits a current at the surface of HEK293 cells. (G) Solutions and voltage step protocol used for whole-cell patch-clamp experiments. (H) Representative current traces of HEK293 cells untransfected (black), or doxycycline-induced CoV-2 Orf3aSNAP (red) or CoV-1 Orf3aSNAP (blue) recorded using the voltage step protocol and solutions in (G). (I) I-V relationship for untransfected HEK293 cells (black, n=9), and cells doxycycline-induced to express CoV-2 Orf3aSNAP (red, n=11) and CoV-1 Orf3aSNAP (blue, n=9).
-
Figure 2—figure supplement 3—source data 1
| Raw unedited western blots and figures with the uncropped blots for Figure 2—figure supplement 3A.
- https://cdn.elifesciences.org/articles/84477/elife-84477-fig2-figsupp3-data1-v2.zip
Figure 3 with 5 supplements
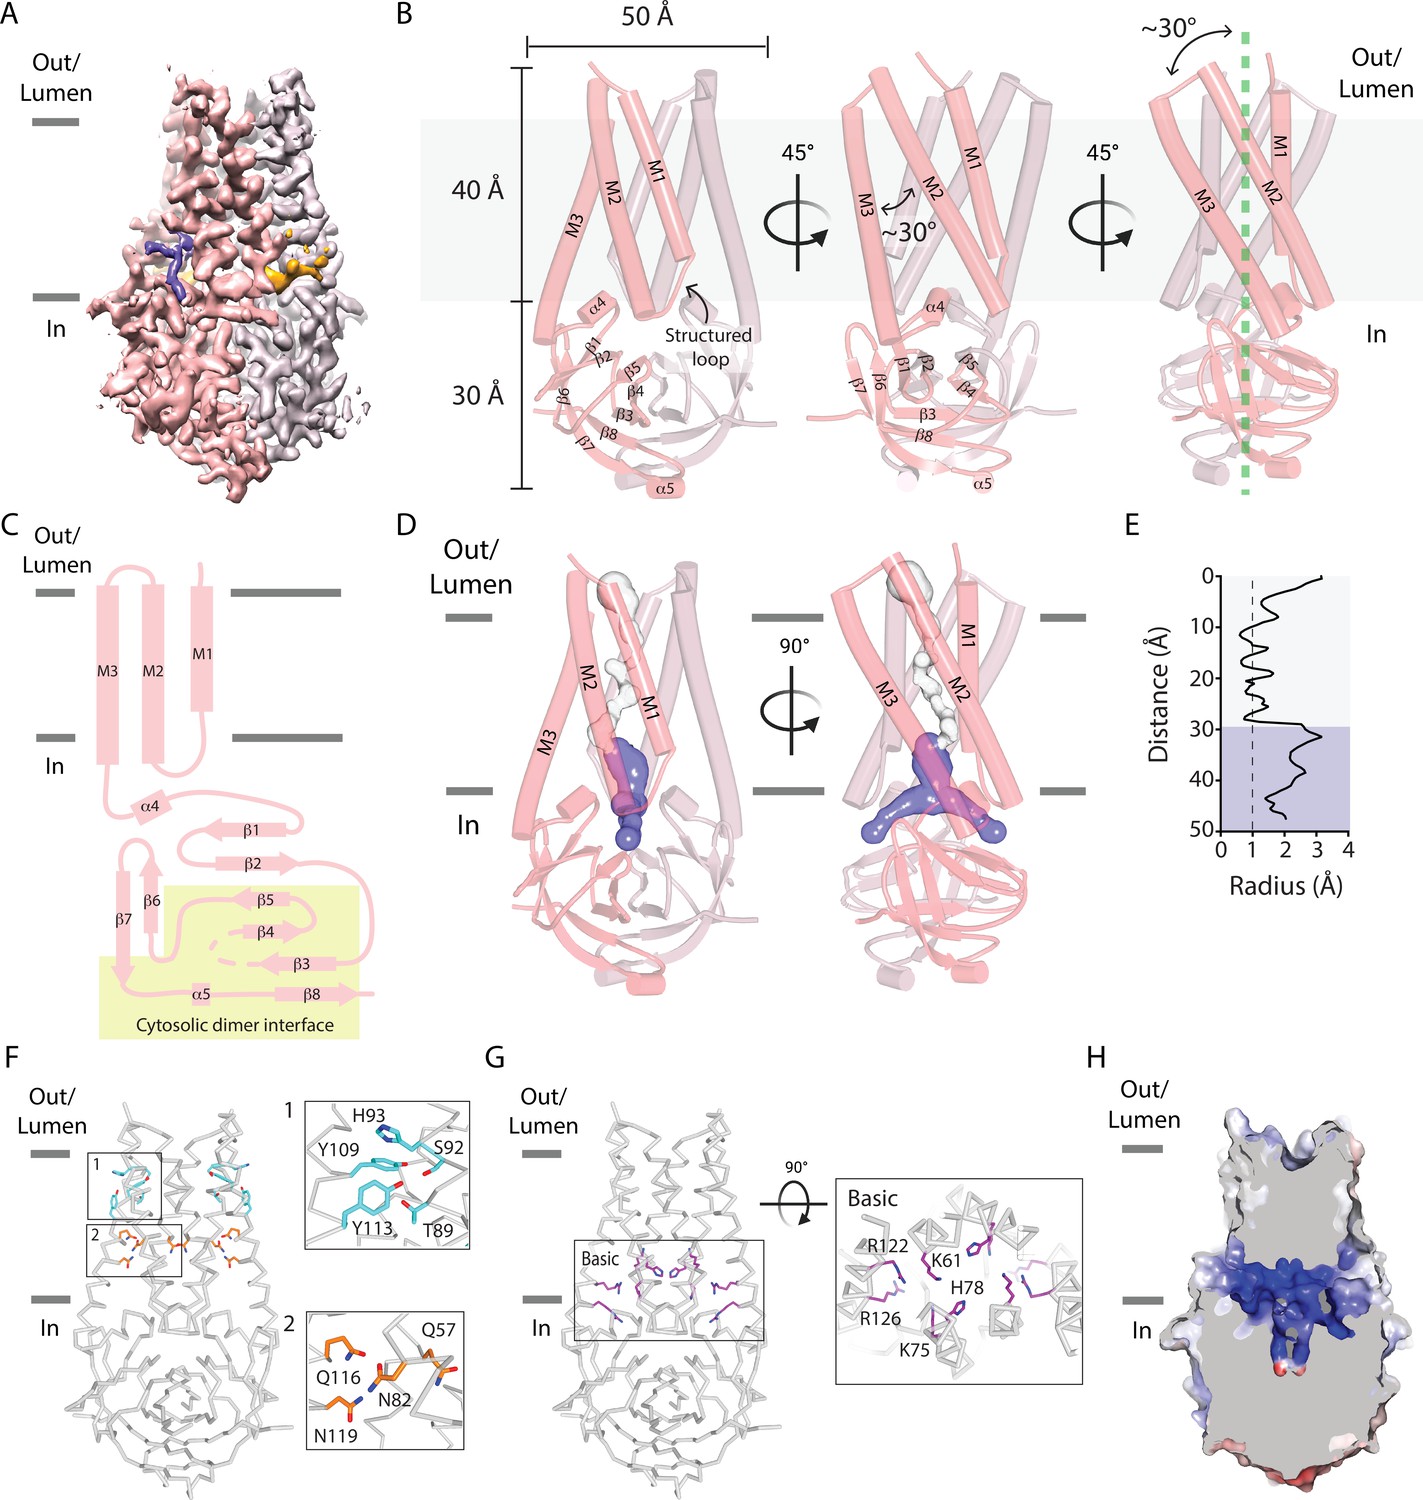
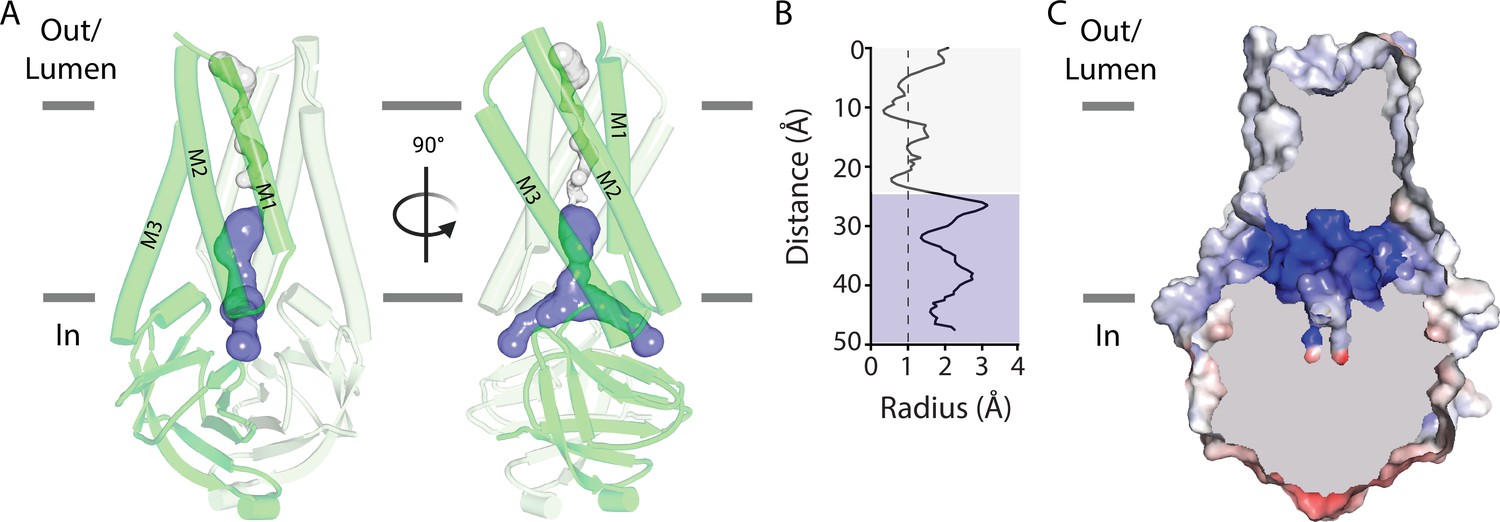
A narrow cavity detected in the SARS-CoV-2 Orf3a TM region is unlikely to conduct cations.
(A–C) Overall architecture of SARS-CoV-2 (CoV-2) Orf3a. (A) Cryo-EM map of dimeric CoV-2 Orf3a (dark and light pink), with density for lipids colored (orange, purple). (B) Three side views of CoV-2 Orf3a depicting dimeric architecture (dark and light pink) and key structural elements. (C) 2D topology of CoV-2 Orf3a. The region forming the cytosolic dimer interface is shown (yellow). (D) Inspection of the CoV-2 Orf3a TM region for a pore, depicted as the minimal radial distance from its center to the nearest van der Waals contact (HOLE program) (Smart et al., 1996). A region too narrow to conduct ions (white) and an aqueous vestibule (dark blue) are highlighted. (E) Radius of the pore (from D) as a function of the distance along the ion pathway. Dashed lines indicate the minimal radius that would permit a dehydrated ion. Blue and white colors follow (D). (F) Two layers of polar residues (1 and 2, cyan and orange) identified in the TM region, with a zoom in of each region. (G) Basic residues located in the aqueous vestibule (purple) with zoom in of the region. (H) Cutaway of the CoV-2 Orf3a molecular surface to view the aqueous vestibule is colored according to the electrostatic potential (APBS program) (Jurrus et al., 2018). Coloring: blue, positive (+10 kT/e) and red, negative (–10 kT/e).
Figure 3—figure supplement 1
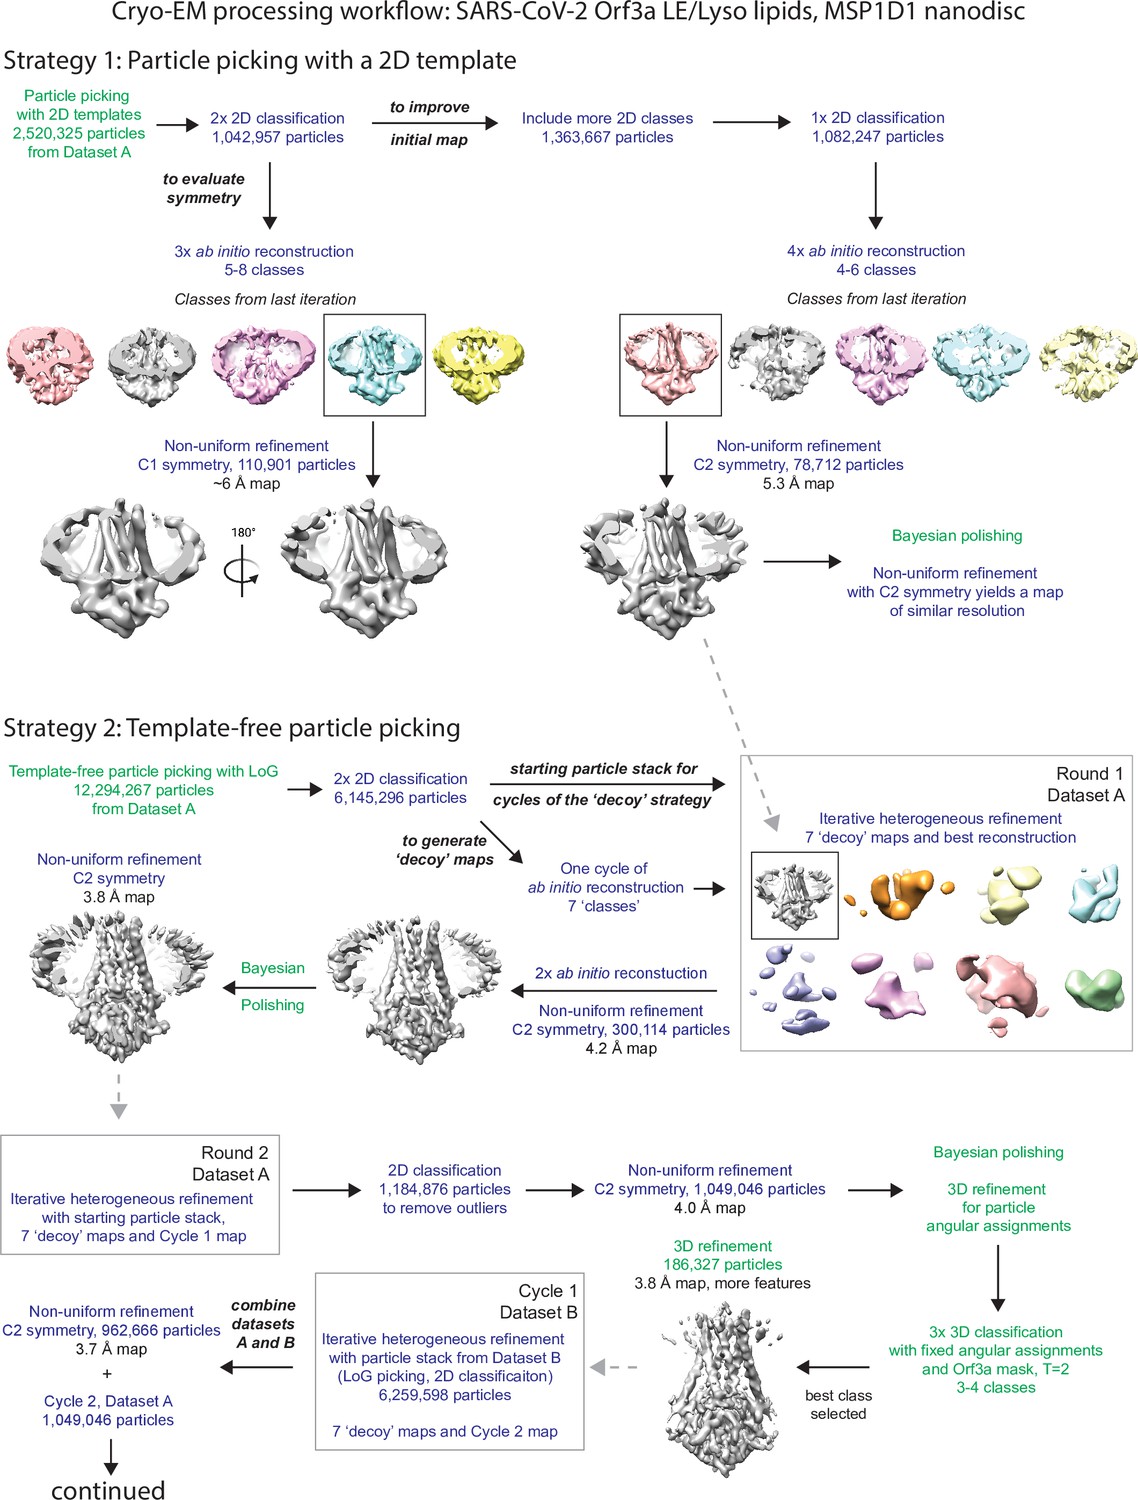
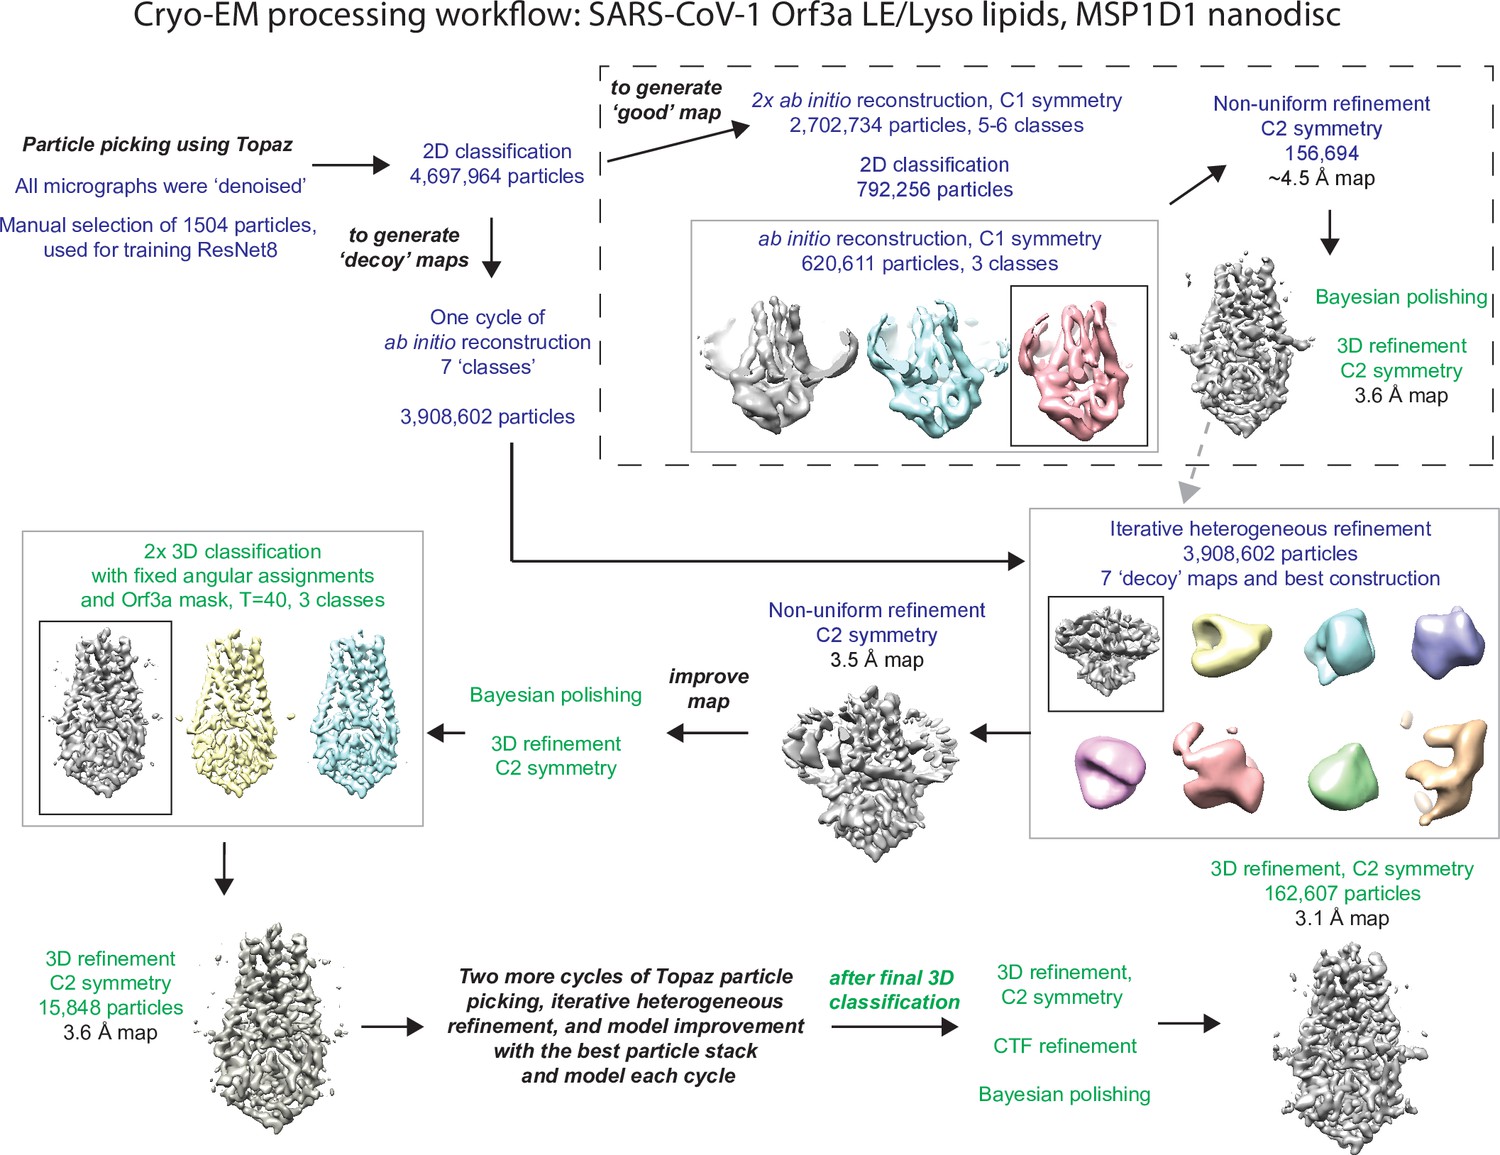
Cryo-EM data processing workflow for SARS-CoV-2 Orf3a reconstituted in LE/Lysosomal MSP1D1-containing nanodiscs.
Text color denotes that the program Relion 3.0 (green) or cryoSPARC v3.0 (dark blue) was used for the step of the workflow (Zivanov et al., 2018; Punjani et al., 2017; Punjani et al., 2020). Details are described in the Methods.
Figure 3—figure supplement 2
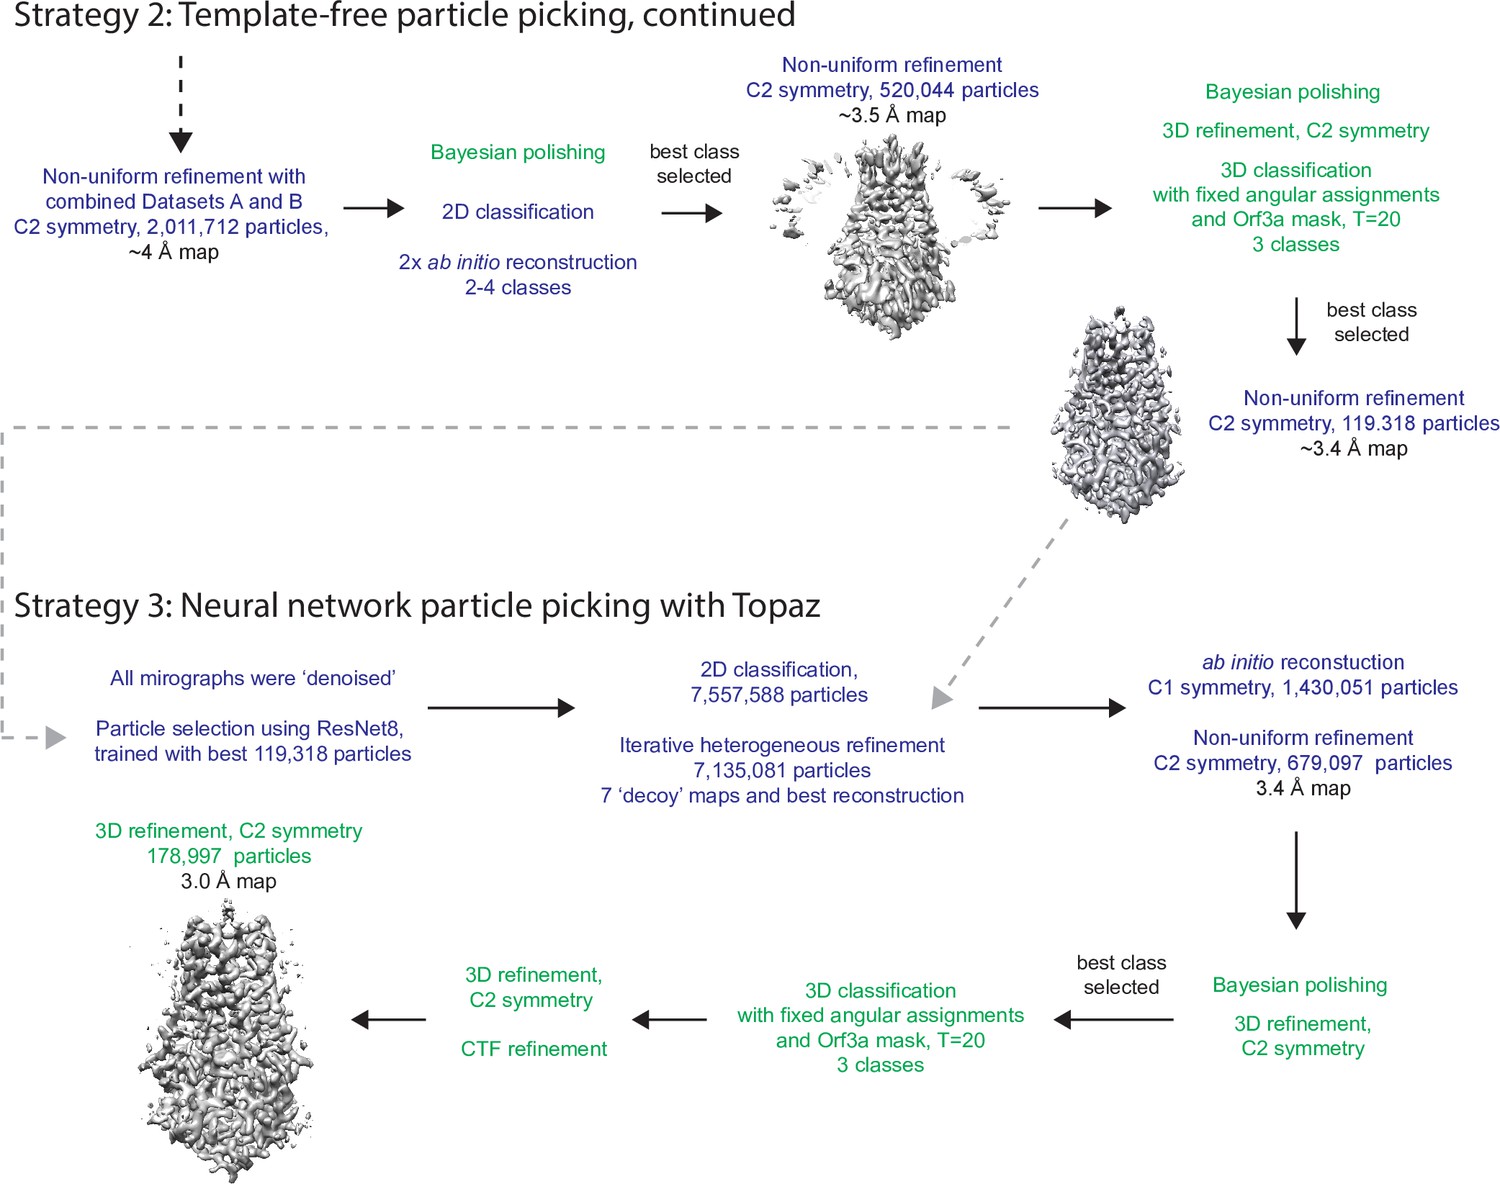
Cryo-EM data processing workflow for SARS-CoV-2 Orf3a reconstituted in LE/Lysosomal MSP1D1-containing nanodiscs, continued from Figure 3—figure supplement 1.
Figure 3—figure supplement 3
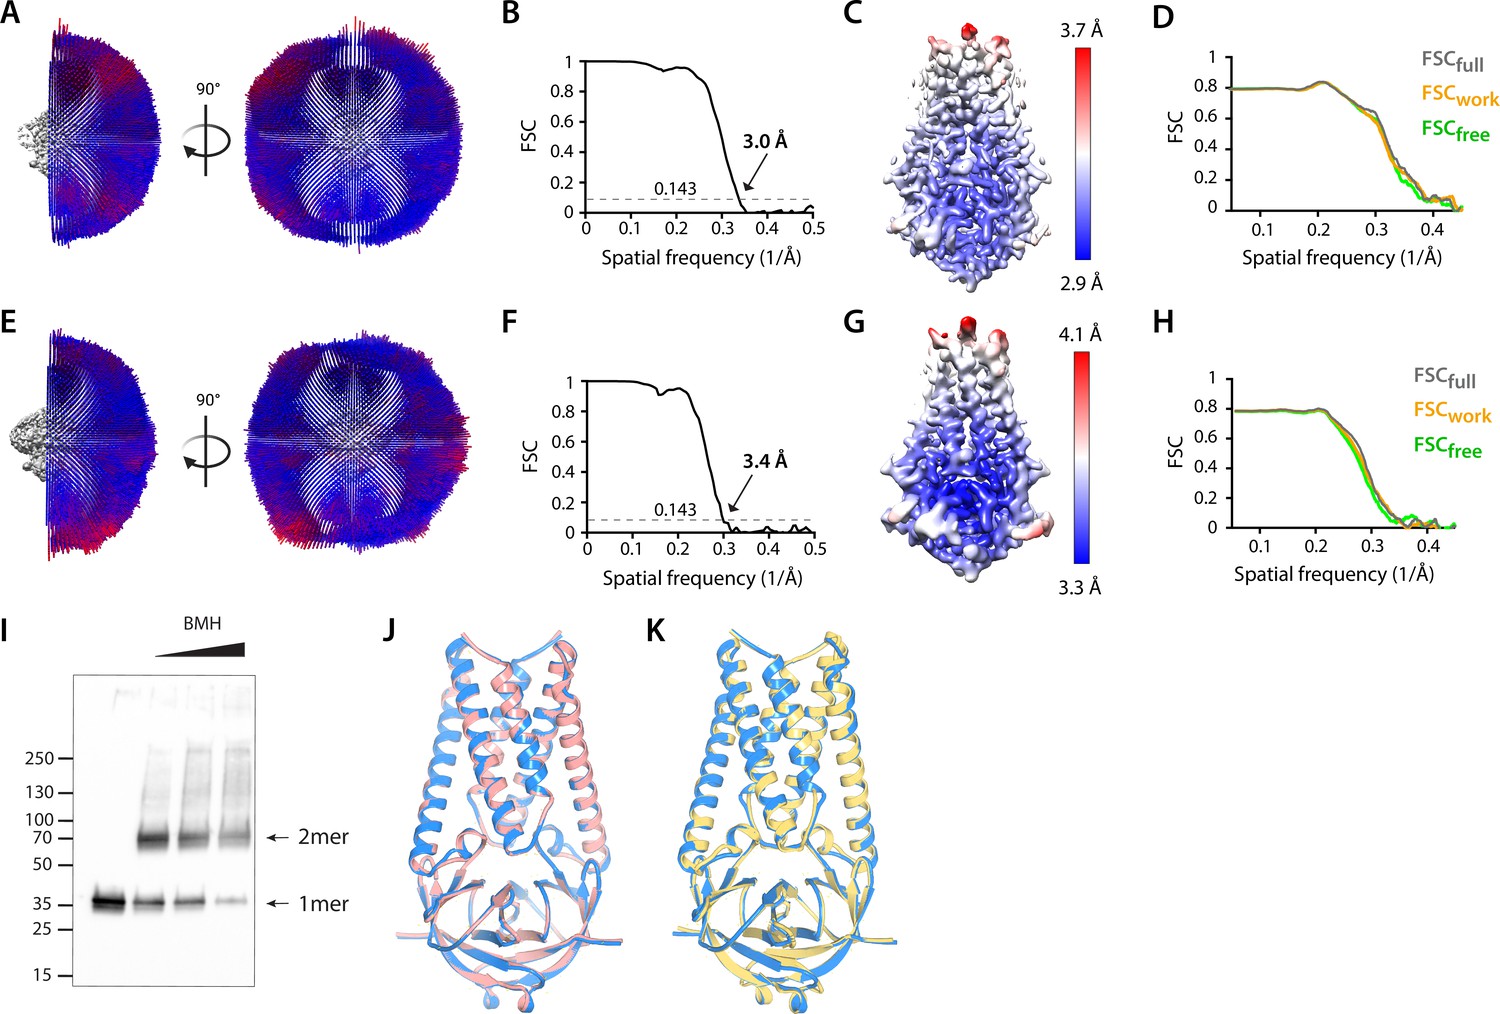
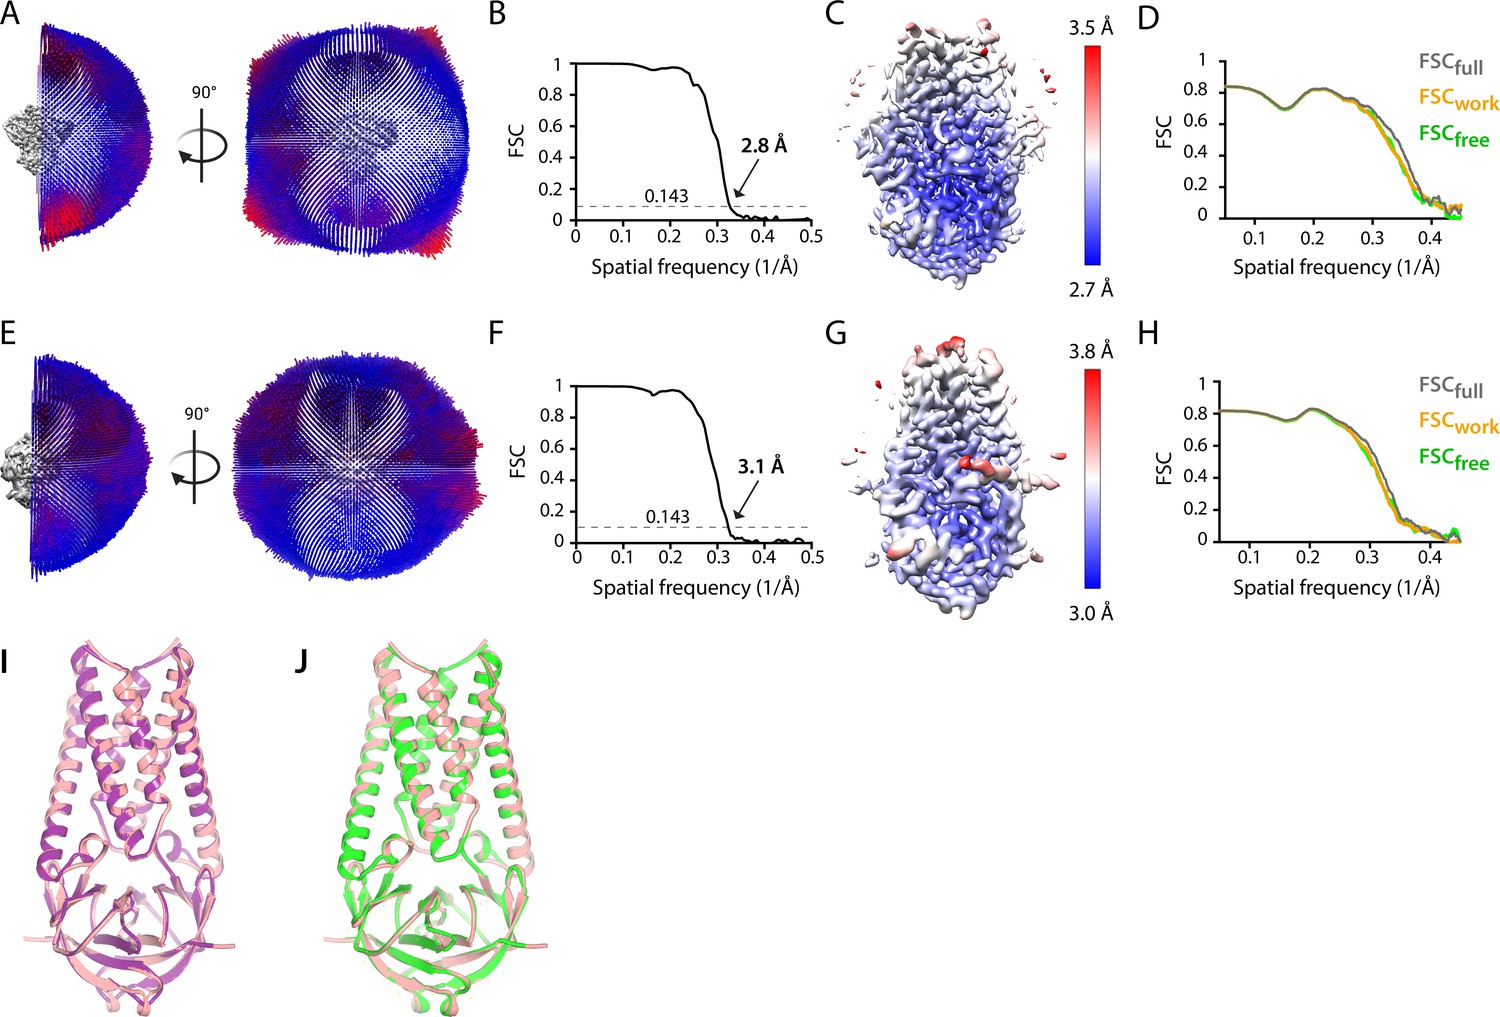
Structural determination of SARS-CoV-2 Orf3a LE/Lyso (A–D) or PM (E–H) MSP1D1 nanodiscs.
(A, E) Angular orientation distributions of particles used in the final reconstructions. The particle distributions are indicated by color shading, with blue to red representing low and high numbers of particles. (B, F) Fourier Shell Correlation (FSC) curves of the final 3D reconstructions. The overall map resolutions are 3.0 Å (B) or 3.4 Å (F) at the FSC cutoff of 0.143 (dotted line). (C, G) Local map resolutions were estimated using Relion 3.0 (SARS-CoV-2 Orf3a LE/Lyso) or Relion 3.1 (SARS-CoV-2 Orf3a PM) and are colored as indicated (Zivanov et al., 2018). (D, H) Model validation. Comparison of the FSC curves between the model and half map 1 (FSCwork), model and half map 2 (FSCfree) and model and full map (FSCfull) (Liebschner et al., 2019). (I) Crosslinking of SARS-CoV-2 Orf3a from isolated HEK293 cellular membrane to assess its oligomeric state. A band of the approximate molecular weight of a dimer (2mer) appears with the addition of bismaleimidohexane (BMH). (J) Superposition of the SARS-CoV-2 Orf3a LE/Lyso MSP1D1 (pink) and PM (blue) structures. (K) Superposition of the SARS-CoV-2 Orf3a PM MSP1D1 (blue) and previously published SARS-CoV-2 Orf3a (yellow orange, PDB ID: 7KJR) structures.
Figure 3—figure supplement 4
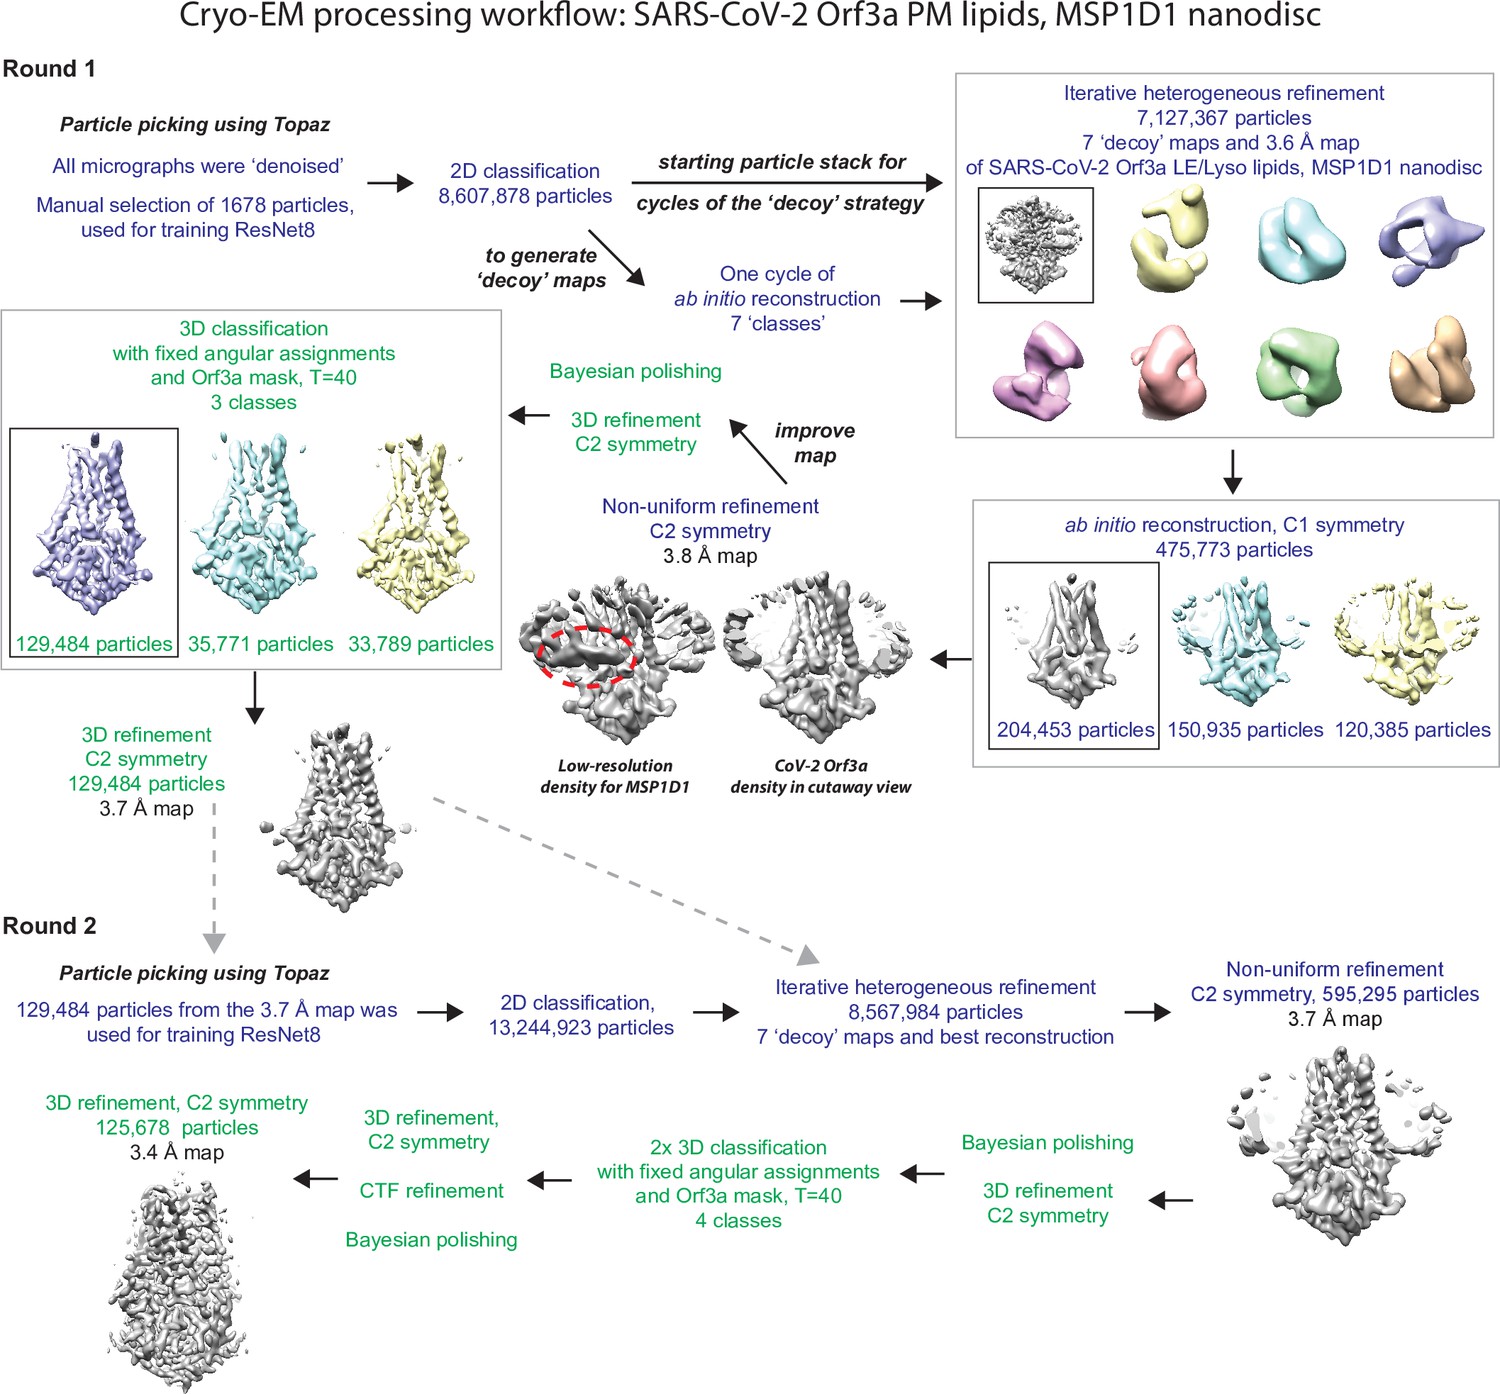
Cryo-EM data processing workflow for SARS-CoV-2 Orf3a reconstituted in PM MSP1D1-containing nanodiscs.
Text color denotes the program Relion 3.1 (green) or cryoSPARC v3.0 (dark blue) (Zivanov et al., 2018; Punjani et al., 2017; Punjani et al., 2020). Details are described in the Methods. Low-resolution density for MSP1D1 is visible in maps of CoV-2 Orf3a but does not reach high-resolution (red circle).
Figure 3—figure supplement 5
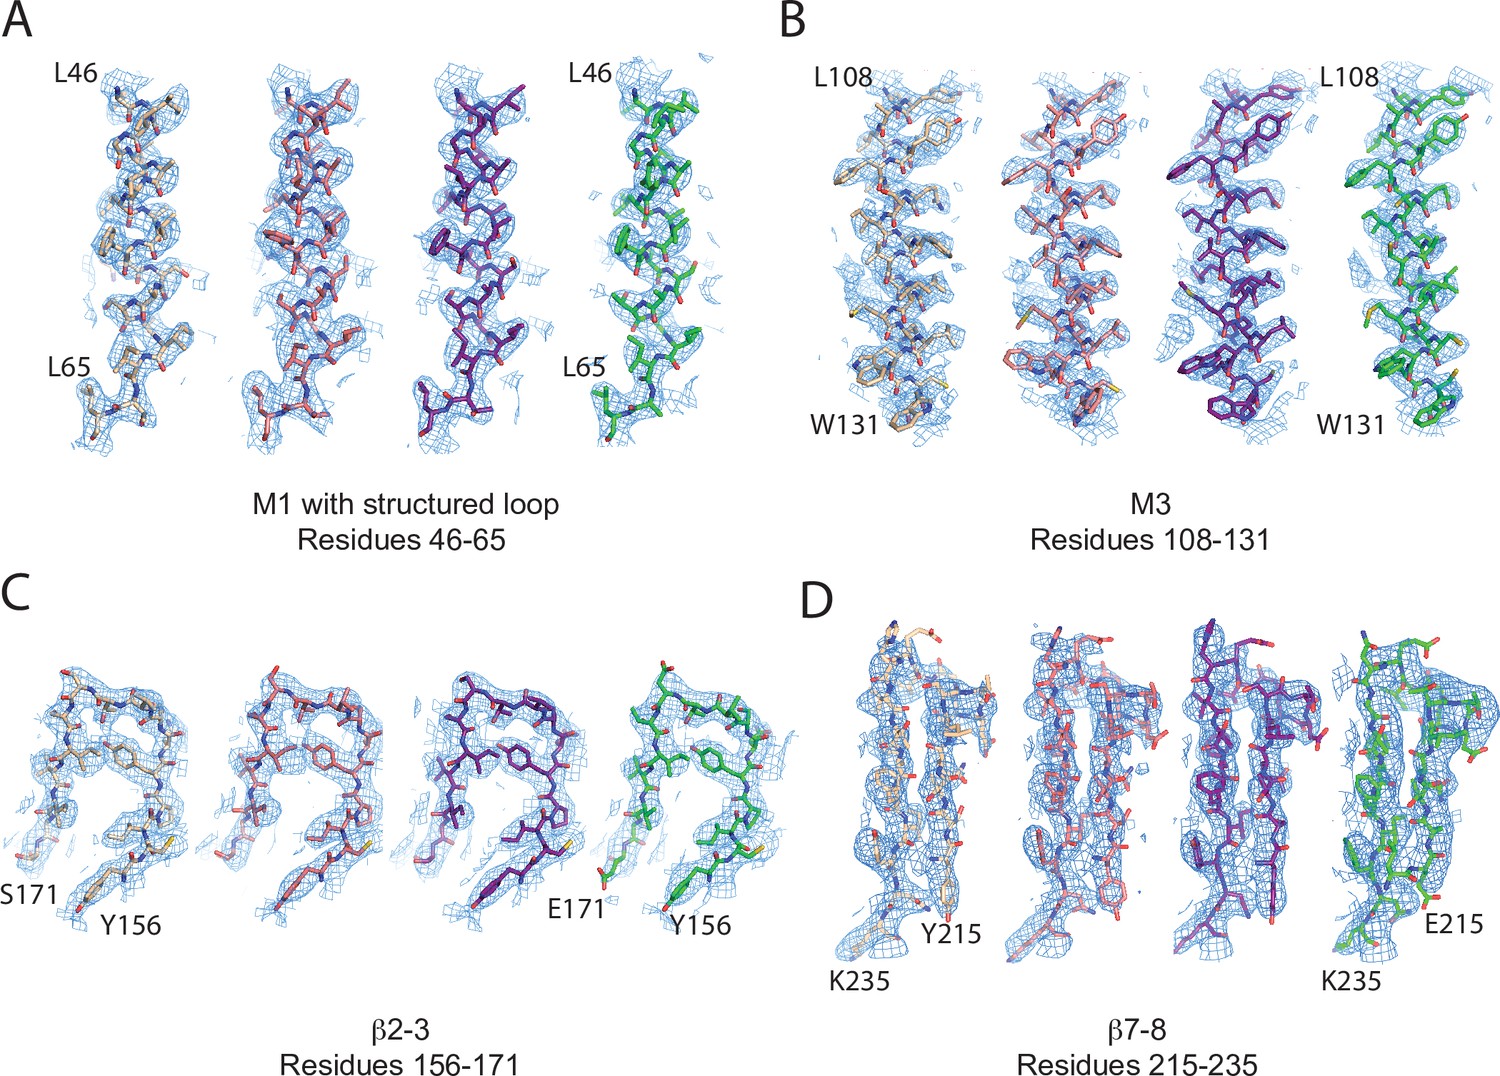
Representative cryo-EM density for SARS-CoV-2 Orf3a and SARS-CoV-1 Orf3a structures.
(A–D) Four representative areas of cryo-EM density (blue mesh) from the four Orf3a datasets with structures represented as sticks and colored as follows: SARS-CoV-2 Orf3a LE/Lyso MSP1D1-containing nanodisc (tan), SARS-CoV-2 Orf3a PM MSP1D1-containing nanodisc (pink), SARS-CoV-2 LE/Lyso Saposin A-containing nanodisc (dark purple), SARS-CoV-1 Orf3a LE/Lyso MSP1D1-containing nanodisc (green).
Figure 4 with 5 supplements
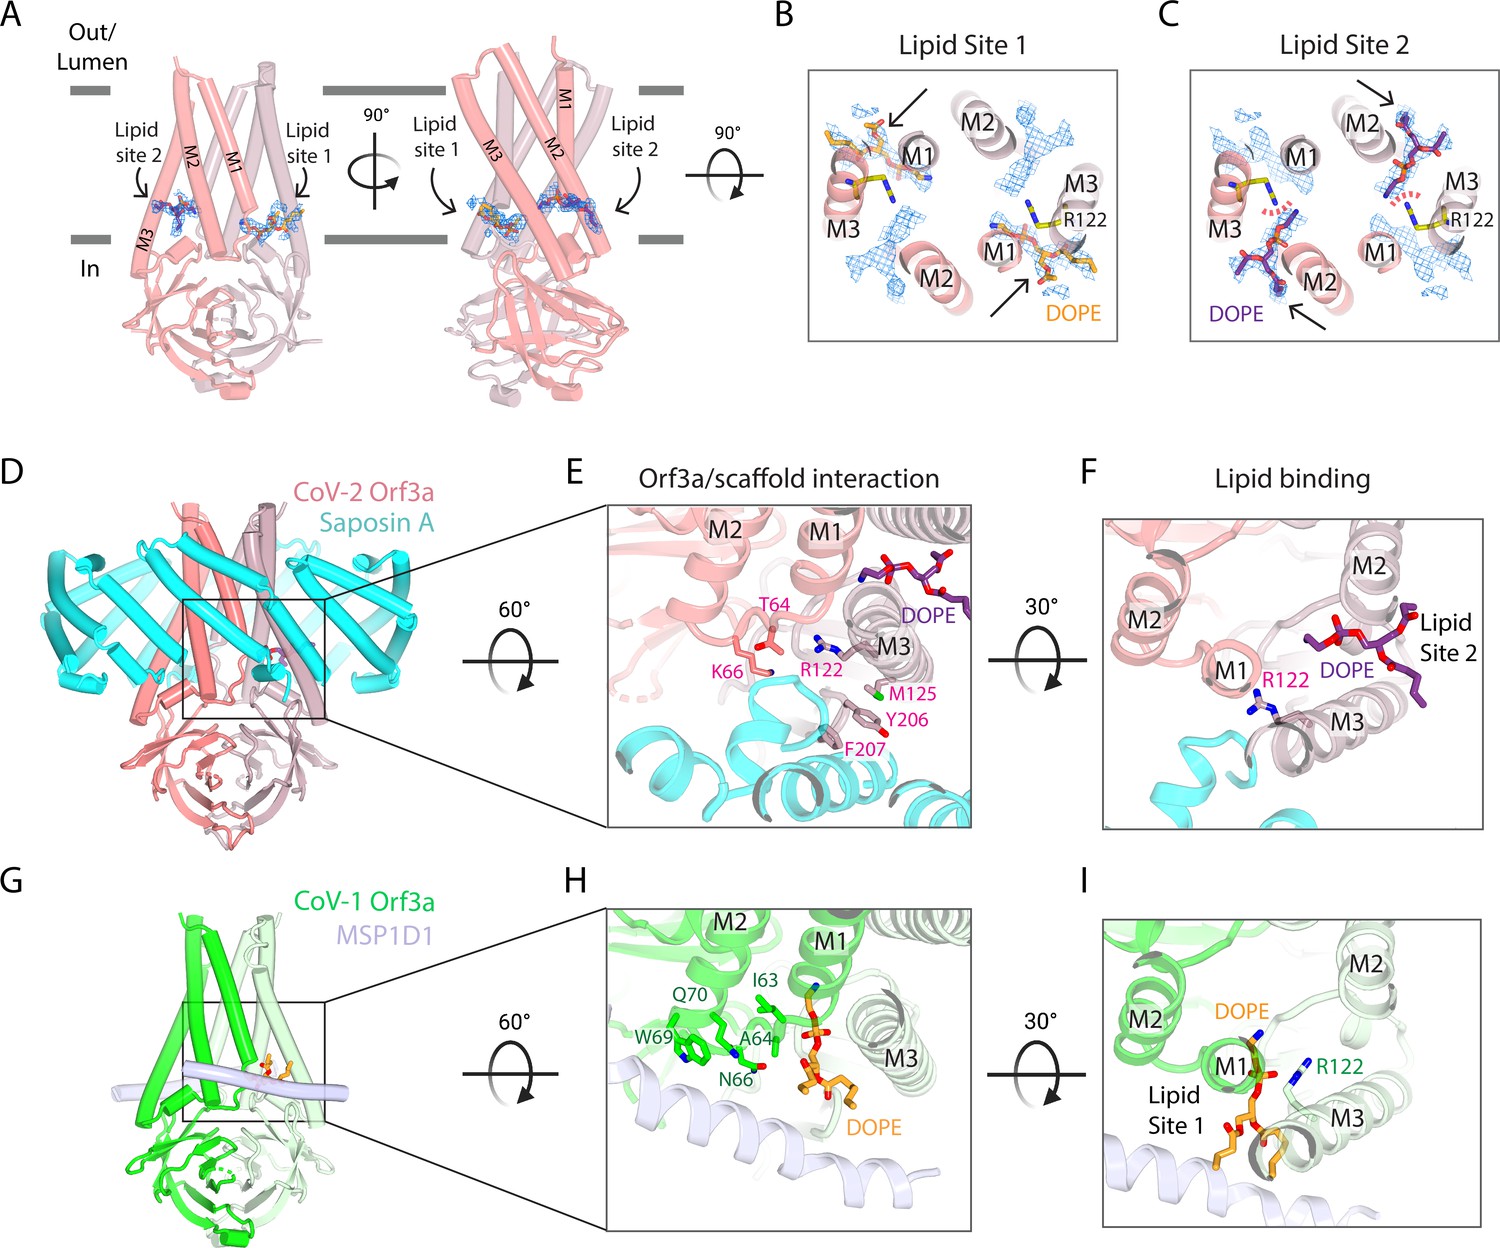
Two SARS-CoV-2 Orf3a lateral openings within the TM region are filled with density likely representing lipid sites.
(A) Two side views of SARS-CoV-2 (CoV-2) Orf3a in LE/Lyso MSP1D1 nanodiscs highlighting two subunits (dark and light pink). Lipid densities (blue mesh, contoured at 7σ) are identified in fenestrations between TM1 and TM3 of neighboring subunits (Lipid Site 1) and TM2 and TM3 of the same subunit (Lipid Site 2). A DOPE lipid is modeled into Lipid Site 1 (orange) and Lipid Site 2 (purple) in each view. (B–C) Cutaway view from the extracellular space to view lipids modeled into the density. Two DOPE lipids are modeled into (B) Lipid Site 1 (orange) or (C) Lipid Site 2 (purple) with lipid density depicted (blue mesh, contoured at 7σ). Lipid Sites 1 and 2 are likely not occupied simultaneously since the orientation of R122 (yellow) would sterically clash with DOPE in Lipid Site 2 (red dotted line). (D–F) CoV-2 Orf3a interacts with Saposin A. (D) Side view of CoV-2 Orf3a in LE/Lyso Saposin A nanodiscs highlighting two subunits (dark and light pink) and 6 molecules of Saposin A (cyan), with DOPE shown (purple). (E) Zoom in from the extracellular side to highlight the CoV-2 Orf3a and Saposin A interaction. CoV-2 Orf3a residues within 5 Å from Saposin A are shown (light pink) with DOPE (purple). (F) Zoom in from the extracellular side to highlight DOPE in Lipid Site 2 (purple). Note that residue R122 (light pink) is rotated 135° from the CoV-2 Orf3a LE/Lyso MSP1D1 structure (compare with Figure 4B; see also Figure 4I for direct comparison) and occludes Lipid Site 1. (G–I) SARS-CoV-1 (CoV-1) Orf3a interacts with MSP1D1. (G) Side view of CoV-1 Orf3a in LE/Lyso MSP1D1 nanodiscs highlighting two subunits (dark and light green) and two molecules of MSP1D1 (light blue), with DOPE shown (orange). (H) Same view as Figure 4E to highlight the CoV-1 Orf3a and MSP1D1 interaction. CoV-1 Orf3a residues within 5 Å of MSP1D1 are shown (green), with DOPE (orange) depicted. (I) View as in Figure 4F to highlight DOPE in Lipid Site 1 (orange). Similar to Figure 4B-C, residue R122 (green) is positioned near and clashes with Lipid Site 2.
Figure 4—figure supplement 1
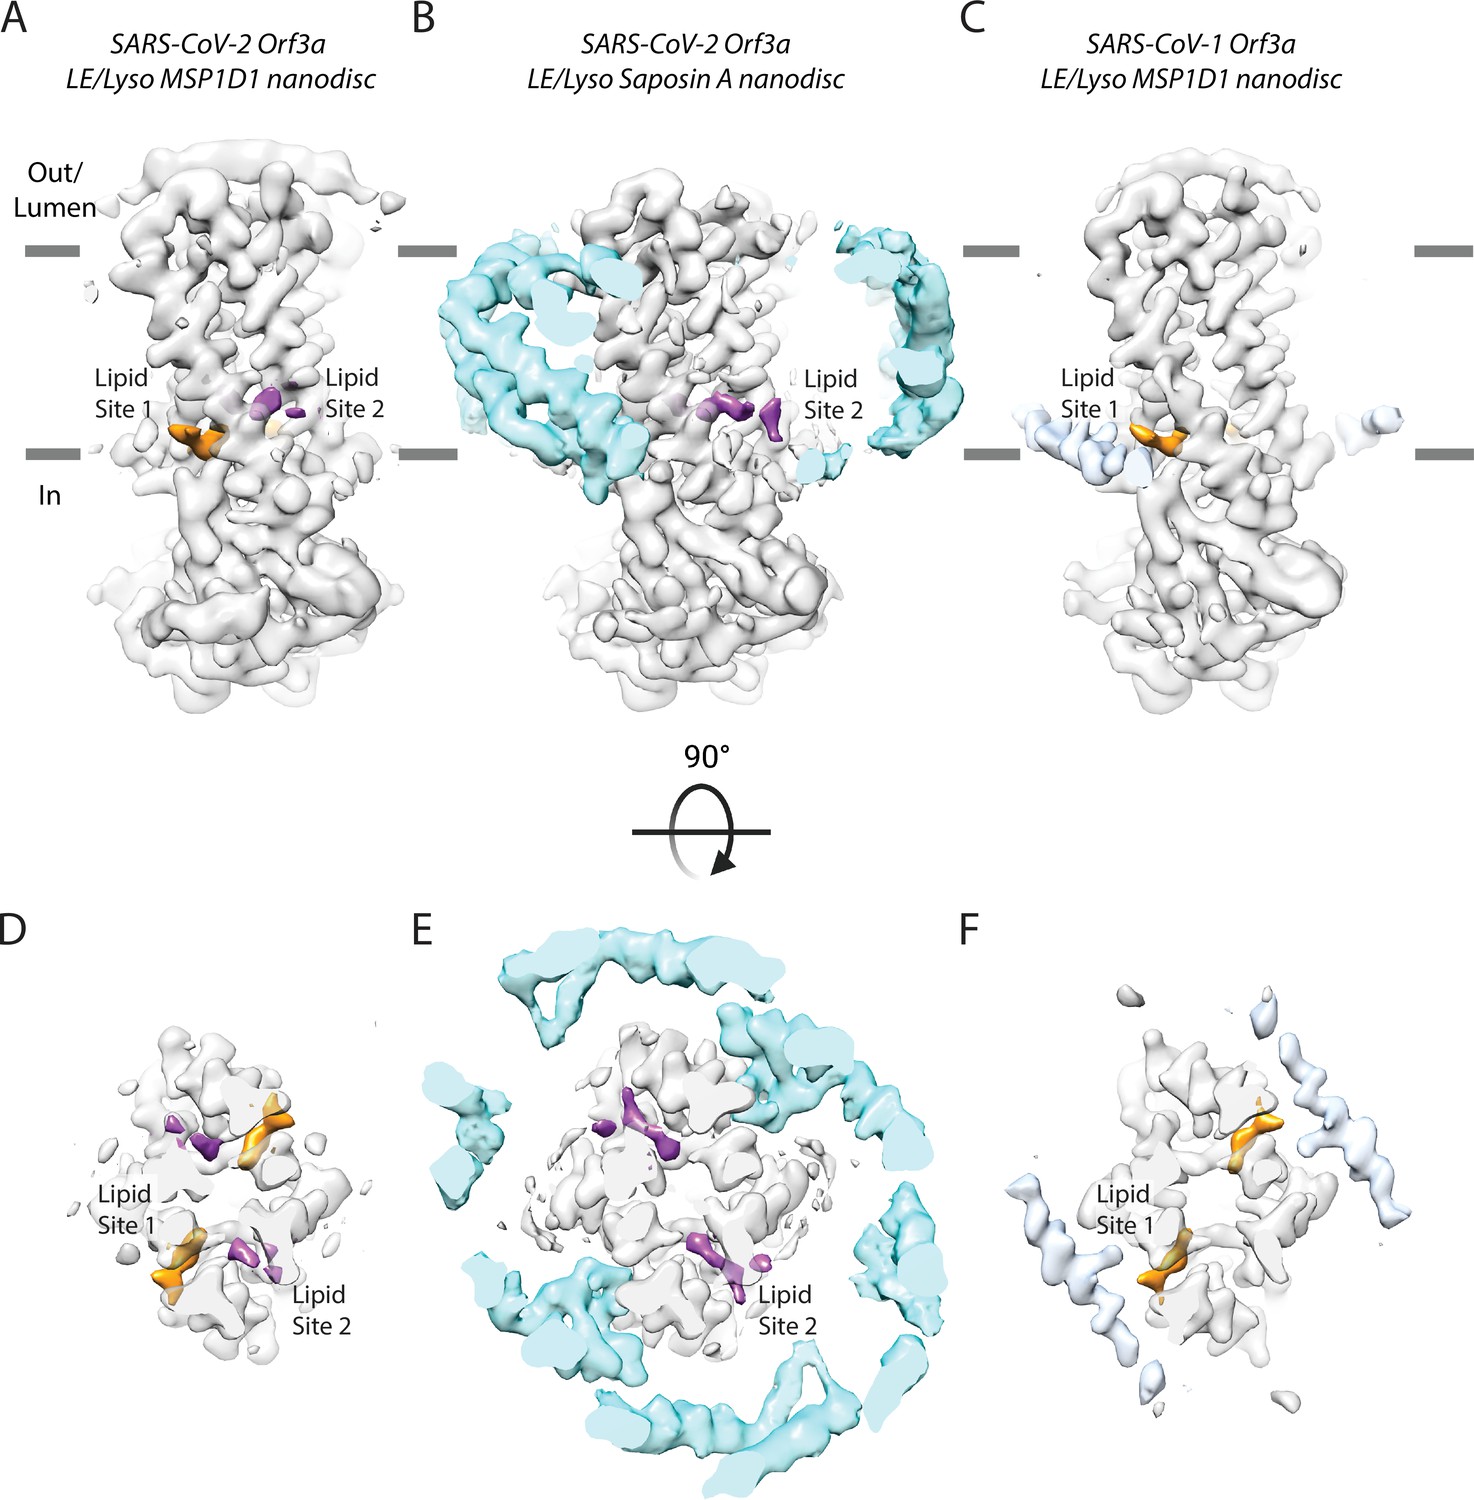
Comparison of lipid densities between (A, D) SARS-CoV2 Orf3a LE/Lyso MSP1D1-containing nanodiscs, (B, E) SARS-CoV2 Orf3a LE/Lyso Saposin A-containing nanodiscs, and (C, F) SARS-CoV-1 Orf3a LE/Lyso MSP1D1-containing nanodiscs.
Side views (A–C) and cutaway views from the extracellular/luminal side of the membrane (D–F). Density for Lipid Site 1 (orange) and Lipid Site 2 (purple) highlights distinct binding between structures. Saposin A (B, E) and MSP1D1 (C, F) densities are depicted in cyan and light blue, respectively.
Figure 4—figure supplement 2
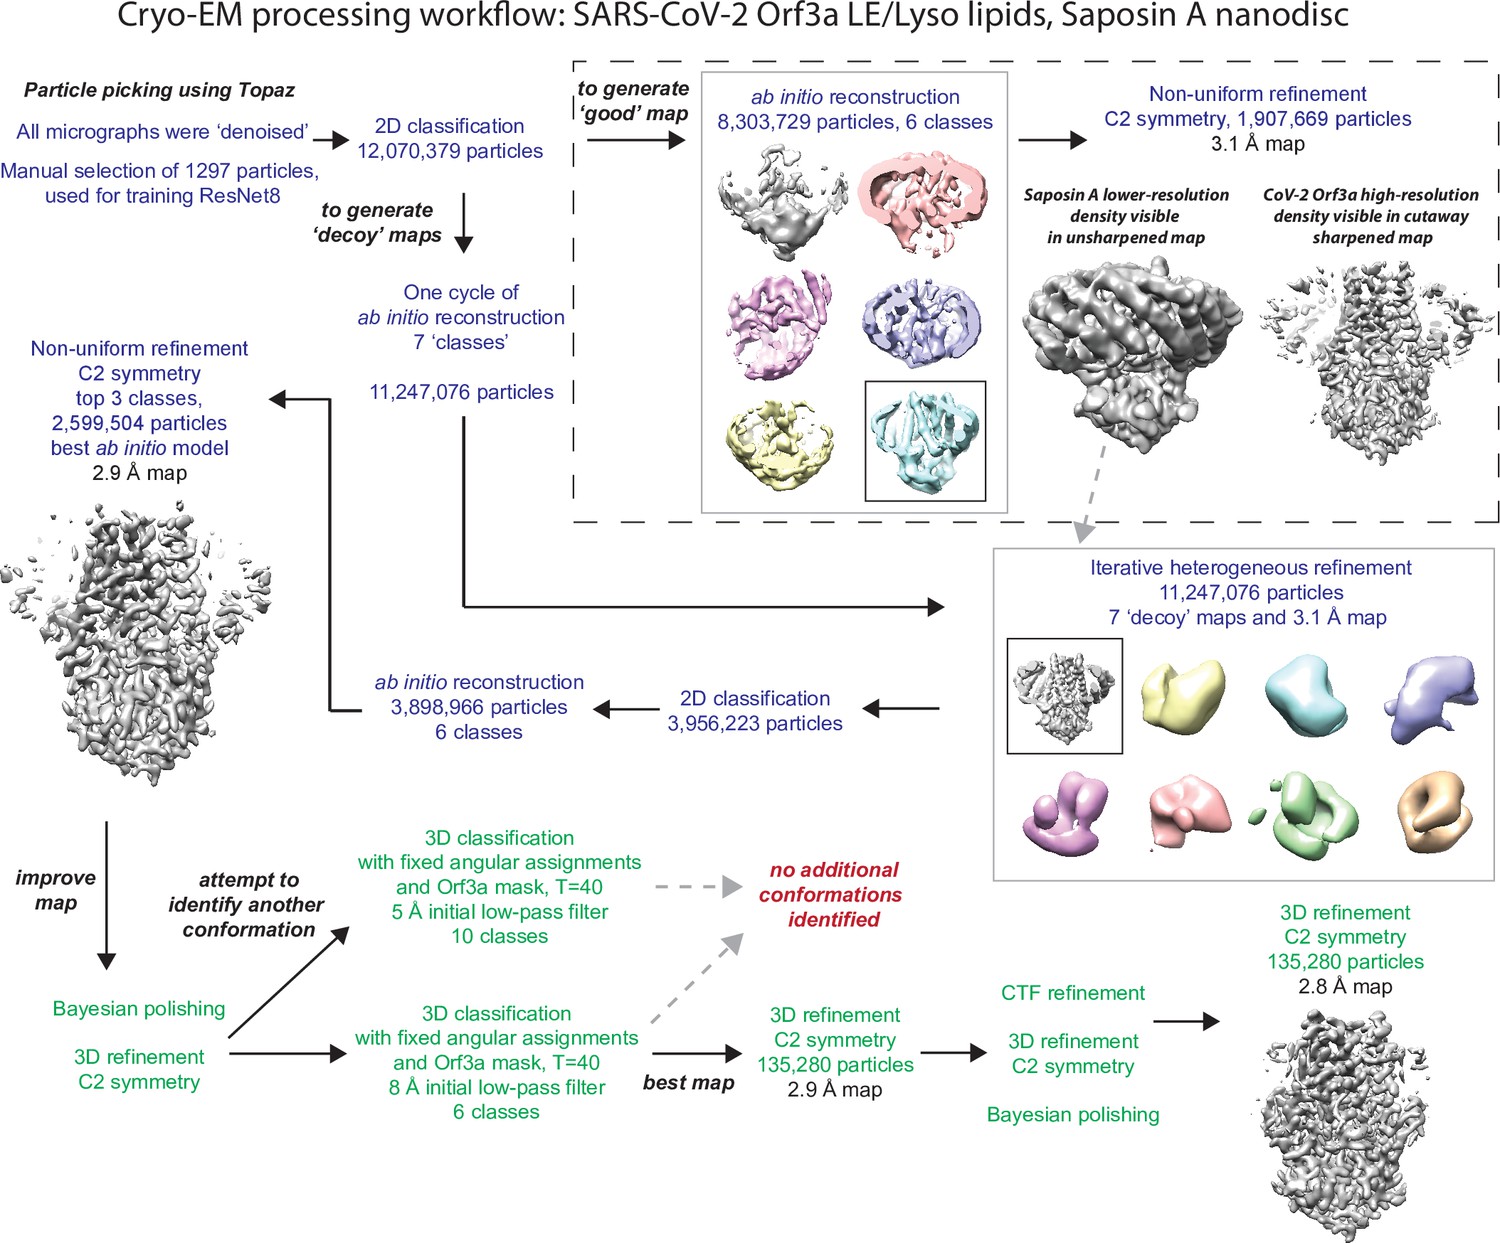
Cryo-EM data processing workflow for SARS-CoV-2 Orf3a reconstituted in LE/Lyso Saposin A-containing nanodiscs.
Text color denotes that the program Relion 3.1 (green) or cryoSPARC v3.0 (dark blue) (Zivanov et al., 2018; Punjani et al., 2017; Punjani et al., 2020). Details are described in the Methods. The initial map generated for iterative heterogeneous refinement (dotted box) displayed both higher-resolution density for CoV-2 Orf3a (gray, sharpened map) and lower-resolution Saposin A molecules surrounding SARS-CoV-2 Orf3a (gray, unsharpened map).
Figure 4—figure supplement 3
Structural determination of SARS-CoV-2 Orf3a LE/Lyso Saposin A nanodisc (A–D) or SARS-CoV-1 LE/Lyso MSP1D1 nanodisc (E–H).
(A, E) Angular orientation distributions of particles used in the final reconstructions. The particle distributions are indicated by color shading, with blue to red representing low and high numbers of particles. (B, F) Fourier Shell Correlation (FSC) curves of the final 3D reconstructions. The overall map resolutions are 2.8 Å (B) or 3.1 Å (F) at the FSC cutoff of 0.143 (dotted line). (C, G) Local map resolutions were estimated using Relion 3.1 and are colored as indicated (Zivanov et al., 2018). (D, H) Model validation. Comparison of the FSC curves between the model and half map 1 (FSCwork), model and half map 2 (FSCfree) and model and full map (FSCfull) (Liebschner et al., 2019). (I) Superposition of the SARS-CoV-2 Orf3a LE/Lyso MSP1D1 (pink) and SARS-CoV-2 Orf3a LE/Lyso Saposin A (purple) structures. (J) Superposition of the SARS-CoV-2 Orf3a (pink) and SARS-CoV-1 Orf3a (green) LE/Lyso MSP1D1 structures.
Figure 4—figure supplement 4
Cryo-EM data processing workflow for SARS-CoV-1 Orf3a reconstituted in LE/Lysosomal MSP1D1-containing nanodiscs.
Text color denotes the program Relion 3.1 (green) or cryoSPARC v3.0 (dark blue) (Zivanov et al., 2018; Punjani et al., 2017; Punjani et al., 2020) Details are described in the Methods.
Figure 4—figure supplement 5
A similar narrow cavity is detected in the TM region of SARS-CoV-1 Orf3a.
(A) Two representative side views of SARS-CoV-1 (CoV-1) Orf3a in LE/Lyso MSP1D1-containing nanodiscs highlighting two subunits (dark and light green). Inspection of the TM region for a pore, depicted as the minimal radial distance from its center to the nearest van der Waals protein contact (HOLE program) (Smart et al., 1996) A region too narrow to conduct ions (white) and an aqueous vestibule (dark blue) are highlighted. (B) Radius of the ion pore (from A) as a function of the distance along the ion pathway. Dashed lines indicate the minimal radius that would permit a dehydrated cation. Blue and white colors follow HOLE diagram of (A). (C) Cutaway of the CoV-1 Orf3a molecular surface to view the aqueous vestibule is colored according to the electrostatic potential (APBS program) (Jurrus et al., 2018). Coloring: blue, positive (+10 kT/e) and red, negative (–10 kT/e).
Figure 5 with 2 supplements
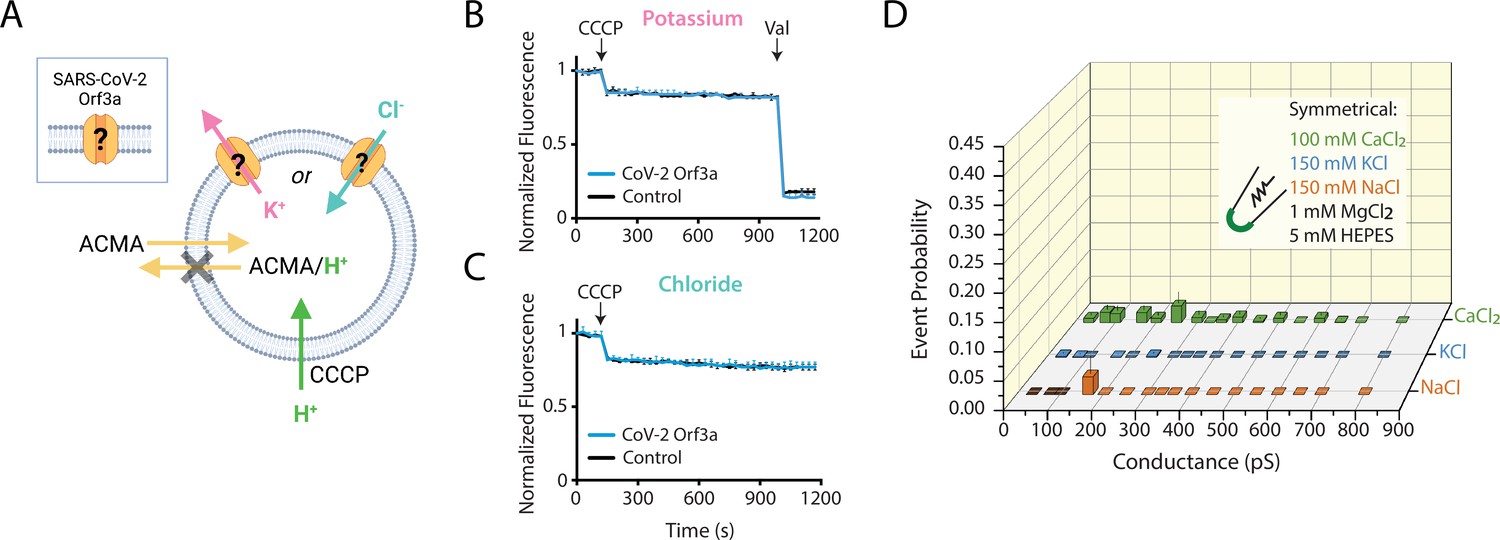
SARS-CoV-2 Orf3a does not elicit ion flux or conductances in a vesicle-reconstituted system.
(A) Schematic of the ACMA-based fluorescence flux assay (Zhang et al., 1994; Heginbotham et al., 1998; Miller and Long, 2012; Kane Dickson et al., 2014). A K+ (pink) or Cl- (blue) gradient is generated by reconstitution and dilution into an appropriate external salt solution (K+ efflux: 150 KCl in, 150 NMDG-Cl out; Cl- flux: 110 Na2SO4 in, 125 NaCl out; in mM). If CoV-2 Orf3a conducts K+ or Cl- ions, then the addition of the protonophore carbonyl cyanide m-chlorophenyl hydrazone (CCCP) will drive H+ (green) influx. ACMA is quenched and sequestered in vesicles at low pH, resulting in loss of ACMA fluorescence. Valinomycin (Val), a K+ permeable ionophore, is added to the end of the K+ flux assay to empty all vesicles. Created with Biorender.com. (B–C) K+ (n=4) (B) or Cl- (n=4) (C) flux is not observed in SARS-CoV-2 (CoV-2) Orf3a2x-STREP-reconstituted vesicles (blue) as compared with the empty vesicle control (black, n=4) using vesicles reconstituted at a 1:100 (wt:wt) protein to lipid ratio. CCCP and Val are added as indicated (arrows). Error is represented as SEM. (D) Probability of observing an open event in a CoV-2 Orf3a2x-STREP-reconstituted proteoliposome patch with vesicle reconstituted at a 1:100 protein to lipid ratio. NaCl, n=27; KCl, n=32, and CaCl2, n=105. Error is represented as SEM.
Figure 5—figure supplement 1
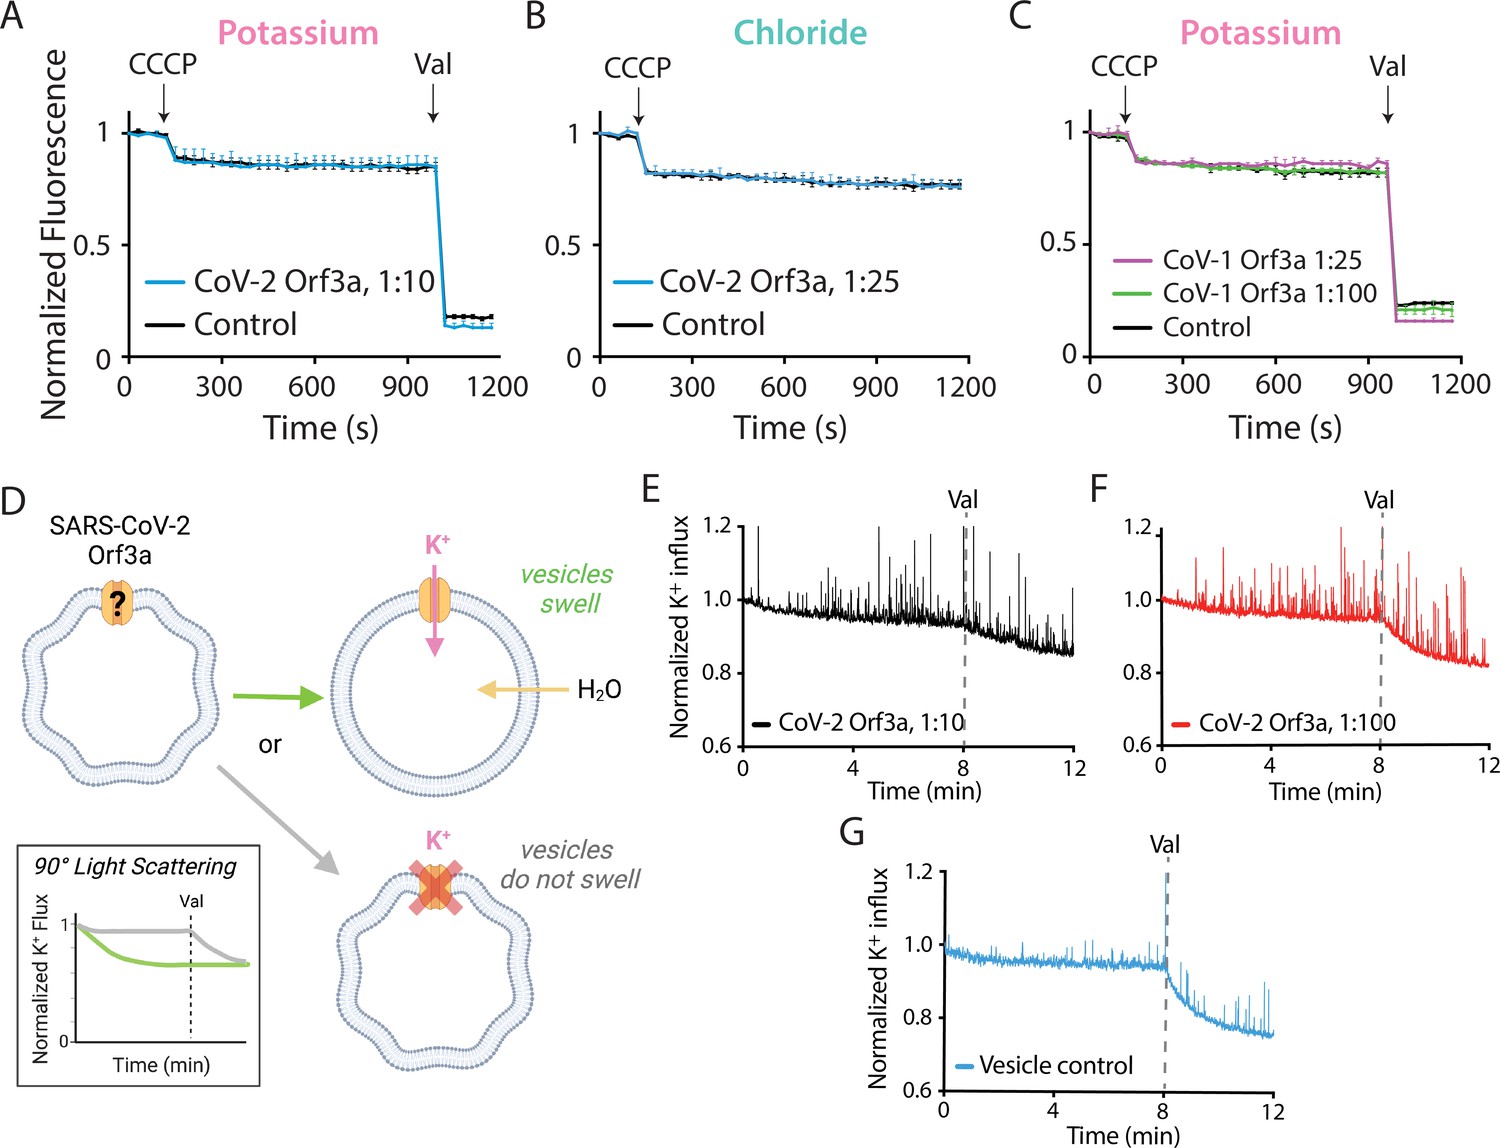
Characterization of vesicle-reconstituted SARS-CoV-1 and SARS-CoV-2 Orf3a at low and high protein ratios.
(A–B) K+ (A) or Cl- (B) flux is not observed in SARS-CoV-2 (CoV-2) Orf3a2x-STREP-reconstituted vesicles (blue) as compared with the empty vesicle control (black, n=3) using 1:10 (n=3) (A) or 1:25 (n=3) (B) ratios of protein to lipids. The protonophore carbonyl cyanide m-chlorophenyl hydrazone (CCCP) and K+-permeable ionophore valinomycin (Val) are added as indicated (arrows). Error is represented as SEM. (C) K+ flux is not observed in SARS-CoV-1 Orf3a2x-STREP-reconstituted vesicles (blue) as compared with the empty vesicle control (black, n=3) using a 1:25 (purple, n=3) or 1:100 (green, n=3) ratio of protein to lipids. Error is represented as SEM. (D) Schematic of 90° light-scattering K+ flux assay (Brammer et al., 2014; Stockbridge et al., 2012). CoV-2 Orf3a vesicles reconstituted in 200 mM K-glutamate are diluted into a hypertonic buffer containing 260 mM K-thiocyanate, resulting in vesicle shrinkage. If CoV-2 Orf3a is a K+-selective viroporin, then the asymmetrical K+ concentration should drive K+ influx, leading to water absorption, vesicle swelling (green arrow) and a reduction of 90° light-scattering (green line, inset). If CoV-2 Orf3a is not a K+-selective viroporin, then vesicles will not swell (gray arrow) and no change in 90° light-scattering should be observed (gray line, inset). The addition of Val (dotted line) leads to vesicle swelling and reduction of 90° light-scattering should be observed for all vesicles in the sample. Created with Biorender.com. (E–G) No difference in normalized K+ influx is observed among SARS-CoV-2 Orf3a2x-STREP reconstituted using 1:10 (E, black) or 1:100 (F, red) ratio of protein to lipids, and control vesicles (G, blue).
Figure 5—figure supplement 2
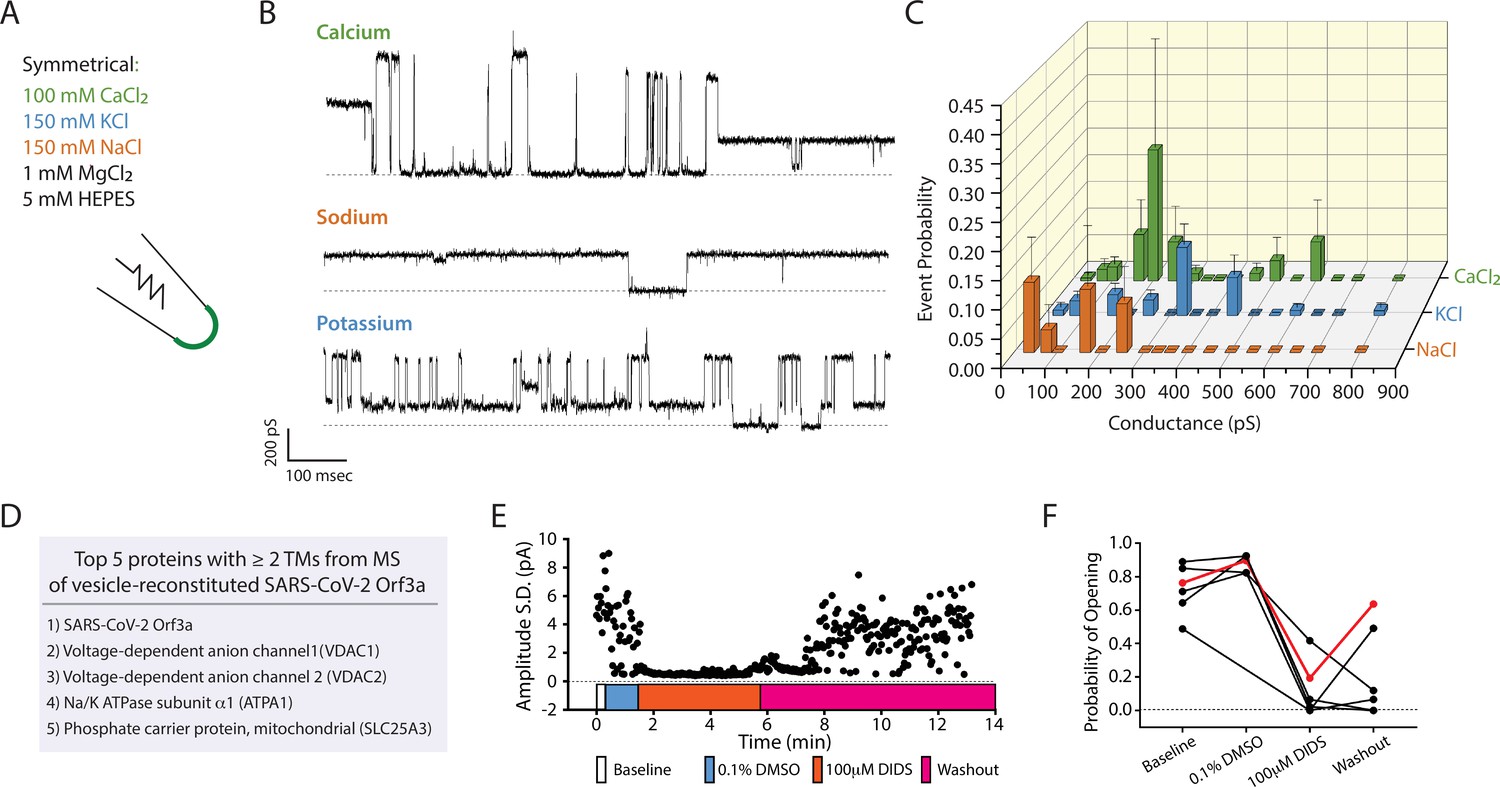
Multiple conductance species are observed from SARS-CoV-2 Orf3a containing-vesicles reconstituted at a high protein to lipid ratio and likely result from transient membrane leakiness and/or contamination by bona fide ion channels.
(A) Symmetrical recording solutions with CaCl2 (green), KCl (blue) or NaCl (orange) used for proteoliposome patch-clamp experiments. (B) Multiple K+, Na+ and Ca2+ conductance species are observed by proteoliposome patch-clamp with SARS-CoV-2 (CoV-2) Orf3a2x-STREP-containing vesicles reconstituted at a 1:10, but not 1:100 (Figure 5E), ratio of protein to lipid. (C) Probability of observing an open event in a CoV-2 Orf3a2x-STREP reconstituted proteoliposome patch with vesicles reconstituted at a 1:10 ratio of protein to lipid. NaCl, n=18; KCl, n=114; and CaCl2, n=35. Error is presented as SEM. (D) Table of the top 5 proteins with 2 TM helices or greater from mass spectrometry analysis of CoV-2 Orf3a2x-STREP containing vesicles reconstituted at a 1:10 protein to lipid ratio. (E) Addition of 100 μM 4,4'-Diisothiocyano-2,2'-stilbenedisulfonic Acid (DIDS; orange trace), a blocker of VDAC channels, eliminates the Ca2+ currents observed with proteoliposome patches-reconstituted CoV-2 Orf3a2x-STREP, whereas DMSO has no effect (blue). (F) Open probability of proteoliposome patches-reconstituted CoV-2 Orf3a2x-STREP sample following protocol from (E).
Figure 6 with 1 supplement
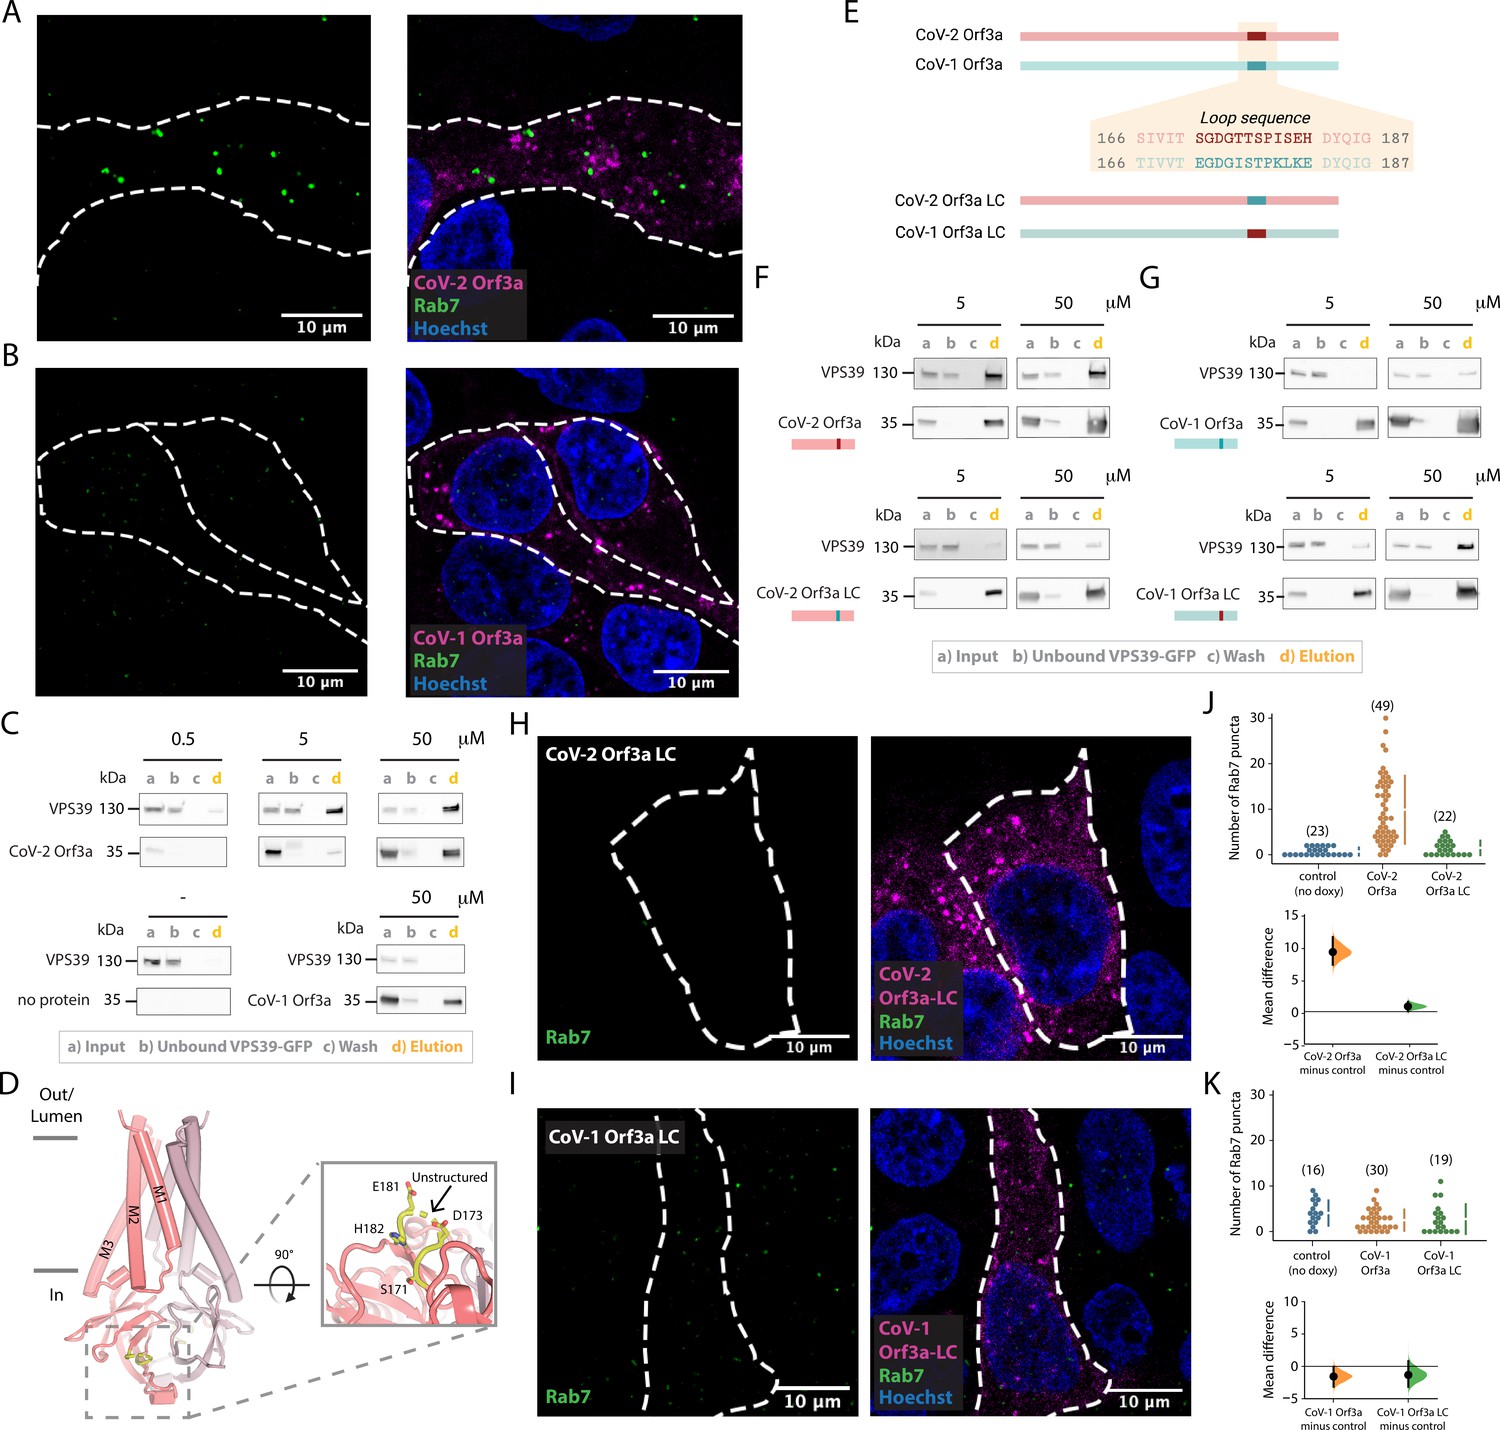
SARS-CoV-2 Orf3a, but not SARS-CoV-1 Orf3a, interacts with HOPS protein, VPS39.
(A–B) Rab7 puncta (green) are abundant in HEK293 cells expressing (A) SARS-CoV-2 (CoV-2) Orf3aHALO (magenta), but not (B) SARS-CoV-1 (CoV-1) Orf3aHALO (magenta; Hoechst 33342, blue). (C) Co-immunoprecipitation (co-IP) evaluating the interaction of VPS39GFP with CoV-1 and CoV-2 Orf3a2x-STREP, detected by western blot with antibodies against GFP and streptavidin, respectively. VPS39GFP elutes with CoV-2 Orf3a2x-STREP in a concentration-dependent manner, but does not elute with purified CoV-1 Orf3a2x-STREP (compare VPS39 in d lanes, orange). Control, co-IP without Orf3a2x-STREP added (bottom left, no protein). VPS39GFP and Orf3a2x-STREP migrate at ~130 and 35 kDa, respectively, by SDS-PAGE. (D–I) An unstructured loop of CoV-2 Orf3a partially mediates its interaction with VPS39. (D) Side view of CoV-2 Orf3a structure with the subunits (dark and light pink) and unstructured loop highlighted (yellow, dotted box). Zoom-in of the loop from the cytosol (solid box) with resolved loop residues. (E) CoV-2 Orf3a (red) and CoV-1 Orf3a (blue green) loop sequences. Orf3a wild-type (WT) and loop chimeras (LC) are color matched or swapped. Created with Biorender.com (F) Co-IP as in Figure 6C with CoV-2 Orf3a constructs showing loss of VPS39GFP elution with CoV-2 Orf3a LC2x-STREP (compare VPS39 in d lanes, orange). The co-IPs presented in this figure represent three to seven independent experiments. (G) Co-IP of VPS39GFP with CoV-1 Orf3a constructs shows an enrichment with CoV-1 Orf3a LC2x-STREP. (H, I) Rab7 puncta (green) are absent in CoV-2 Orf3a LCHALO (H, magenta) or CoV-1 Orf3a LCHALO-expressing HEK293 cells (I, magenta; Hoechst 33342, blue), consistent with Chen et al., 2021. (J–K) Cumming estimation plots of Rab7 puncta from (A, H) (J) and (B, I) (K) (Ho et al., 2019).
-
Figure 6—source data 1
Raw unedited western blots and figures with the uncropped blots for Figure 6C.
- https://cdn.elifesciences.org/articles/84477/elife-84477-fig6-data1-v2.zip
-
Figure 6—source data 2
Raw unedited western blots and figures with the uncropped blots for Figure 6F.
- https://cdn.elifesciences.org/articles/84477/elife-84477-fig6-data2-v2.zip
Figure 6—figure supplement 1
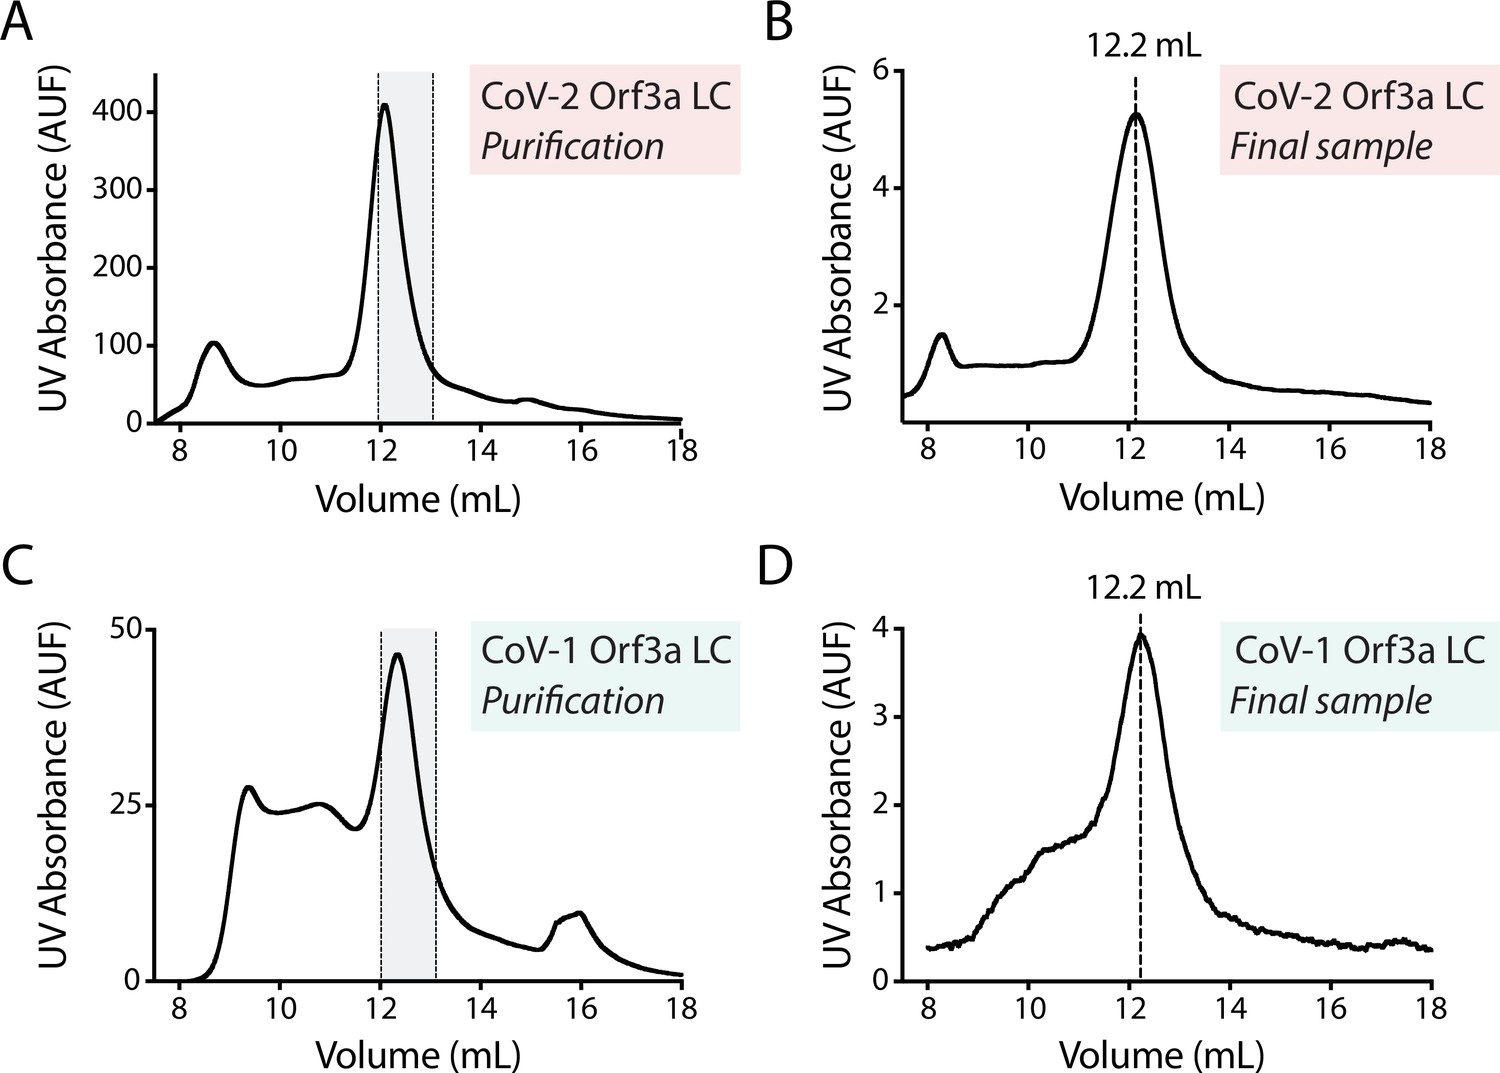
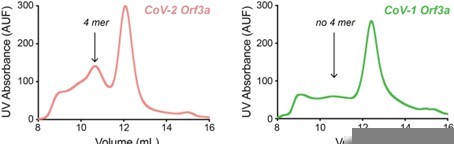
Purification of SARS-CoV-1 and SARS CoV-2 Orf3a loop chimeras.
(A, C) Gel filtration traces from (A) SARS-CoV-2 Orf3a loop chimera (CoV-2 Orf3a LC) and (C) SARS-CoV-1 Orf3a loop chimera (CoV-1 Orf3a LC) after elution from Strep-Tactin XT column. Collected peak fraction is highlighted in gray. (B, D) Gel filtration traces of final samples of (B) CoV-2 Orf3a LC and (D) CoV-1 Orf3a LC used for the co-IP experiments (Figure 6F–G).
Figure 7
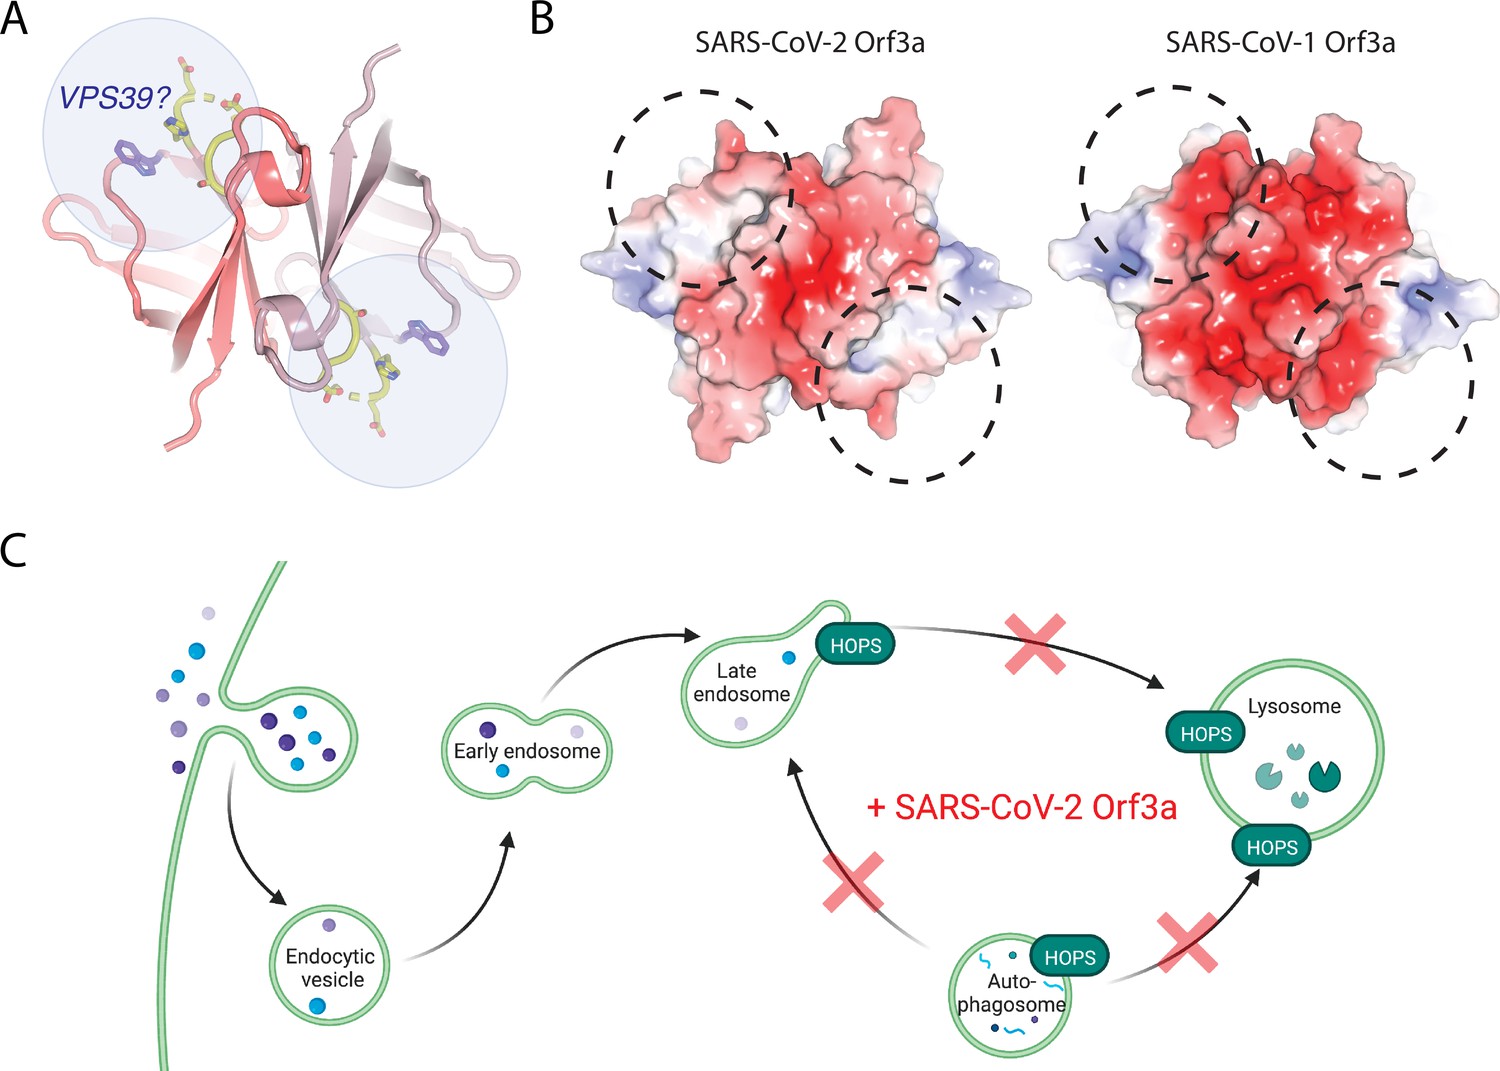
A region of VPS39 and SARS-CoV-2 Orf3a interaction.
(A) Cytosolic view of SARS-CoV-2 Orf3a structure (dark and light pink) with the unstructured loop highlighted in yellow. W193 (purple, sticks) has also been described to mediate an interaction between SARS-CoV-2 Orf3a and VPS39 (Chen et al., 2021). Putative VPS39 interfaces are indicated (light blue spheres) with potential stoichiometries of 1:1 or 1:2 molecules of VPS39 to SARS-CoV-2 Orf3a. (B) Cytosolic surface of SARS-CoV-2 and SARS-CoV-1 Orf3a colored by their electrostatic potential (APBS program): blue, positive (+5 kT/e); red, negative (–5 kT/e) (Jurrus et al., 2018). The putative VPS39 interfaces (dotted black lines) are the same as indicated in (A). (C) Working model of SARS-CoV-2 Orf3a dysregulation of late endosome and autophagosome fusion with lysosomes. HOPS-dependent regions of the endocytic and autophagy pathways that are disrupted by SARS-CoV-2 Orf3a are indicated (red X). Adapted from “Mutation of HOPS Complex Subunits”, by BioRender.com (2022). Retrieved from https://app.biorender.com/biorender-templates.
Author response image 1
Additional files
-
MDAR checklist
- https://cdn.elifesciences.org/articles/84477/elife-84477-mdarchecklist1-v2.docx
-
Supplementary file 1
Cryo-EM data collection, refinement, and validation statistics.
- https://cdn.elifesciences.org/articles/84477/elife-84477-supp1-v2.docx
Download links
A two-part list of links to download the article, or parts of the article, in various formats.
Downloads (link to download the article as PDF)
Open citations (links to open the citations from this article in various online reference manager services)
Cite this article (links to download the citations from this article in formats compatible with various reference manager tools)
The SARS-CoV-2 accessory protein Orf3a is not an ion channel, but does interact with trafficking proteins
eLife 12:e84477.
https://doi.org/10.7554/eLife.84477


