Against cortical reorganisation
- MRC Cognition and Brain Sciences Unit, University of Cambridge, United Kingdom
- Department of Neuroscience, Johns Hopkins University School of Medicine, United States
- Department of Neurology, Johns Hopkins University School of Medicine, United States
- The Santa Fe Institute, United States
Figures
Figure 1
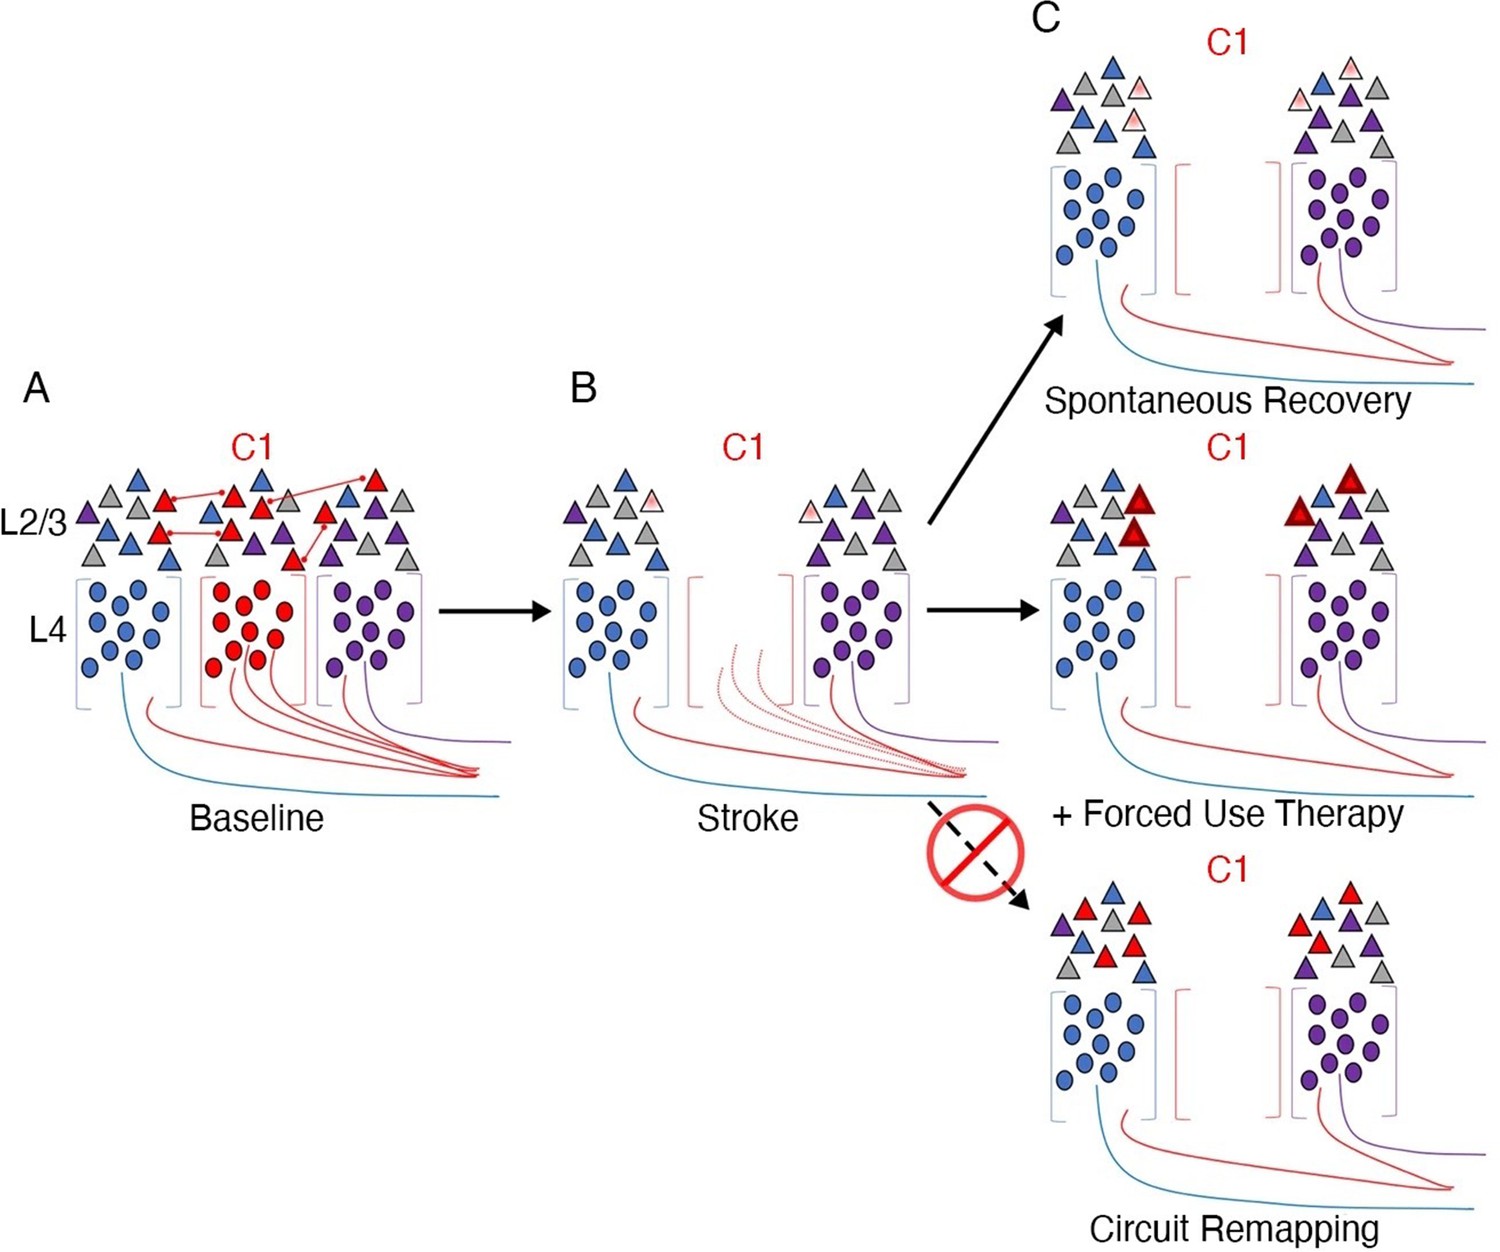
Stroke to the barrel cortex in mice unmasks existing latent functions but does not result in circuit reorganisation.
An illustration of whisker remapping in somatosensory barrel cortex post-stroke. (A) Distribution of whisker-responsive neurons in L4 (circles, via thalamic input) and L2/4 (triangles, via intracortical inputs) in three adjacent barrels at baseline. Colours denote responsivity to a particular whisker (red = C1). Note that within a given barrel, L2/3 neurons are tuned to both the principal and surround whiskers. (B) After stroke targeting C1, the proportion of surround barrel neurons that are tuned to the C1 whisker attenuates, and their sensory-evoked responses are reduced (paler shading). (C) Spontaneous recovery (top panel) results in restoration of the proportion of surround barrel neurons tuned to the C1 whisker destroyed by stroke, but their sensory-evoked responses remain depressed, and there is no retuning of spared neurons to replace neurons lost to stroke. Forced use therapy (middle panel) after stroke restores and potentiates sensory-evoked responses in surround whisker neurons, but does not result in true circuit remapping with recruitment of new C1 whisker-responsive neurons (bottom panel). This figure was reproduced from Figure 7 from Zeiger et al., 2021.
Figure 2
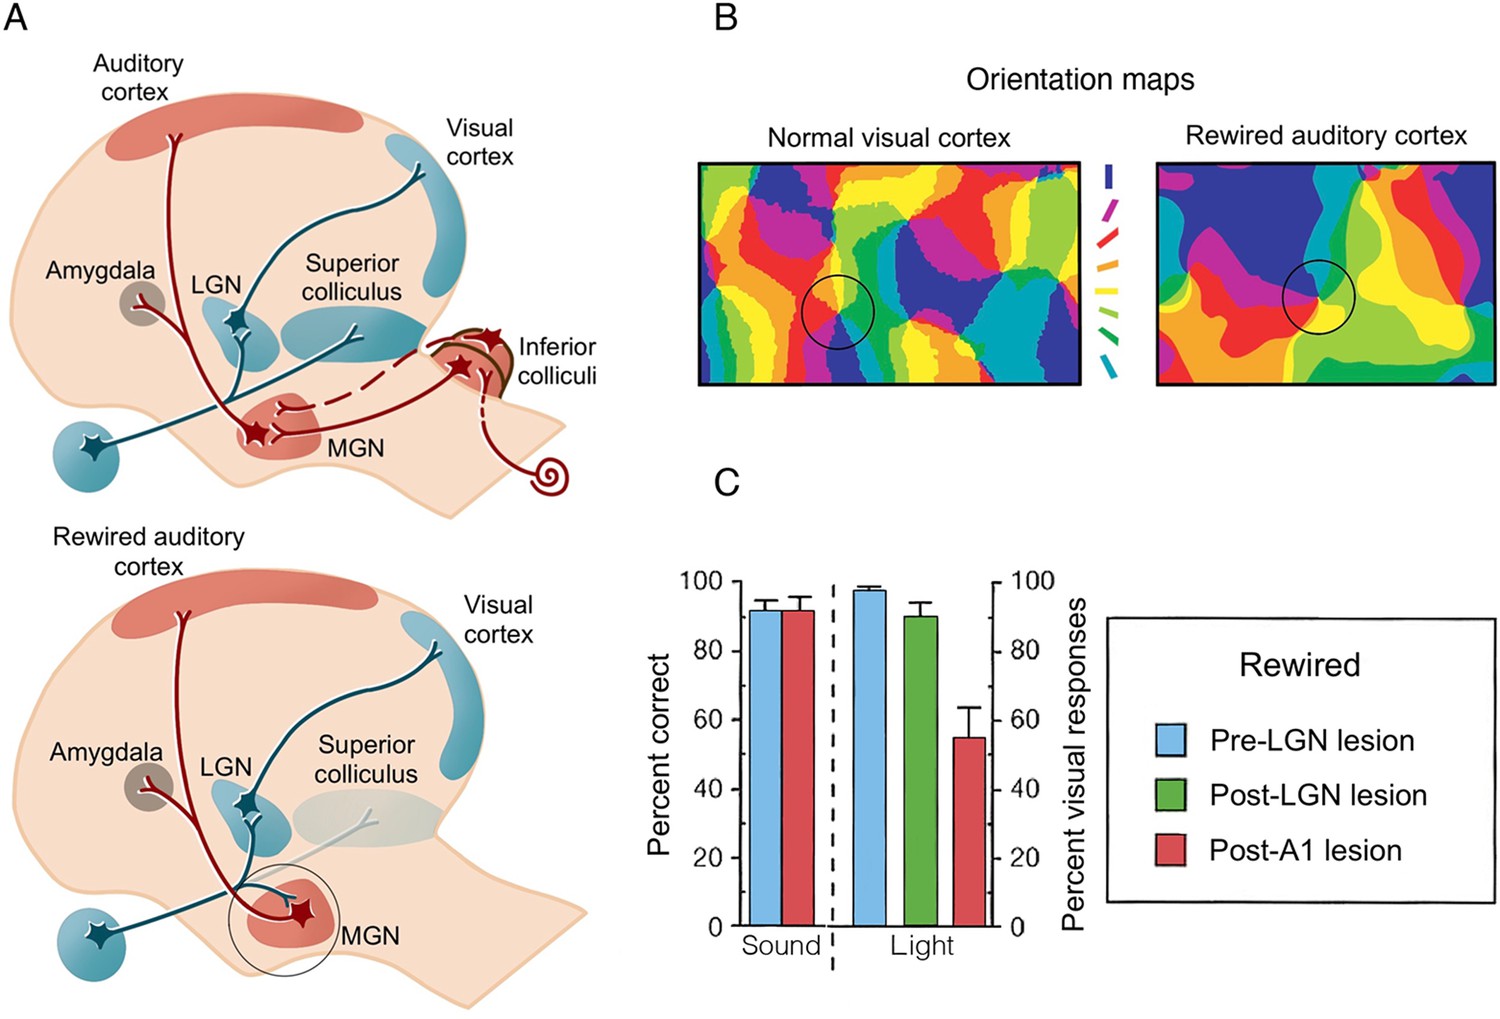
Artificial rewiring of retinal inputs into the ferret’s developing auditory thalamus.
(A) Top: Normally, retinal information is routed to the visual cortex directly via the lateral geniculate nucleus (LGN), as well as via the superior colliculus, whereas auditory information is routed to auditory cortex (A1) via the inferior colliculus and the medial geniculate nucleus (MGN). Bottom: In a famous series of studies, retinal projections were diverted from the superior colliculus to the auditory MGN (highlighted in a circle), which directly connects to A1. Consequently, visual input is artificially fed onto an auditory pathway. (B) A winner-takes-all orientation selectivity map in normal visual cortex (V1) and in the rewired A1 showing similar visual functional organisation features. Qualitatively, the rewired A1 is showing patches of orientation-selective cells that is characteristic of V1. Orientation colour code is shown in the middle. (C) Sound versus light discrimination performance in a ferret undergoing unilateral visual rewiring. After visual rewiring and before lesioning (blue), both sound and light detection (contralateral to the rewired pathway) were high. A1 lesioning (red) resulted in profound reduction of light (but not sound) detection, whereas lesioning of the visual pathway (LGN/LP, green) did not significantly affect performance, providing causal evidence for the involvement of the rewired A1 in visual behaviour. (A–B) were adapted from Figure 4 from Sur and Rubenstein, 2005; (C) was adapted from Figure 2 from von Melchner et al., 2000.
© 2005, Science. Figure 2A and 2B are adapted from Figure 4 from Sur and Rubenstein, 2005 with permission from Science. They are not covered by the CC-BY 4.0 license and further reproduction of these panels would need permission from the copyright holder.
© 2000, Nature. Figure 2C is adapted from Figure 2 from von Melchner et al., 2000 with permission from Nature. It is not covered by the CC-BY 4.0 license and further reproduction of this panel would need permission from the copyright holder.
Figure 3
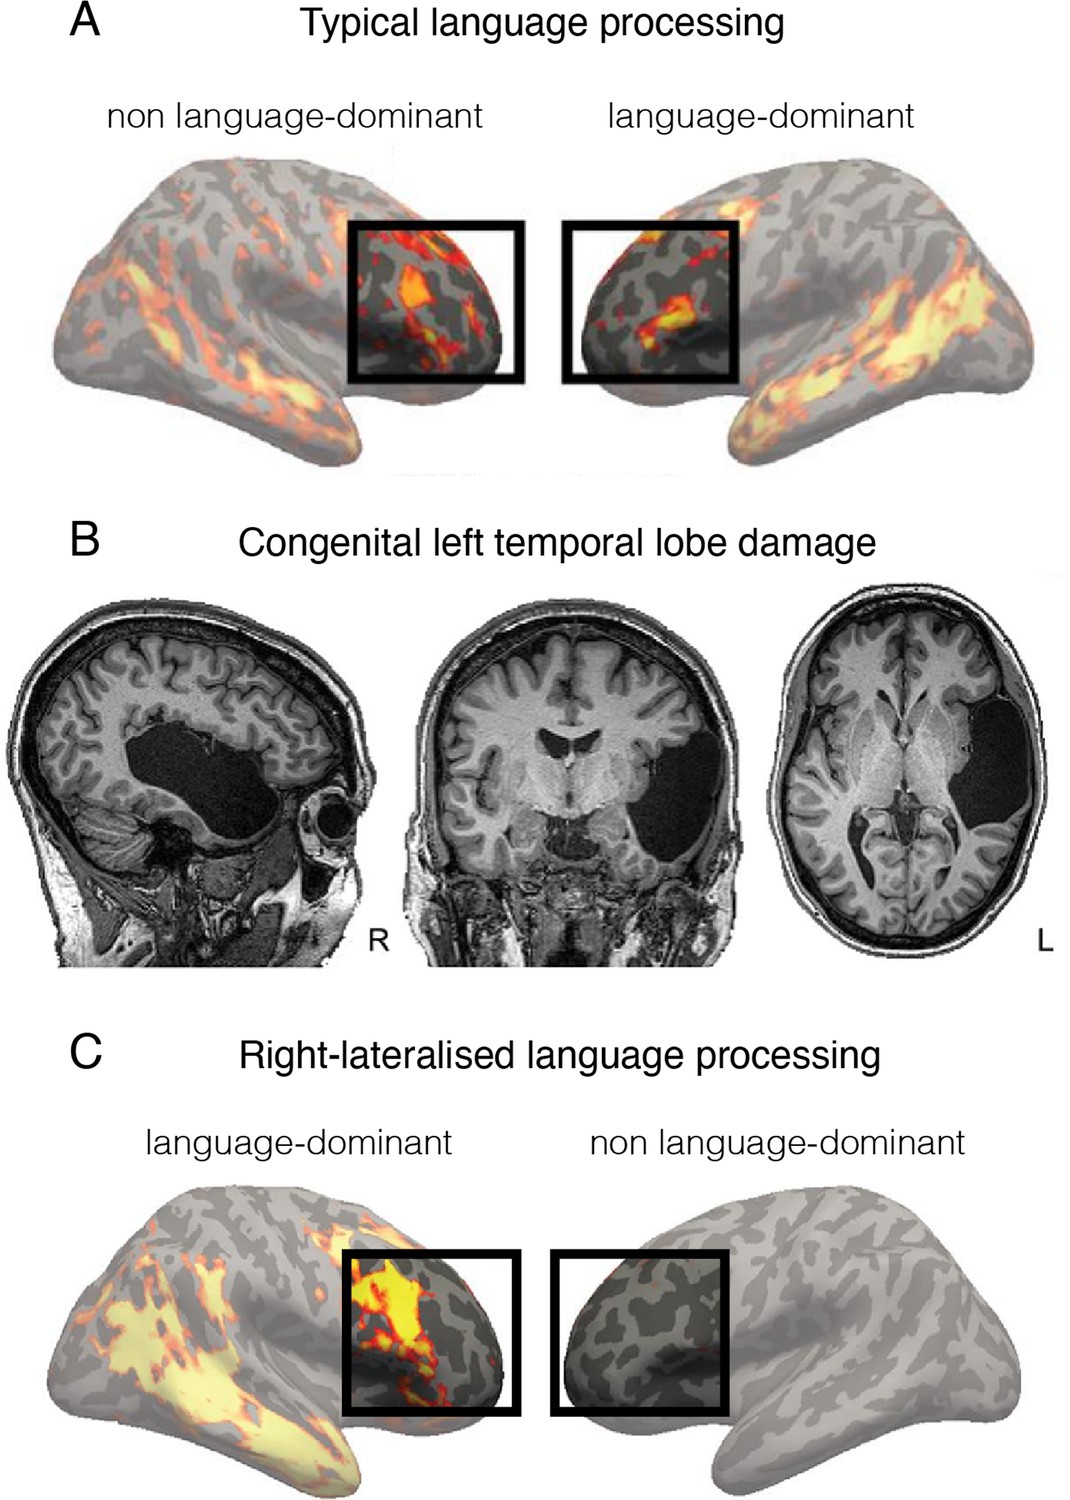
Language is processed bilaterally.
(A) An example of a functional MRI (fMRI) activity map acquired during a language processing task (sentences versus nonwords contrast) in a typically developed individual. The prefrontal language areas are highlighted for emphasis. While the activity is stronger in the left hemisphere (commonly recognised as language-dominant), activity is also very clearly present in the homologous areas in the right (non language-dominant) hemisphere. (B) An individual born without a left temporal lobe. (C) In the absence of a left temporal lobe, language processing is shifted exclusively to the homologous temporal and frontal areas in the right hemisphere. But considering these same brain areas are already activated during language processing in controls (shown in A), it is unnecessary to invoke reorganisation as an underlying process. This figure is adapted from Figures 2a, 3a and b from Tuckute et al., 2021.
Figure 4
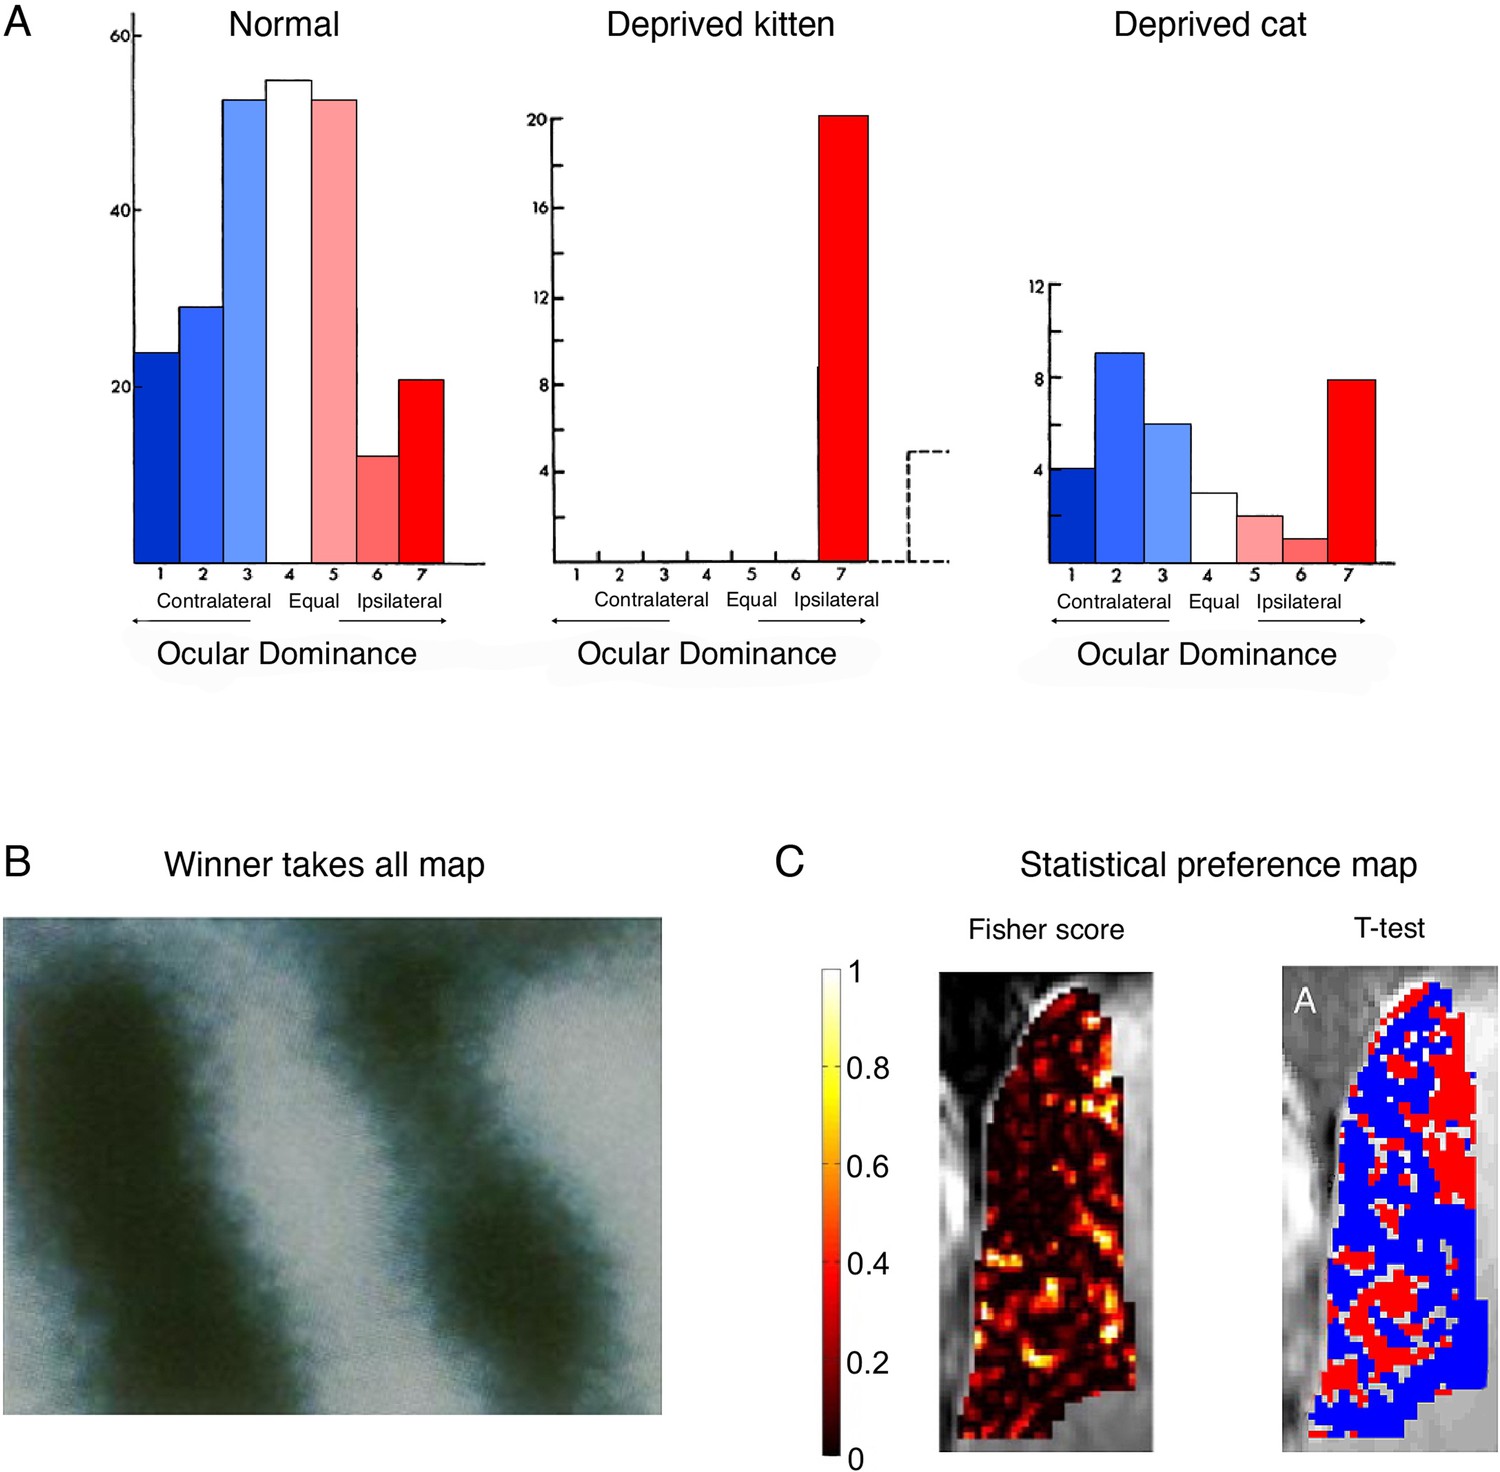
Cortical ocular dominance in primary visual cortex is not categorical.
(A) Ocular dominance in the cats’ visual cortex, as originally reported by Hubel and Wiesel. In normally developed kittens, more cells show a preference to visual input from the contralateral eye (blue), as compared to the ipsilateral eye (red), as indicated by the slight leftward shift in the cells distribution. However, many cells only show weak, and even no preference to one eye versus the other, as indicated by a large number of cells in the middle of the distribution. Following ocular deprivation in early development of one eye, all cells show a strong preference to input from the open (ipsilateral) eye. But considering that most cells showed some response to the ipsilateral eye independently of the occlusion, reorganisation need not be invoked as an explanation of the post-occlusion responses. Monocular occlusion of the one eye in adult cats doesn’t result in a strong shift of dominance towards the spared (ipsilateral) eye. (B) A winner-takes-all map of ocular preference (acquired using optical imaging in a monkey). Dark bands represent columns dominated by input from the right eye, and the light bands represent columns dominated by input from the left eye resulting in the canonical binary (and highly misleading) map of ocular columns with crisp borders. (C) Alternative analyses (and colour scales) lead to very different depiction of ocular dominance maps. For example, consider the visualisation of a ultra-high (7 T) functional MRI (fMRI) dataset in a human, reporting the spatial distribution of ocular dominance. The Fisher score (left panel) highlights that most voxels do not strongly discriminate between the two eyes. However, after imposing a minimal statistical threshold (p<0.15; using a t-test relative to the other eye) and using binary red/blue labels (for the right/left eye, respectively), then the binary spatial columnar features emerge (right panel). We argue that the non-thresholded and non-binarised map provides a more accurate portrait of the functional attributes of ocular dominance. (A) is adapted from Figures 1, 3, 12 from Wiesel and Hubel, 1963; (B) was reproduced from Bartfeld and Grinvald, 1992. Copyright of National Academy of Sciences; (C) was reproduced from Shmuel et al., 2010.
© 1963, Journal of Neurophysiology. Figure 4A is adapted from Figure 1, 3, 12 from Wiesel and Hubel, 1963, with permission from the American Physiological Society (Journal of Neurophysiology). It is not covered by the CC-BY 4.0 license and further reproduction of this panel would need permission from the copyright holder.
© 2010, Elsevier. Figure 4C was reproduced from Figure 2 from Shmuel et al., 2010, with permission from Elsevier (NeuroImage). It is not covered by the CC-BY 4.0 license and further reproduction of this panel would need permission from the copyright holder.
Figure 5
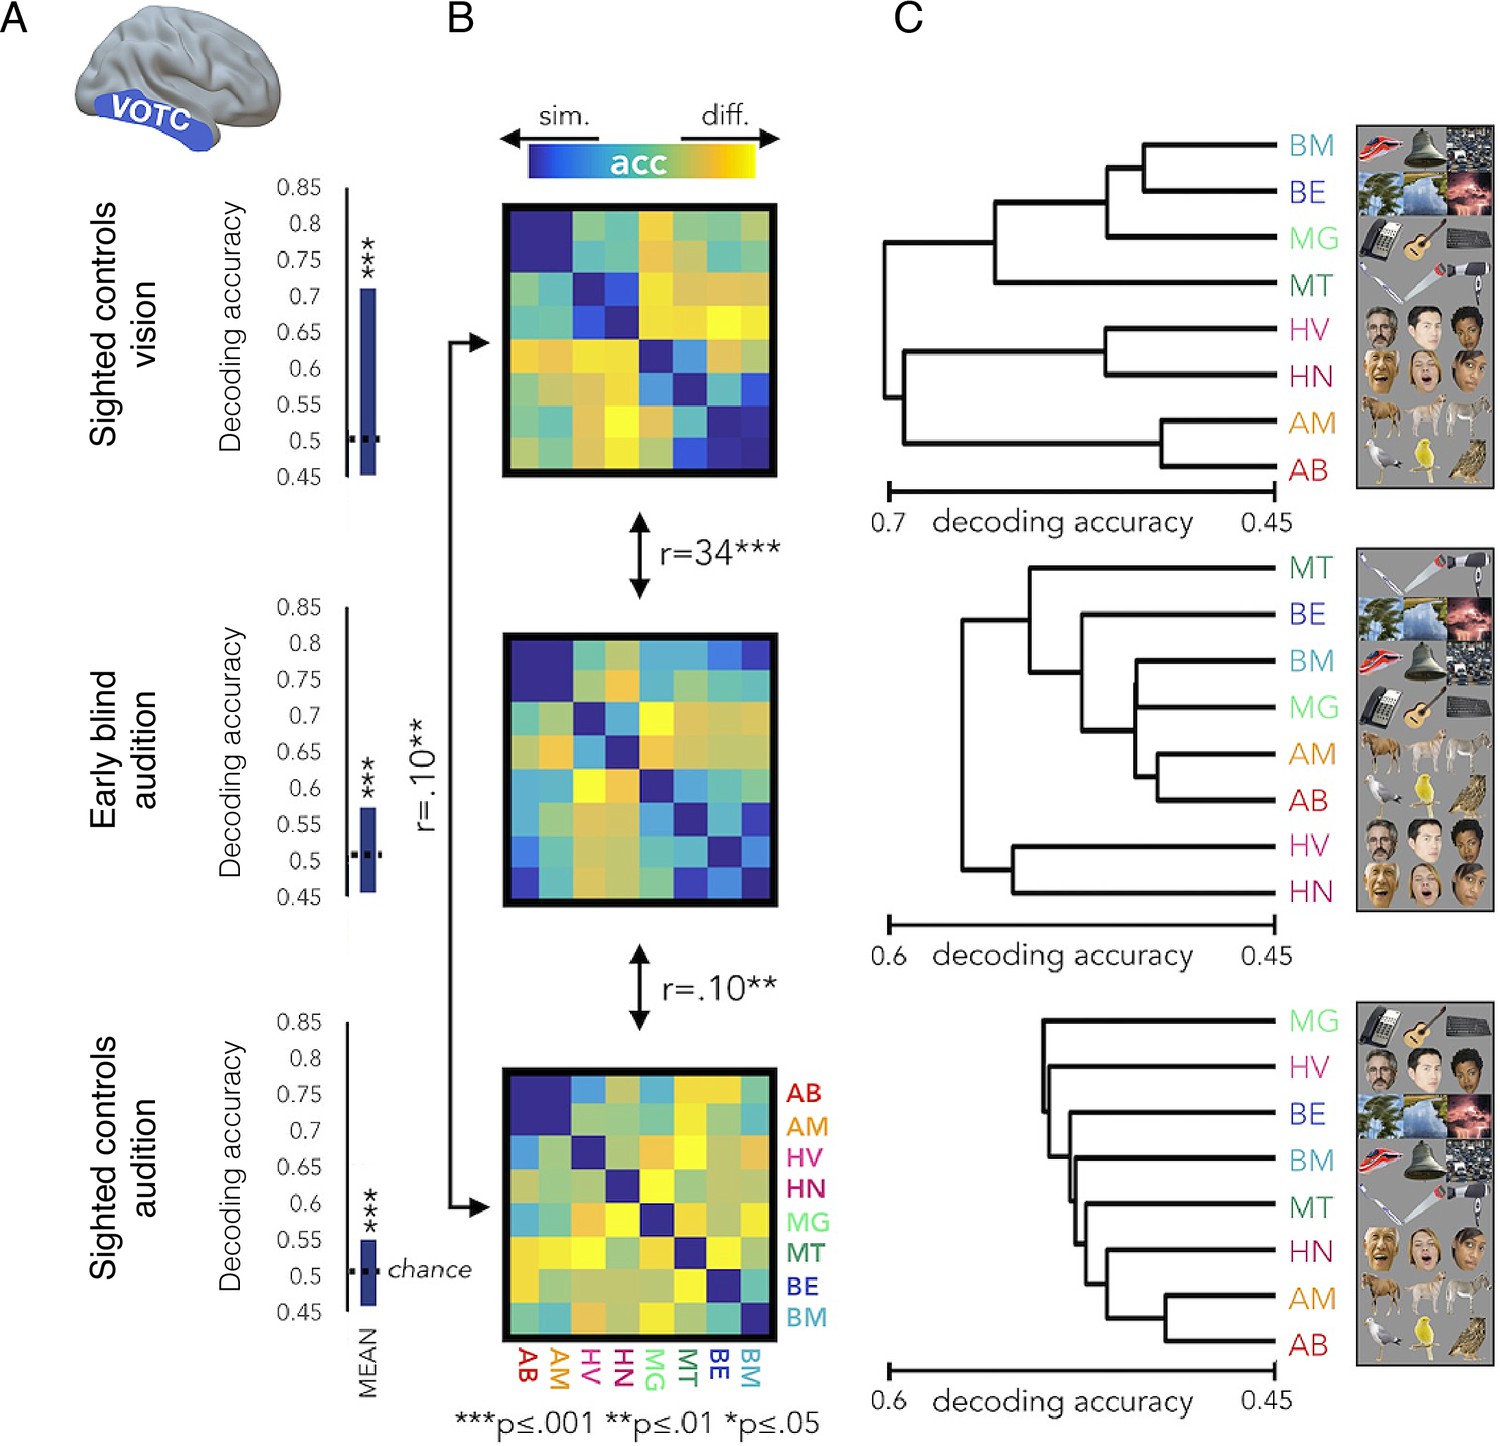
The representational structure of natural object categories in ventral occipitotemporal cortex is invariant between sighted and blind participants.
The multivoxel representational structure across multiple natural object categories was studies in the visual domain in sighted controls, and compared with auditory representational structure found in the ‘visual’ cortex of early blind individuals, as well as sighted controls. The region of interest in the ventral occipitotemporal cortex (VOTC) used for the multivoxel pattern analysis is shown in the left. (A) Averaged binary decoding of functional MRI (fMRI) responses across all natural object category pairs. As expected, decoder accuracy was highest in the visual modality (top). However, for both groups, auditory information content for discriminating across object categories is also available in visual cortex, as indicated in significant above-chance decoding accuracy. This suggests that the cross-modal effects seen in blind individuals (middle) are already present, to some extent, in the sighted (bottom). (B) Representational dissimilarity matrices, showing binary decoding accuracy for each of the category pairs, for the different groups and stimulus modalities. (C) The binary cross-category decoding is plotted here as dendrograms reflecting hierarchical clustering, to allow an intuitive visualisation of the representational structure of categories in VOTC. The auditory representational structure in the blind individuals is more similar to the typical visual structure found in sighted controls. This is demonstrated in the greater correlation between the inter-category dissimilarity matrices for auditory categories in the blind and visual categories in the sighted. This is also portrayed in the more similar hierarchical clustering, as visualised in the dendrograms. This provides an elegant demonstration that cross-modal processing is confounded by the local representational features of this region, such that the underlying functional processing is relatively invariant. Therefore, the specific functional organisation of a given ‘visual’ area is maintained even if it is now driven by an auditory input – a principle termed ‘domain specificity’. Acc = decoder accuracy. This figure is adapted from Figure 4 from Mattioni et al., 2020.
Figure 6
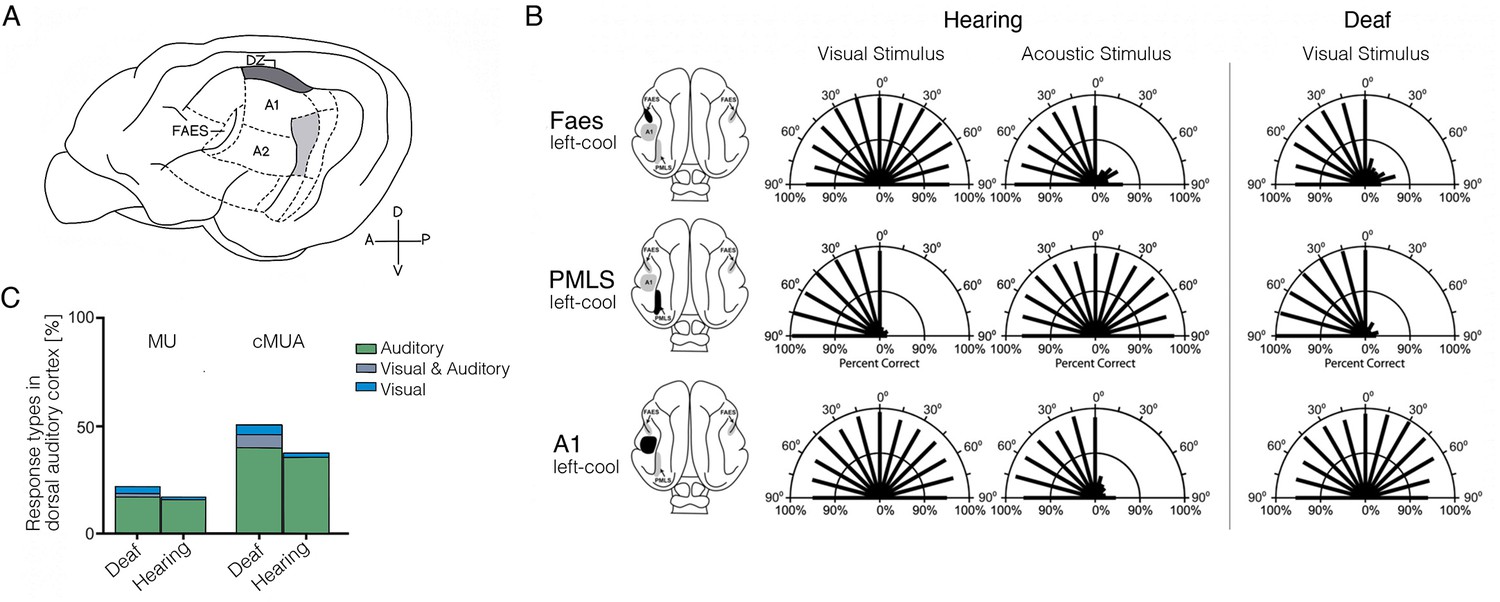
Cross-modal visual processing in higher-order auditory cortex has limited functional impact.
(A) Lateral view of the cat cortex highlighting the locations of the higher-order auditory areas posterior auditory field (PAF), dorsal zone (DZ), auditory field of the anterior ectosylvian sulcus (FAES), as well as the low-level area A1. (B) Orienting responses to visual or acoustic stimuli during reversible cooling deactivation in hearing and deaf cats. Unilateral cooling of the auditory area FAES results in hearing, but not visual, contralateral deficits in hearing cats, and induces contralateral visual orienting deficits in deaf cats. Unilateral deactivation of the visual posteromedial lateral suprasylvian area (PMLS) results in contralateral visual orienting deficits in both hearing and deaf cats, but does not affect acoustic orienting. Unilateral deactivation of A1 results in contralateral acoustic orienting deficits in hearing cats, but has no effect on visual orienting in early-deaf cats. (C) Multiunit (MU; thresholded for spike amplitude) and continuous multiunit activity (cMUA; non-thresholded) recorded in DZ of congenitally deaf and hearing adult cats following a cochlear implant. Proportion of auditory (green), visual (blue), and visuo-auditory (grey) responses were recorded. Using both measures, auditory responses (green) are well matched between the two groups, whereas visual responses (blue), while present in the hearing cats, are more prominent in the deaf cats. (A) is adapted from Figure 5 from Butler et al., 2015; (B) is adapted from Meredith et al., 2011; (C) is reproduced from Figure 5C from Land et al., 2016.
Figure 7
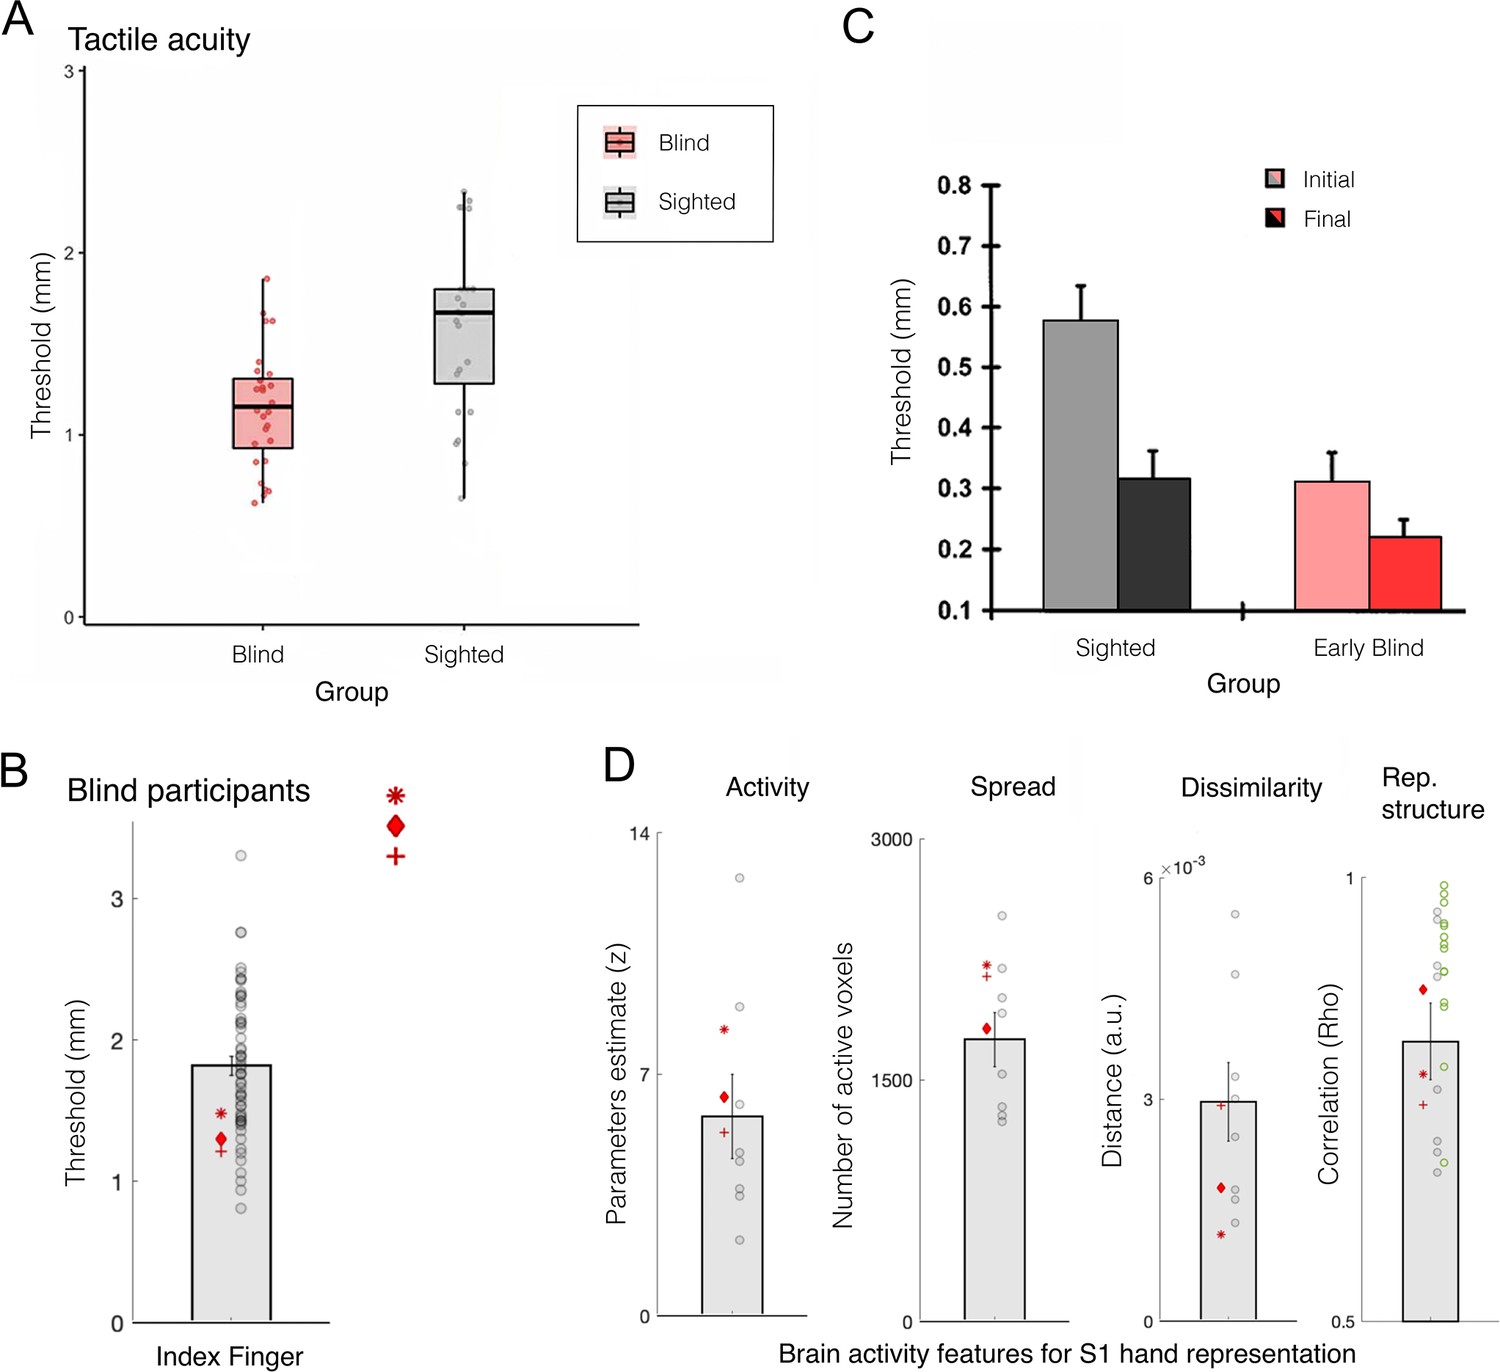
Finger acuity in blind individuals doesn’t relate to map changes to somatosensory cortex.
(A) A replication of several classical studies showing that blind people (pink) exhibit on average better tactile acuity relative to sighted controls (grey), as measured using a tactile gratings discrimination task, where participants are asked to discriminate between two grating orientations applied on their index fingertip. This study finds that blind individuals exhibit lower tactile threshold, relative to sighted controls, indicating they have better sensory perception. (B) A replication study using similar methodology in three blind participants with bilateral anophthalmia (meaning their eyes never developed) against a large sample of sighted controls. Just by increasing the sample of the control participants, this study finds that, while acuity of the blind individuals (red markers) is significantly superior, their performance still falls within the normal range of sighted controls (grey circles). (C) A study examining the influence of training of tactile pattern discrimination on tactile acuity. In keeping with other research, significant group differences were found at the baseline session between the sighted and early blind groups. However, following several days of training on the task (up to 4 consecutive days), performance across groups leveled, and no significant group differences were found. This study highlights that practice could have contributed to the previously observed performance advantages in blind individuals (though we note that a statistical interaction between groups and sessions was not reported in this study). (D) A range of 7 T functional MRI (fMRI) measures for finger representation in primary somatosensory cortex (S1) for the anophthalmia blind individuals shown in (B). S1 finger representation was elicited by applying touch to each of the hand’s fingertips, and compared between the blind individuals and sighted controls in the following domains: activity – net activity level in the hand territory (averaged univariate parameter estimate for all fingers versus rest); spread – number of active voxel (surviving correction for multiple comparisons) in the hand territory; dissimilarity – cross validated Mahalanobis inter-finger distances using representational similarity analysis; representational structure – derived from the distances across all finger pairs, and correlated with a template for canonical hand representation. The green circles show the representational structure of control participants scanned using a slightly adjusted protocol. Across all measures, the S1 hand representation of the blind individuals is comparable to the sighted controls. Rep.=representational. (A) is reproduced from Figure 3 from Radziun et al., 2023; (B) is reproduced from Figure 1 from Wesselink et al., 2021; (C) is reprinted from Figure 2 from Grant et al., 2000; (D) is adapted from Figure 2 from Wesselink et al., 2021.
© 2000, Springer Nature. Figure 7C was reproduced from Figure 2 from Grant et al., 2000 with permission from Springer Nature. It is not covered by the CC-BY 4.0 license and further reproduction of this panel would need permission from the copyright holder
Figure 8
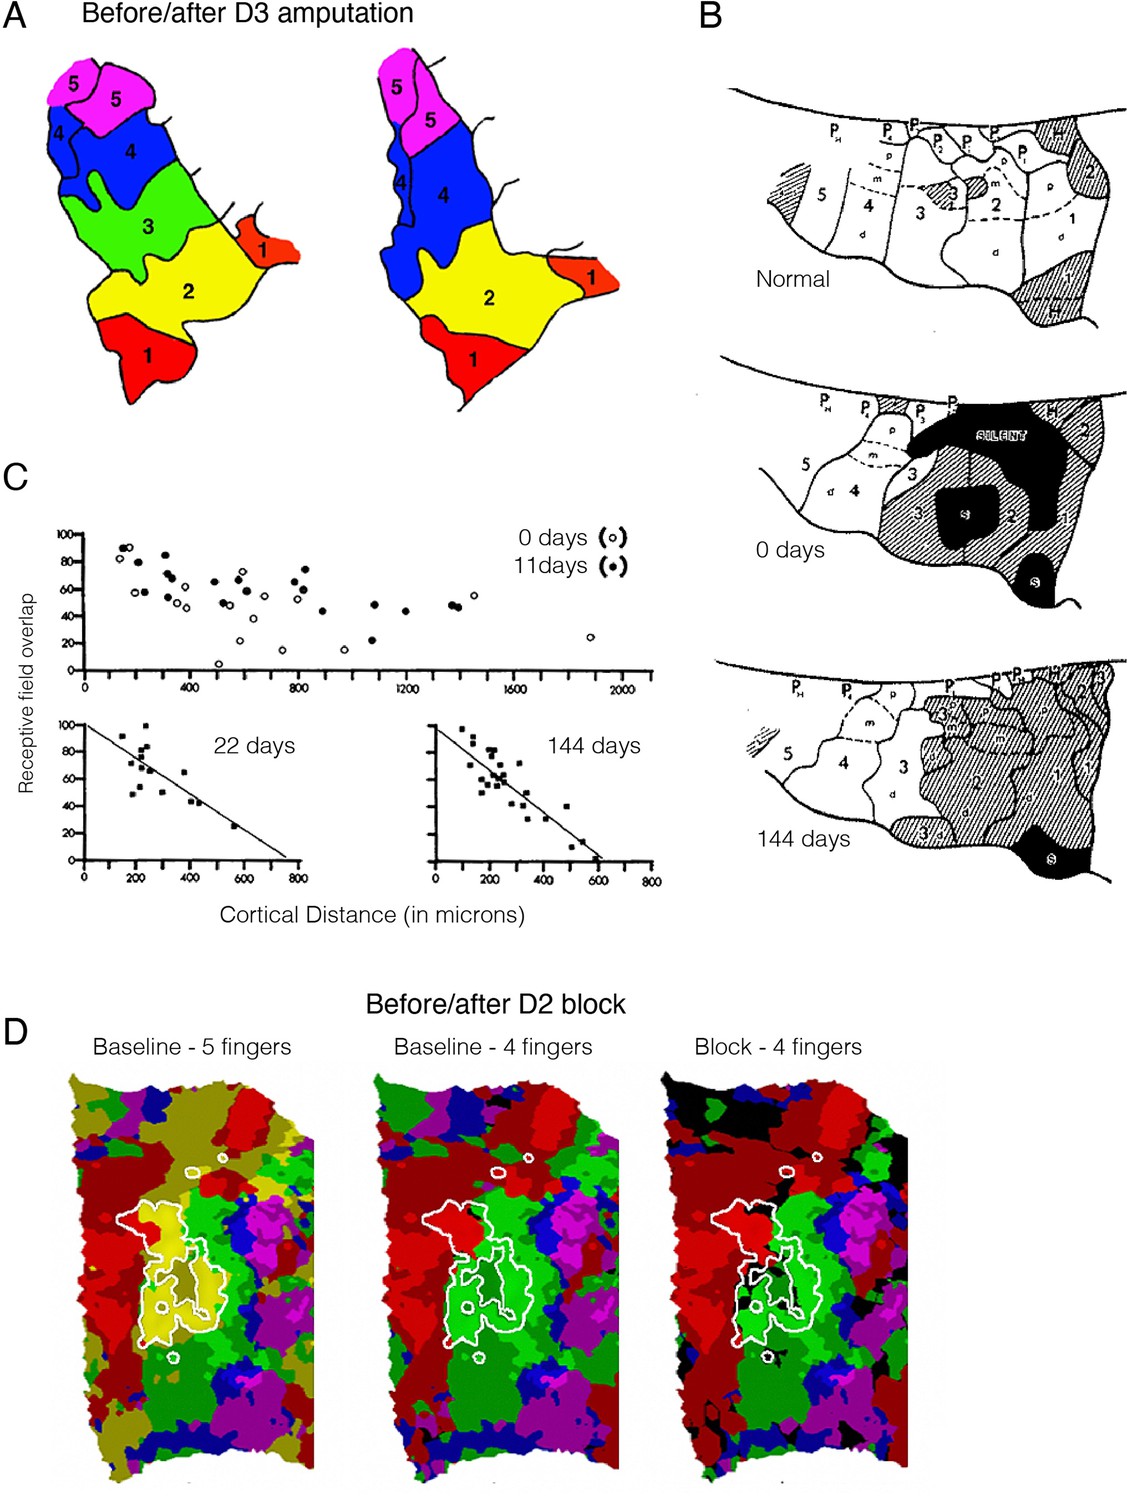
Remapping in the primary somatosensory cortex (S1) hand map does not imply reorganisation.
(A) A finger map in the monkey’s S1, created using a winner-takes-all single-cell recording approach. The map shows clear boundaries between sub-regions dedicated to processing inputs for each of the five monkey’s digits (D1–D5), with neighbouring digits on the hand next to each other in the cortical map. A classical electrophysiological result from Merzenich and colleagues, showing that following digit amputation (D3), the deprived (green) territory gets ‘taken over’ by its cortical neighbours (D2 – yellow and D4 – blue). (B) Remapping following median nerve transection, immediately and (close to) 5 months following deprivation. Top: Typical finger map in the monkey’s S1 hand territory. Each of the five digits (D1–D5) is segmented into its three pads (proximal, medial, dorsal), and its related pad on the palm of the hand. Cortical territory of the glabrous skin (the palm of the hand) is indicated in white, whereas hairy skin (back of the hand) is hatched. Normally, the median nerve mediates sensory information from the glabrous skin of digits D1-D3. 144 days following transection, the cortical territory for the median nerve was activated by touching hairy skin, however most of these activation changes were already noticeable immediately following the nerve transection (day 0), indicating the hairy skin input was already present in the median nerve territory. (C) Retuning of D4 receptive fields in the ‘remapped’ cortex following median nerve transection. In the first few weeks following transection, the receptive field sizes were broadly overlapping across cells, irrespective of their cortical distant from each other. Within a few weeks, the topographic features were restored. Therefore, remapping here can be described as the process of tuning and refining pre-existing receptive fields which already have the innate capacity to process the ‘remapped’ input. (D) Remapping can simply be the consequence of methodological choices. Winner-takes-all assignment of voxels to fingers (based on 7T functional MRI [fMRI] activity), in the S1 cortical hand territory of an example participant (colours as in (A)) before (left - baseline) and after (right - block) pharmacological deafferentation of D2 using a nerve block. The white outline shows a highly selective D2 cluster, as identified independently. When comparing four fingers (i.e. excluding D2, following the nerve block) instead of all five, we see ‘invasion’ of the neighbouring fingers (D1, red; D3, green) into the D2 territory (white outline), as shown on the right. Crucially, further analysis reveals that this is due to the statistical procedure, rather than the D2 nerve block: performing the same analysis (comparing four fingers and excluding D1) on the baseline dataset resulted in similar ‘remapping’ as found in the block map, as shown in the middle panel. Bright and shaded colours indicate activated (Z>0) voxels inside and outside the independently localised finger clusters, respectively; black indicates below-zero activity. Images were adapted from: (A) is reprinted from Figure 1 from Merzenich et al., 1984; (B) is reprinted from Figure 7 from Merzenich et al., 1983a, and (C) from Figure 13; (D) is reproduced from Figure 2 from Wesselink et al., 2022.
© 1984, Elsevier. Figure 8A was reproduced from Figure 1 from Merzenich et al., 1984 with permission from Alan R. Liss, Inc. It is not covered by the CC-BY 4.0 license and further reproduction of these panels would need permission from the copyright holder
© 1983, Elsevier. Figure 8B was reproduced from Figure 7 from Merzenich et al., 1983a with permission from Elsevier Ltd. It is not covered by the CC-BY 4.0 license and further reproduction of these panels would need permission from the copyright holder
© 1983, Elsevier. Figure 8C was reproduced from Figure 13 from Merzenich et al., 1983a with permission from Elsevier Ltd. It is not covered by the CC-BY 4.0 license and further reproduction of these panels would need permission from the copyright holder
Figure 9
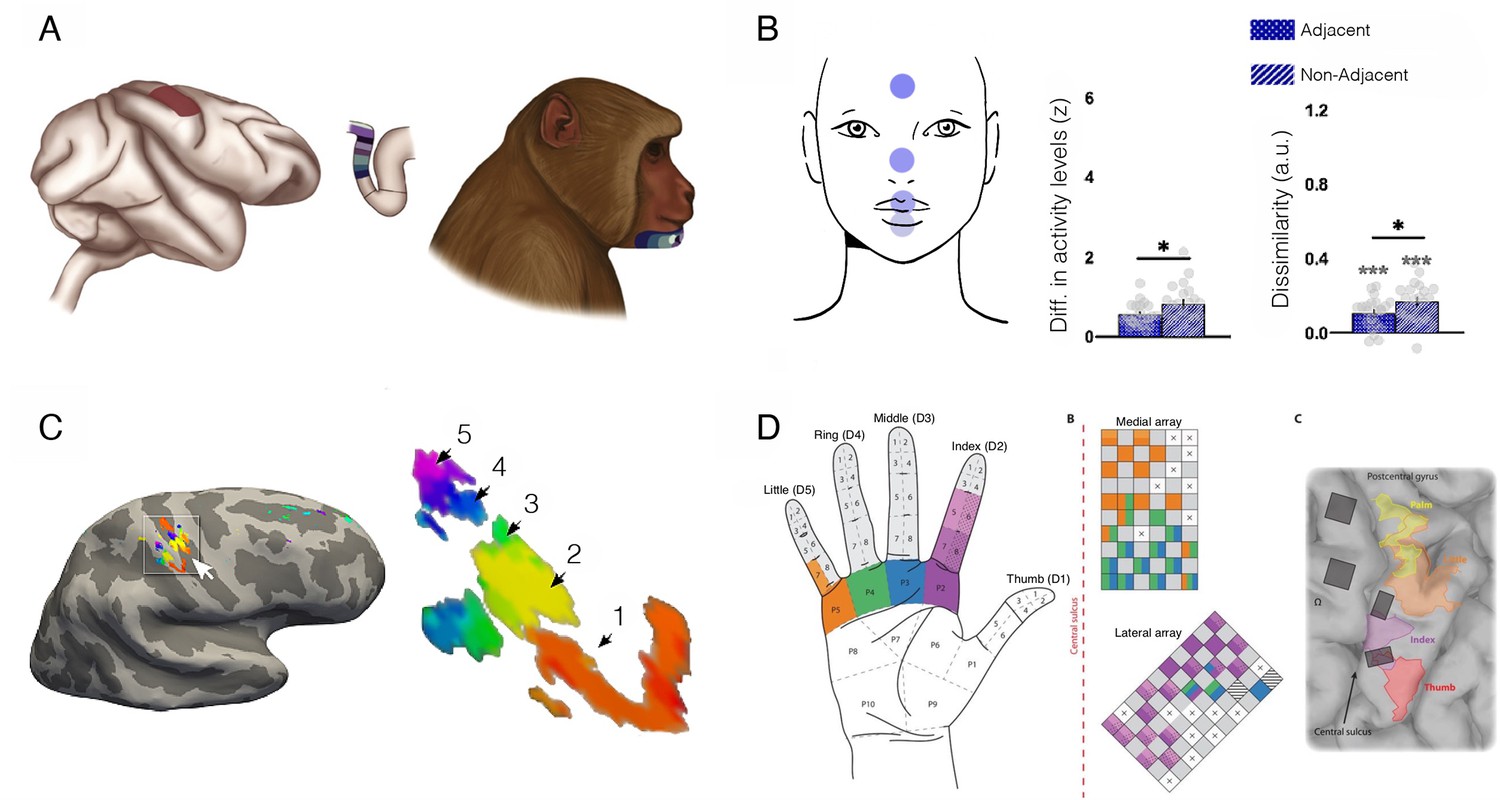
Face and hand representations can remain stable following arm deafferentation.
(A) The primary somatosensory (S1) hand area, shown from a lateral view (left) and through a cross-section of the central sulcus (middle). The colours along the postcentral bank of the sulcus reflect receptive fields that were mapped to the lower face of a monkey (right) with an arm deafferentation in the classical electrophysiological finding by Pons et al., 1991. The study showed topographic remapping of the monkey’s chin in the deprived S1 hand territory following arm deafferentation. (B) Topographic features for face representation in the cortical S1 hand territory of intact (non-disabled) human adults. A key feature of topographic mapping is that non-neighbouring representations are more distinct, providing an opportunity to examine whether topographic motifs can be identified for the face even in the typical hand area. Using fMRI and facial movements, univariate and multivariate activity was compared across four facial parts (forehead, nose, lips, and tongue; highlighted on the top left). Greater activity differences (left) and dissimilarity (cross-validated Mahalanobis distances using representational similarly analysis, right) between facial parts that are non-neighbouring (e.g. forehead and lips) were confirmed in the S1 hand territory, relative to neighbouring representations (e.g. forehead and nose). This indicates that topographical features of the face are already present in the hand territory prior to deafferentation. (C) S1 finger map of the missing (phantom) hand in an upper limb (above elbow) amputee who lost his hand over 30 years before, as measured by 7 T fMRI (travelling wave analysis). The amputee was asked to move each of his phantom fingers, and the resulting analysis identified clusters showing clear selectivity for each of his five fingers in the central sulcus and postcentral gyrus around the hand knob. The numbers correspond to clusters showing selectivity to each of the five digits (1=D1, 5=D5; colour code as in Figure 8). This finding indicates that hand representation persists following amputation. (D) Projected field maps for the hand of a tetraplegic patient in response to intracortical microstimulation to S1. The left panel shows the hand regions in which evoked sensations were reported. The middle panel displays the two electrode arrays that were implanted in S1. The colour code corresponds to the parts of the hand where sensations were elicited. The right panel shows the electrode implantation in the cortex. Microstimulation in the deprived S1 territory evoked a topographic sensation pattern, providing causal evidence that S1 functionally represents the hand, despite deafferentation. Figures were taken from: (A) is reproduced from Figure 1 from Makin and Bensmaia, 2017; (B) is adapted from Figure 3 from Muret and Makin, 2021; (C) is reproduced from Figure 1 from Kikkert et al., 2016; (D) is reproduced from Figure 1 from Flesher et al., 2016.
© 2017, Elsevier Ltd. Figure 9A was reproduced from Figure 1 from Makin and Bensmaia, 2017. It is not covered by the CC-BY 4.0 license and further reproduction of this panel would need permission from the copyright holder
© 2016, AAAS. Figure 9D was reproduced from Figure 1 from Flesher et al., 2016 with permission from the American Association for the Advancement of Science. It is not covered by the CC-BY 4.0 license and further reproduction of this panel would need permission from the copyright holder
Figure 10
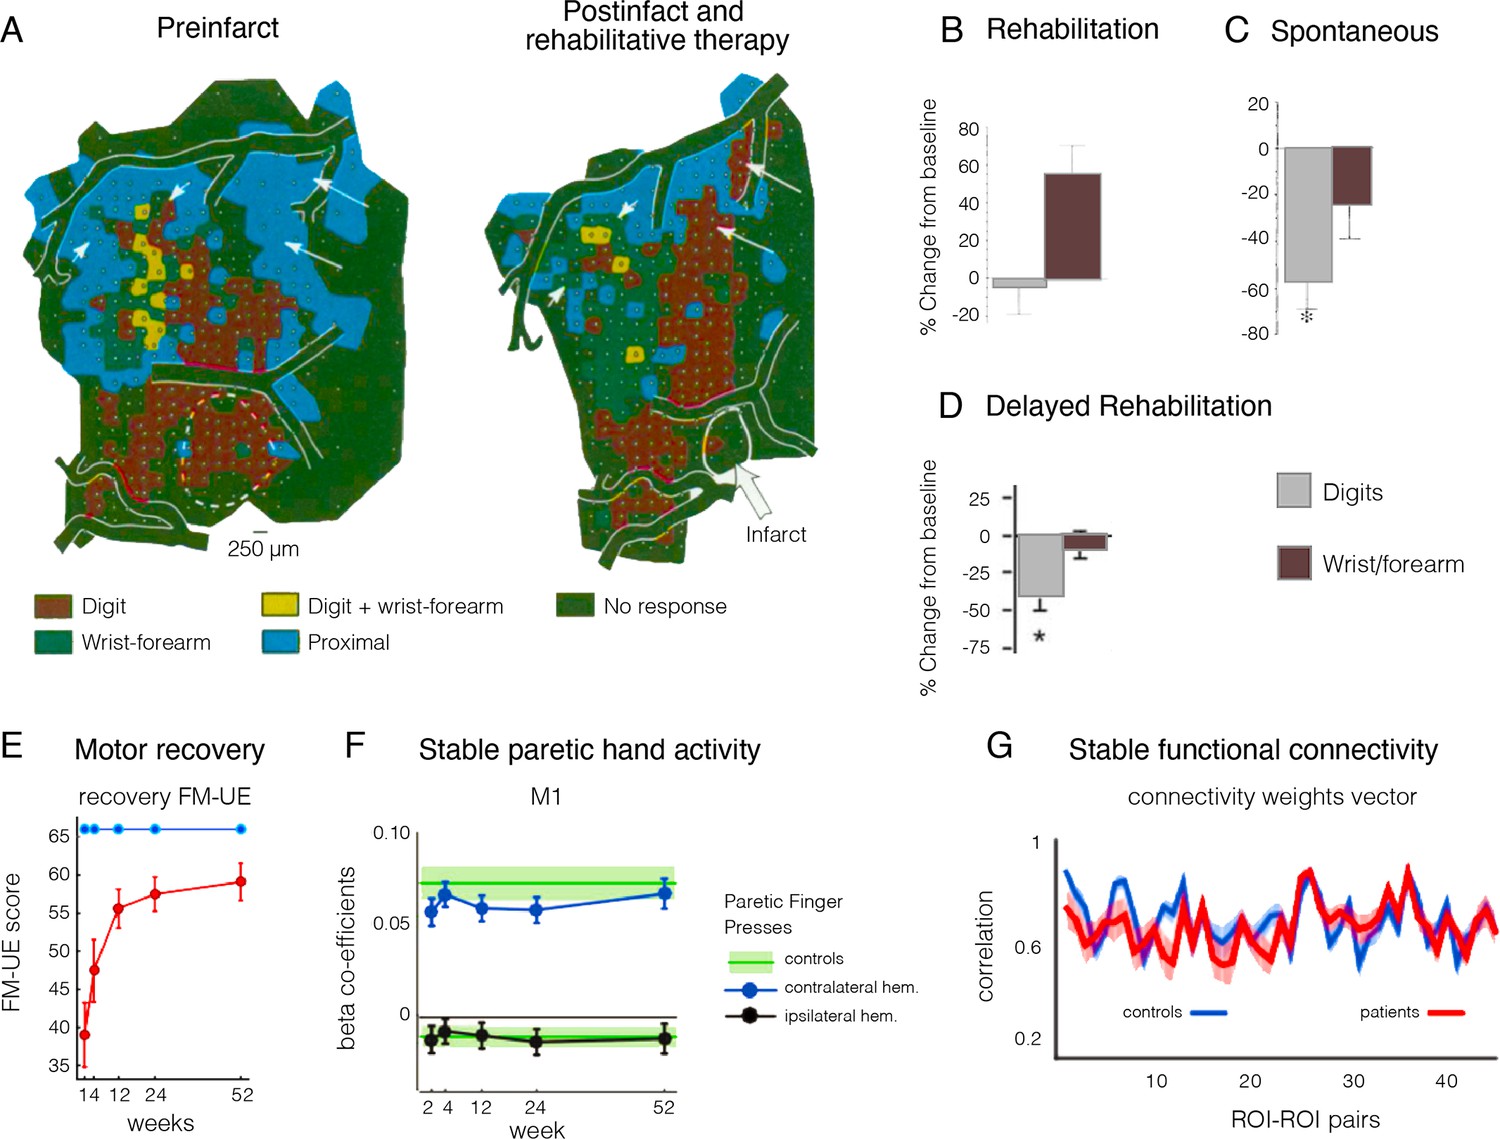
Remapping of hand and arm representation following focal lesion doesn’t reflect motor recovery.
(A) Upper limb map in a monkey showing typical hand representation prior to M1 lesion (shown by white dashed line) and remapping of the hand representation after lesion to the digit area and training-based recovery. (B–D) Changes in the percentage of cortical territory dedicated to digit (dark) and writs/forearm (light) representation following M1 lesions to the digit territory, coupled with (B) training-intensive rehabilitation therapy, (C) spontaneous recovery, and (D) delayed training. In all three studies, motor behaviour was restored to comparable levels, yet the underlying map changes were radically different, suggesting that map changes are not straightforward correlates of motor recovery. (E–G) Functional MRI (fMRI) longitudinal studies, through the acute (1–12 weeks) and into the chronic stage (24–52 weeks) of stroke patients. (E) Recovery on the Fugl-Meyer upper extremity (FM-UE) scale shows substantial recovery of hand function by week 52 (red line). (F) Evoked BOLD activities in contralateral and ipsilateral M1 cortex induced by single-finger key-presses by the paretic hand. (G) Resting-state functional connectivity pairwise profile across five regions of interest (ROIs) (S1, M1, premotor dorsal and ventral, and supplementary motor area) for the left and right hemisphere for patients (red) and controls (blue). No systematic differences in connectivity patterns of patients and controls were found in the early subacute recovery period. Put together, despite significant motor recovery over the course of the acute phase, the activity and connectivity profiles of the paretic hand in the M1 hand area were stable over time. Modified from: (A) is adapted from Figure 2 and (B) is adapted from Figure 3 from Nudo et al., 1996b; (C) is adapted from Figure 3 from Nudo and Milliken, 1996; (D) is adapted from Figure 3 from Barbay et al., 2006; (E) is adapted from Figure 2 from Branscheidt et al., 2022; (F) is reproduced from Figure 3 from Ejaz et al., 2018; (G) is reproduced from Figure 3 from Branscheidt et al., 2022.
© 1996, American Association for the Advancement of Science. Figure 10A is adapted from Figure 2 from from Nudo et al., 1996b, with permission from the American Association for the Advancement of Science. It is not covered by the CC-BY 4.0 license and further reproduction of this panel would need permission from the copyright holder
© 2018, The Author(s). Figure 10f was reproduced from Figure 3 from Ejaz et al., 2018 with the permission of John Krakauer. It is not covered by the CC-BY 4.0 license and further reproduction of this panel would need permission from the copyright holder
Figure 11
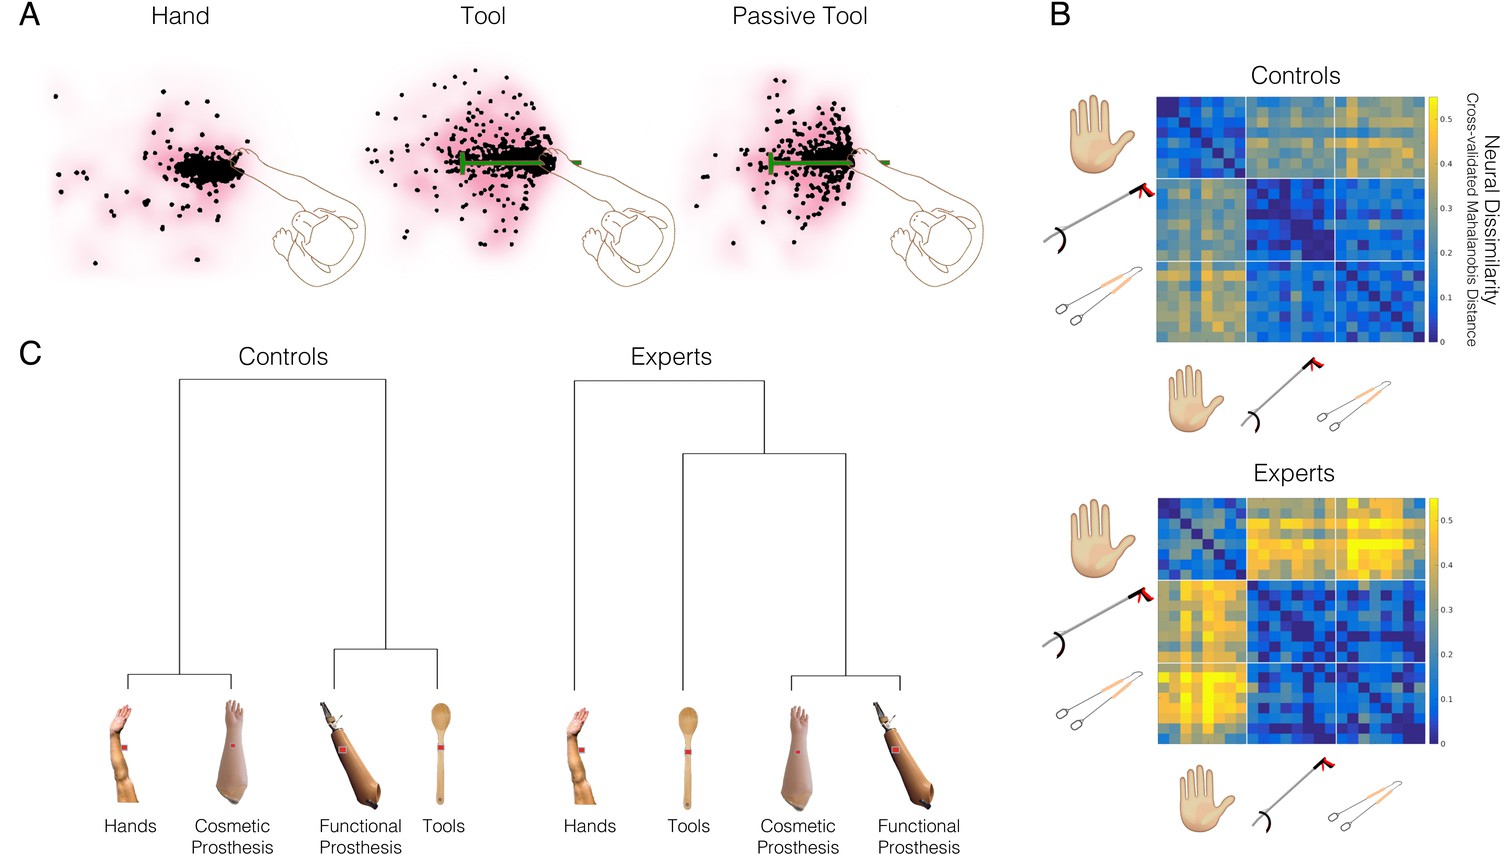
Tool-use is not associated with increased embodiment.
(A) An example neuron from the famous study by Iriki and colleagues, showing spatially expanded ‘visual’ responses after the monkey used a tool (middle panel), relative to hand use (left) or passive holding of the tool (right). The dots show the spatial positions where food pieces, moved towards and away from the monkey, elicited neural responses. Qualitatively, the middle ‘Tool’ condition triggers more neural responses further away from the monkey’s hand. This has been taken as evidence that the tool becomes incorporated into the body representation of the monkey. (B–C) An arguably more direct means to establish the link between tool and hand representation is by comparing between them. (B) Prosthetic limbs are assistive devices designed to substitute the missing hand function, therefore providing a strong test case for researching embodiment. A linkage tree showing fMRI representational similarities between hands, tools, and two prosthesis types in the extrastriate body area (occipitotemporal cortex) of controls (Controls; left) and 32 prosthesis users with a missing hand (Experts; right). Longer branches indicate greater dissimilarity across categorical representations. Controls tend to represent prostheses similarly to either hands or tools, based on their visual (dis)similarity to biological upper limbs. The expert prosthesis users visually represent both prosthesis types more similarly to each other, and less like a hand (or a tool). (C) London litterpickers routinely use a gripper tool as part of their job, making them expert tool users. fMRI representational dissimilarities across various video clips showing object manipulation with hands, an expert tool (litterpicker), and a non-expert hand-held tool (thongs). Warmer colours show greater dissimilarities across categorical representations. Relative to novices, experts show greater neural dissimilarity (more distinct) representation of the tools compared with hands. Images modified from: (A) is adapted from Figure 1 from Maravita and Iriki, 2004; (B) is reproduced from Figure 2 from Schone et al., 2021; (C) is reproduced from Figure from Maimon-Mor and Makin, 2020.
© 2004, Elsevier. Figure 11A reproduced from Figure 2 from Maravita and Iriki, 2004 with permission from Elsevier Ltd. It is not covered by the CC-BY 4.0 license and further reproduction of this panel would need permission from the copyright holder
Download links
A two-part list of links to download the article, or parts of the article, in various formats.
Downloads (link to download the article as PDF)
Open citations (links to open the citations from this article in various online reference manager services)
Cite this article (links to download the citations from this article in formats compatible with various reference manager tools)
Against cortical reorganisation
eLife 12:e84716.
https://doi.org/10.7554/eLife.84716


