Effects of clozapine-N-oxide and compound 21 on sleep in laboratory mice
- Department of Psychiatry and Psychotherapy, Medical Center - University of Freiburg, Faculty of Medicine, University of Freiburg, Germany
- Department of Physiology, Anatomy and Genetics, University of Oxford, United Kingdom
- Sir Jules Thorn Sleep and Circadian Neuroscience Institute, University of Oxford, United Kingdom
- The Kavli Institute for Nanoscience Discovery, United Kingdom
- Department of Pharmacology, University of Oxford, United Kingdom
- Department of Psychiatry, Beth Israel Deaconess Medical Center, Harvard Medical School, United States
- Geneva University Hospitals (HUG), Division of Psychiatric Specialties, Switzerland
- University Hospital of Psychiatry and Psychotherapy, University of Bern, Switzerland
- Centre for Experimental Neurology, University of Bern, Switzerland
Figures
Figure 1 with 1 supplement

Suppression of REM sleep following CNO injection.
(a) Time course of wakefulness, NREM, and REM sleep in the 6 hr following intraperitoneal injections of CNO or saline at light onset (ZT 0). (b) Percentage of time spent in the three vigilance states during the first 2 hr (left column) and over the entire 6 hr observation period (right column) after saline and CNO injections. Note that REM sleep is presented both as proportion of the recording time (third row) and of the total sleep time (fourth row). n=16 for saline, n=11 for 1 mg/kg, n=15 for 5 mg/kg, n=14 for 10 mg/kg. Asterisks indicate post hoc comparisons with significant differences (*p<0.05, **p<0.01, ***p<0.001) for analyses with significant main effects. CNO: clozapine-N-oxide. NREM: non-rapid eye movement sleep. REM: rapid eye movement sleep. TST: total sleep time. ZT: zeitgeber time.
Figure 1—figure supplement 1
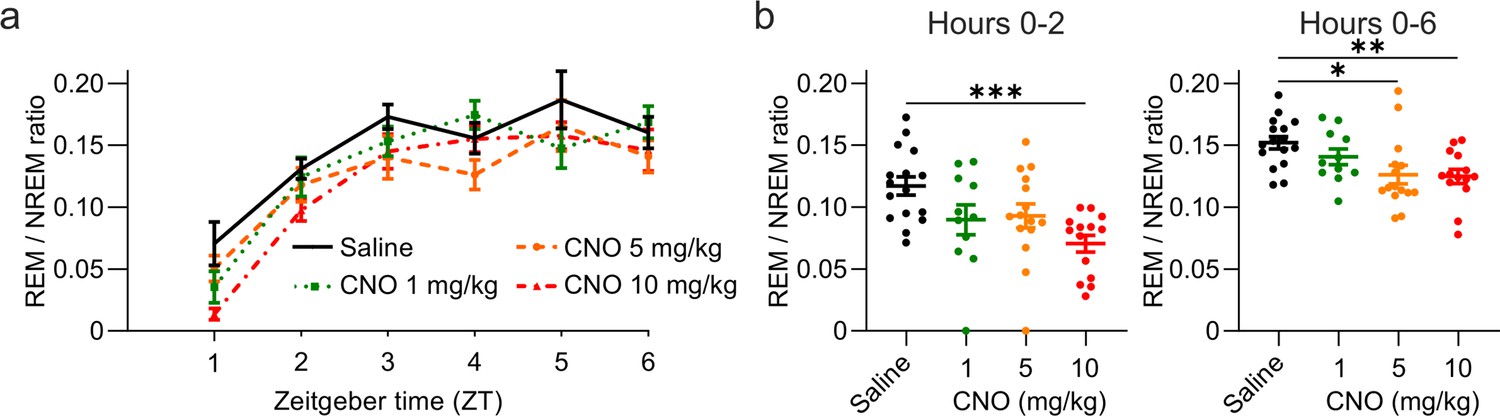
Reduced REM/NREM ratio following CNO injections.
(a) Time course of REM sleep expressed as ratio between REM and NREM sleep over the 6 hr following intraperitoneal injections of CNO or saline at light onset (ZT 0). (b) REM/NREM ratio during the first 2 hr (left column) and over the entire 6 hr observation period (right column) after saline and CNO injections. n=16 for saline, n=11 for 1 mg/kg, n=15 for 5 mg/kg, n=14 for 10 mg/kg for vigilance state analysis. Asterisks indicate post hoc comparisons with significant differences (*p<0.05, **p<0.01, ***p<0.001) for analyses with significant main effects. CNO: clozapine-N-oxide. EEG: electroencephalogram. NREM: non-rapid eye movement sleep. REM: rapid eye movement sleep. ZT: zeitgeber time.
Figure 2
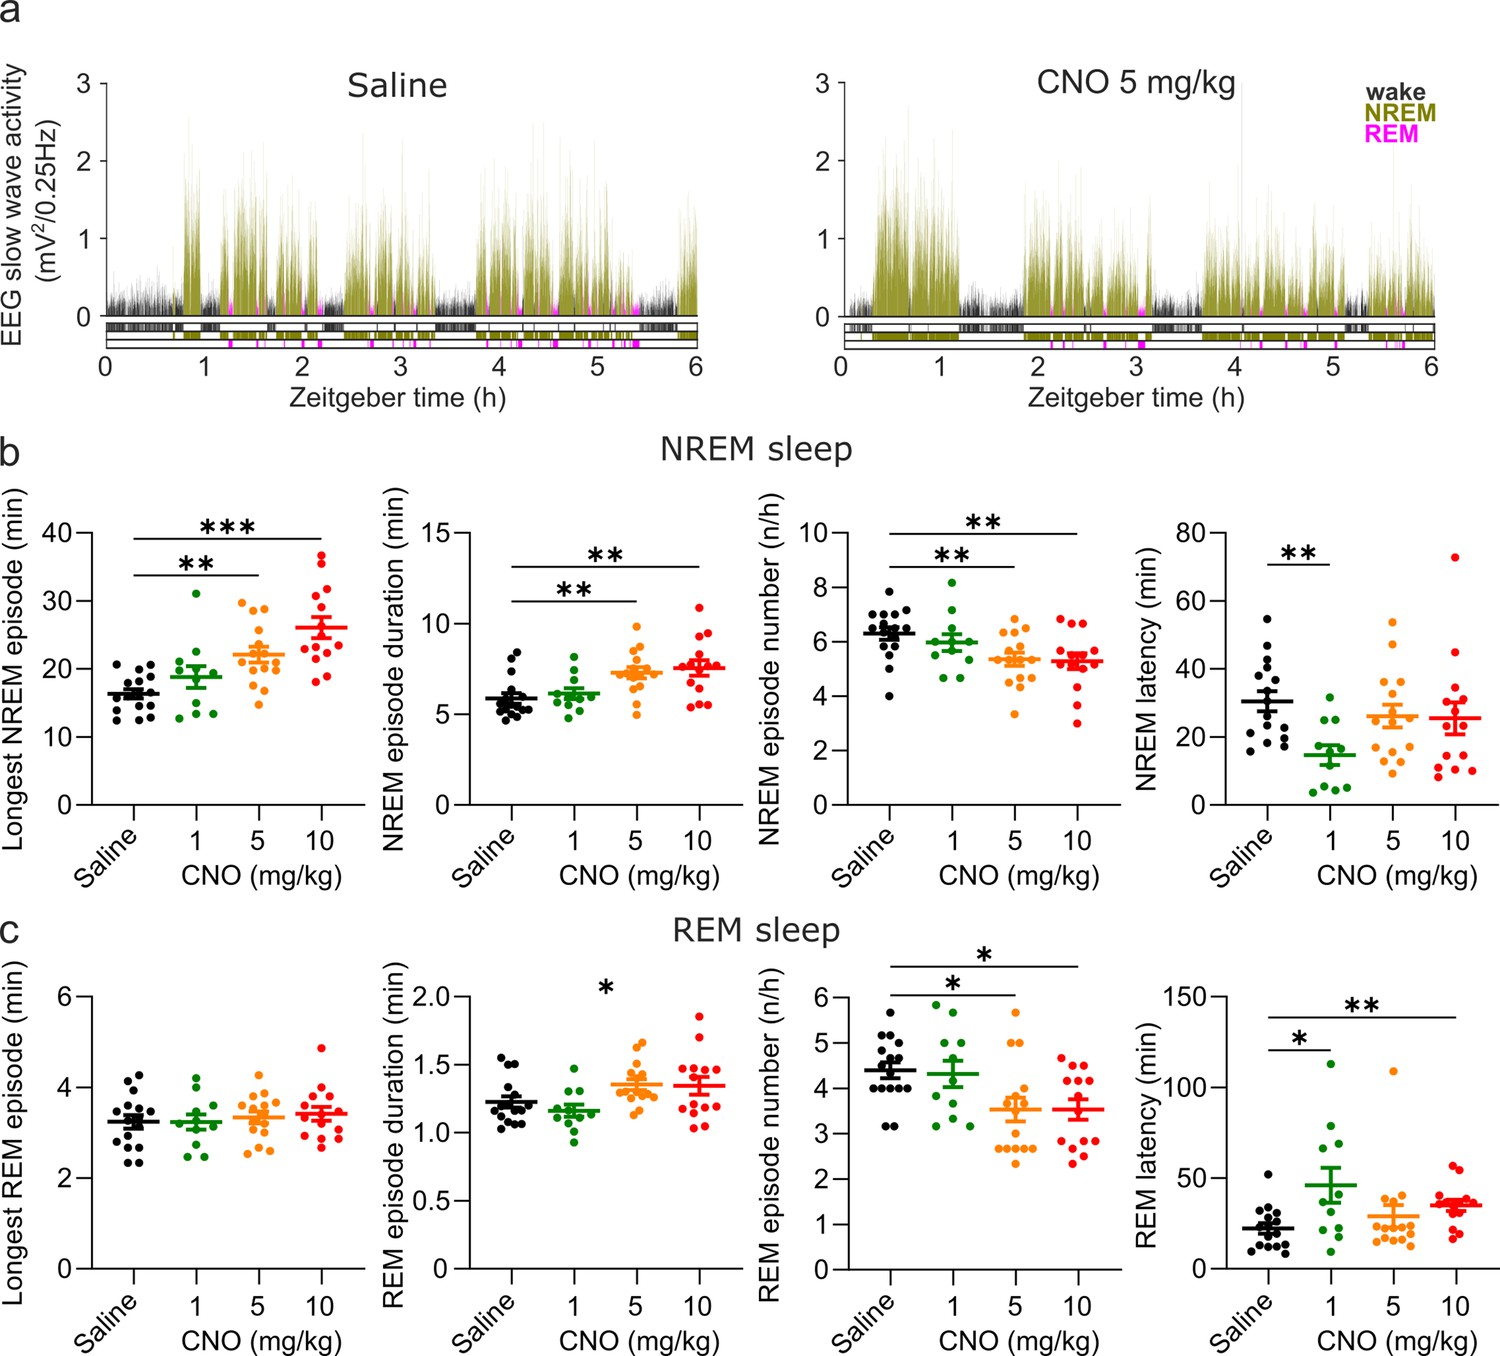
Altered sleep architecture following CNO injections.
(a) Representative hypnograms and EEG slow wave activity (0.5–4.0 Hz, 4 s epochs) from one individual mouse after injection of saline (left panel) and 5 mg/kg CNO (right panel). Note the reduced latency to NREM sleep, the suppression of REM sleep, and the increased duration of individual NREM sleep episodes. (b) NREM sleep architecture and (c) REM sleep architecture over the 6 hr observation period following saline and CNO injections. Note that for the average REM episode duration there is a main effect of ‘treatment condition’ but none of the individual post hoc comparisons between CNO and saline reaches the significance level of p=0.05. n=16 for saline, n=11 for 1 mg/kg, n=15 for 5 mg/kg, n=14 for 10 mg/kg for vigilance state analysis in panels b and c. Asterisks indicate post hoc comparisons with significant differences (*p<0.05, **p<0.01, ***p<0.001) for analyses with significant main effects. CNO: clozapine-N-oxide. EEG: electroencephalogram. NREM: non-rapid eye movement sleep. REM: rapid eye movement sleep.
Figure 3 with 3 supplements
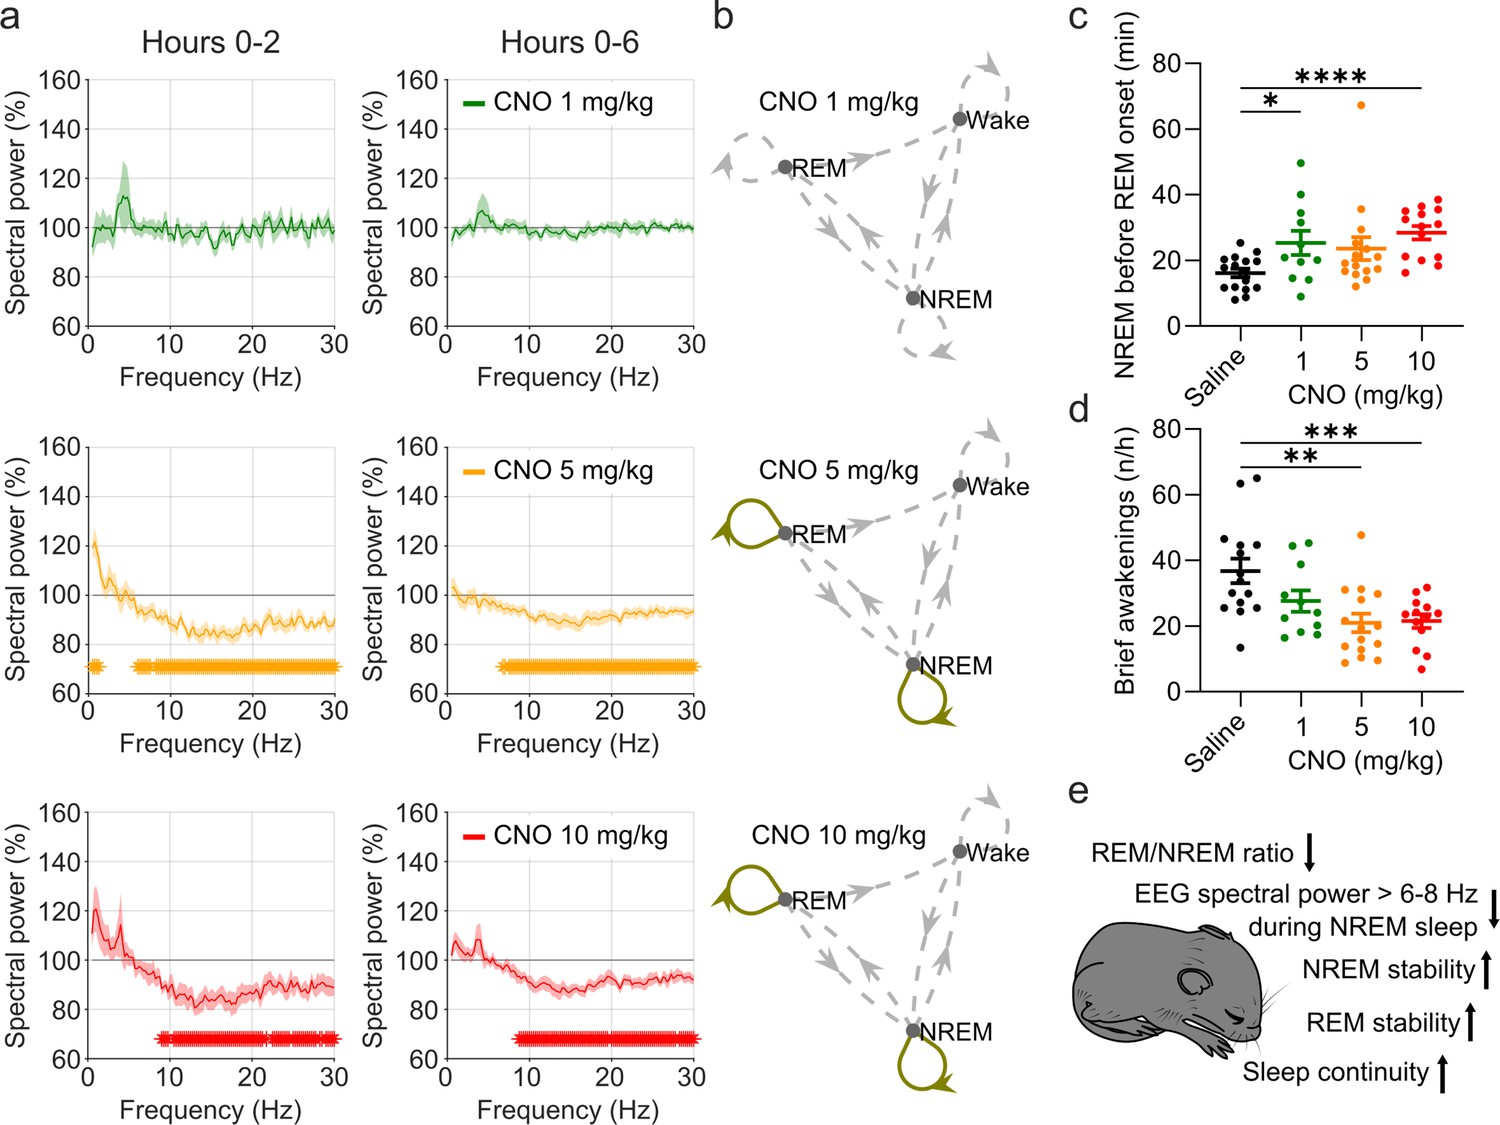
EEG spectral changes, increased sleep state stability, and sleep continuity following CNO injections.
(a) Frontal EEG spectra during NREM sleep following CNO injections relative to saline injections for the acute (first 2 hr, left column) and prolonged (6 hr, right column) observation period. Note the sustained reduction of power in frequency bands >6–8 Hz in the 5 and 10 mg/kg CNO conditions. (b) Transitions between vigilance states in the 6 hr period following saline and CNO injections. Note the increased stability of REM and NREM sleep for the 5 mg/kg CNO (REM>REM: p=0.0192, Cohen’s d=0.73681; NREM>NREM: p=0.0132, Cohen’s d=0.71052) and 10 mg/kg CNO (REM>REM: p=0.0492, Cohen’s d=0.65815; NREM>NREM: p=0.0214, Cohen’s d=0.77396) condition. Solid olive lines indicate significantly increased transitions/continuations of vigilance states in the respective CNO condition compared to the saline condition, dashed grey lines indicate all possible vigilance state transitions/continuations. (c) Cumulative amount of NREM sleep before the first occurrence of REM sleep. (d) Frequency of brief awakenings (4–16 s) per hour of sleep for the first 2 hr after injections. (e) summary of effects of 5 and 10 mg/kg CNO on sleep in DREADD-free mice. n=10 for saline, n=6 for 1 mg/kg, n=10 for 5 mg/kg, n=8 for 10 mg/kg for spectral analysis. n=16 for saline, n=11 for 1 mg/kg, n=15 for 5 mg/kg, n=14 for 10 mg/kg for vigilance state analysis. n=15 for saline, n=11 for 1 mg/kg, n=15 for 5 mg/kg, n=13 for 10 mg/kg for analysis of brief awakenings. Asterisks in panels c and d indicate post hoc comparisons with significant differences (*p<0.05, **p<0.01, ***p<0.001,, ****p<0.001). Asterisks in panel a indicate frequency bins with significant differences in post hoc comparisons using uncorrected paired t-tests (p<0.05) following a significant interaction effect between ‘frequency’ and ‘condition’ in two-way ANOVAs. Data in panel a are presented as the mean ± s.e.m. (shaded areas). ANOVA: analysis of variance. CNO: clozapine-N-oxide. EEG: electroencephalogram. NREM: non-rapid eye movement sleep.
Figure 3—figure supplement 1
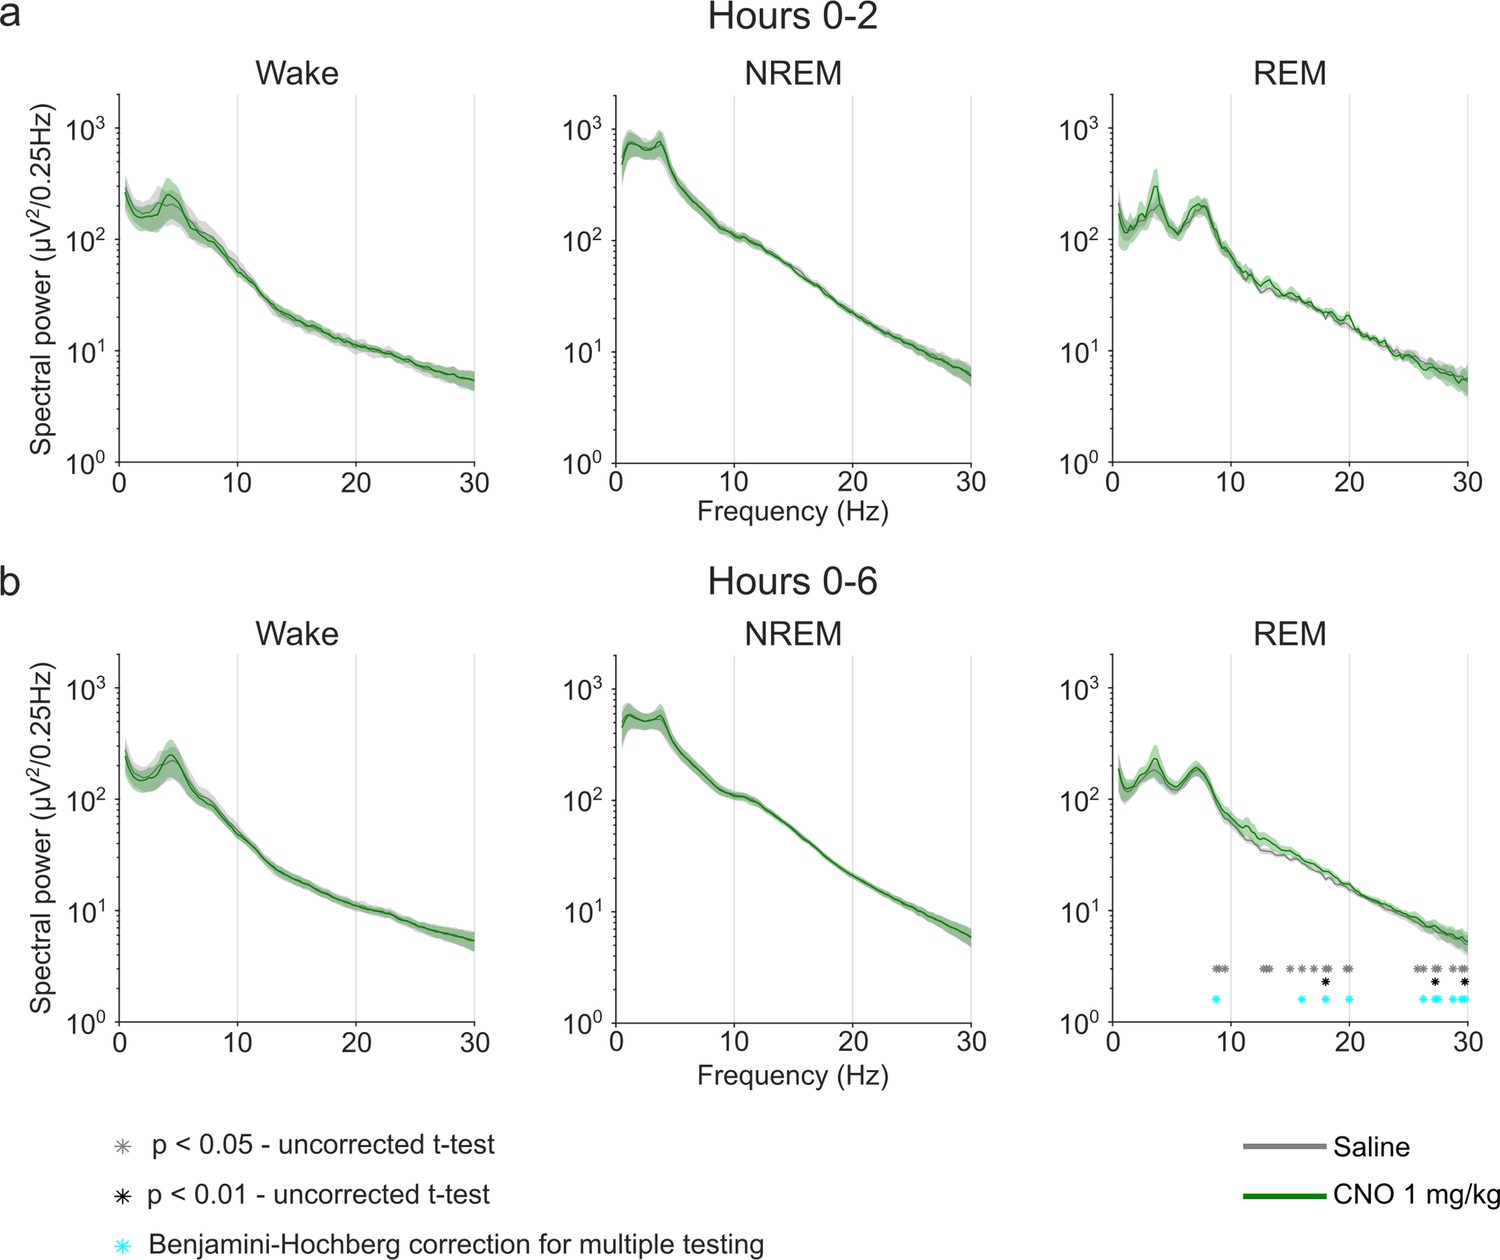
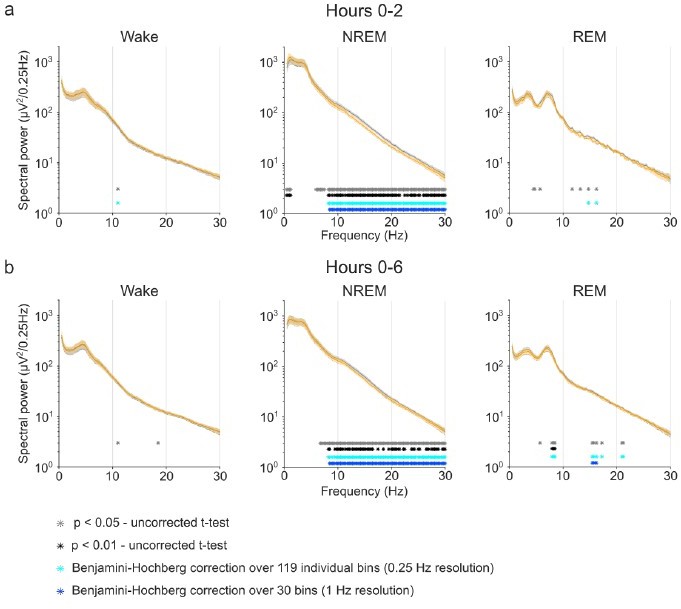
EEG power spectra of wakefulness, NREM, and REM sleep following injections of saline and 1 mg/kg CNO.
Frontal EEG spectra in 0.25 Hz bins between 0.5 and 30 Hz arranged by vigilance state and time window. Two-way ANOVAs revealed a significant interaction effect between ‘frequency’ and ‘condition’ and main effect for ‘frequency’ in the 6 hr REM spectrogram, but no significant main effects for ‘condition’. Frequency bins with significant differences in post hoc tests using uncorrected paired t-tests for α-error probability of p=0.05 are indicated with grey asterisks, for α-error probability of p=0.01 with black asterisks, and using Benjamini-Hochberg (BH) correction for multiple testing with light blue asterisks. n=6 for saline (grey) vs. 1 mg/kg CNO (green) comparison in spectral analysis, n=5 for REM spectral analysis in the 2 hr time window due to the absence of REM sleep in one animal following CNO injection. Data are presented as the mean ± s.e.m. (shaded areas). ANOVA: analysis of variance. CNO: clozapine-N-oxide. EEG: electroencephalogram. NREM: non-rapid eye movement sleep. REM: rapid eye movement sleep.
Figure 3—figure supplement 2
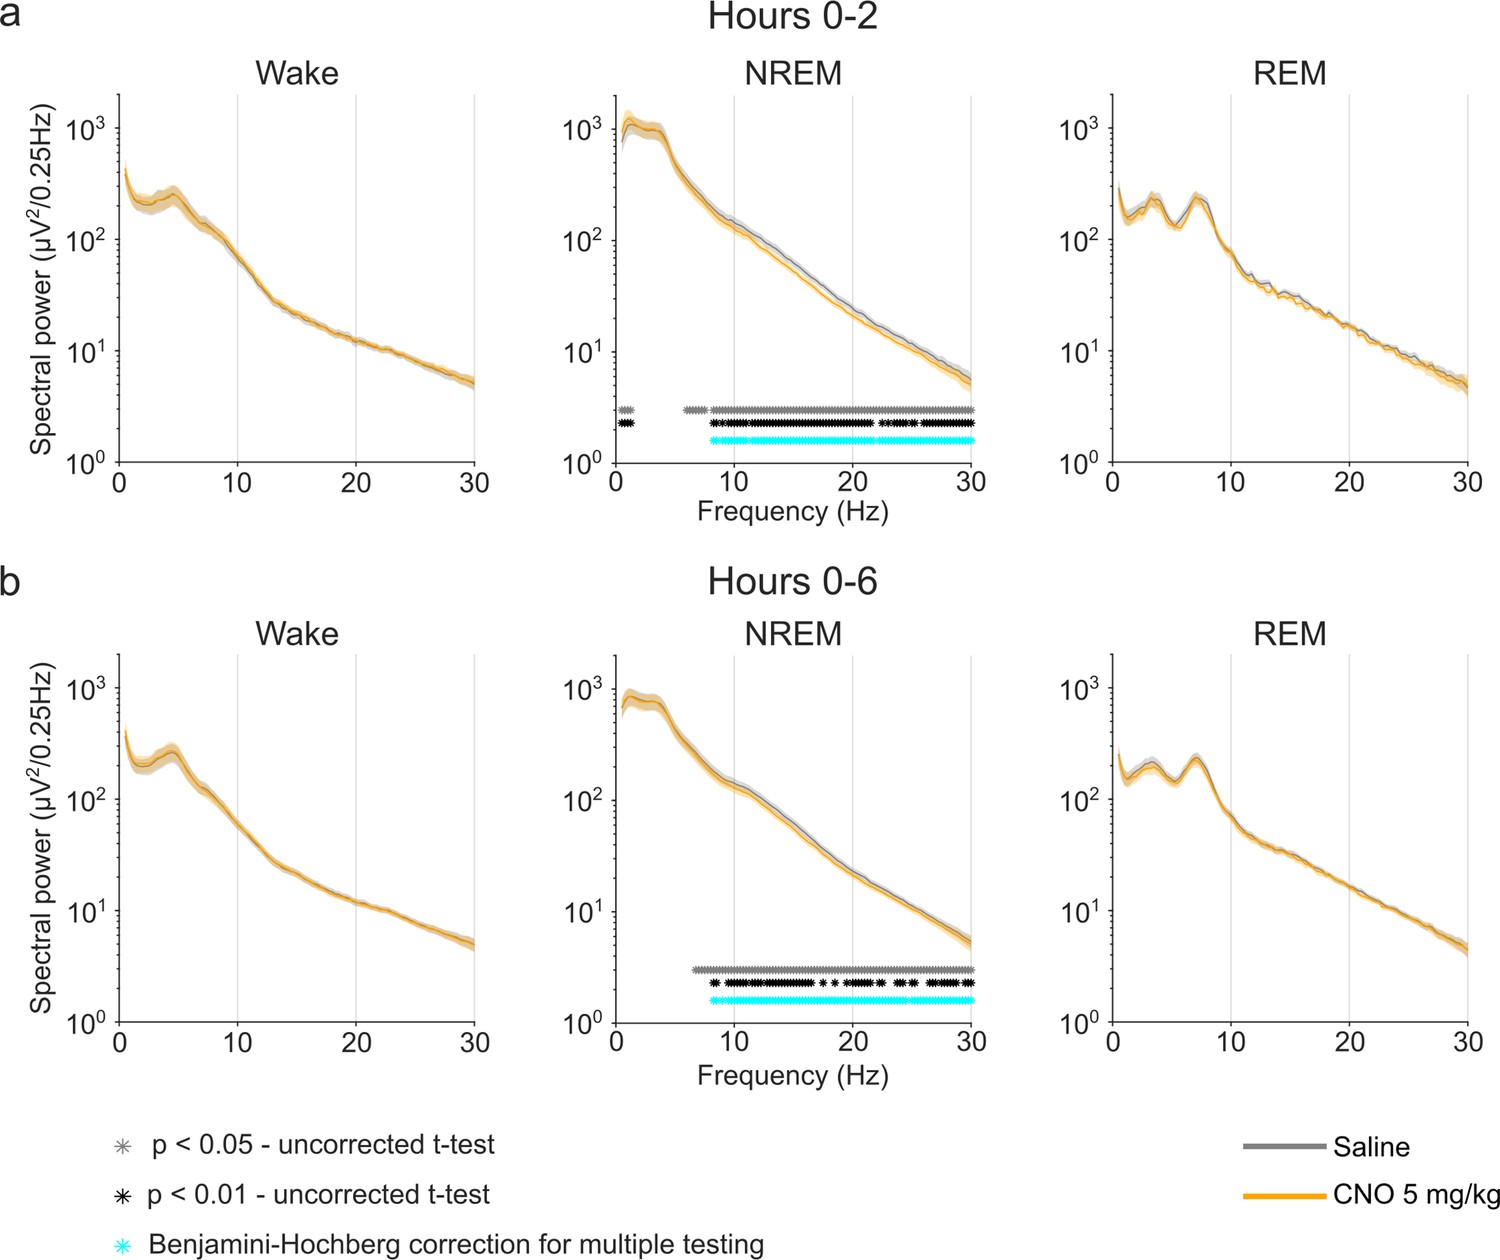
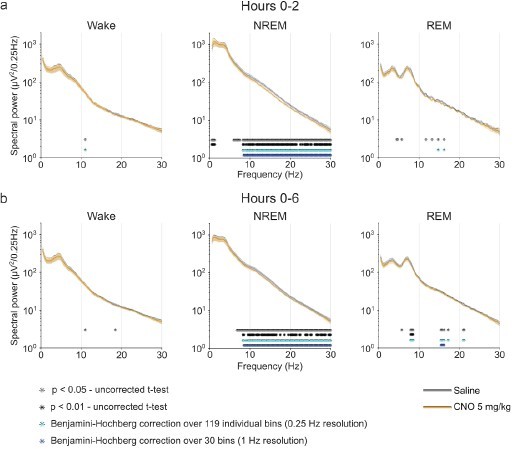
EEG power spectra of wakefulness, NREM, and REM sleep following injections of saline and 5 mg/kg CNO.
Frontal EEG spectra in 0.25 Hz bins between 0.5 and 30 Hz arranged by vigilance state and time window. Two-way ANOVAs for NREM sleep spectra revealed a significant interaction effect between ‘frequency’ and ‘condition’ and main effects for ‘condition’ and for ‘frequency’. Frequency bins with significant differences in post hoc tests using uncorrected paired t-tests for α-error probability of p=0.05 are indicated with grey asterisks, for α-error probability of p=0.01 with black asterisks, and using Benjamini-Hochberg (BH) correction for multiple testing with light blue asterisks. Note the systematic increase of slow frequencies (0–1.25 Hz) in the first 2 hr and the suppression of spectral power in higher frequencies (6.25–30 Hz) in the NREM sleep spectrogram both in the first 2 hr and over the entire observation period. n=10 for saline (grey) vs. 5 mg/kg CNO (orange) comparison in spectral analysis, n=9 for REM spectral analysis in the 2 hr time window due to the absence of REM sleep in one animal following CNO injection. Data are presented as the mean ± s.e.m. (shaded areas). ANOVA: analysis of variance. CNO: clozapine-N-oxide. EEG: electroencephalogram. NREM: non-rapid eye movement sleep. REM: rapid eye movement sleep.
Figure 3—figure supplement 3
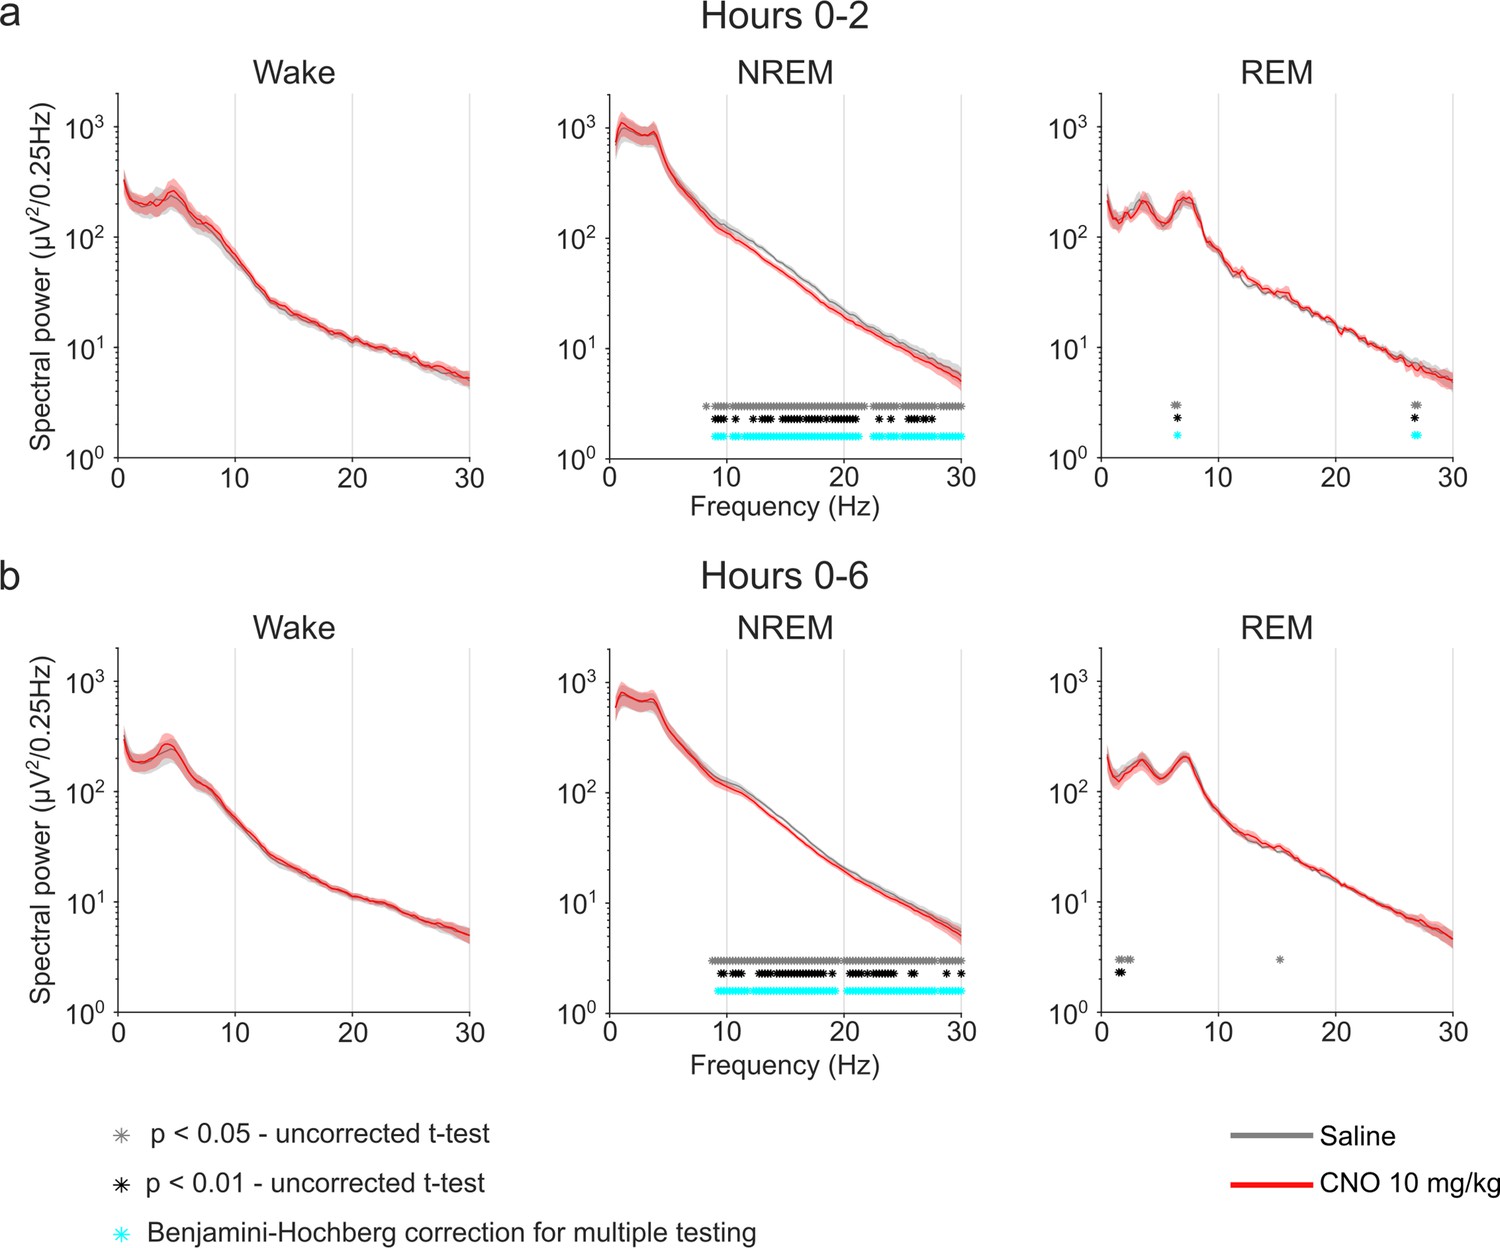
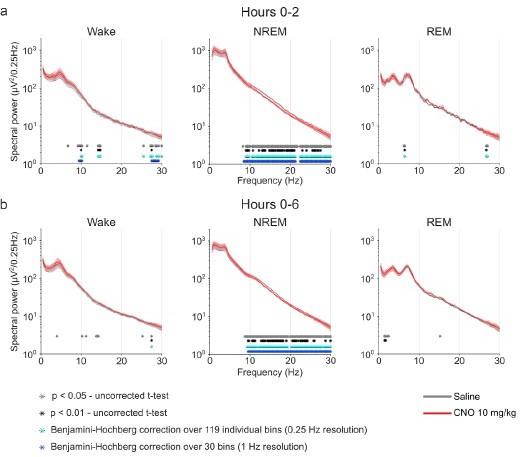
EEG power spectra of wakefulness, NREM, and REM sleep following injections of saline and 10 mg/kg CNO.
Frontal EEG spectra in 0.25 Hz bins between 0.5 and 30 Hz arranged by vigilance state and time window. Two-way ANOVAs for NREM sleep spectra revealed a significant interaction effect between ‘frequency’ and ‘condition’ and main effects for ‘condition’ and for ‘frequency’. Two-way ANOVAs for REM sleep spectra also revealed a significant interaction effect between ‘frequency’ and ‘condition’ and a significant main effect for ‘frequency’, but no significant main effects for ‘condition’. Frequency bins with significant differences in post hoc tests using uncorrected paired t-tests for α-error probability of p=0.05 are indicated with grey asterisks, for α-error probability of p=0.01 with black asterisks, and using Benjamini-Hochberg (BH) correction for multiple testing with light blue asterisks. Note the suppression of spectral power in higher frequencies (8.75–30 Hz) in the NREM sleep spectrogram both in the first 2 hr and over the entire observation period. n=8 for saline (grey) vs. 10 mg/kg CNO (red) comparison in spectral analysis. Data are presented as the mean ± s.e.m. (shaded areas). ANOVA: analysis of variance. CNO: clozapine-N-oxide. EEG: electroencephalogram. NREM: non-rapid eye movement sleep. REM: rapid eye movement sleep.
Figure 4 with 1 supplement
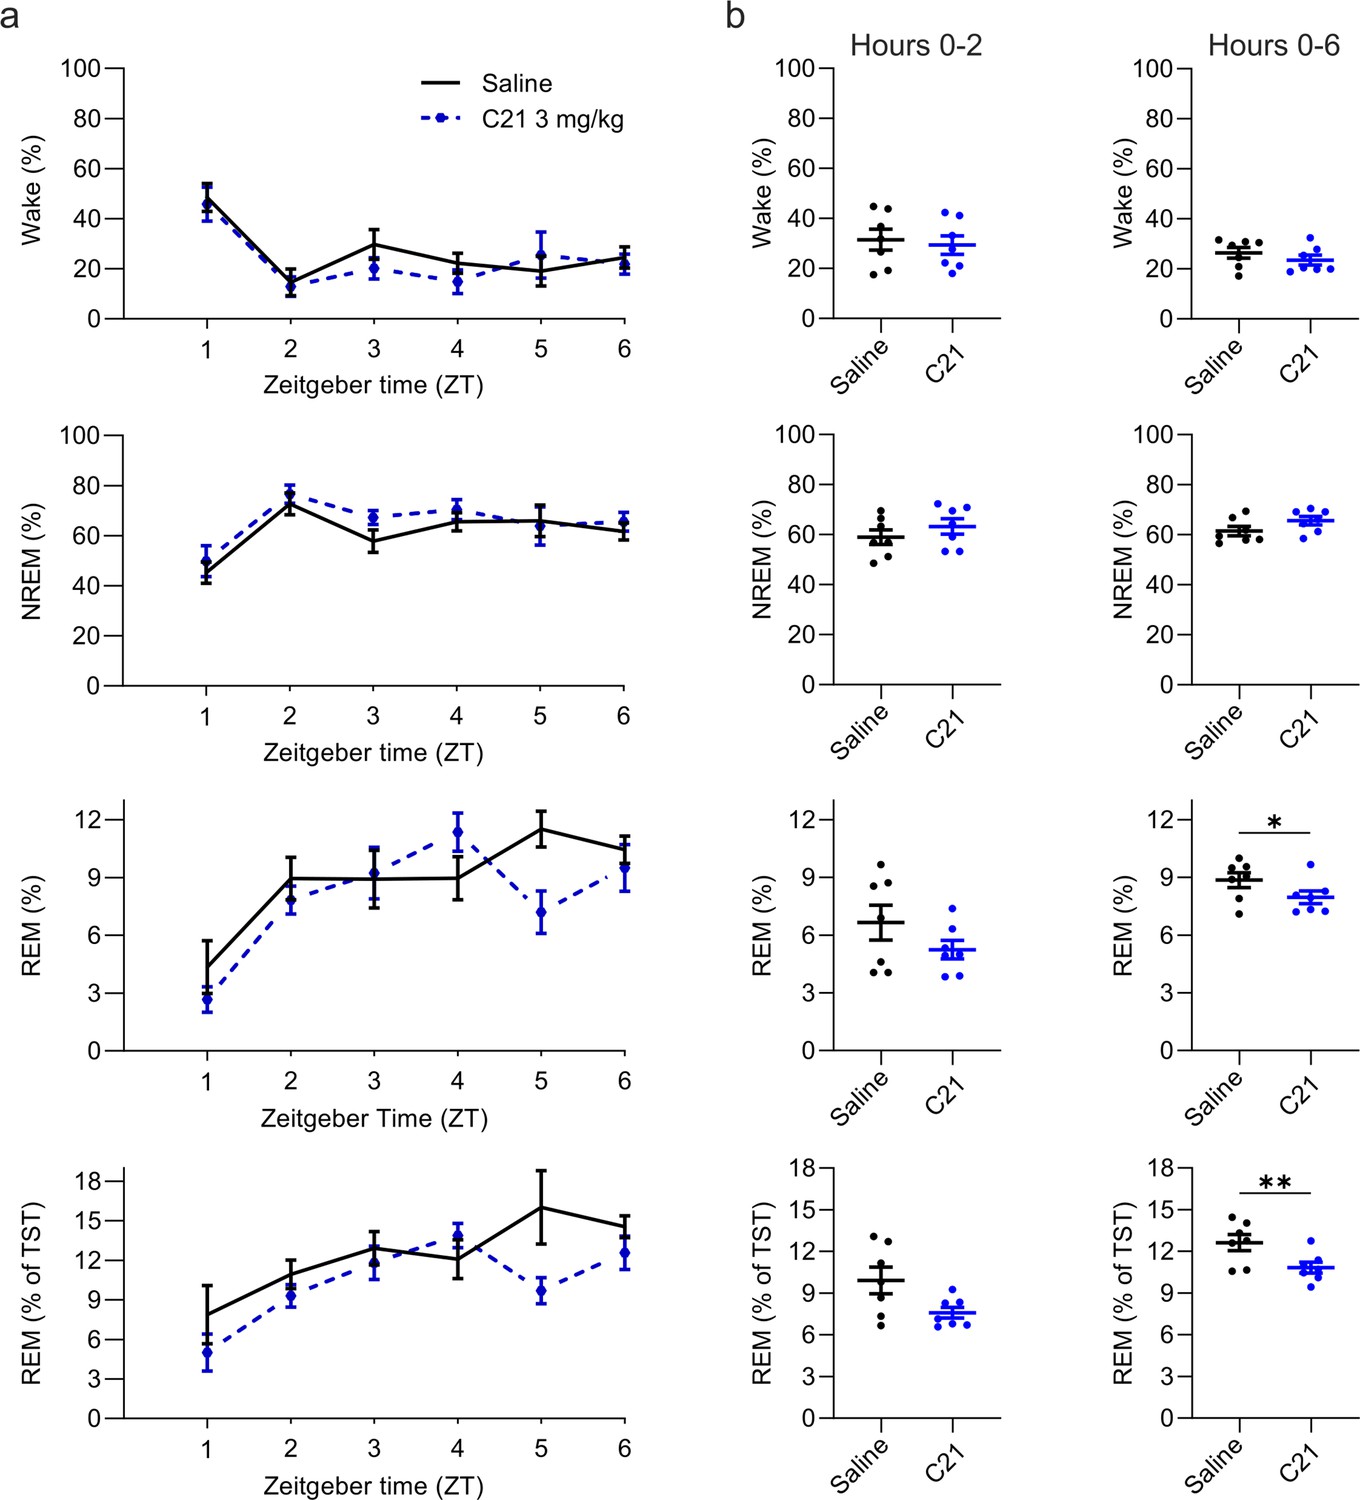
Suppression of REM sleep following C21 injections.
(a) Time course of wakefulness, NREM, and REM sleep in the 6 hr following injection of C21 or saline at light onset (ZT 0). (b) Percentage of time spent in the three vigilance states during the first 2 hr (left column) and over the entire 6 hr observation period after saline and C21 injections. Note that REM sleep is presented both as proportion of the recording time (third row) and of the total sleep time (fourth row). n=7. Asterisks indicate t-tests with significant differences (*p<0.05, **p<0.01, ***p<0.001). C21: compound 21. NREM: non-rapid eye movement sleep. REM: rapid eye movement sleep. TST: total sleep time. ZT: zeitgeber time.
Figure 4—figure supplement 1
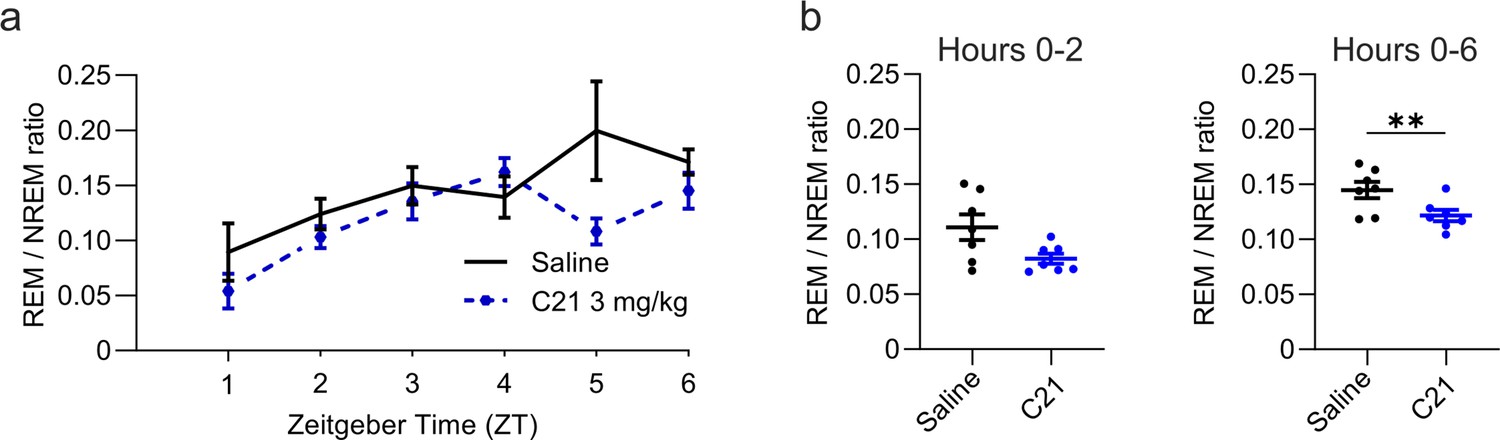
Reduced REM/NREM ratio following C21 injections.
(a) Time course of REM sleep expressed as the ratio between REM and NREM sleep over the 6 hr following intraperitoneal injections of C21 or saline at light onset (ZT 0). (b) REM/NREM ratio during the first 2 hr (left column) and over the entire 6 hr observation period (right column) after saline and C21 injections. n=7. Asterisks indicate t-tests with significant differences (*p<0.05, **p<0.01, ***p<0.001). C21: compound 21. NREM: non-rapid eye movement sleep. REM: rapid eye movement sleep. TST: total sleep time. ZT: zeitgeber time.
Figure 5 with 2 supplements
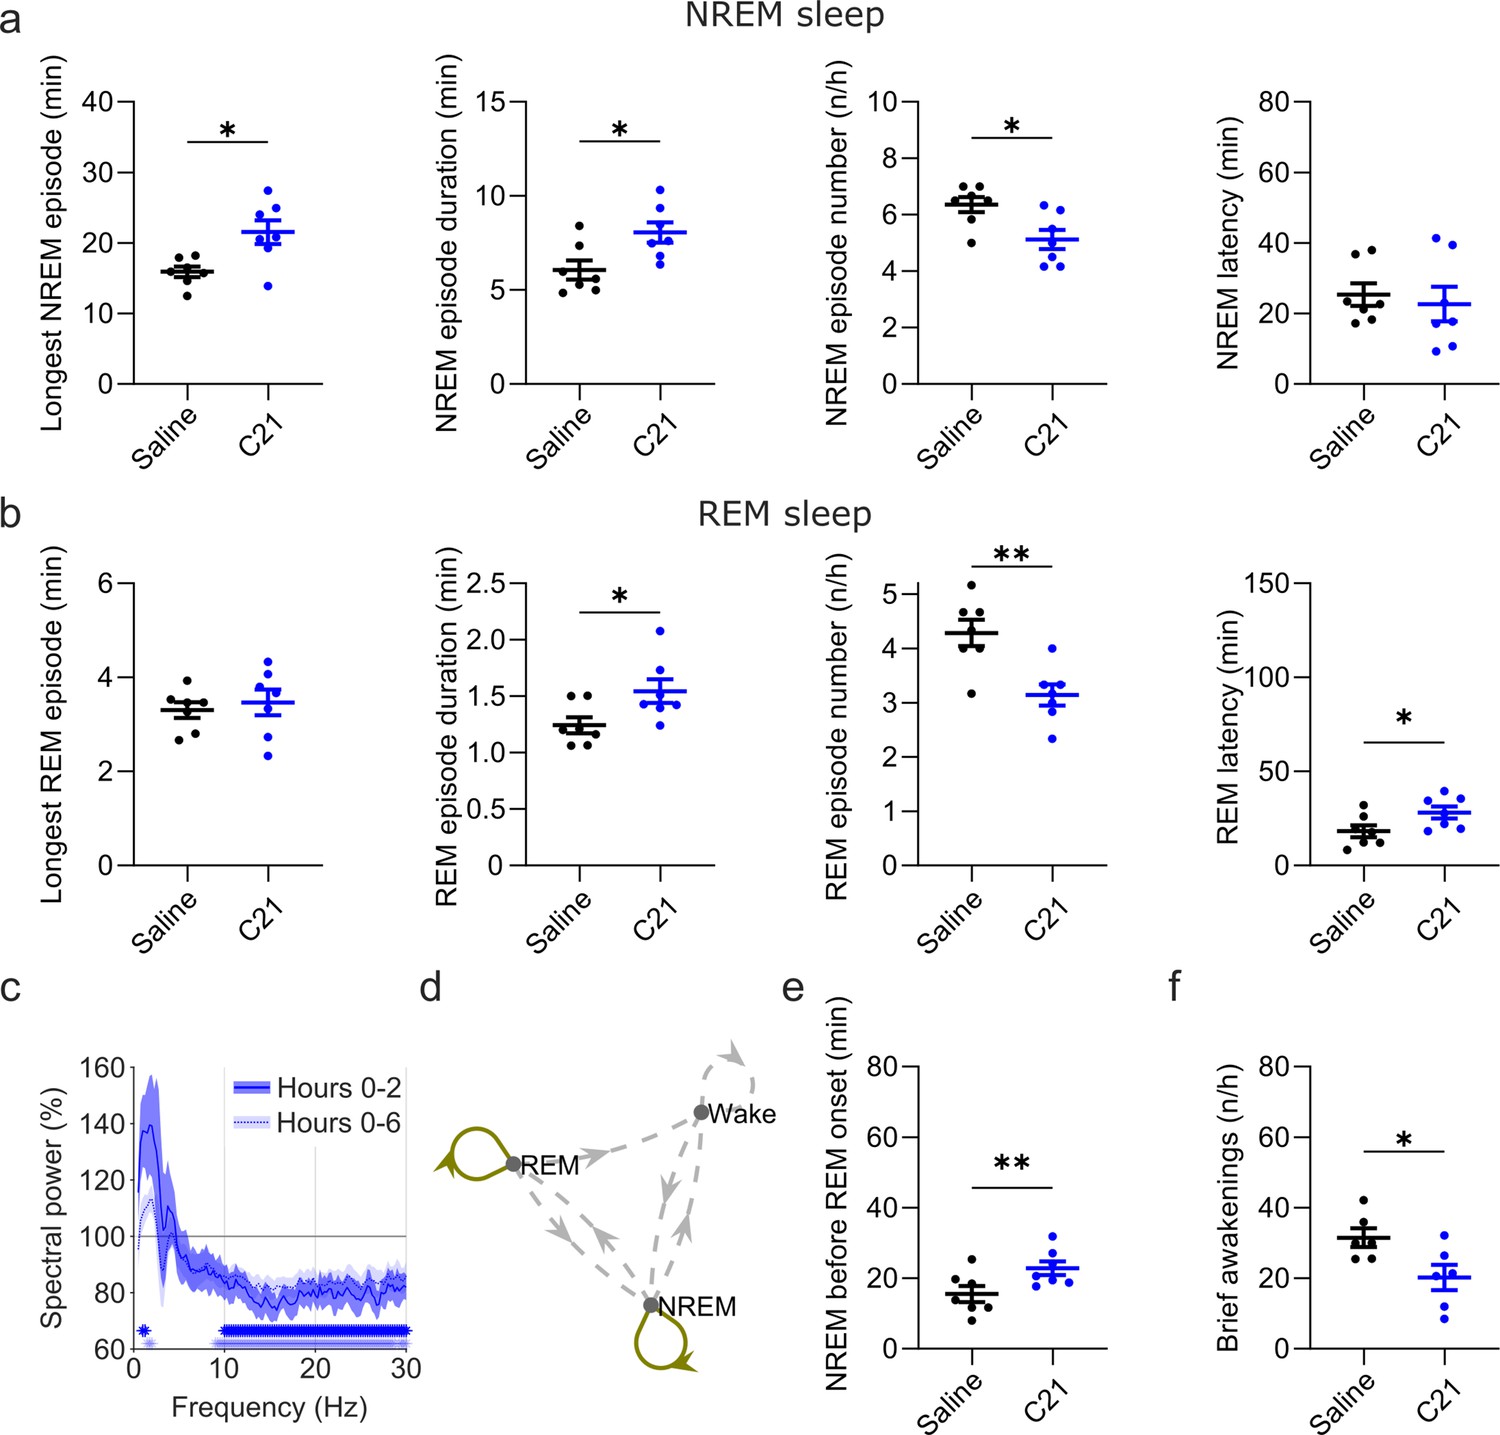
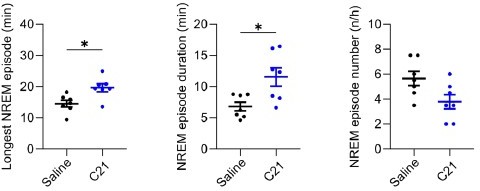
Effects of C21 on sleep architecture, NREM sleep spectra, sleep state stability, and sleep continuity resemble the effects of CNO.
(a) NREM sleep architecture and (b) REM sleep architecture for the 6 hr observation period following C21 injections. (c) Frontal EEG spectra during NREM sleep relative to saline injections for the acute (first 2 hr, dark blue) and full (6 hr, light blue) observation period following C21 injections. Asterisks indicate frequency bins with significant differences in post hoc comparisons using uncorrected paired t-tests (p<0.05; acute: dark blue, full: light blue) following a significant interaction effect between ‘frequency’ and ‘condition’ in two-way ANOVAs. (d) Transitions between vigilance states in the 6 hr period following saline and C21 injections. Note the increased stability of REM and NREM sleep (REM>REM: p=0.0144, Cohen’s d=1.0325; NREM>NREM: p=0.0384, Cohen’s d=0.81527). Solid olive lines indicate significantly increased transitions/continuations of vigilance states in the C21 condition compared to the saline condition, dashed grey lines indicate all possible vigilance state transitions/continuations. (e) Cumulative amount of NREM sleep before the first occurrence of REM sleep. (f) Frequency of brief awakenings (4–16 s) per hour of sleep for the first 2 hr after injections. Number of animals n=7 mice for vigilance state analysis in panels a, b, d, and e. For analysis of EEG NREM spectra in panel c and brief awakenings in panel f: n=6 mice. Asterisks in panels a, b, e, and f indicate t-tests with significant differences (*p<0.05, **p<0.01, ***p<0.001). Data in c are presented as the mean ± s.e.m. (shaded areas). ANOVA: analysis of variance. C21: compound 21. EEG: electroencephalogram. NREM: non-rapid eye movement sleep. REM: rapid eye movement sleep.
Figure 5—figure supplement 1
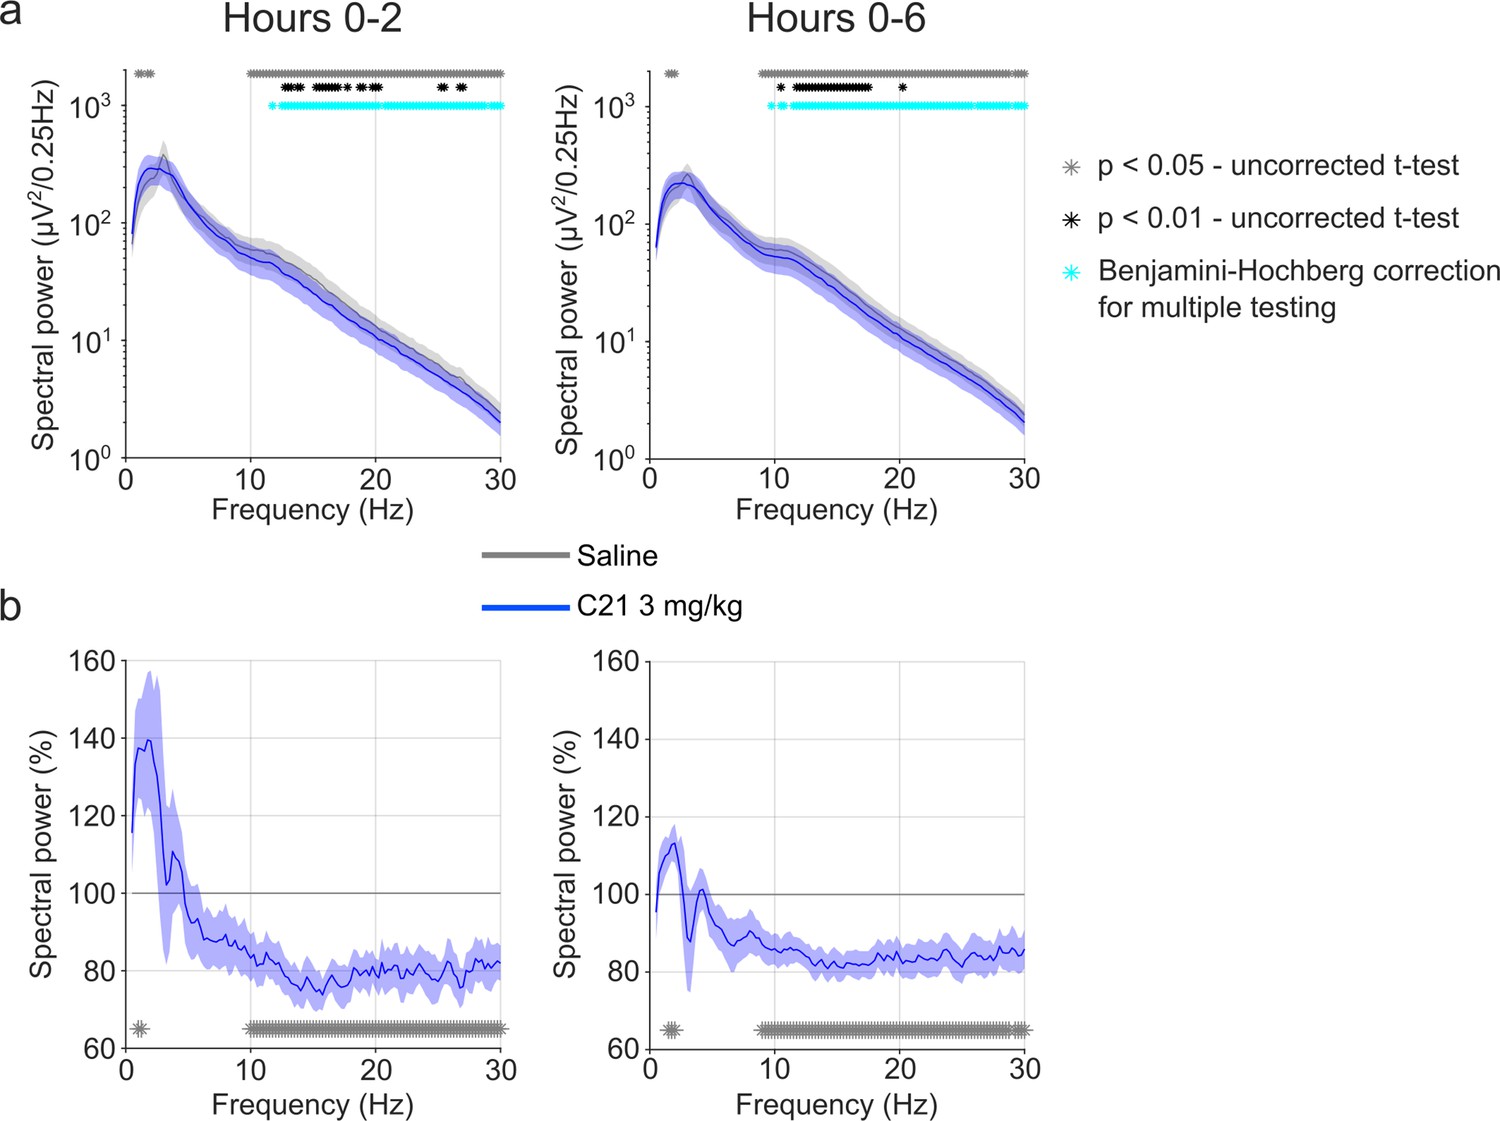
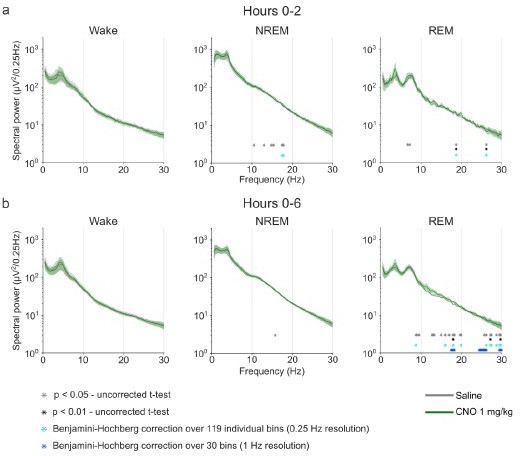
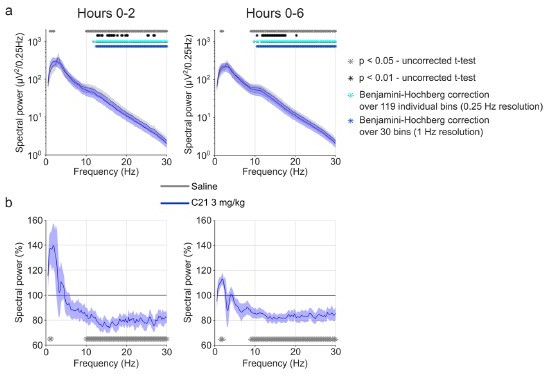
EEG spectral analysis of NREM sleep following injections of saline and 3 mg/kg C21.
(a) Frontal EEG spectra in 0.25 Hz bins between 0.5 and 30 Hz for the acute (first 2 hr, left) and full (first 6 hr, right) observation time window. For the 2 hr time window, the two-way ANOVA revealed an interaction effect between ‘condition’ and ‘frequency’ (F(118,590)=2.961, p<0.0001), but the main effect of ‘condition’ did not reach statistical significance (F(1,5) = 6.560, p=0.0506). In the 6 hr time window, there was an interaction effect between ‘condition’ and ‘frequency’ (F(118, 590)=4.726, p<0.0001) as well as a main effect of ‘condition’ (F(1,5) = 10.32, p=0.0237). Both ANOVAs also revealed a main effect of ‘frequency’. Frequency bins with significant differences in post hoc tests using uncorrected paired t-tests for α-error probability of p=0.05 are indicated with grey asterisks, for α-error probability of p=0.01 with black asterisks, and using Benjamini-Hochberg (BH) correction for multiple testing with light blue asterisks. (b) Frontal EEG spectra during NREM sleep following C21 injections relative to saline injections for the acute (first 2 hr, left) and prolonged (6 hr, right) observation period. Frequency bins with significant differences in uncorrected paired t-tests for α-error probability of p=0.05 are indicated with grey asterisks. n=6 for saline (grey) vs. 3 mg/kg C21 (blue). Data are presented as the mean ± s.e.m. (shaded areas). ANOVA: analysis of variance. C21: compound 21. EEG: electroencephalogram. NREM: non-rapid eye movement sleep. REM: rapid eye movement sleep.
Figure 5—figure supplement 2
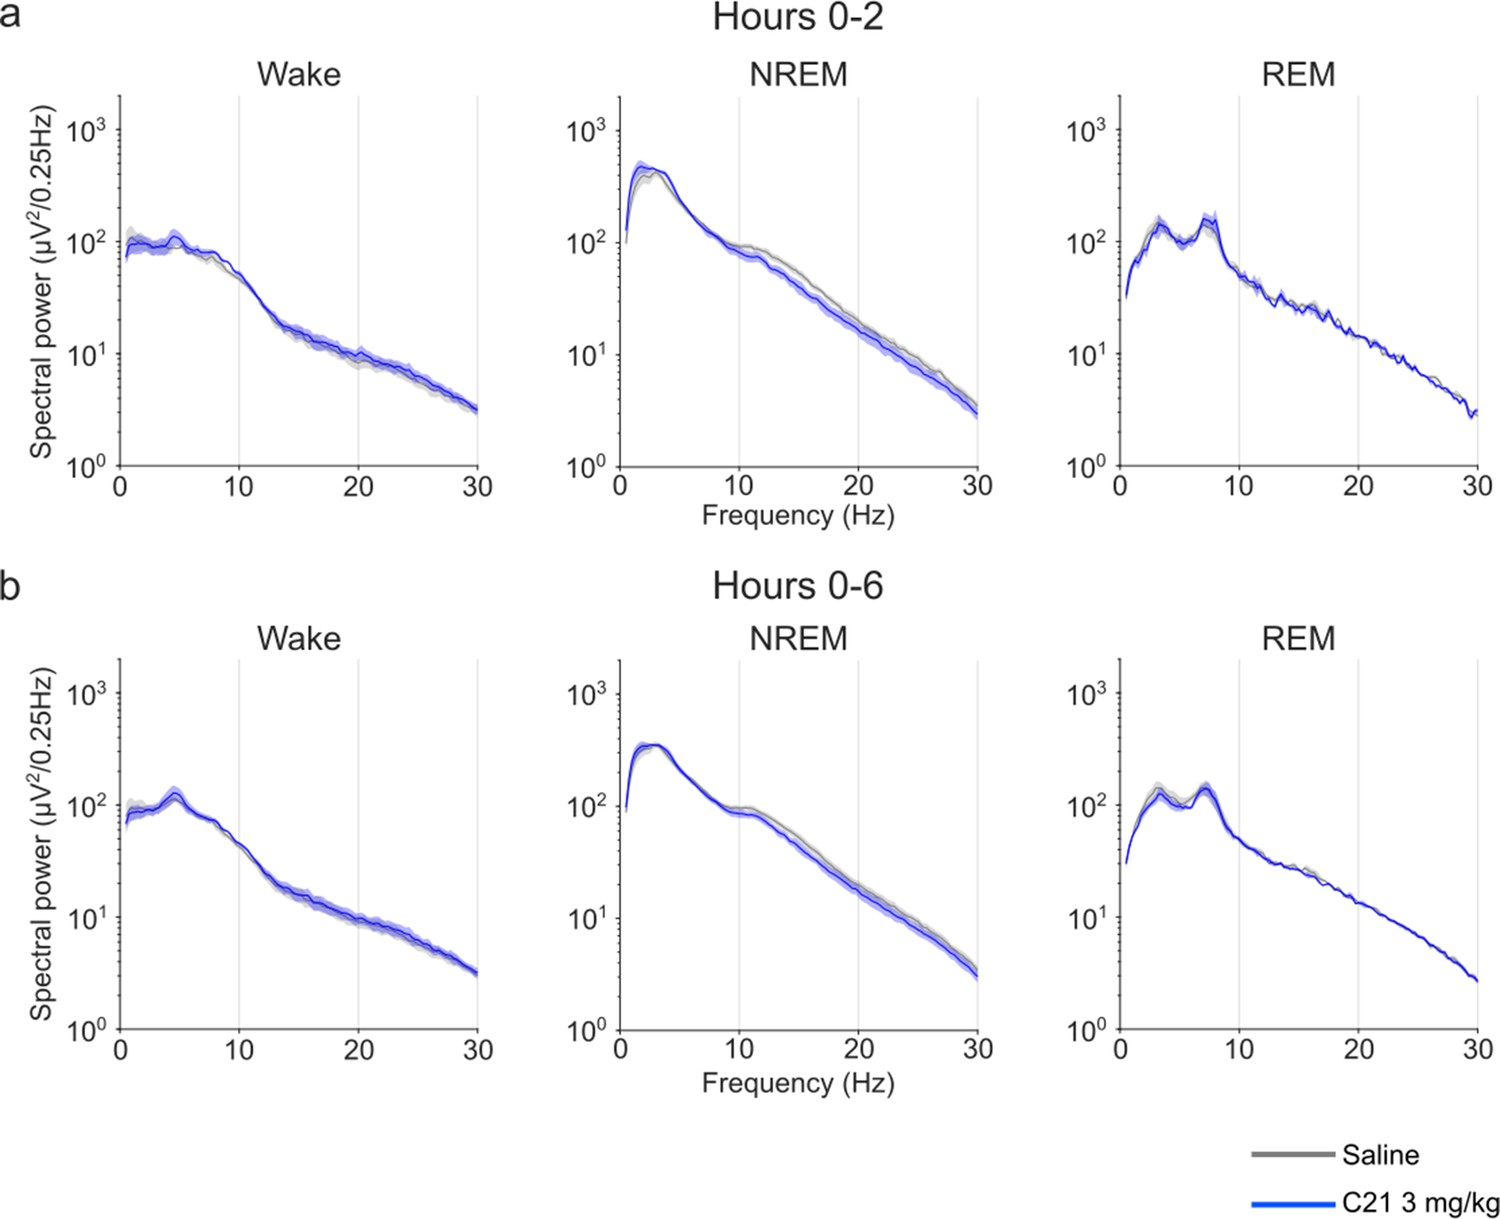
EEG power spectra of wakefulness, NREM, and REM sleep following injections of saline and 3 mg/kg C21.
Frontal EEG spectra in 0.25 Hz bins between 0.5 and 30 Hz arranged by vigilance state and time window. Note that due to the low number of suitable animals n=3 for the wake condition (because of movement artefacts in the EEG) no null-hypothesis testing was performed and the data are only presented for qualitative assessment. Data for all three vigilance states are only presented for n=3 to maintain the within-subject comparison. Data are presented as the mean ± s.e.m. (shaded areas). C21: clozapine-N-oxide. EEG: electroencephalogram. NREM: non-rapid eye movement sleep. REM: rapid eye movement sleep.
Figure 6
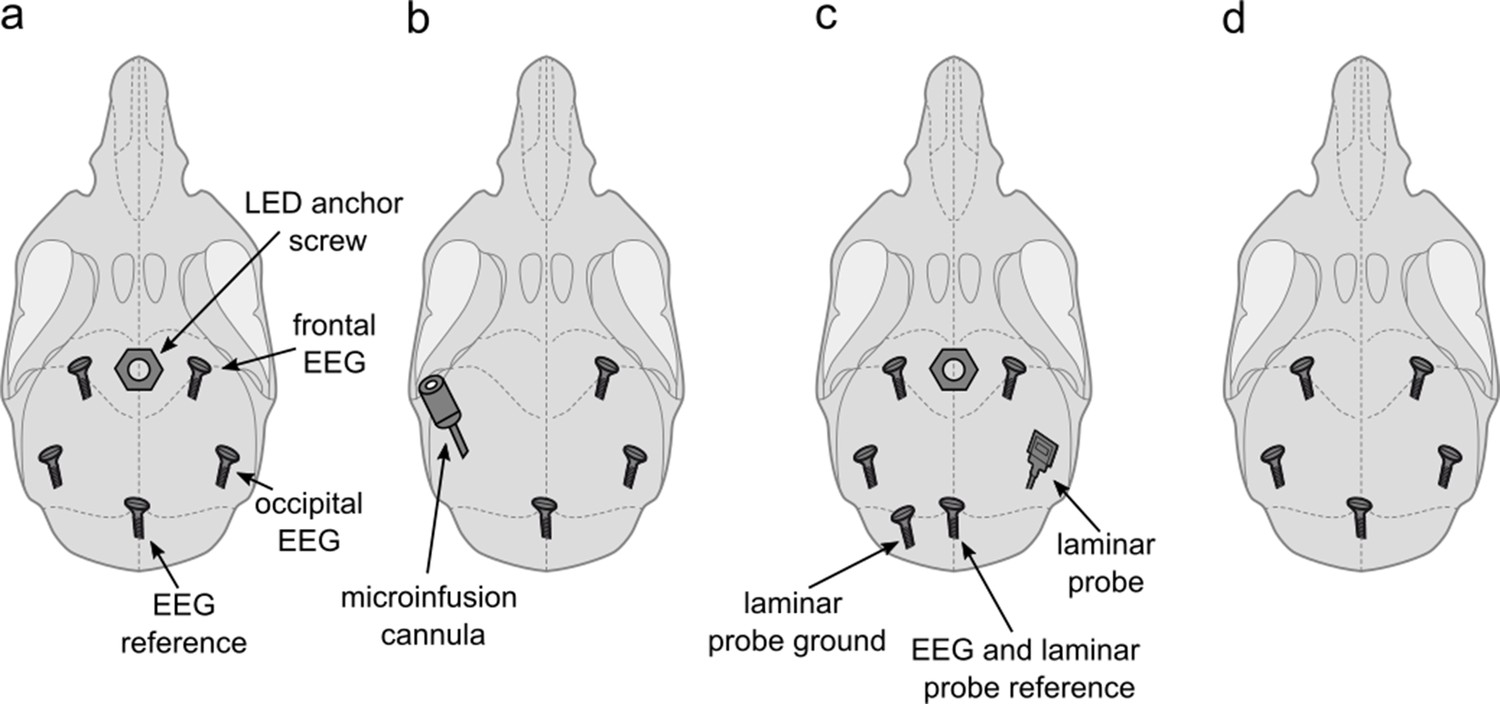
Implant configurations.
(a) LED anchor screw, bilateral frontal and occipital EEG screws, and cerebellar reference screw. Implant configuration of n=5 mice. (b) Microinfusion cannula, right frontal and occipital EEG screws, and a cerebellar reference screw. Implant configuration of n=4 mice. (c) LED anchor screw, bilateral frontal and left occipital EEG screws, right occipital laminar probe, and cerebellar ground and reference screws. Implant configuration of n=4 mice. (d) Bilateral frontal and occipital EEG screws, and cerebellar reference screw. Implant configuration of n=3 mice. LED: light-emitting diode. EEG: electroencephalogram.
Author response image 1
Benjamini-Hochberg correction for multiple comparisons confirms the robustness of CNO effects on NREM sleep EEG spectra. Note that the stringent α error threshold of p<0.01 (black asterisks) largely reflects the result of the uncorrected t-tests. Note that the Benjamini-Hochberg correction (light blue asterisks) fails to remove scattered positive bins that do not reach the α error threshold of p<0.01 when few bins are positive (e.g. Wake and REM spectra in the time window 0-2 hours) but removes potentially biologically relevant ranges of significant differences when many individual bins show stronger group differences (see spectral range <1.25 Hz in NREM spectra in the time window 0-2 hours). Reducing the resolution before applying BH correction can fail to detect small spectral ranges with strong difference but can highlight spectral ranges with several slight difference (see REM spectra in the time window 0-6 hours).
Author response image 2
Frontal EEG spectra in comparison between 1 mg/kg CNO and saline injections.
Author response image 3
Frontal EEG spectra in comparison between 5 mg/kg CNO and saline injections.
Author response image 4
Frontal EEG spectra in comparison between 10 mg/kg CNO and saline injections.
Author response image 5
Absolute and relative frontal EEG spectra of NREM sleep in comparison between 3 mg/kg C21 and saline injections in n=6 animals.
a) absolute and b) relative EEG spectra. Note that this analysis performed on n=6 animals with artefact-free NREM sleep resembles the EEG spectral changes observed in the 5 and 10 mg/kg CNO condition.
Author response image 6

NREM sleep architecture over the first 2 hours following saline and CNO injections.
Author response image 7
NREM sleep architecture over the first 2 hours following saline and C21 injections.
Tables
Author response table 1
Comparison of CNO effects for all animals (n=16) and for the subgroup of animals (n=11) that received all four injections (saline and 3 doses of CNO).
Note that despite the considerably reduced power, all but two previously significant analysis still approach significance (p < 0.1). Further note that the effect sizes are very similar between n=11 and n=16 animals, indicating that the effects of the main analysis were not driven by the 5 animals that did not undergo all three CNO treatment conditions.
| null-hypothesistesting (mixedeffect models)p-value | effect sizes1 mg/kg CNO | effect sizes5 mg/kg CNO | effect sizes10 mg/kg CNO | |||||
|---|---|---|---|---|---|---|---|---|
| Analysis | ||||||||
| n=16 | n=11 | n=16 | n=11 | n=16 | n=11 | n=16 | n=11 | |
| Wake (%, 0-2 h) | 0.2504 | 0.4114 | -0.0234 | -0.0489 | -0.3393 | -0.3890 | -0.4815 | -0.3793 |
| Wake (%, 0-6 h) | 0.4928 | 0.5702 | 0.1467 | 0.1059 | -0.1715 | -0.2587 | -0.2633 | -0.2145 |
| NREM (%, 0-2 h) | 0.0682 | 0.2085 | 0.1157 | 0.1389 | 0.4941 | 0.4915 | 0.6961 | 0.5389 |
| NREM (%, 0-6 h) | 0.1661 | 0.3039 | -0.0361 | -0.0416 | 0.4130 | 0.4214 | 0.4630 | 0.3328 |
| REM (% of TST, 0-2 h) | 0.0019 | 0.0211 | -0.5802 | -0.6207 | -0.5594 | -0.4037 | -1.2743 | -1.3152 |
| REM (% of TST, 0-6 h) | 0.0038 | 0.0863 | -0.4697 | -0.3743 | -0.7724 | -0.5301 | -0.9333 | -0.8488 |
| Longest NREM ep. | 0.0001 | 0.0005 | 0.3562 | 0.3616 | 0.9438 | 0.9599 | 1.5129 | 1.2811 |
| Av. NREM ep. Dur. | 0.0001 | 0.0028 | 0.1810 | 0.0356 | 1.1430 | 1.1181 | 1.1883 | 0.9655 |
| Number of NREM ep. | 0.0010 | 0.0181 | -0.2938 | -0.1339 | -1.0628 | -1.0981 | -1.1989 | -1.0248 |
| NREM latency | 0.0463 | 0.1068 | -1.2021 | -1.1337 | -0.3744 | -0.4198 | -0.2424 | -0.1689 |
| Longest REM ep. | 0.6266 | 0.7213 | -0.0083 | -0.2382 | 0.1710 | 0.0684 | 0.2450 | 0.0163 |
| Av. REM ep. | 0.0232 | 0.0631 | -0.3757 | -0.5302 | 0.5463 | 0.4006 | 0.4111 | 0.1842 |
| Number of REM ep. | 0.0047 | 0.0741 | -0.0892 | 0.0870 | -0.7456 | -0.5453 | -0.8710 | -0.5829 |
| REM latency | 0.0220 | 0.0532 | 0.8061 | 0.7955 | 0.3202 | 0.3279 | 0.9213 | 0.7851 |
| Brief awakenings | 0.0006 | 0.0106 | -0.6271 | -0.4125 | -1.0691 | -0.8290 | -1.5760 | -1.4014 |
| NREM before REM | 0.0137 | 0.0577 | 0.7996 | 0.8960 | 0.5317 | 0.6101 | 1.8239 | 1.6994 |
Additional files
-
Supplementary file 1
Time spent in wakefulness, non-rapid eye movement (NREM), and rapid eye movement (REM) sleep after clozapine-N-oxide (CNO) and saline injections.
- https://cdn.elifesciences.org/articles/84740/elife-84740-supp1-v1.docx
-
Supplementary file 2
Sleep architecture after clozapine-N-oxide (CNO) and saline injections.
- https://cdn.elifesciences.org/articles/84740/elife-84740-supp2-v1.docx
-
Supplementary file 3
Non-rapid eye movement (NREM) sleep architecture for the first 2 hr after clozapine-N-oxide (CNO) and saline injections.
- https://cdn.elifesciences.org/articles/84740/elife-84740-supp3-v1.docx
-
Supplementary file 4
Analysis of variance (ANOVA) results for electroencephalography (EEG) spectra following clozapine-N-oxide (CNO) and saline injections.
- https://cdn.elifesciences.org/articles/84740/elife-84740-supp4-v1.docx
-
Supplementary file 5
Sleep parameters after saline and compound 21 (C21) injections.
- https://cdn.elifesciences.org/articles/84740/elife-84740-supp5-v1.docx
-
Supplementary file 6
Non-rapid eye movement (NREM) sleep architecture for the first 2 hr after compound 21 (C21) and saline injections.
- https://cdn.elifesciences.org/articles/84740/elife-84740-supp6-v1.docx
-
MDAR checklist
- https://cdn.elifesciences.org/articles/84740/elife-84740-mdarchecklist1-v1.docx
Download links
A two-part list of links to download the article, or parts of the article, in various formats.
Downloads (link to download the article as PDF)
Open citations (links to open the citations from this article in various online reference manager services)
Cite this article (links to download the citations from this article in formats compatible with various reference manager tools)
Effects of clozapine-N-oxide and compound 21 on sleep in laboratory mice
eLife 12:e84740.
https://doi.org/10.7554/eLife.84740


