Arabidopsis transcriptome responses to low water potential using high-throughput plate assays
- Plant Biology Laboratory, The Salk Institute for Biological Studies, United States
- The Robert H. Smith Institute of Plant Sciences and Genetics in Agriculture, Faculty of Agriculture, Food, and Environment, The Hebrew University of Jerusalem, Israel
- Genomic Analysis Laboratory, The Salk Institute for Biological Studies, United States
- Howard Hughes Medical Institute, The Salk Institute for Biological Studies, United States
Figures
Figure 1 with 4 supplements
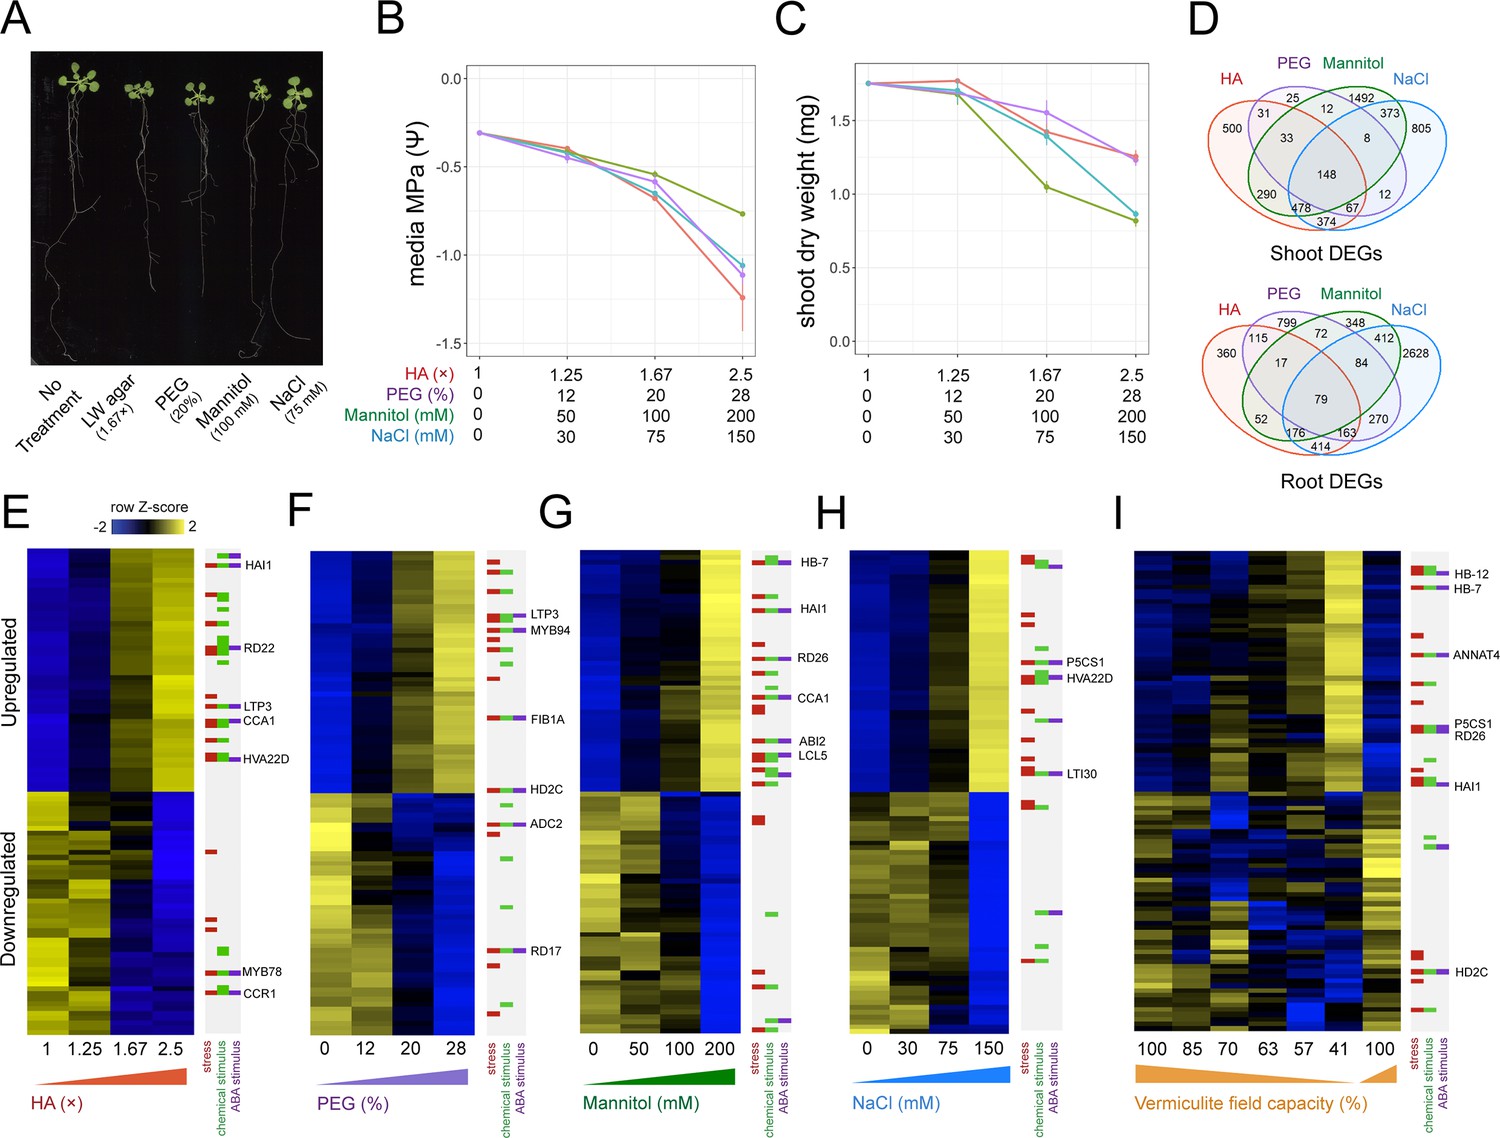
Benchmarking the impact different stress assays have on Arabidopsis gene expression.
(A) 22-day-old Arabidopsis growth on plates under either 1.67× hard agar (HA), 20% polyethylene glycol (PEG), 100 mM mannitol, or 75 mM NaCl treatments. (B) Water potential measurements of treatment media (n=3–4). (C) Dry weight of 22-day-old Arabidopsis seedlings under different doses of each stress treatment (n=11–12). (D) Number and intersect of differentially expressed genes (DEGs) that are dose-responsive to each stress treatment within root and shoot tissue. (E–I) Heatmaps displaying the top 50 most significant upregulated or downregulated genes in response to (E) HA, (F) PEG, (G) mannitol, (H) NaCl, and (I) vermiculite drying in the Arabidopsis root (n=2–3 biological replicates). Key genes and membership of Gene Ontology (GO) Terms for ‘response to stress’, ‘response to chemical stimulus’, or ‘response to ABA stimulus’ are indicated. ABA, abscisic acid.
Figure 1—figure supplement 1
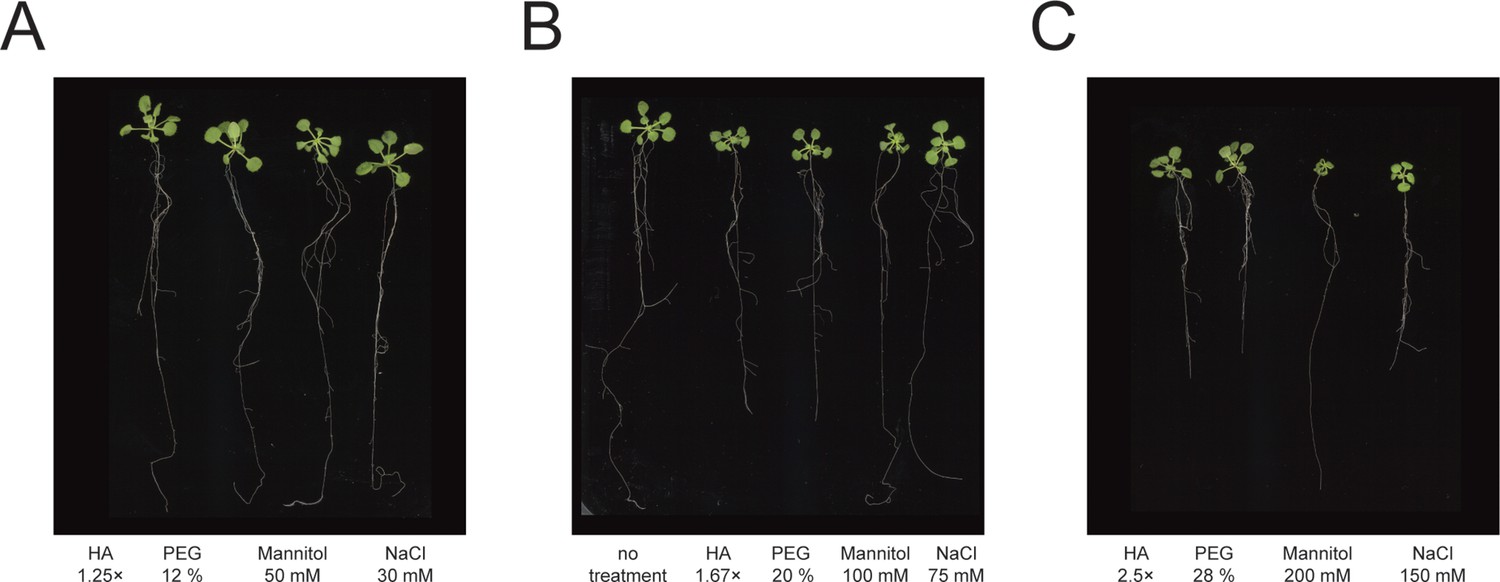
Plant growth responses to stress assays.
(A–C) Images of 22-day-old Arabidopsis seedlings grown under different doses of each agar stress assay.
Figure 1—figure supplement 2
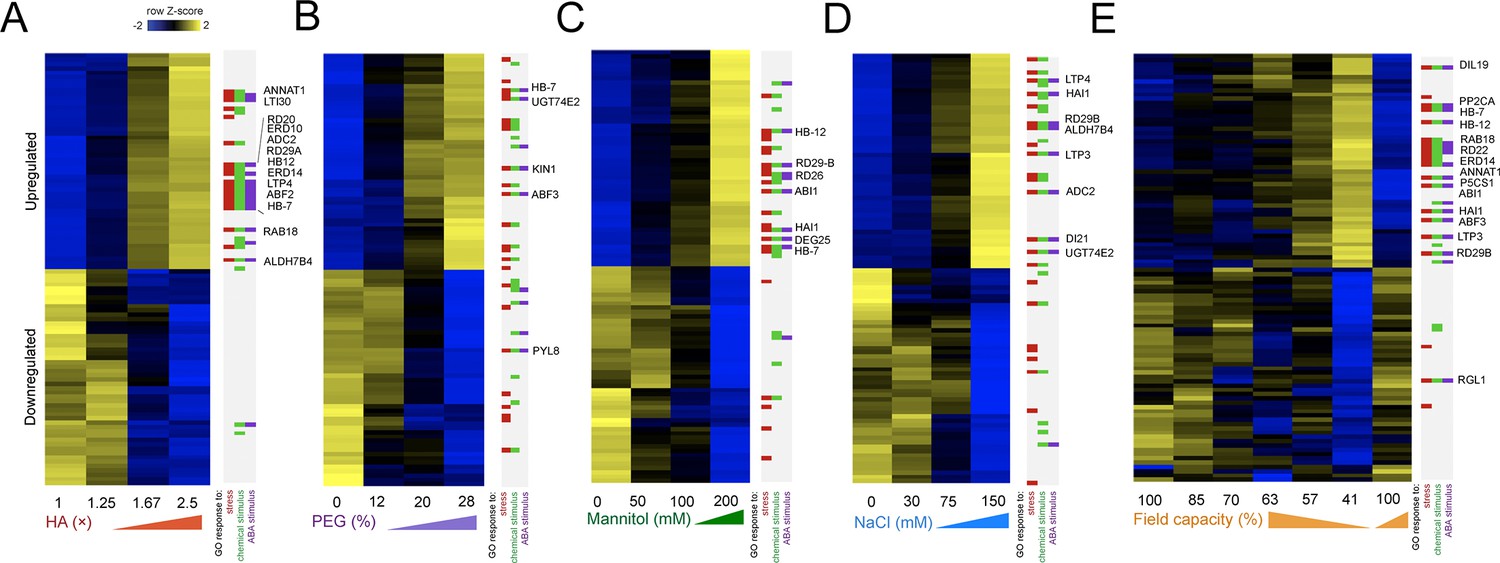
Shoot gene expression responses to each stress assay are dose-responsive.
Heatmap displaying the top 50 most significant upregulated or downregulated genes in shoots in response to (A) hard agar (HA), (B) polyethylene glycol (PEG), (C) mannitol, (D) NaCl, and (E) vermiculite drying (n=2–3 biological replicates). Key genes and membership of Gene Ontology (GO) Terms for ‘response to stress’, ‘response to chemical stimulus’, or ‘response to ABA stimulus’ indicated. ABA, abscisic acid.
Figure 1—figure supplement 3
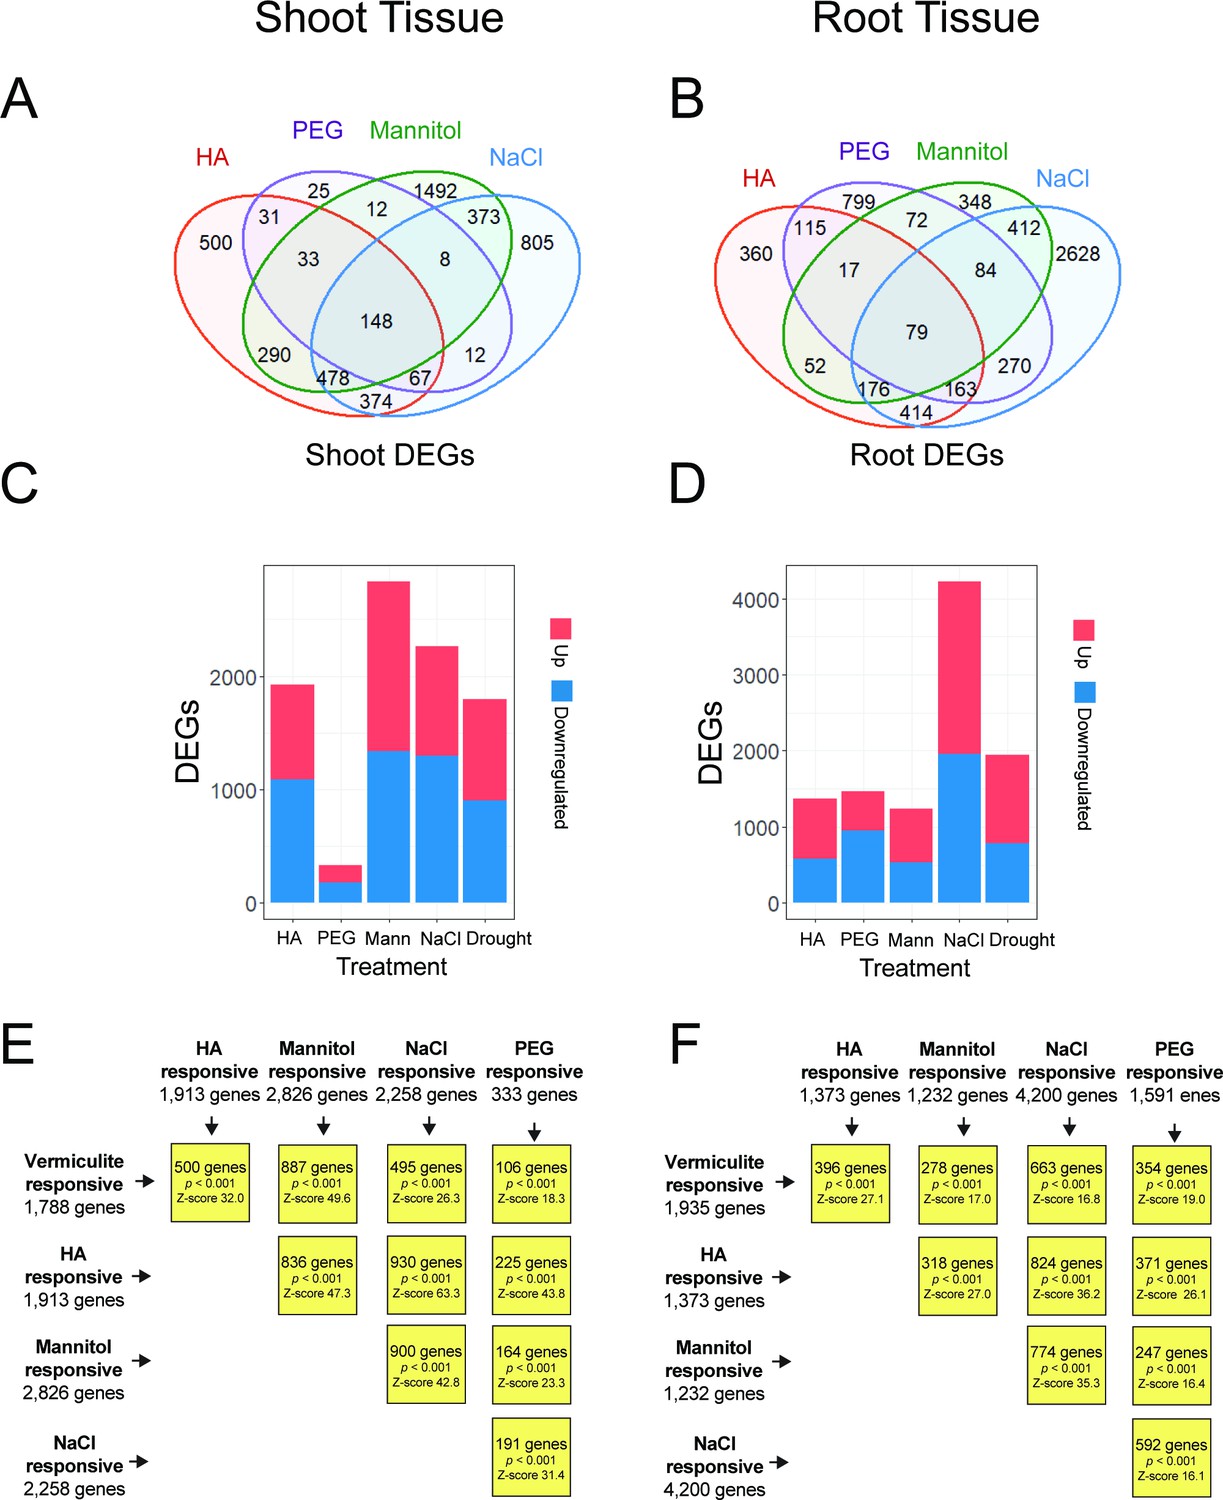
Overlapping differentially expressed genes (DEGs) responsive to different assay types.
Overlap of dose-responsive differentially expressed genes in shoot (A) and root (B) in response to either hard agar (HA), polyethylene glycol (PEG), mannitol, or NaCl (replicated from Figure 1). Number of upregulated or downregulated dose-responsive genes in response to each treatment type in shoot (C) and root (D). Overlapping gene sets in (E) shoot or (F) root tissue (permutation test, p<0.001).
Figure 1—figure supplement 4
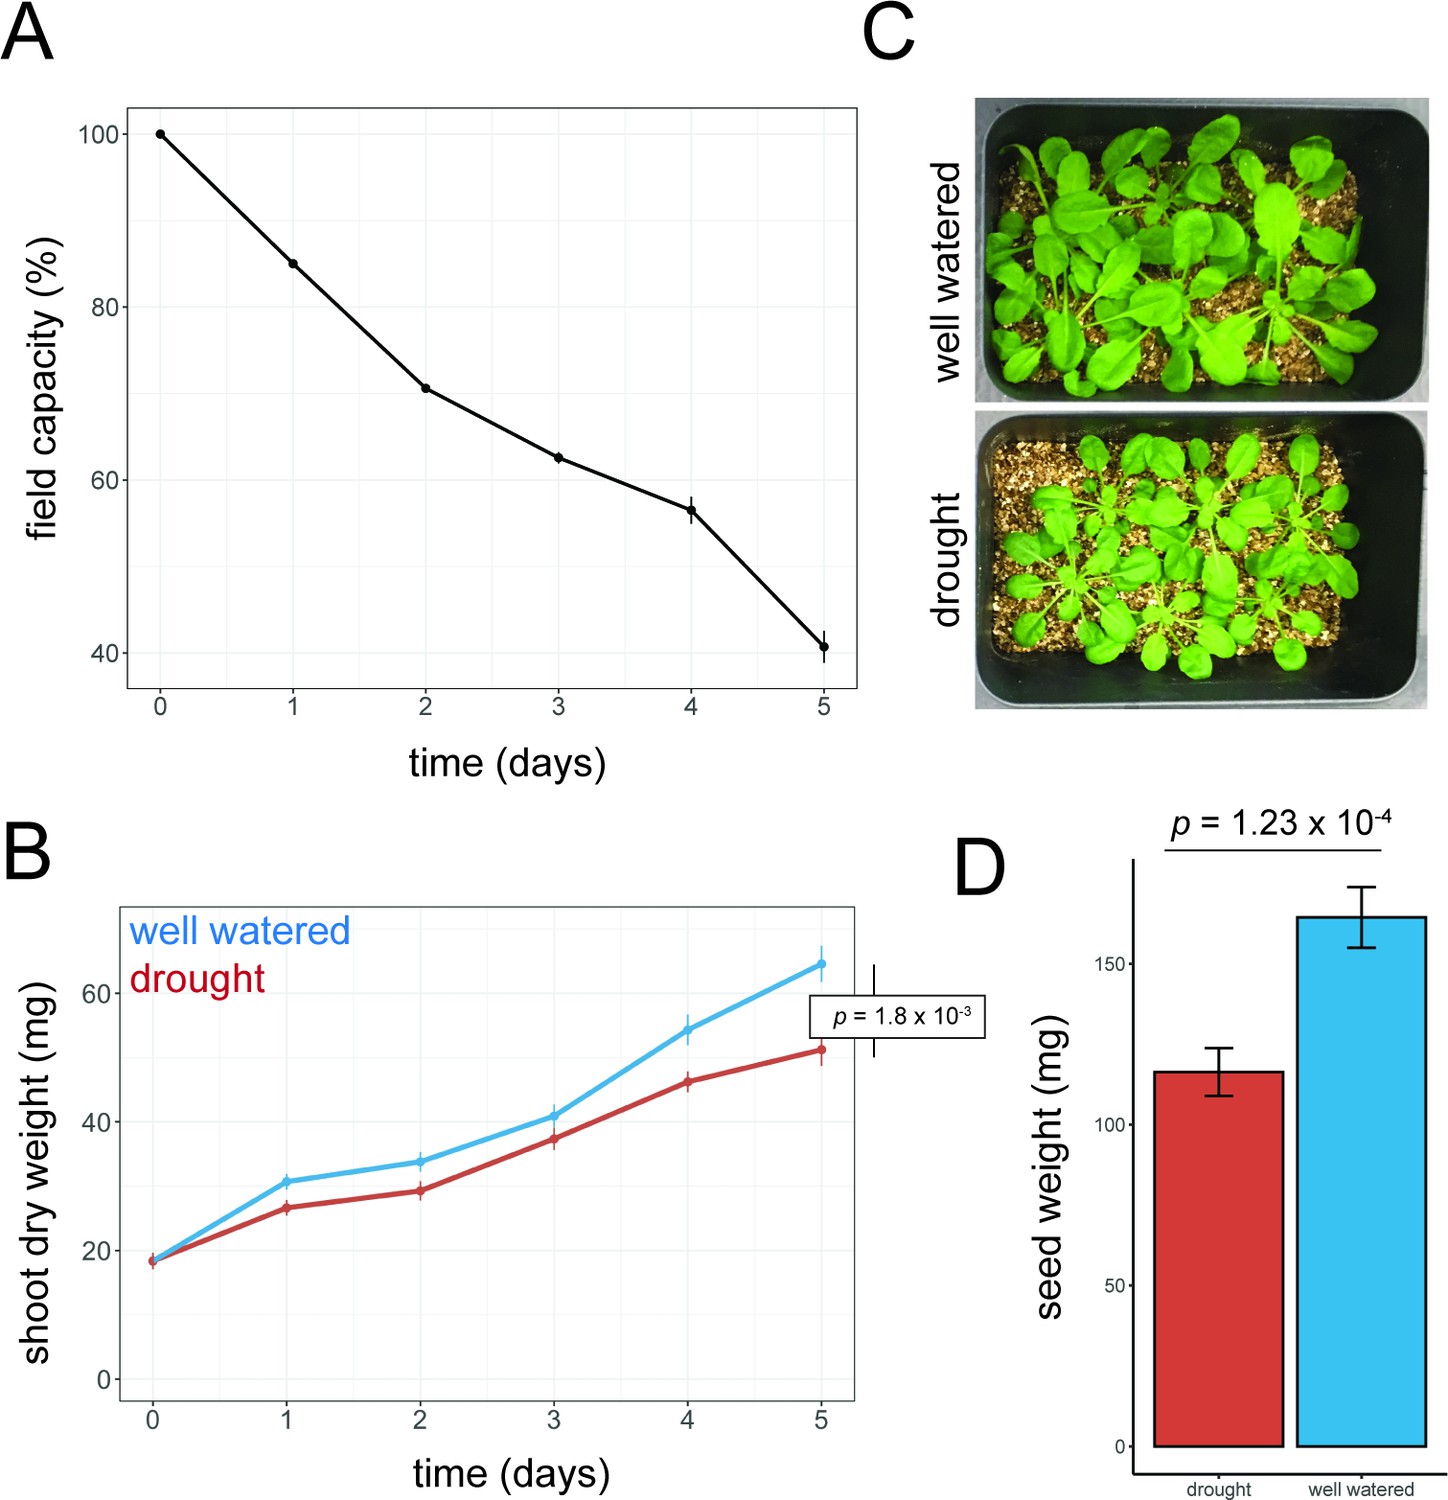
Treating vermiculite-grown Arabidopsis plants to mild drought stress.
(A) Field capacity measurements of vermiculite as water evaporated over a 5-day period (n=6–12). (B) Shoot dry weight of Arabidopsis rosettes as they grew either under well-watered conditions or drought conditions over a 5-day period (t-test, n=12). (C) Images of plants after 5 days of water stress. (D) Seed yield resulting from Arabidopsis plants after drought recovery (t-test, n=50).
Figure 2 with 7 supplements
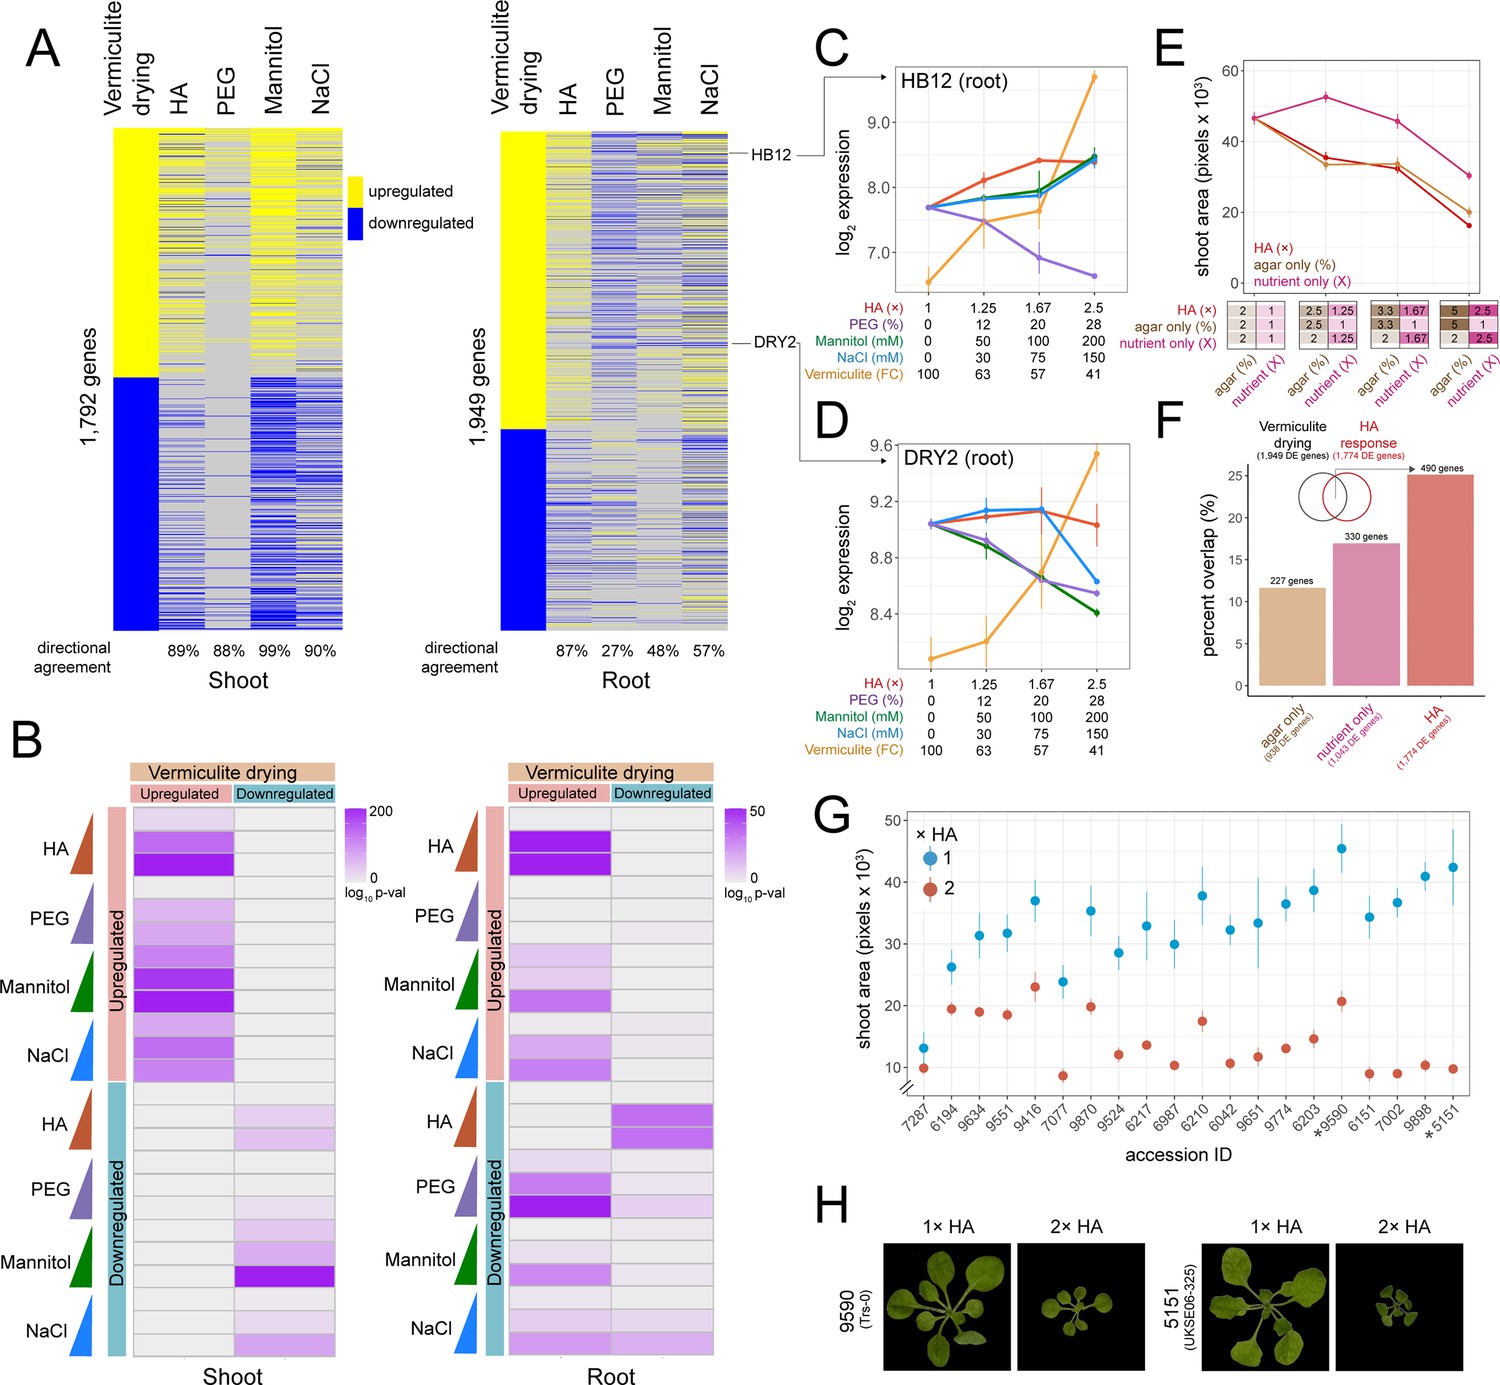
Comparing hard agar (HA), polyethylene glycol (PEG), mannitol, and NaCl gene expression responses to vermiculite drying.
(A) Heatmap displaying genes differentially expressed in response to vermiculite drying in shoot or root tissue compared to their dose-responsive expression within each plate-based assay. Level of ‘directional agreement’ (i.e. differentially expressed in the same direction) found within each assay reported. (B) Overlap analysis of genes found differentially expressed due to vermiculite drying, compared to those found differentially expressed within each dose of PEG, mannitol, NaCl, or HA assays in both shoot and root (Fisher’s exact test, adj. p<0.05). (C–D) Expression patterns of HOMEOBOX12 (HB12) and DROUGHT HYPERSENSITIVE 2 (DRY2) across each assay in root tissue (n=2-3). (E) Shoot area of seedlings grown under increasing doses of HA, agar, or nutrient concentrations (n=19). (F) Number and percent overlap of genes found differentially expressed in response to increasing doses of HA, agar, or nutrient concentrations with those differentially expressed in response to vermiculite drying. (G) Total shoot area of Arabidopsis accessions grown under either 1× or 2× HA treatment (n=5–12). (H) Images of Arabidopsis Trs-0 or UKSE06-325 accessions grown on either 1× or 2× HA treatment.
Figure 2—figure supplement 1
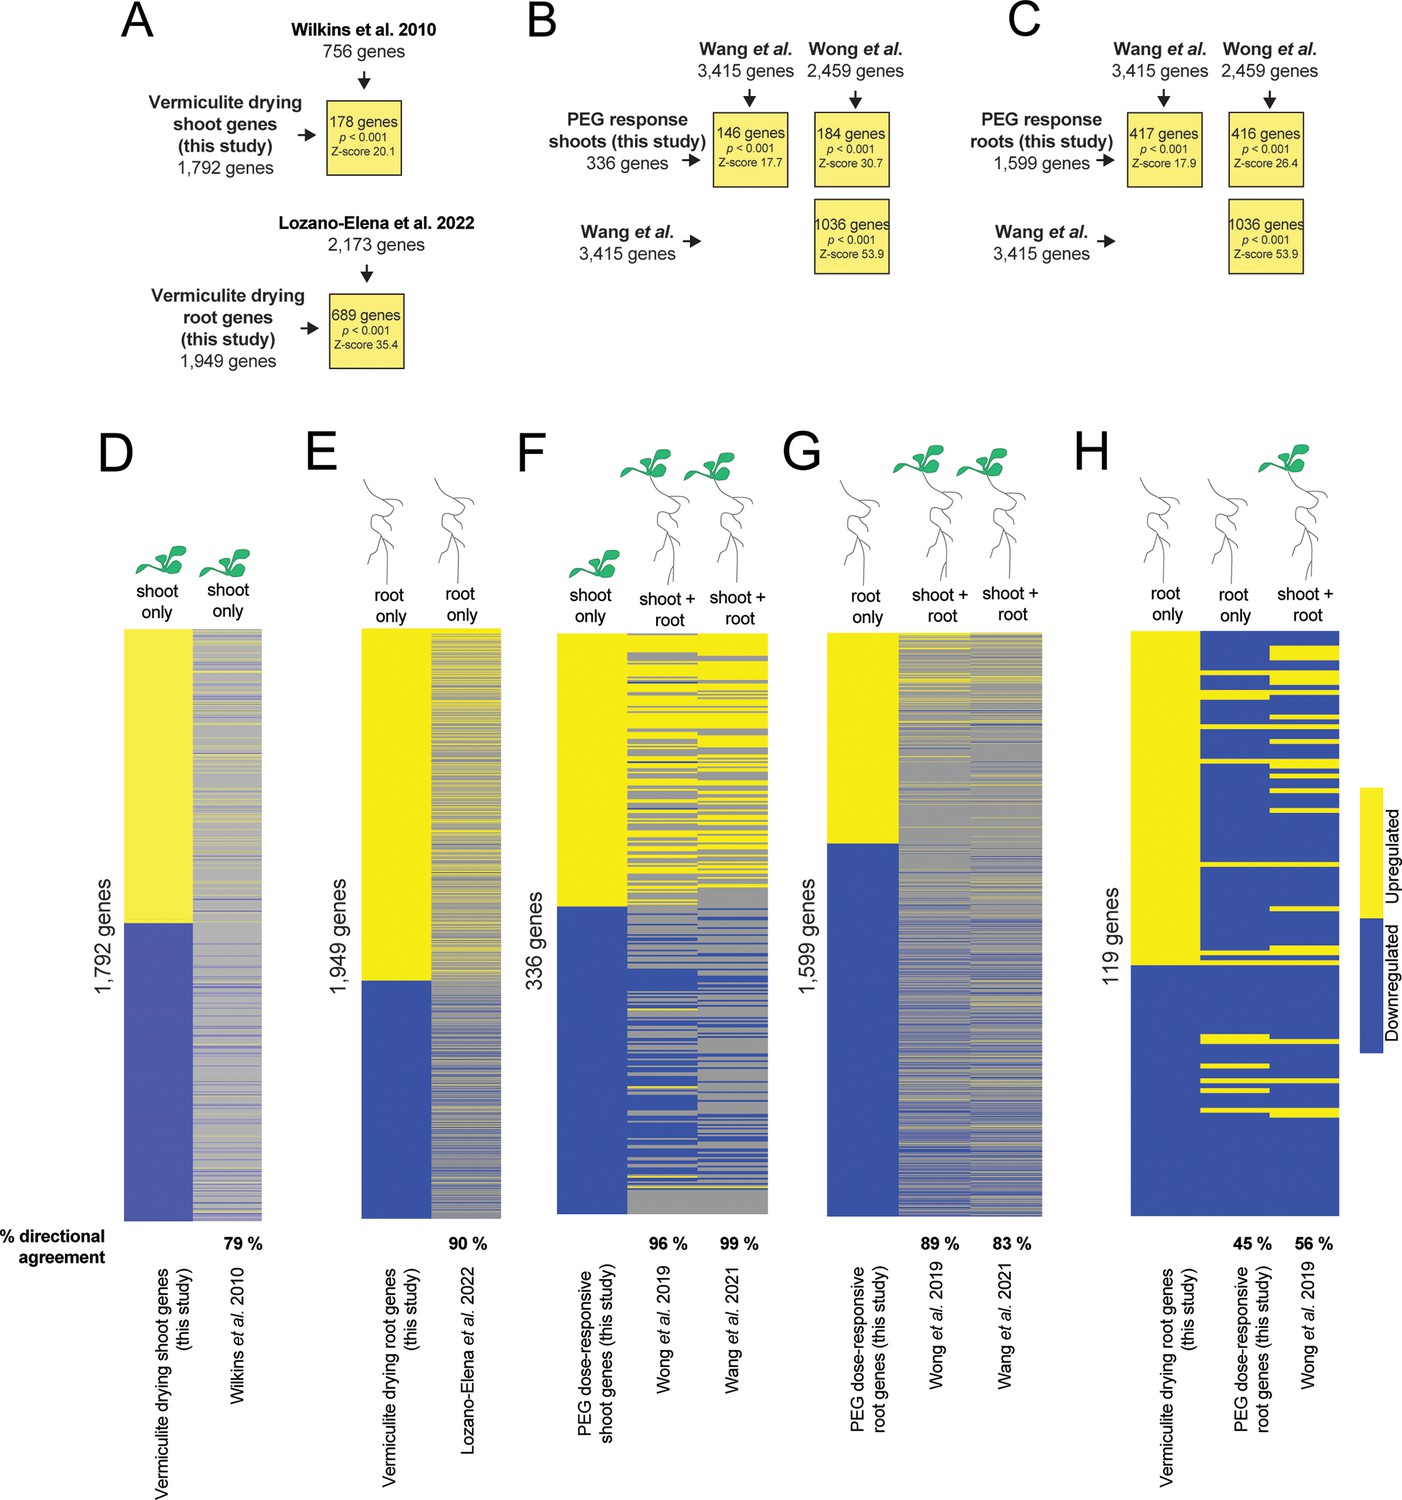
Comparing gene expression responses to vermiculite drying and polyethylene glycol (PEG) treatment with previous studies.
(A) Intersect analysis of root or shoot genes found differentially expressed in response to vermiculite drying within this study, and genes found differentially expressed in response to soil drying by Lozano-Elena et al., 2022, or by Wilkins et al., 2010 (permutation test, p<0.001). (B–C) Intersect analysis of genes found differentially expressed in response to PEG treatment in shoot (B) or root (C) in this study, with those found differentially expressed in response to PEG treatment by Wong et al., 2019, and Wang et al., 2021 (permutation test, p<0.001). (D–E) Heatmap displaying direction of shoot (D) or root (E) differentially expressed in response to vermiculite drying (this study) and Wilkins et al., 2010, or Lozano-Elena et al., 2022, respectively. Directional agreement with this study’s vermiculite drying response indicated. (F–G) Heatmap displaying direction of genes differentially expressed in response to PEG treatment across each study. We note that both Wong et al. and Wang et al. assess transcriptomic responses of whole seedlings (both root and shoot), and thus we compare our shoot (F) and root (G) data separately. (E) Examining the 119 genes that were differentially expressed in response to drought (this study), PEG treatment (this study), and PEG treatment reported in Wong et al.
Figure 2—figure supplement 2
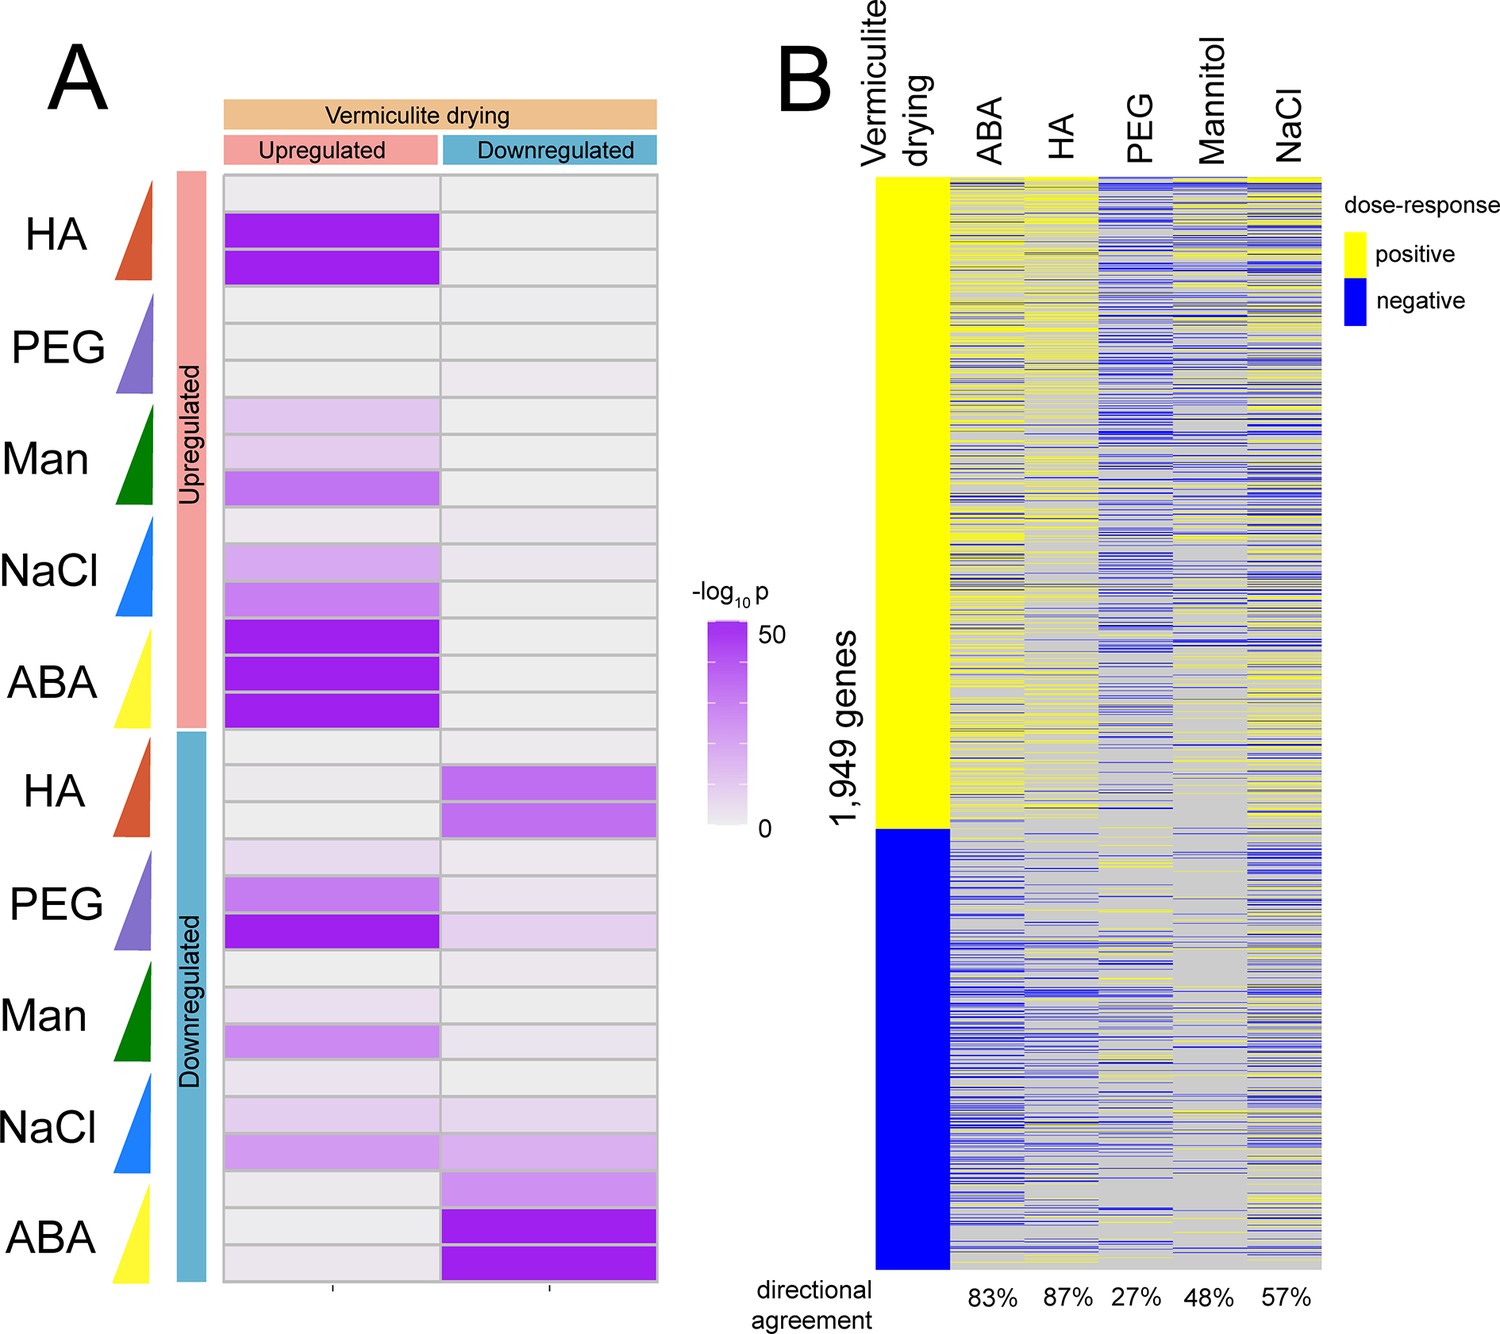
Comparing abscisic acid (ABA)-induced differential expression to vermiculite drying and hard agar (HA)-induced gene expression patterns.
(A) Overlap analysis of genes found differentially expressed in response to vermiculite drying, compared to those within each dose of either transient ABA treatment, polyethylene glycol (PEG), mannitol, NaCl, or HA assays in both root and shoot (Fisher’s exact test, adj. p<0.05). (B) Heatmap displaying genes differentially expressed under vermiculite drying in root tissue compared to their dose-responsive expression within each stress assay. Direction of gene expression agreement with vermiculite-drying responsive gene expression (i.e. ‘directional agreement’) indicated.
Figure 2—figure supplement 3
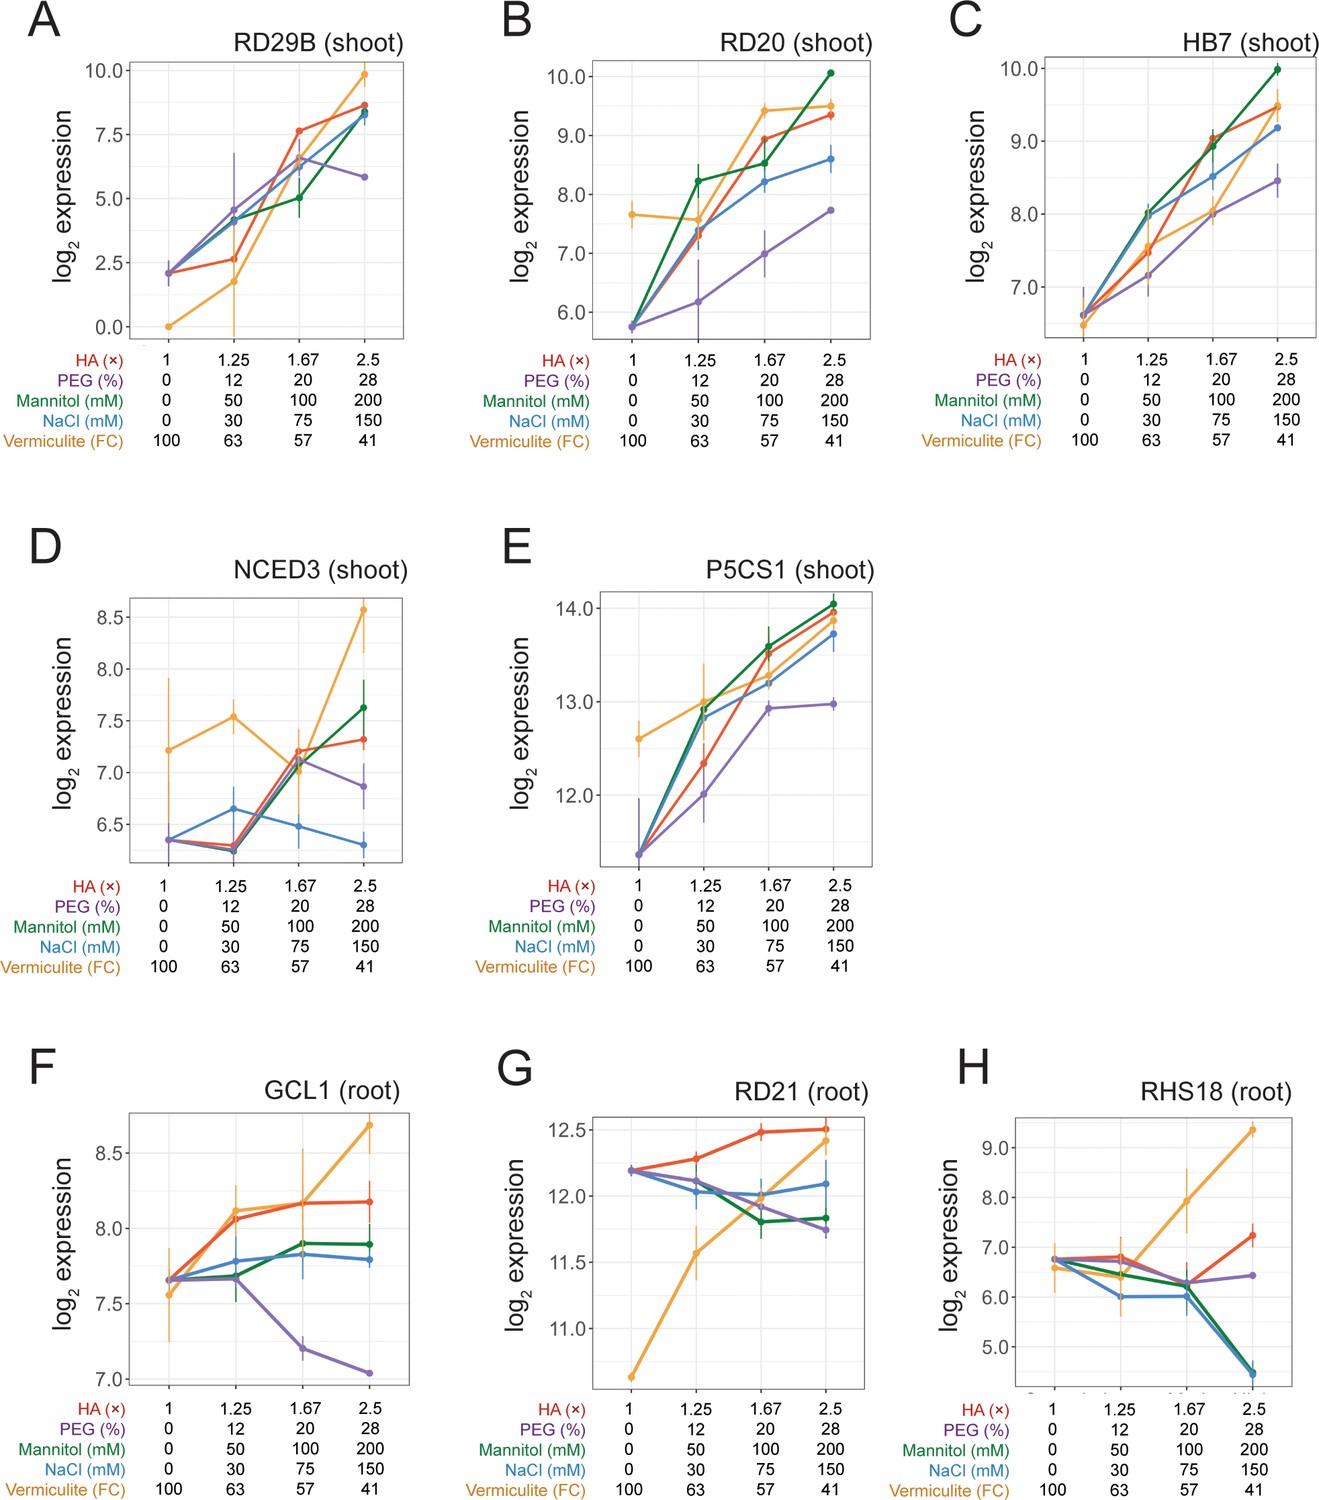
Gene expression profiles of individual genes.
(A–E) Expression patterns of individual genes under doses of each assay in shoot tissue: (A) RD29B, (B) RD20, (C) HB7, (D) NCED3 and (E) P5CS1. (F–H) Expression patterns of individual genes under doses of each assay in root tissue: (F) GCL1, (G) RD21, and (H) RHS18.
Figure 2—figure supplement 4
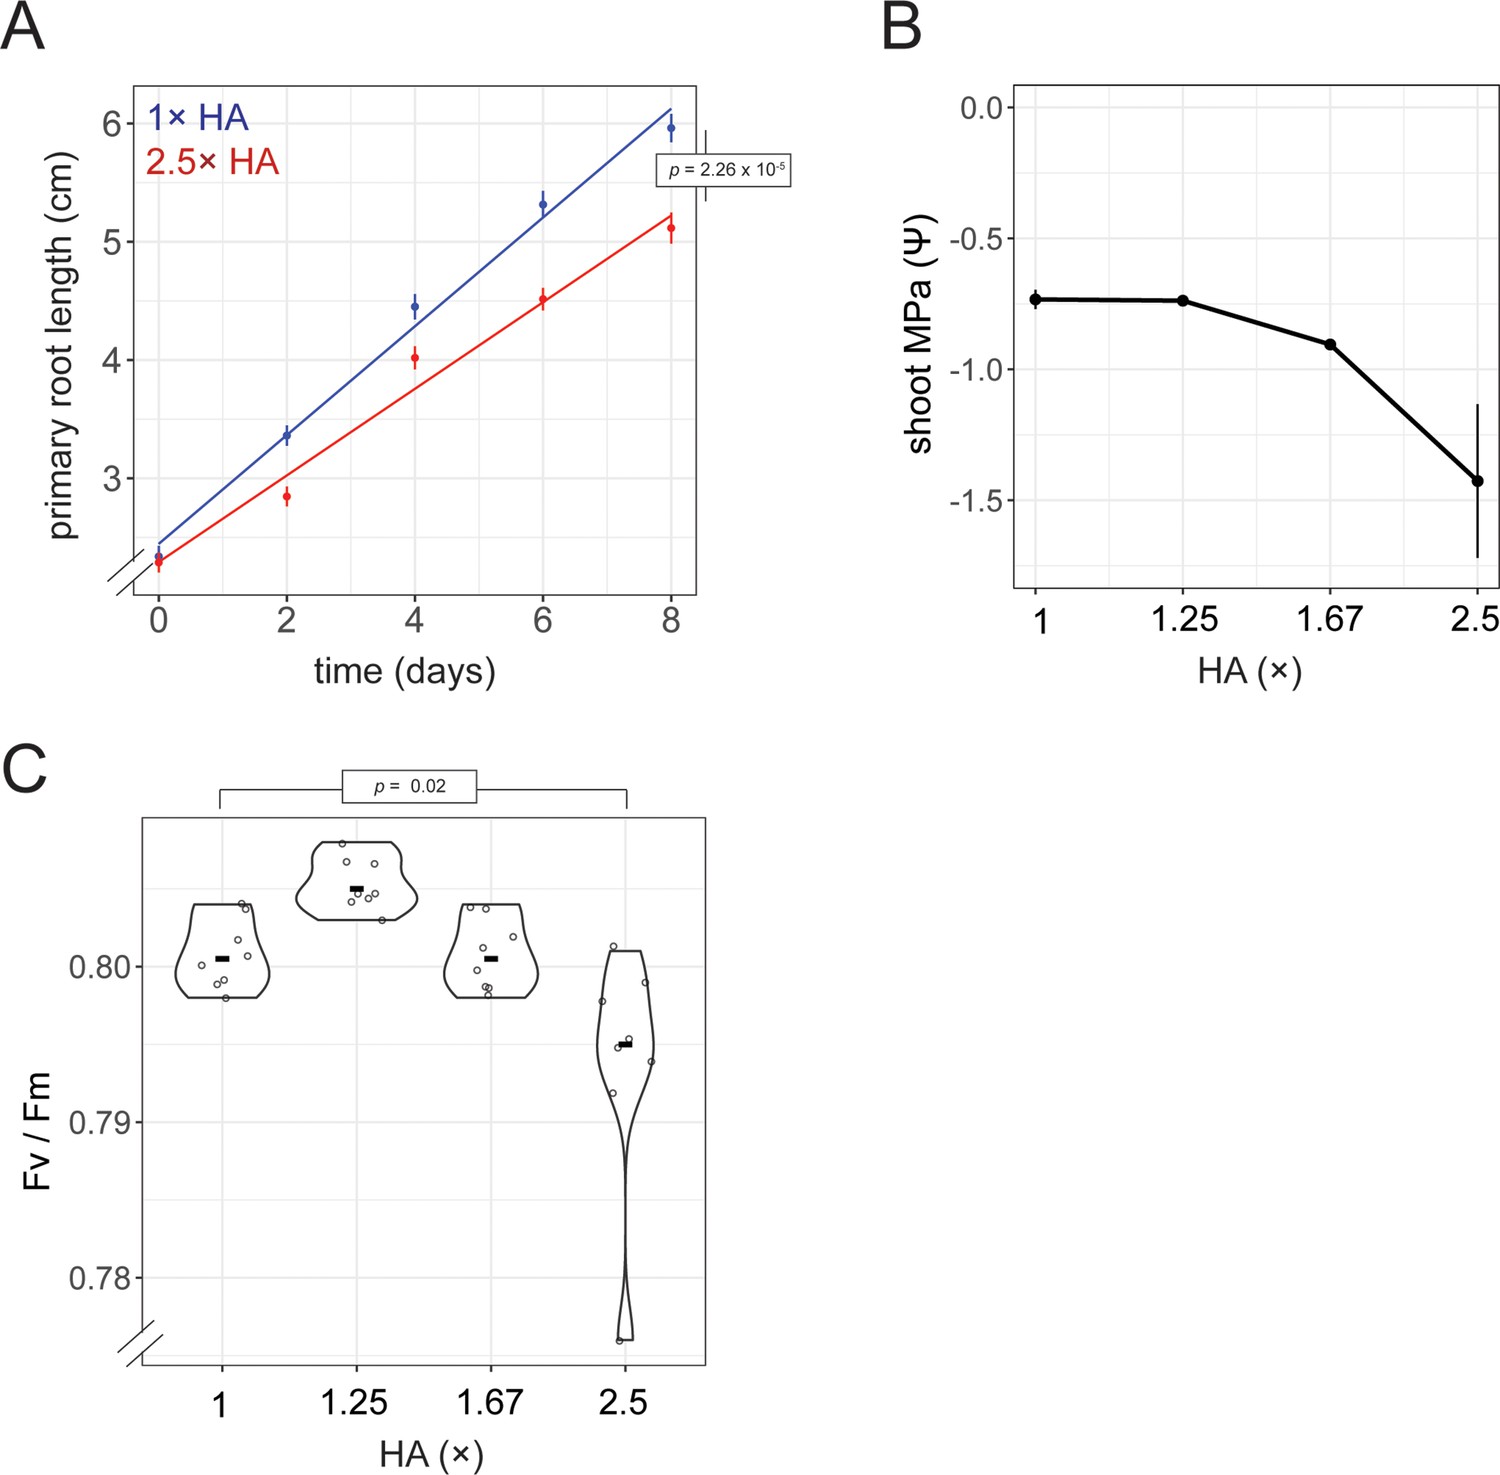
Physiological measurements of Arabidopsis seedlings in response to hard agar (HA) treatment.
(A) Measurement of primary root growth rate across 8 days of growth under 1× HA (no treatment) and 2.5× HA conditions (n=16, t-test p). (B) Shoot water potential measurements of seedlings grown under different HA media doses (n=3, Pearson p=0.009). (C) Measurement of maximum quantum yield of photosystem II (PSII) (Fv/Fm) under different HA media doses (n=4, t-test p).
Figure 2—figure supplement 5
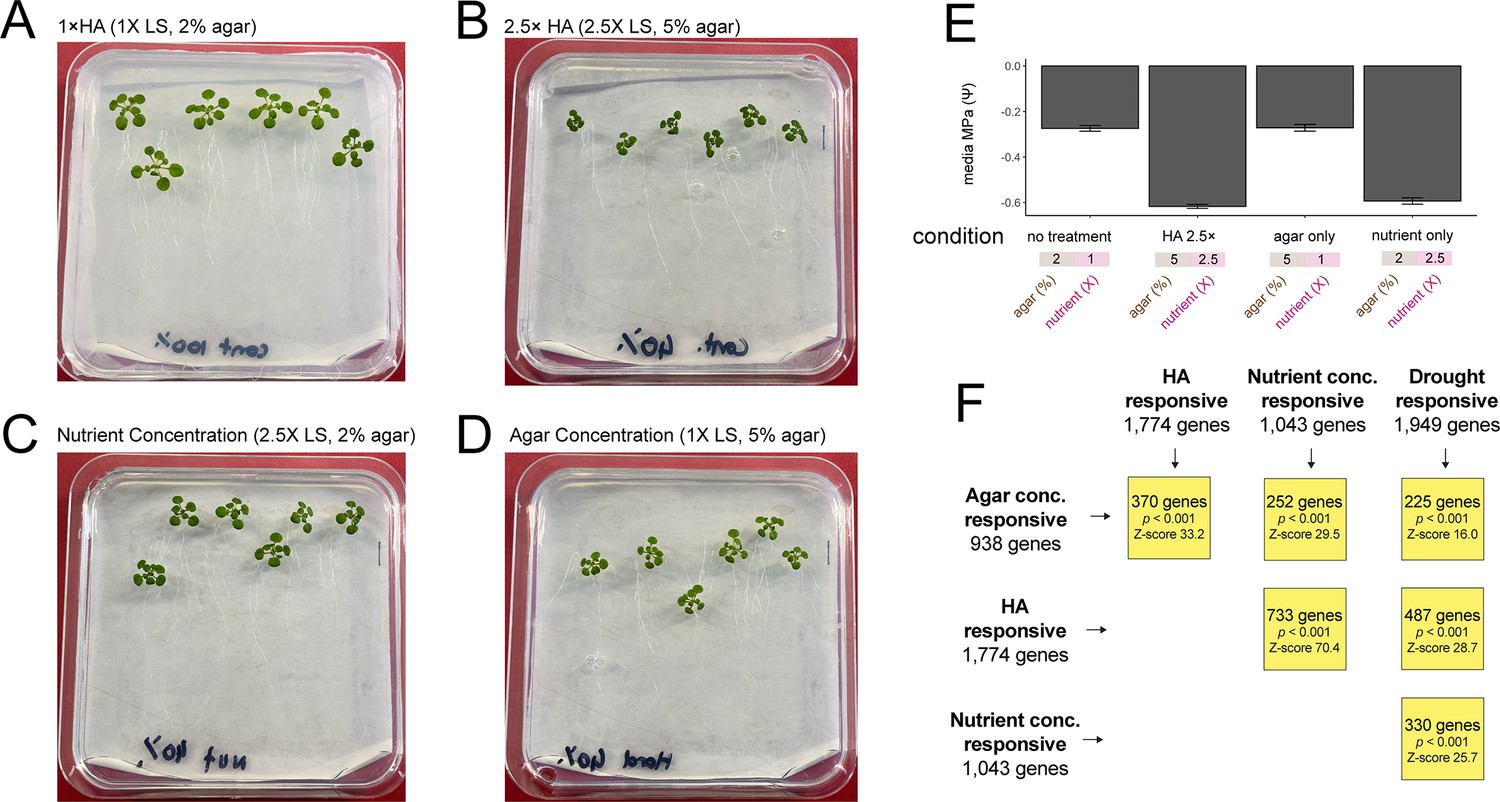
Comparing the separate effects of nutrient concentration and agar concentration on seedling growth.
Image of Arabidopsis seedlings grown on either (A) 1× hard agar (HA) (i.e. 1× Linsmaier & Skoog [LS], 2% agar) or (B) 2.5× HA, which increased both nutrient and agar concentrations to 2.5× and 5%, respectively. (C) Image of seedlings grown on an increased 2.5× nutrient concentration (without a change in agar concentration). (D) Image of seedlings grown on an increased 5% agar concentration (without a change in nutrient concentration). (E) Water potential measurements of media presented in (A–D) (n=3). (F) Intersection of differentially expressed genes responsive to either agar concentration, nutrient concentration, HA treatment, or drought stress (permutation test, p<0.001).
Figure 2—figure supplement 6
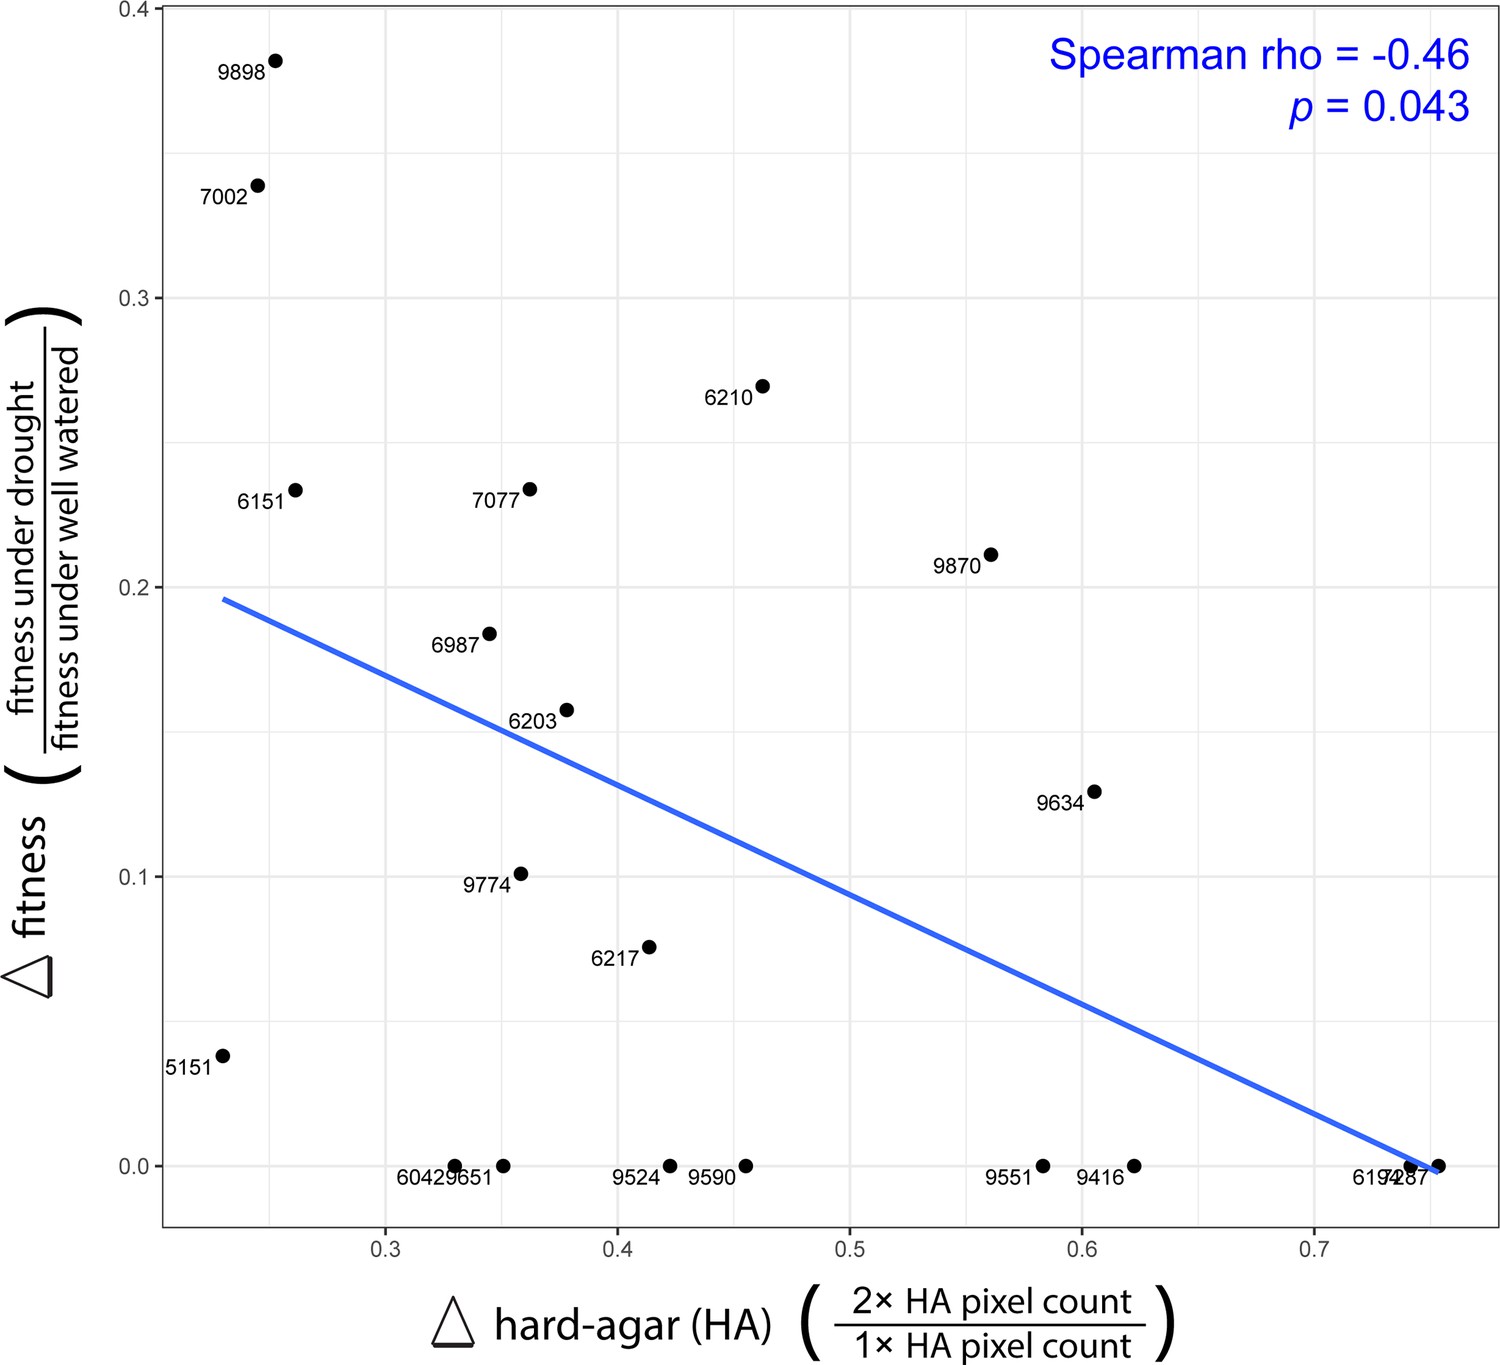
Associating hard agar’s (HA) impact on shoot size with plant fitness.
Comparing the impact HA treatment has on shoot size of 20 different Arabidopsis accessions to the change in their fitness found under drought conditions in the field, as reported in Exposito-Alonso et al., 2019.
Figure 2—figure supplement 7
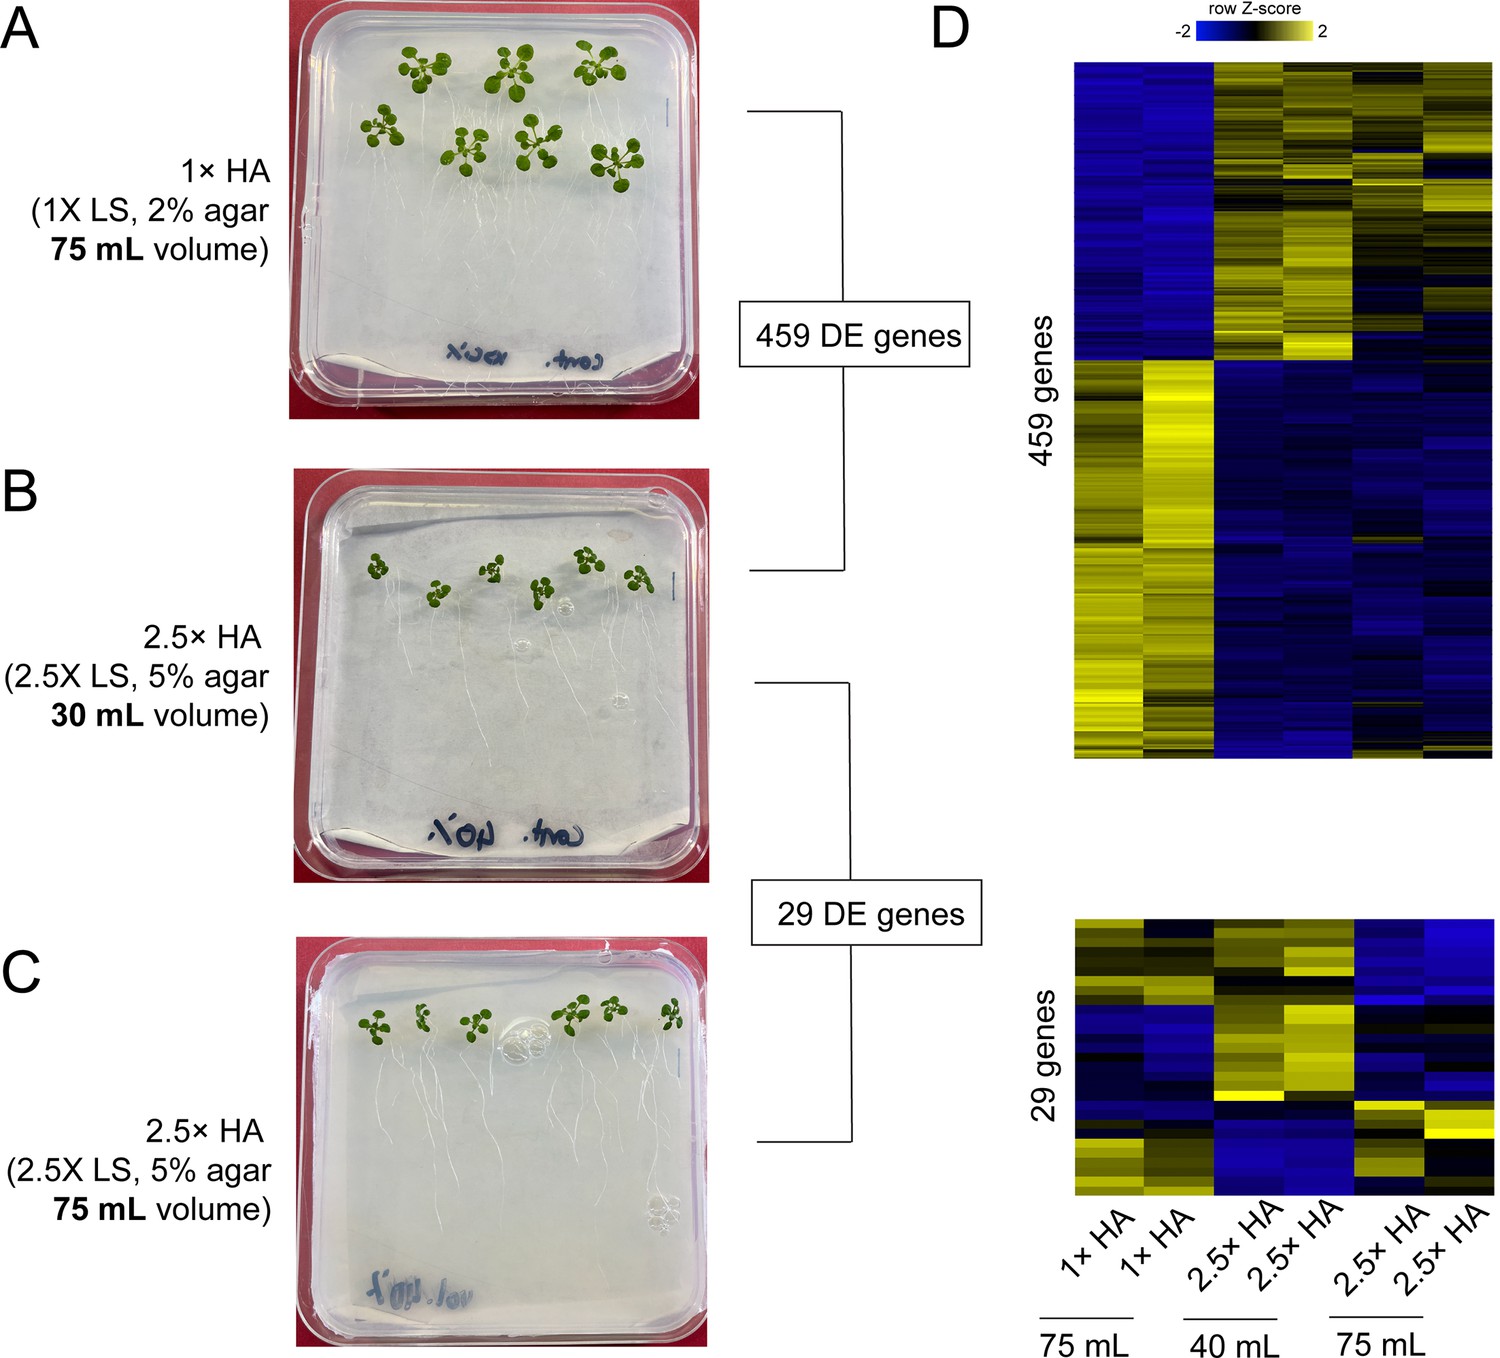
The volume of hard agar (HA) has minimal impact on gene expression.
Image of Arabidopsis seedlings grown on either (A) 75 mL of 1× HA, (B) 30 mL of 2.5× HA, or (C) 75 mL of 2.5× HA. Number of genes found differentially expressed is reported for comparisons (A) and (B), as well as (B) and (C) (DESeq, adj. p<0.01). Of the 29 genes found differentially expressed between (B) and (C), 13 are found in comparison (A) and (B). (E) Heatmap of genes found differentially expressed in either comparison.
Additional files
-
Supplementary file 1
Plant physiological measurements.
- https://cdn.elifesciences.org/articles/84747/elife-84747-supp1-v1.xlsx
-
Supplementary file 2
Differentially expressed genes and normalized counts in hard agar (HA), polyethylene glycol (PEG), mannitol, NaCl, or vermiculite drying experiments.
- https://cdn.elifesciences.org/articles/84747/elife-84747-supp2-v1.xlsx
-
Supplementary file 3
Vermiculite drying assay measurements.
- https://cdn.elifesciences.org/articles/84747/elife-84747-supp3-v1.xlsx
-
Supplementary file 4
Gene Ontology (GO) Term enrichment of differentially expressed genes.
- https://cdn.elifesciences.org/articles/84747/elife-84747-supp4-v1.xlsx
-
Supplementary file 5
Shoot area of seedlings grown under different agar and nutrient concentrations.
- https://cdn.elifesciences.org/articles/84747/elife-84747-supp5-v1.xlsx
-
Supplementary file 6
Differentially expressed genes and normalized counts in response to changes in nutrient or agar concentration.
- https://cdn.elifesciences.org/articles/84747/elife-84747-supp6-v1.xlsx
-
Supplementary file 7
Shoot area of different Arabidopsis accessions grown on hard agar (HA) media.
- https://cdn.elifesciences.org/articles/84747/elife-84747-supp7-v1.xlsx
-
MDAR checklist
- https://cdn.elifesciences.org/articles/84747/elife-84747-mdarchecklist1-v1.docx
Download links
A two-part list of links to download the article, or parts of the article, in various formats.
Downloads (link to download the article as PDF)
Open citations (links to open the citations from this article in various online reference manager services)
Cite this article (links to download the citations from this article in formats compatible with various reference manager tools)
Arabidopsis transcriptome responses to low water potential using high-throughput plate assays
eLife 12:RP84747.
https://doi.org/10.7554/eLife.84747.3


