Interactions between circuit architecture and plasticity in a closed-loop cerebellar system
- Zuckerman Mind Brain Behavior Institute, Columbia University, United States
- Department of Neurobiology, Stanford University, United States
- Center for Neuroscience, Department of Neurobiology, Physiology and Behavior, University of California, Davis, United States
- Department of Ophthalmology and Vision Science, University of California, Davis, United States
Figures
Figure 1
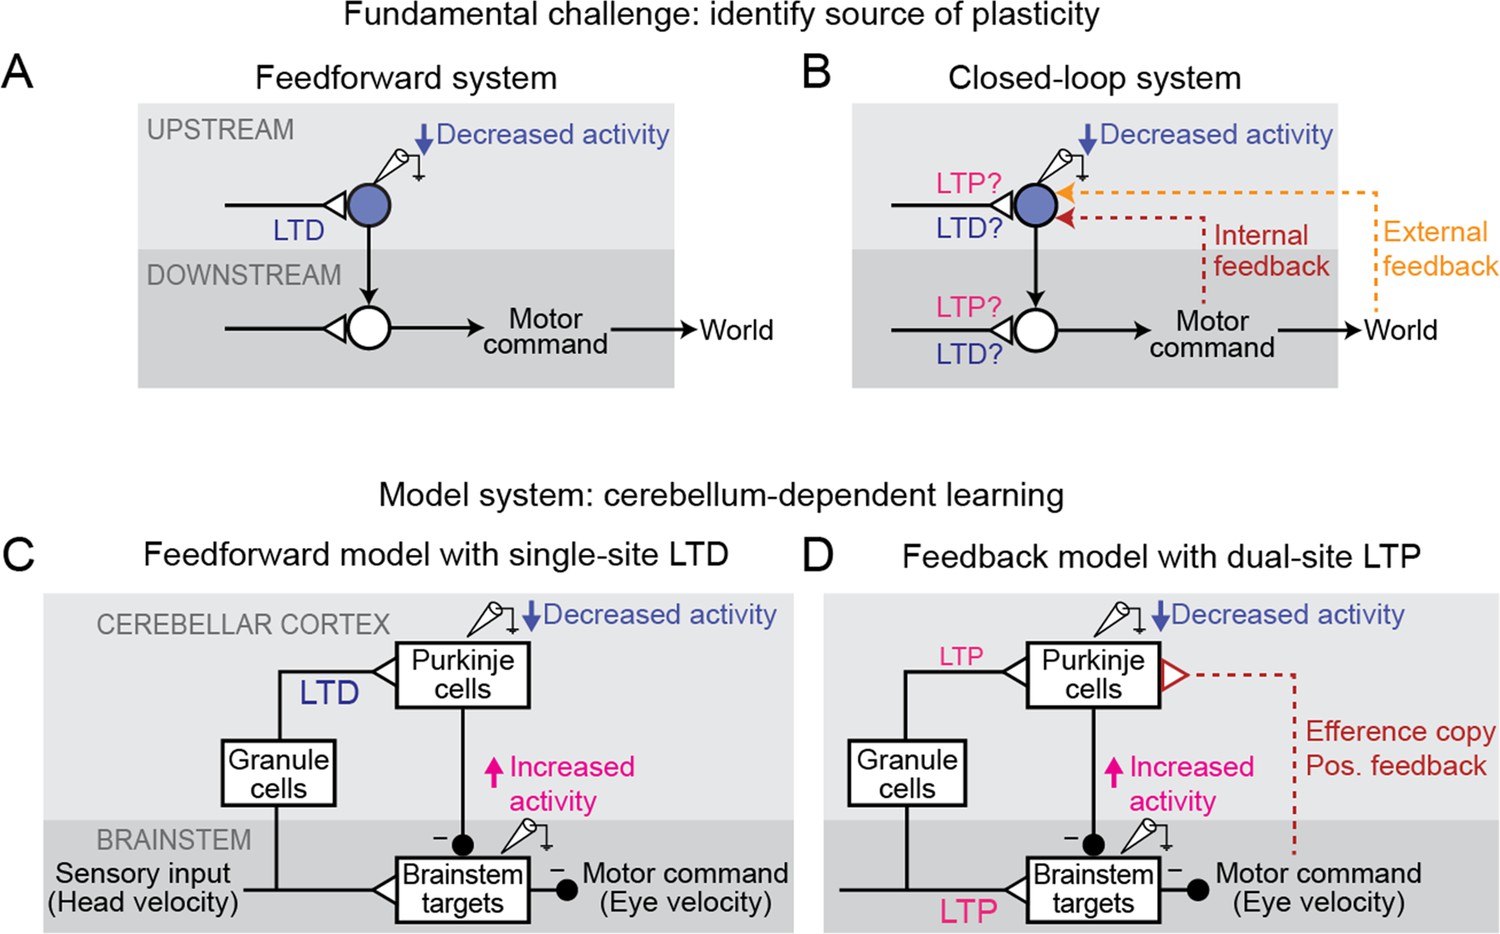
Feedback can obscure plasticity in neural systems.
(A) Purely feedforward circuit. A decreased neural response to a stimulus after learning can be attributed to LTD of excitatory synapses (or equivalently, LTP of inhibitory synapses) upstream of the recorded neuron. Triangles, plastic synapses. (B) Recurrent circuit, with both internal and external feedback. The same decreased neural response can no longer be definitively attributed to plasticity at nominally upstream sites. Instead, plasticity at inputs to a second site that is a postsynaptic target of the recorded neuron, and thus appears to be downstream, may feed back to affect the recorded neuron’s activity. Such ‘downstream’ plasticity may mask the effects of ‘upstream’ plasticity. (C) Feedforward circuit proposed by the Marr-Albus-Ito model to support cerebellum-dependent motor learning. Before learning, vestibular (head velocity) inputs to the brainstem drive compensatory eye movements that are directed opposite to rotation of the head. After learning, LTD of vestibular inputs to Purkinje cells reduces inhibition onto brainstem neurons, increasing eye movement amplitude. (D) Simplified version of the feedback circuit proposed by the Miles-Lisberger model. After learning, LTP of vestibular inputs to the brainstem drives larger contraversive eye movements during the VOR in the dark. Efference copy of these eye velocity commands (red pathway) leads to decreased Purkinje cell activity, despite LTP of the vestibular input to Purkinje cells.
Figure 2
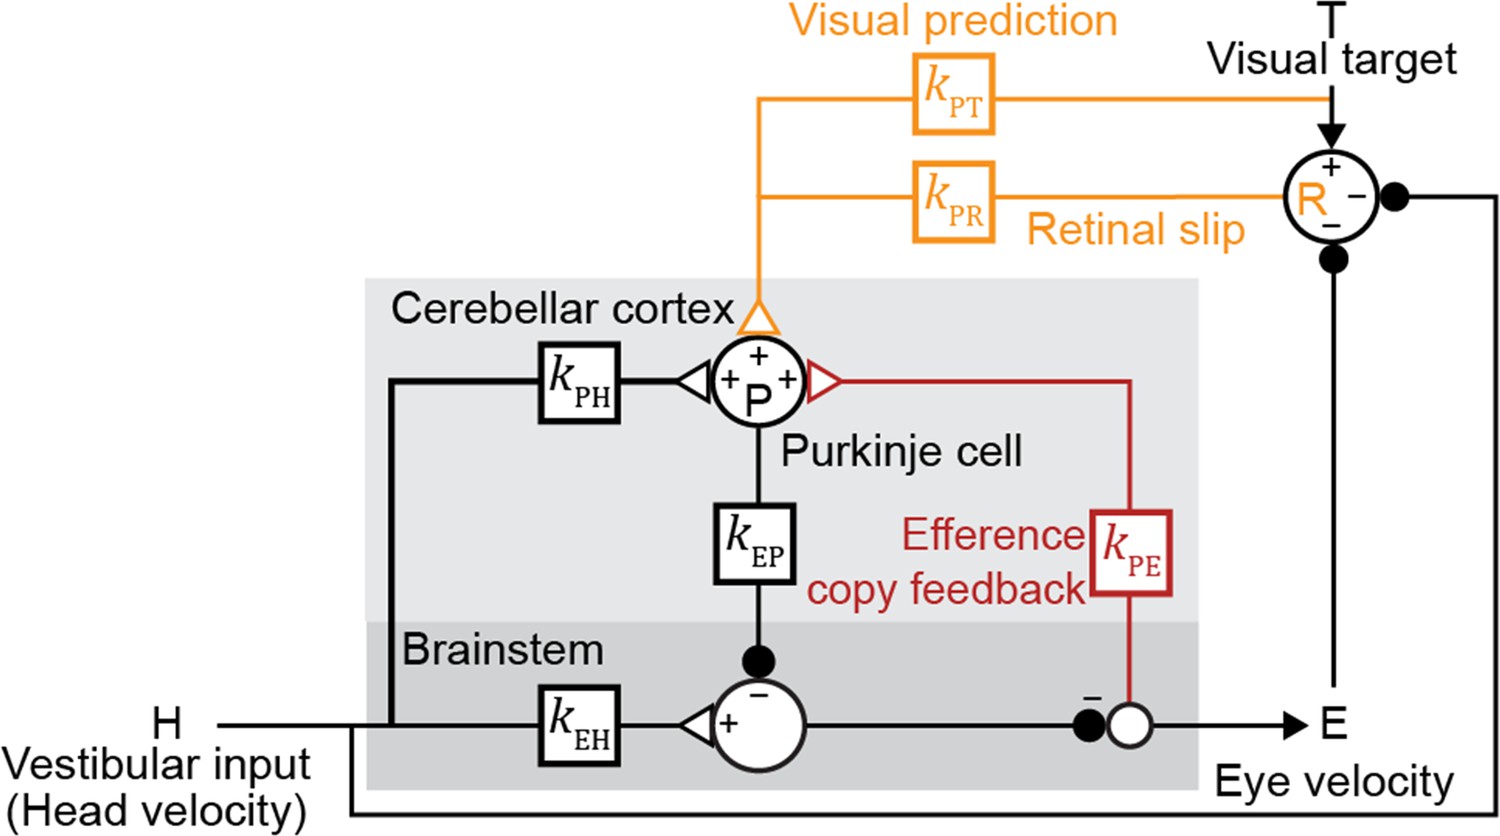
Linear filter circuit model.
Signal transformations between different nodes of the circuit are modeled as linear filters kXY (boxes). Purkinje cell population firing rate (P) is driven by vestibular stimulation (head velocity, H) through kPH, by efference copy of eye movement commands (E) through kPE (red), and by visual signals through kPR (orange, retinal slip velocity) and kPT (orange, predicted visual target velocity). Eye velocity is driven by a direct pathway carrying head velocity input to the brainstem (kEH) combined with inhibition from Purkinje cells (kEP). The neural circuits between the brainstem and the eye muscles, which compensate for the dynamics of the eye plant, are implicitly included in the filters kEP and kEH. For each fixed strength of kPE, all other filters were fit to the data.
Figure 3 with 2 supplements
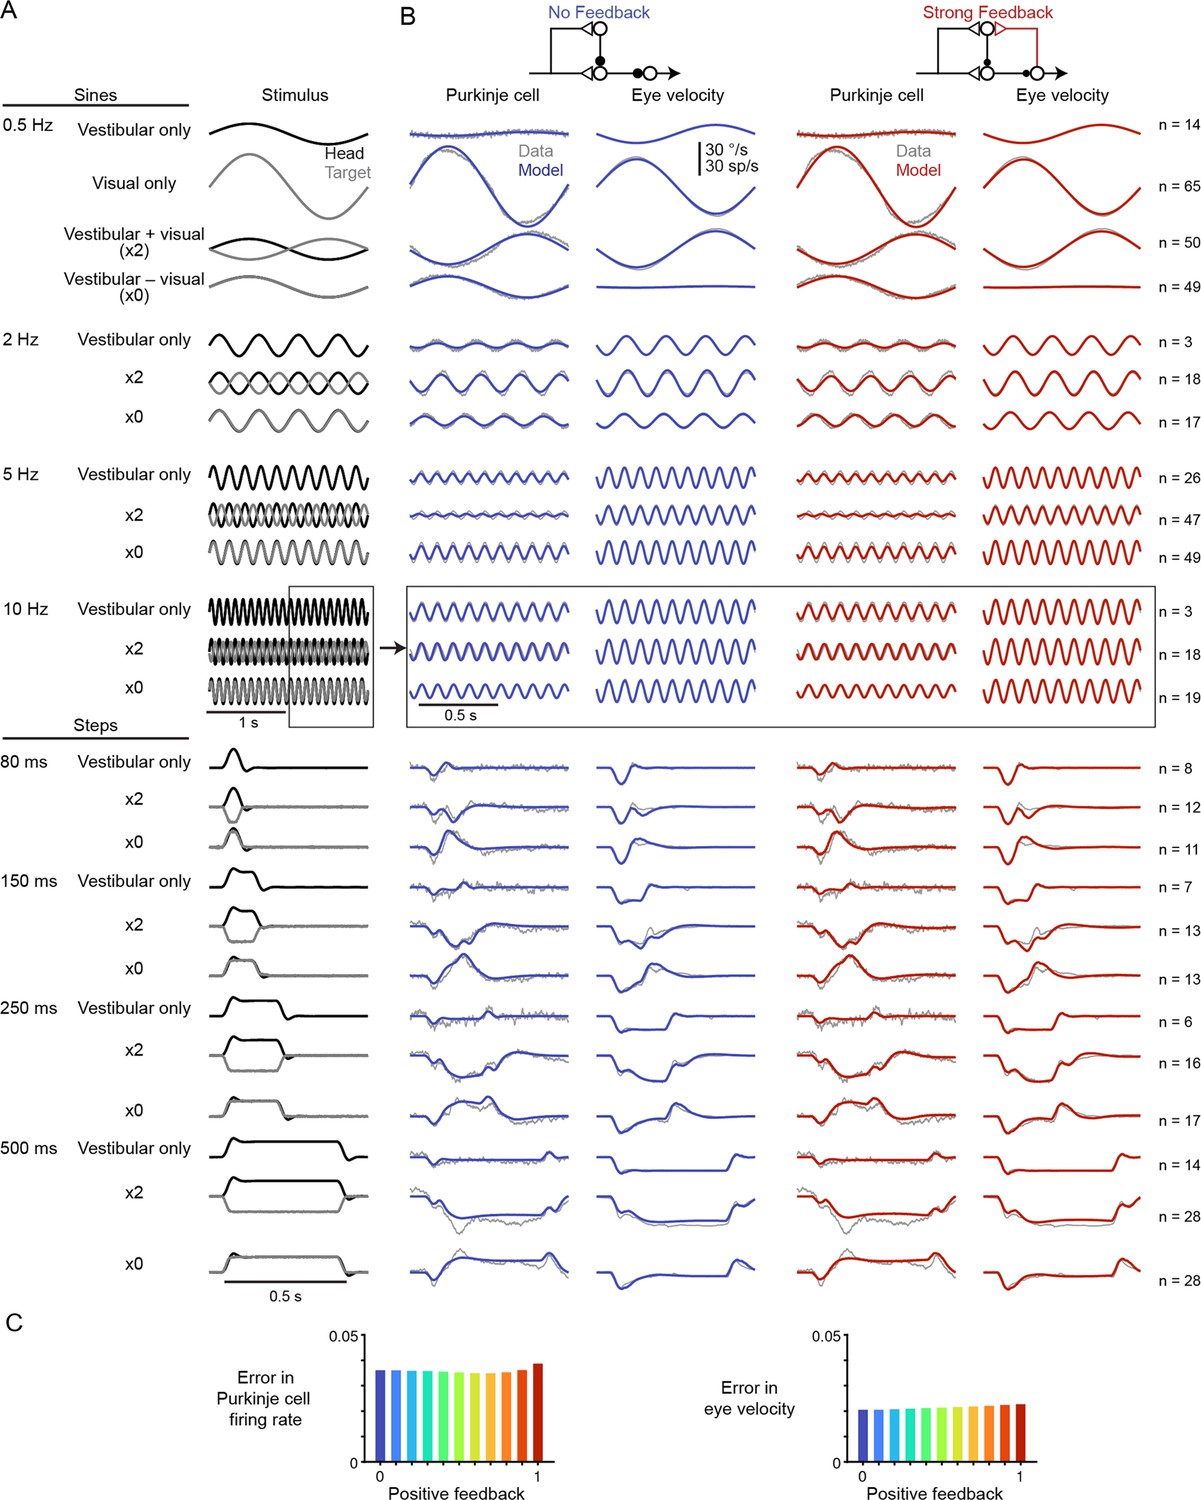
Models with or without efference copy feedback fit neural and behavioral data before learning.
(A) Vestibular (‘Head’, black) and visual (‘Target’, gray) stimuli for each behavioral condition. Conditions consisted of vestibular input alone (‘Vestibular only’, i.e. VOR in the dark), visual input alone (‘Visual only’, i.e. smooth pursuit), vestibular input paired with oppositely directed visual input such that eye movements twice as large as normal were required to stabilize the image (‘x2’), and vestibular input paired with visual input in the same direction such that eye movements must be eliminated to stabilize the image (‘x0’, or VOR cancellation). Ipsiversive head and eye movements are plotted as positive values. (B) Purkinje cell firing rate and eye velocity measured experimentally (gray) and predicted by the No Feedback model (blue) or the Strong Feedback model (red). Thickness of experimental (gray) trace indicates standard error of the mean. (C) Normalized root mean squared error of fits to Purkinje cell firing rate (left) and eye velocity (right) for all models.
Figure 3—figure supplement 1

Model response to occlusion of a moving visual target.
Target occlusion was simulated in each model by providing a step in target velocity as input, and once steady-state smooth pursuit was reached, removing all visual input. Efference copy feedback in the cerebellum has been proposed to be critical for maintaining ongoing smooth pursuit during steady-state tracking when retinal slip is minimal (Lisberger, 1994a), when the target is artificially stabilized on the retina (Stone and Lisberger, 1990), or when the eyes continue tracking a moving target that transiently disappears from view behind an occluder (Becker and Fuchs, 1985; Leung and Kettner, 1997; Stone and Lisberger, 1990). During transient target disappearance, humans and nonhuman primates continue tracking the invisible target with eye velocity between 40 and 100% of baseline (Becker and Fuchs, 1985; Bennett and Barnes, 2003; Churchland et al., 2003; Madelain and Krauzlis, 2003). Both the No Feedback and Strong Feedback models displayed maintained pursuit velocity during simulated target occlusion, with eye velocity perfectly maintained in the Strong Feedback model and partially maintained in the No Feedback model.
Figure 3—figure supplement 2

Model error for individual behavioral conditions.
Purkinje cell error (top) and eye velocity error (bottom), for the No Feedback (blue) and Strong Feedback (red) models, for each stimulus condition shown in Figure 3.
Figure 4
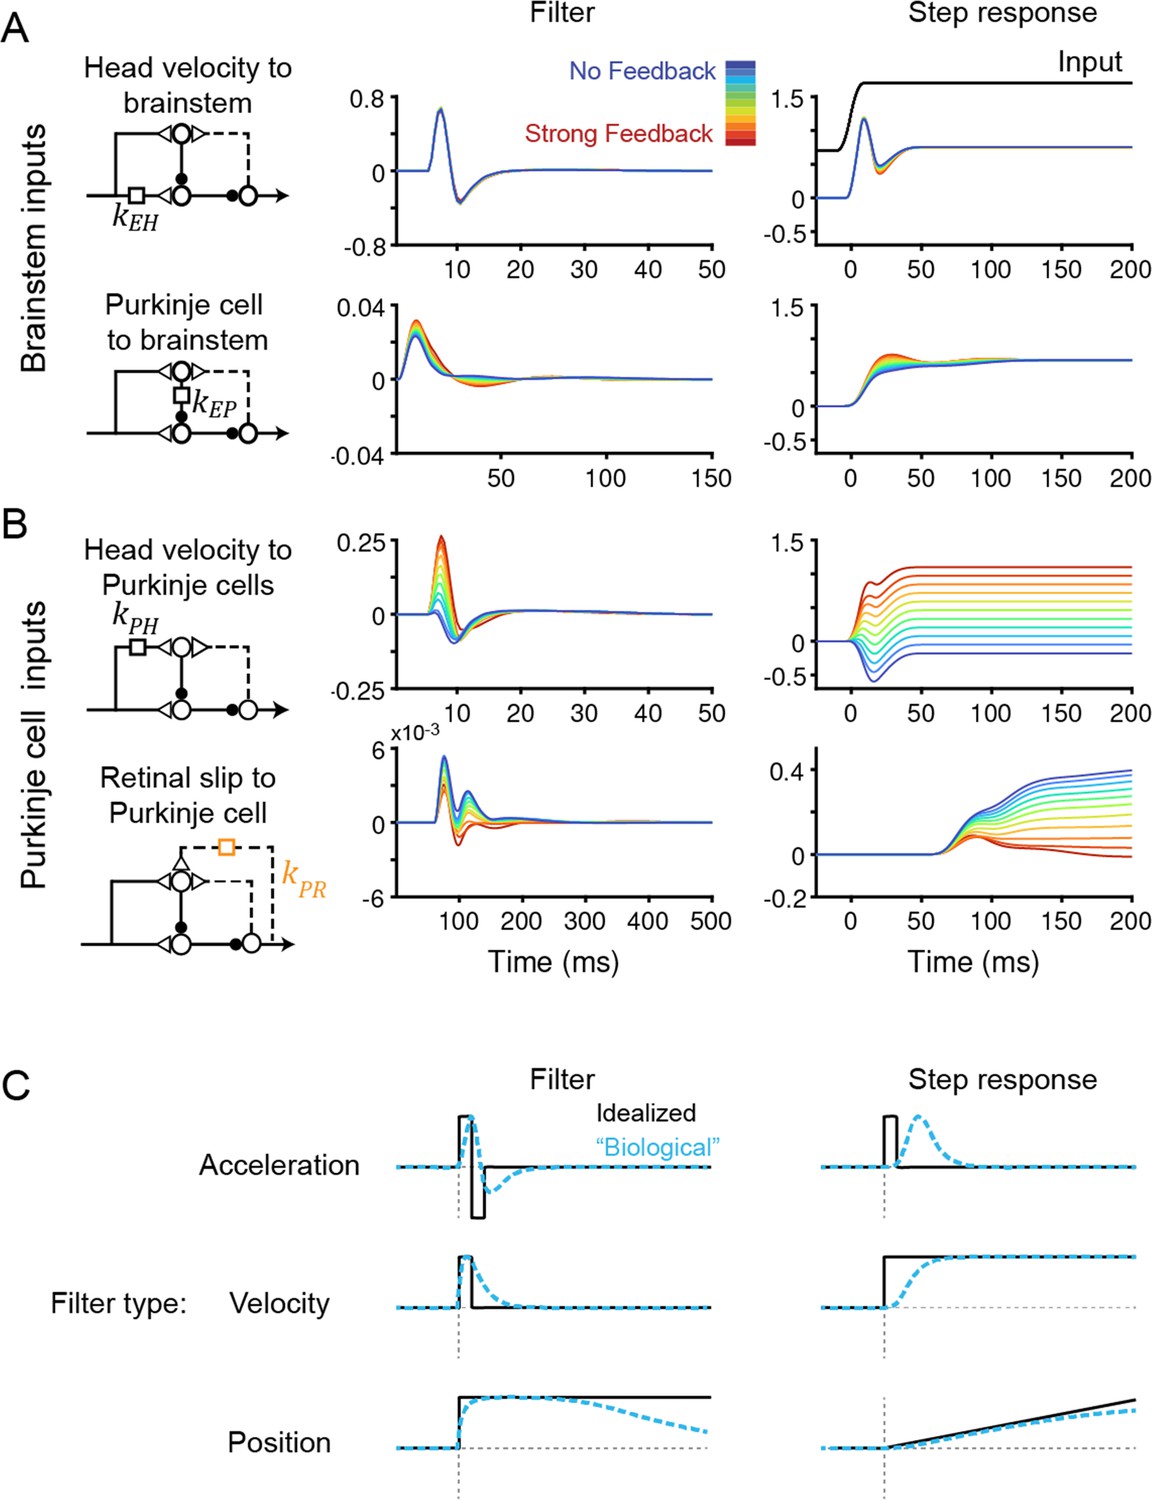
Temporal filters before learning are well-constrained for inputs to the brainstem, but not to Purkinje cells.
(A) Filters conveying head velocity input (top, kEH) and Purkinje cell activity (bottom, kEP) to the brainstem for all models, ranging from No Feedback (blue) to Strong Feedback (red). The actual filter shape (left) and the response of the filter to a smoothed ‘step’ input (right) are shown. Following Equation 1 (Materials and methods), positive weights for kEH cause oppositely directed (negative) changes in eye velocity. Most filters for kEH are hidden beneath the trace for the No Feedback model. Units for step responses: °/s eye per °/s head (top), °/s eye per sp/s (bottom). For the linear filters, these units are multiplied by s–1. (B) Filters conveying head velocity (top, kPH) and retinal slip (bottom, kPR) input to Purkinje cells, as in (A). The filter conveying efference copy input to Purkinje cells (kPE) was not fit to data and therefore is not shown here; it is given by an exponential filter of time constant 3 ms, with amplitude scaled according to the stated strength of efference copy feedback (see Materials and methods). Units for step responses: sp/s per °/s head (top), sp/s per °/s retinal slip (bottom). (C) Schematic of idealized (black) and “biological” (blue) linear temporal filters and their corresponding step responses. Acceleration-like filters perform differentiation, velocity-like filters only change gain, and position-like filters perform leaky integration.
Figure 5
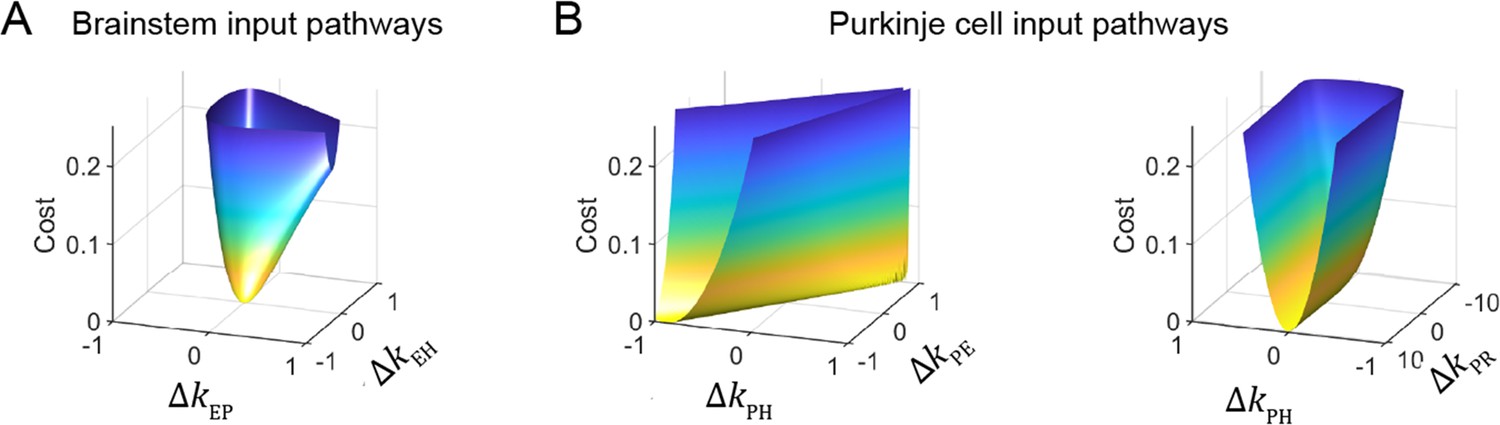
Cost function landscape illustrates degeneracy of input pathways to Purkinje cells, but not to the brainstem.
Degeneracy in the VOR circuit model fits, illustrated using a simplified model with merged retinal slip and visual prediction pathways (see Materials and methods). Cost is defined as the squared error between model output and experimental data. (A) Cost function landscape for the brainstem pathways (kEP and kEH) has a single, well-defined minimum defining the best-fit parameter values. ΔkXY indicates deviations from best-fit values of filter responses at steady state (see Materials and methods). (B) Cost function landscape for the Purkinje cell input pathways (kPH, kPE, and kPR) is degenerate, as reflected by the flat valleys of equally well-fit solutions. For each value of the input variables shown (kPH and kPE, left; kPH and kPR, right) the value of the third variable (kPR and kPE, respectively) was adjusted to minimize the cost. Note that the sharp increase in cost for ΔkPR occurs where kPR approaches 0, at which point there is no retinal slip input to initiate pursuit behavior.
Figure 6 with 4 supplements
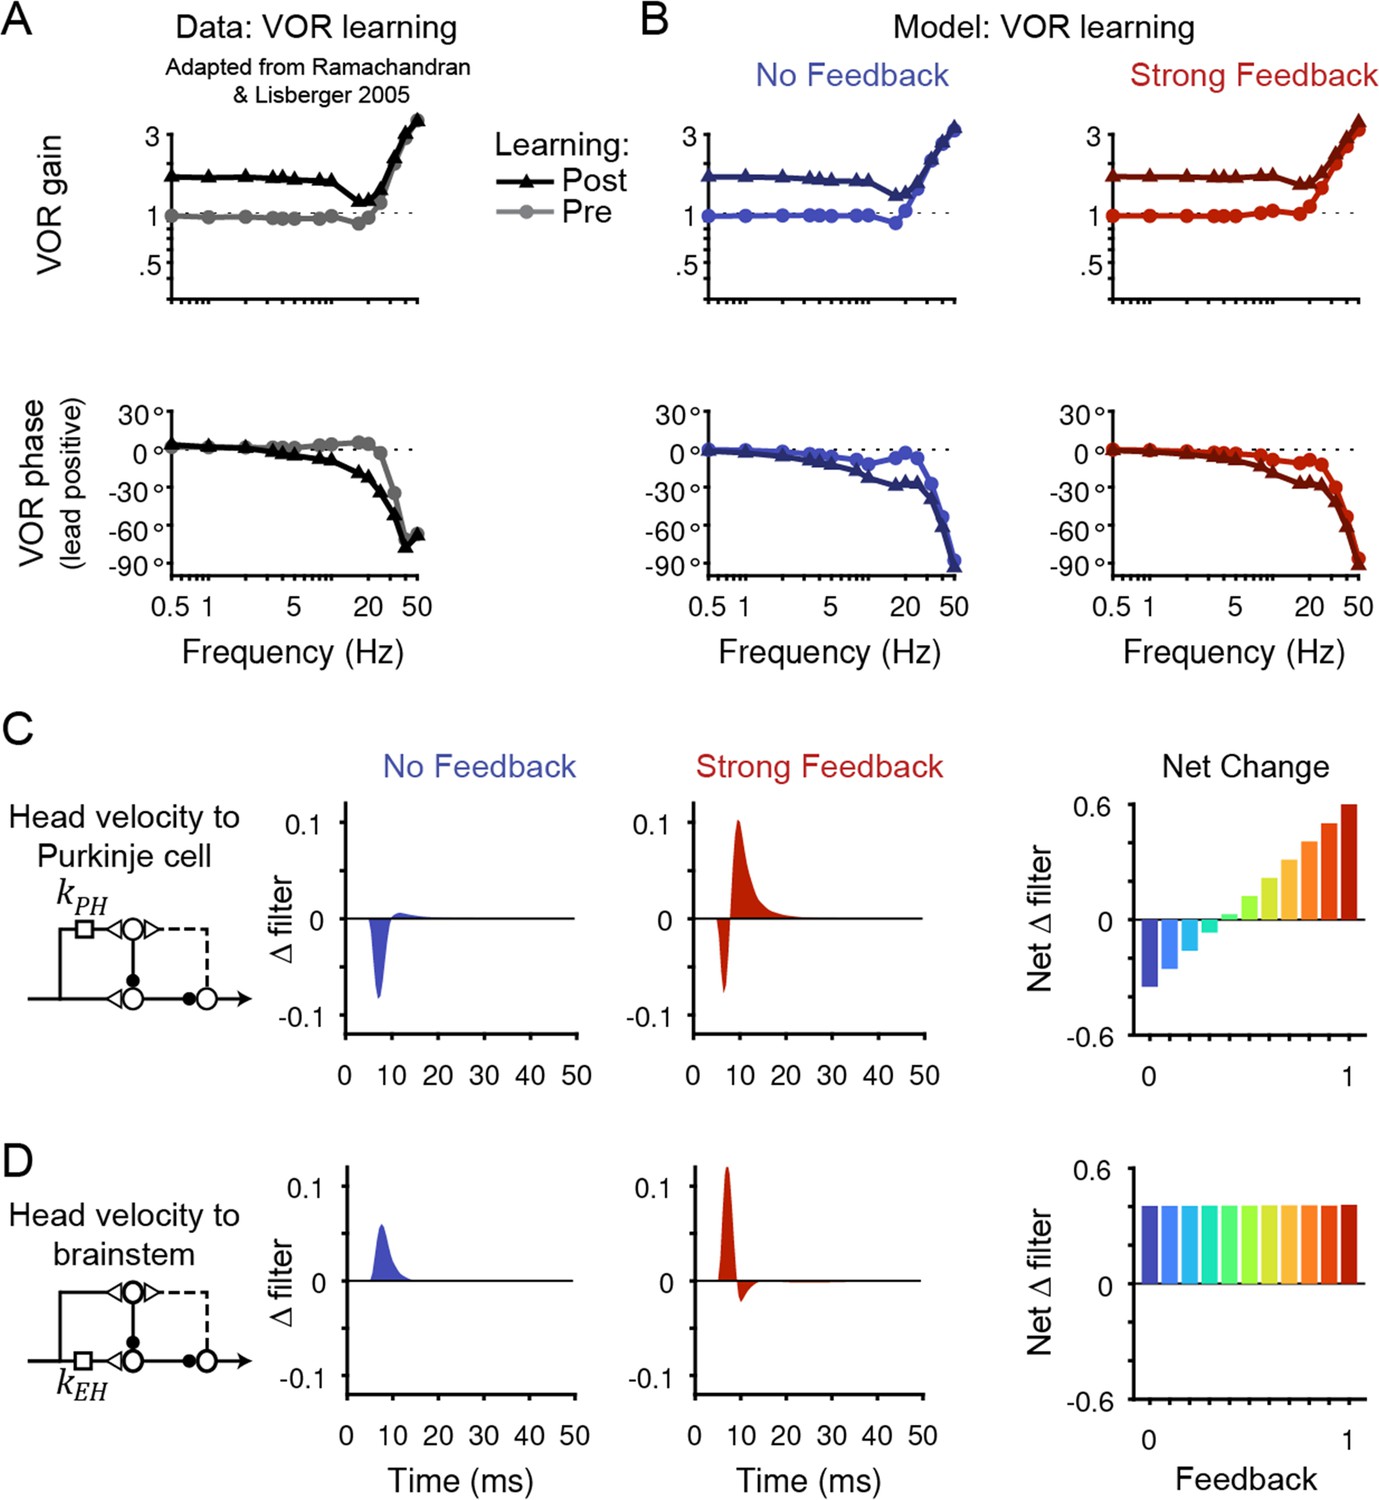
Circuit changes underlying learned changes in behavior.
(A,B) Monkey (A) and model (B) eye velocity responses to sinusoidal vestibular input before (gray/light colors, circles) and after (black/dark colors, triangles) VOR learning. Behavior is quantified as the gain and phase of the eye relative to the head (0° phase represents the eye moving exactly opposite to the head). Note that ‘VOR gain’ is a normalized measure of eye movement amplitude, and is not to be confused with feedback gain. Data are adapted from Figure 4 of Ramachandran and Lisberger, 2005. (C) Left, Dynamic change in the filter carrying head velocity input to Purkinje cells (kPH) after learned increases in the VOR, for the No Feedback (blue) and Strong Feedback (red) models. Traces represent the change in filter strength after learning, rather than the absolute filter shape. Right, Net change in the filter kPH, calculated by numerically integrating the change in filter shape, for all models. Negative values indicate net depression and positive values indicate net potentiation. (D) Same as in (C) but for the filter carrying head velocity input to the brainstem (kEH). Note that the differences in filter shape between the No Feedback and Strong Feedback models in (D) largely reflect high temporal frequencies that were not well constrained by the experiments (see Materials and methods). Changes in filter shapes for intermediate feedback values and for learned decreases in VOR gain are shown in Figure 6—figure supplement 2.
Figure 6—figure supplement 1
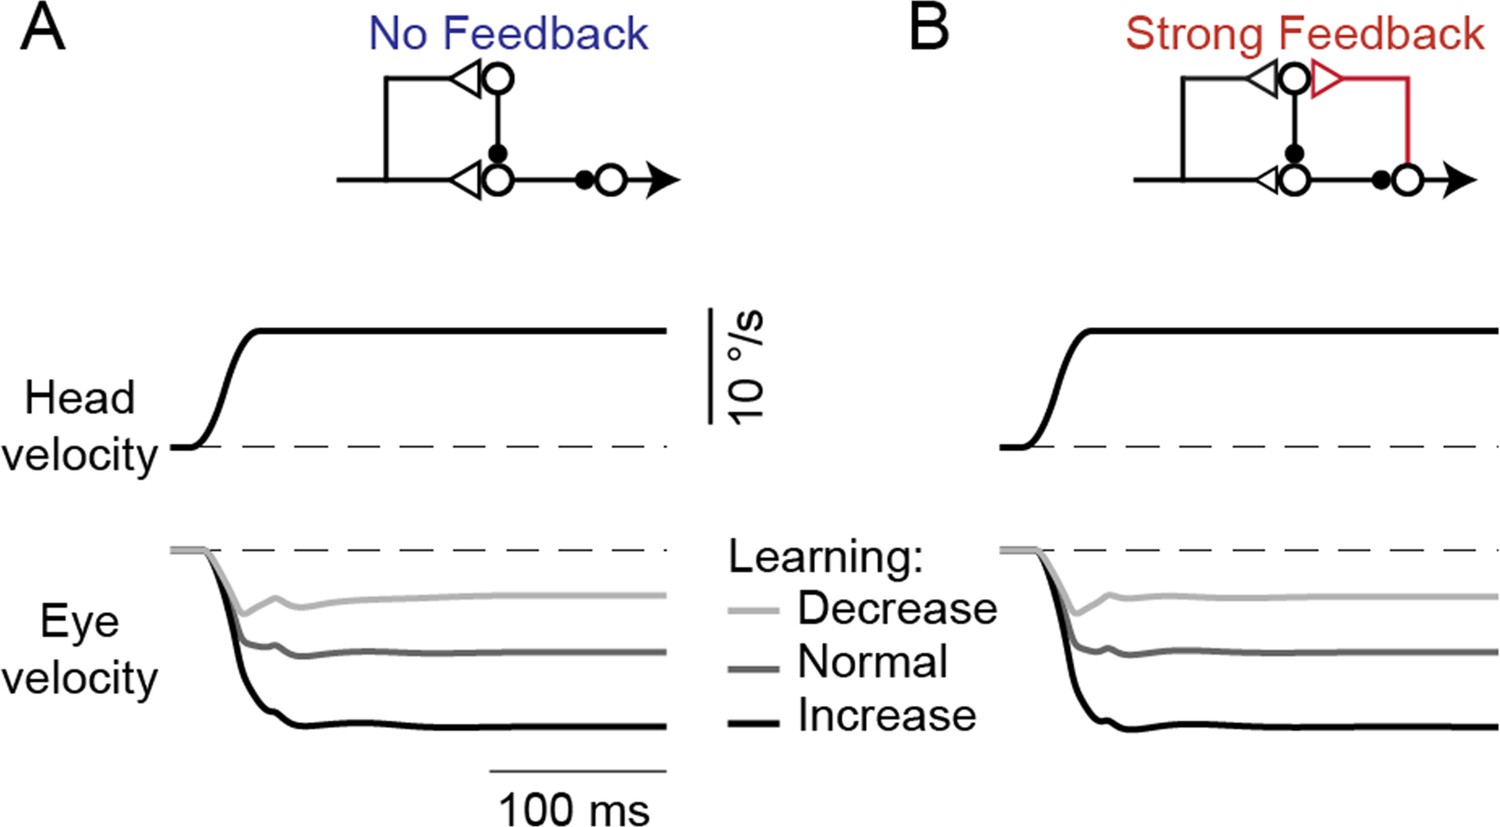
Model response to steps in head velocity after VOR learning.
(A,B) Model eye velocity responses to steps in vestibular input (VOR in the dark), before and after learning in the No Feedback model (A) and the Strong Feedback model (B), both before learning (‘Normal’) and after learned increases or decreases in VOR gain. Note the initial overlap of the eye velocity traces that transitions to well-separated sustained responses, as predicted by the lack of change of VOR responses at high frequencies seen in Figure 6B and previous studies (Figure 6A; Lisberger and Pavelko, 1986; Ramachandran and Lisberger, 2005).
Figure 6—figure supplement 2
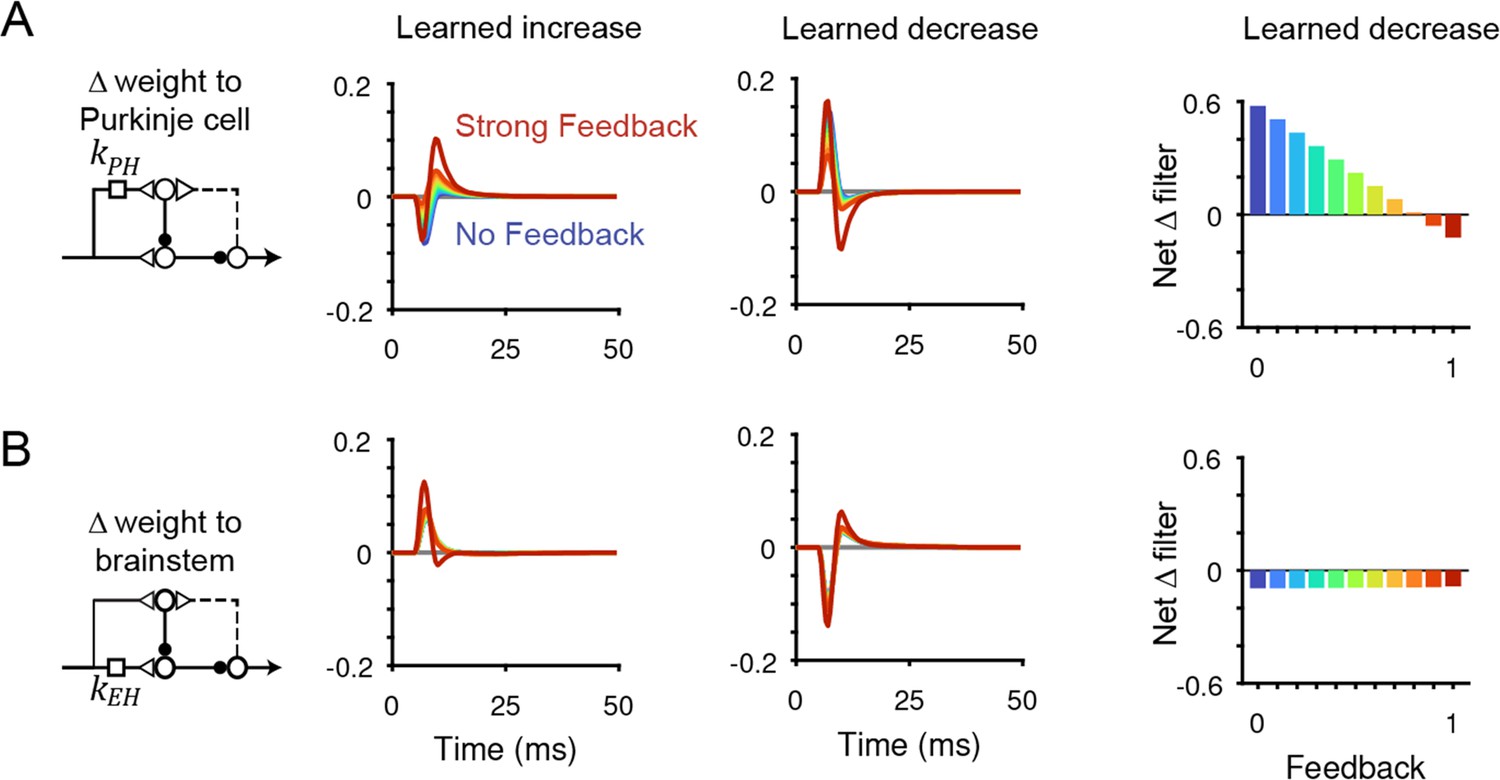
Changes in filter strength after VOR learning for all models.
(A) Dynamic changes in the filter kPH after learned increases (left) or decreases (center) in VOR gain. Right, net change in filter strength after learned decreases in VOR gain. (B) Same as (A) but for the filter kEH.
Figure 6—figure supplement 3

Changes in neural activity after learning when the direction of plasticity in the cerebellar cortex is restricted.
(A) Purkinje cell modulation during the VOR in the dark in the No Feedback model when net depression (‘LTD’) was blocked. To computationally block depression, the net change in filter kPH was restricted to be positive (‘No net LTD’). In this condition, Purkinje cell activity no longer decreases after learned increases in VOR gain (compare to Figure 6—figure supplement 4A). (B) Purkinje cell modulation during VOR cancellation in the No Feedback model when net depression was blocked. The paradoxical increase in Purkinje cell modulation during VOR cancellation after learning still occurs. (C) Same as (A) but for the Strong Feedback model with net potentiation (‘LTP’) blocked. For this model, the change in Purkinje cell modulation during the VOR does not require potentiation. (D) Same as (B) but for the Strong Feedback model. The paradoxical increase in Purkinje cell activity during VOR cancellation after learning no longer occurs.
Figure 6—figure supplement 4
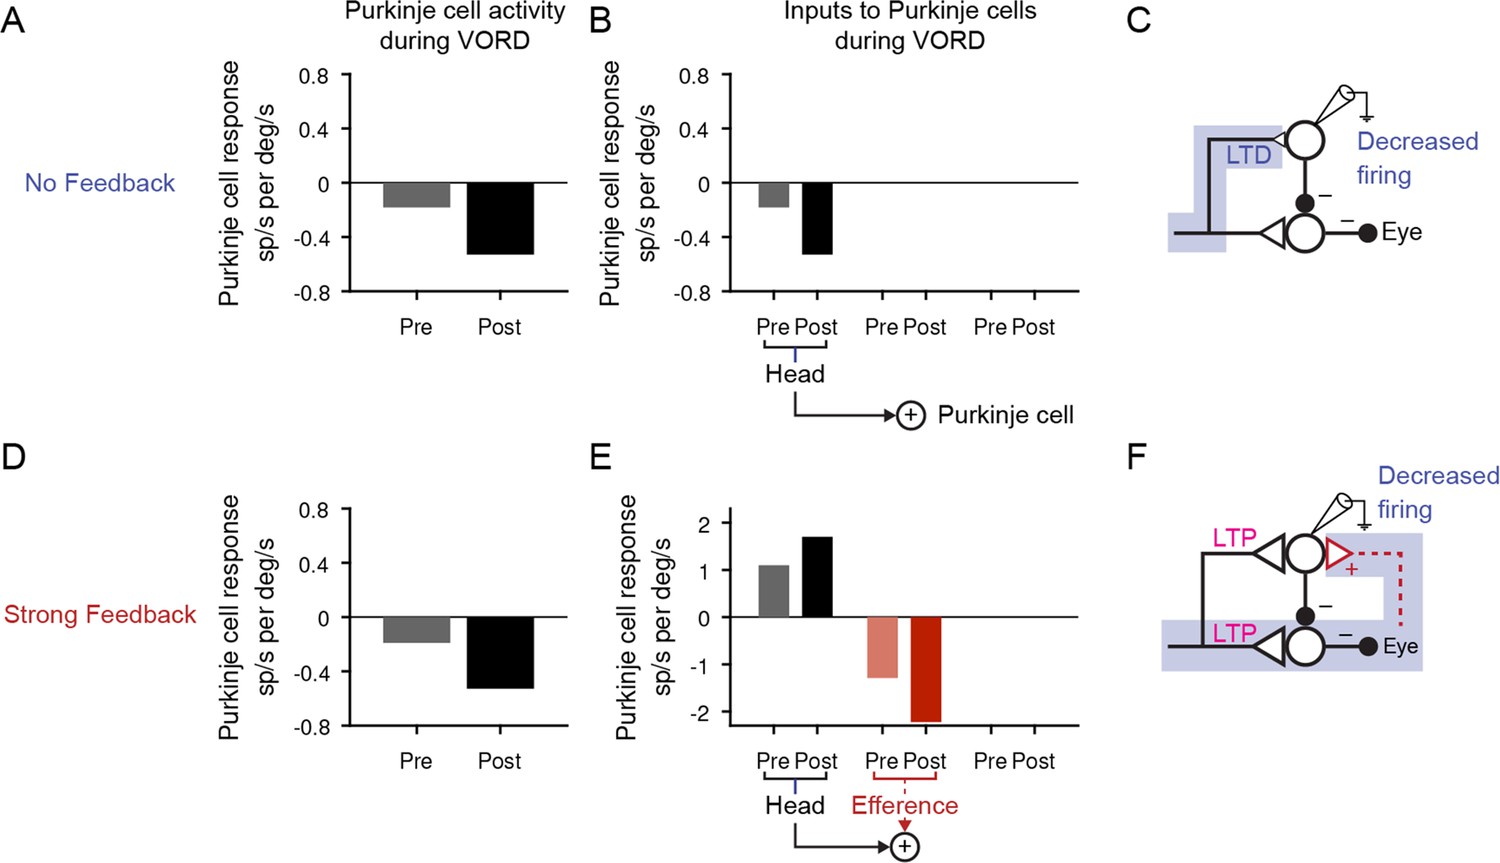
Changes in Purkinje cell activity during the VOR in the dark.
(A) Purkinje cell firing rate response during the VOR in the dark, before (‘Pre’) and after simulated learned increases (‘Post’) in the gain of the VOR for the No Feedback model, during 0.5 Hz vestibular input. Purkinje cell response was plotted as negative if the neural activity was >90° out of phase with the ipsiversive stimulus. Compare to results in (Watanabe, 1985; their Figure 6; Lisberger et al., 1994b) (their Figure 10); (Hirata and Highstein, 2001; their Figure 3), and (Blazquez et al., 2003) (their Figure 2C). (B) Source of Purkinje cell modulation during the VOR for the No Feedback model. Each bar represents the amplitude of a 0.5 Hz sinusoidal signal as it reaches the Purkinje cell after passing through the relevant filter in spikes/s, normalized to the amplitude of the head velocity stimulus in °/s. The only input to Purkinje cells in this condition is the head velocity pathway. (C) Schematic highlighting the path responsible for the observed change in Purkinje cell firing. In the No Feedback model, the observed change in neural activity is due to plasticity in feedforward pathways. (D) Same as (A) for the Strong Feedback model. (E) Same as (B) for the Strong Feedback model. The potentiation in the head velocity input pathway is counteracted by the large decrease in the efference copy pathway input to the Purkinje cells. (F) In the Strong Feedback model, the observed decrease in Purkinje cell activity is driven by plasticity in the brainstem, fed back to Purkinje cells through the efference copy pathway.
Figure 7 with 1 supplement
Explanation for changes in neural activity during VOR cancellation after learning.
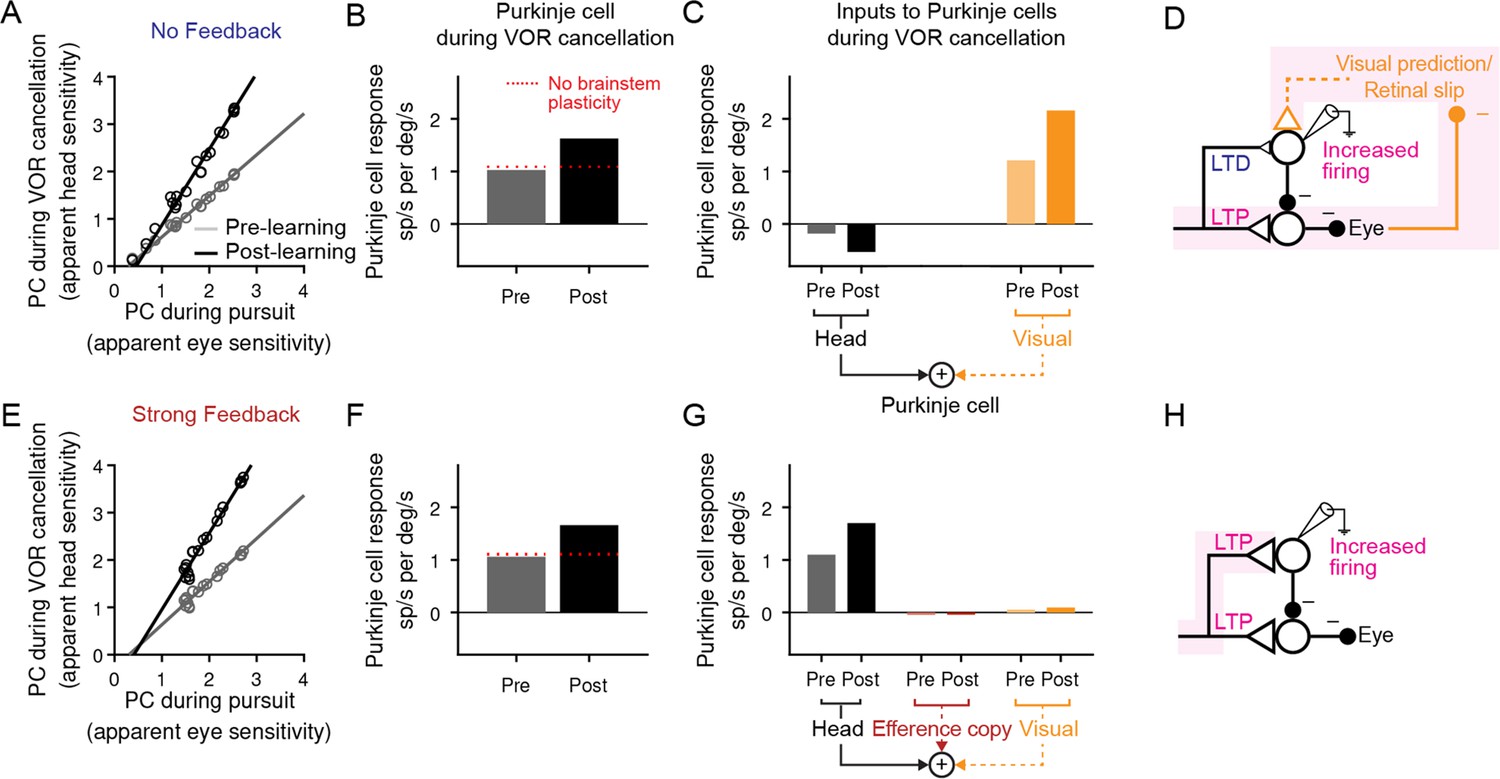
(A) Response of a population of simulated Purkinje cells during VOR cancellation compared to response during visual pursuit before (Pre) and after (Post) VOR learning for the No Feedback model. Values shown are in units of sp/s per °/s stimulus amplitude. Compare to Figure 13 of Lisberger et al., 1994b. (B) Average response of Purkinje cell population in (A) during VOR cancellation. Red dashed lines, model results with brainstem plasticity blocked. (C) Inputs to Purkinje cells during VOR cancellation. The visual contribution represents the sum of both the retinal slip and visual prediction pathways. For the No Feedback model, the increase in input through the visual pathway after learning overshadows the decrease in input due to depression in the head velocity pathway. (D) Schematic illustrating that in the No Feedback model, the observed increase in Purkinje cell activity is due to negative feedback from vision. (E, F, G) Same as (A, B, C) for the Strong Feedback model. (H) In the Strong Feedback model, the observed increase in Purkinje cell activity is due to potentiation of vestibular inputs to Purkinje cells. Visual and efference copy pathways not shown because their contributions to Purkinje cell activity was minimal.
Figure 7—figure supplement 1

Explanation for changes in Purkinje cell activity during VOR cancellation in a model without a visual prediction pathway.
Paradoxical changes during VOR cancellation are still reproduced by the No Feedback model without a visual prediction pathway. See legend for Figure 7A, B and C.
Figure 8 with 1 supplement
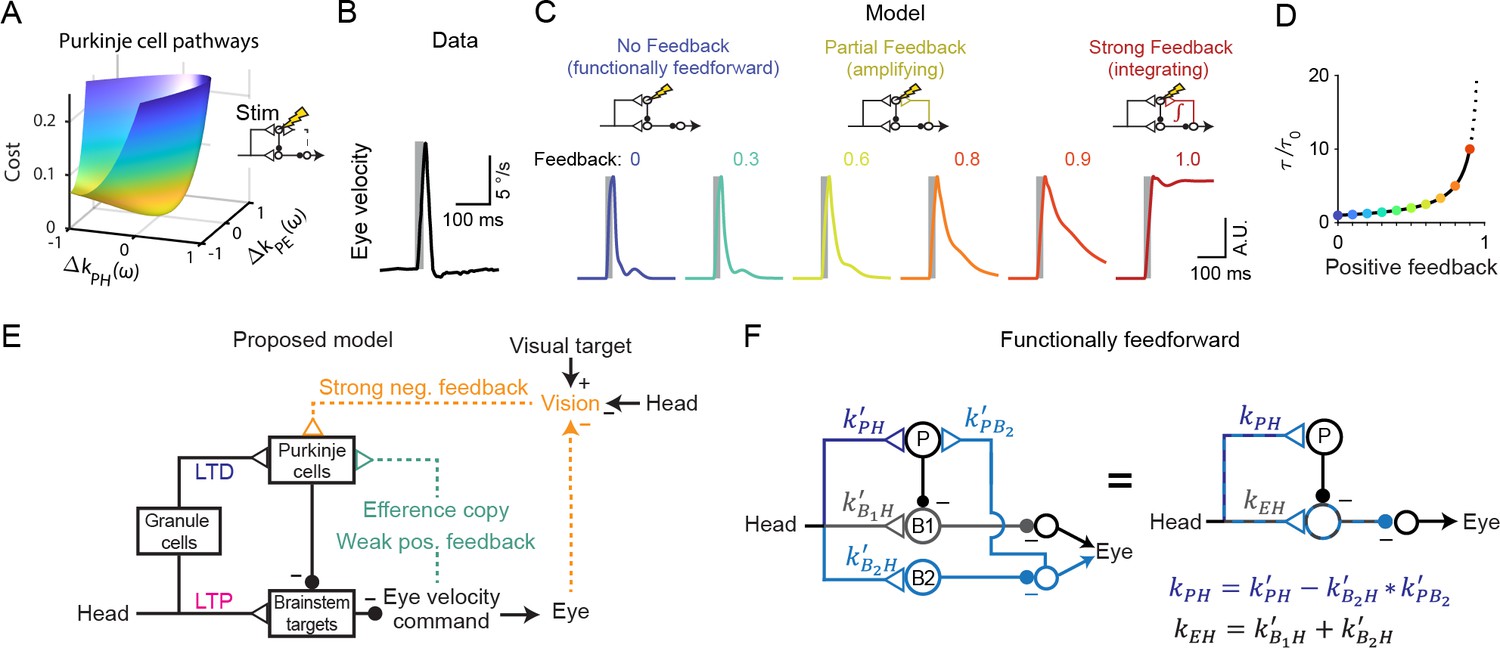
Circuit perturbations suggest functionally weak efference copy feedback.
(A) Cost function landscape for the simplified model when a Purkinje cell stimulation condition is added. Compare to Figure 5B. (B) Monkey eye velocity in response to pulses of electrical stimulation in the Purkinje cell layer of the floccular complex. Data are adapted from Figure 1B of Lisberger, 1994a. (C) Model eye velocity responses to brief (25 ms) Purkinje cell stimulation. (D) Increase in system time constant due to positive feedback, relative to the time constant without any positive feedback (). (E) Proposed model reconciling previous experimental results. Efference copy feedback is relatively weak, and both net depression in the cerebellar cortex and net potentiation in the brainstem pathway can contribute to learned increases in the VOR. In combination with brainstem plasticity, visual feedback drives the paradoxical increase in Purkinje cell activity during VOR cancellation after learning. (F) Feedforward architecture can exist despite anatomical feedback pathways between brain regions. Left, a circuit that is functionally feedforward despite anatomical projections that convey an efference copy from a population of brainstem neurons (B2) to the Purkinje cells (P). This circuit is purely feedforward, since the population of brainstem neurons that receive input from Purkinje cells (B1) do not loop back to the cerebellar cortex. Right, the equivalent feedforward circuit.
Figure 8—figure supplement 1

Sensitivity of models to parameter changes.
Model output showing Purkinje cell activity (top) and eye velocity (bottom) in response to an ipsiversive step in head velocity, for No Feedback, Feedback = 0.9, and Strong Feedback models. Results are shown for the original models before learning (solid), and after increasing (short dash) or decreasing (long dash) the amplitude of the filter carrying vestibular input to the brainstem (kEH) by 10%.
Additional files
Download links
A two-part list of links to download the article, or parts of the article, in various formats.
Downloads (link to download the article as PDF)
Open citations (links to open the citations from this article in various online reference manager services)
Cite this article (links to download the citations from this article in formats compatible with various reference manager tools)
Interactions between circuit architecture and plasticity in a closed-loop cerebellar system
eLife 13:e84770.
https://doi.org/10.7554/eLife.84770


