Precision RNAi using synthetic shRNAmir target sites
- Research Institute of Molecular Pathology (IMP), Campus-Vienna-Biocenter 1, Austria
- Vienna BioCenter PhD Program, Doctoral School of the University at Vienna and Medical University of Vienna, Vienna BioCenter (VBC), Austria
- Boehringer Ingelheim RCV GmbH & Co KG, Doktor-Boehringer-Gasse, Austria
- Medical University of Vienna, Vienna BioCenter, Austria
Figures
Figure 1 with 1 supplement
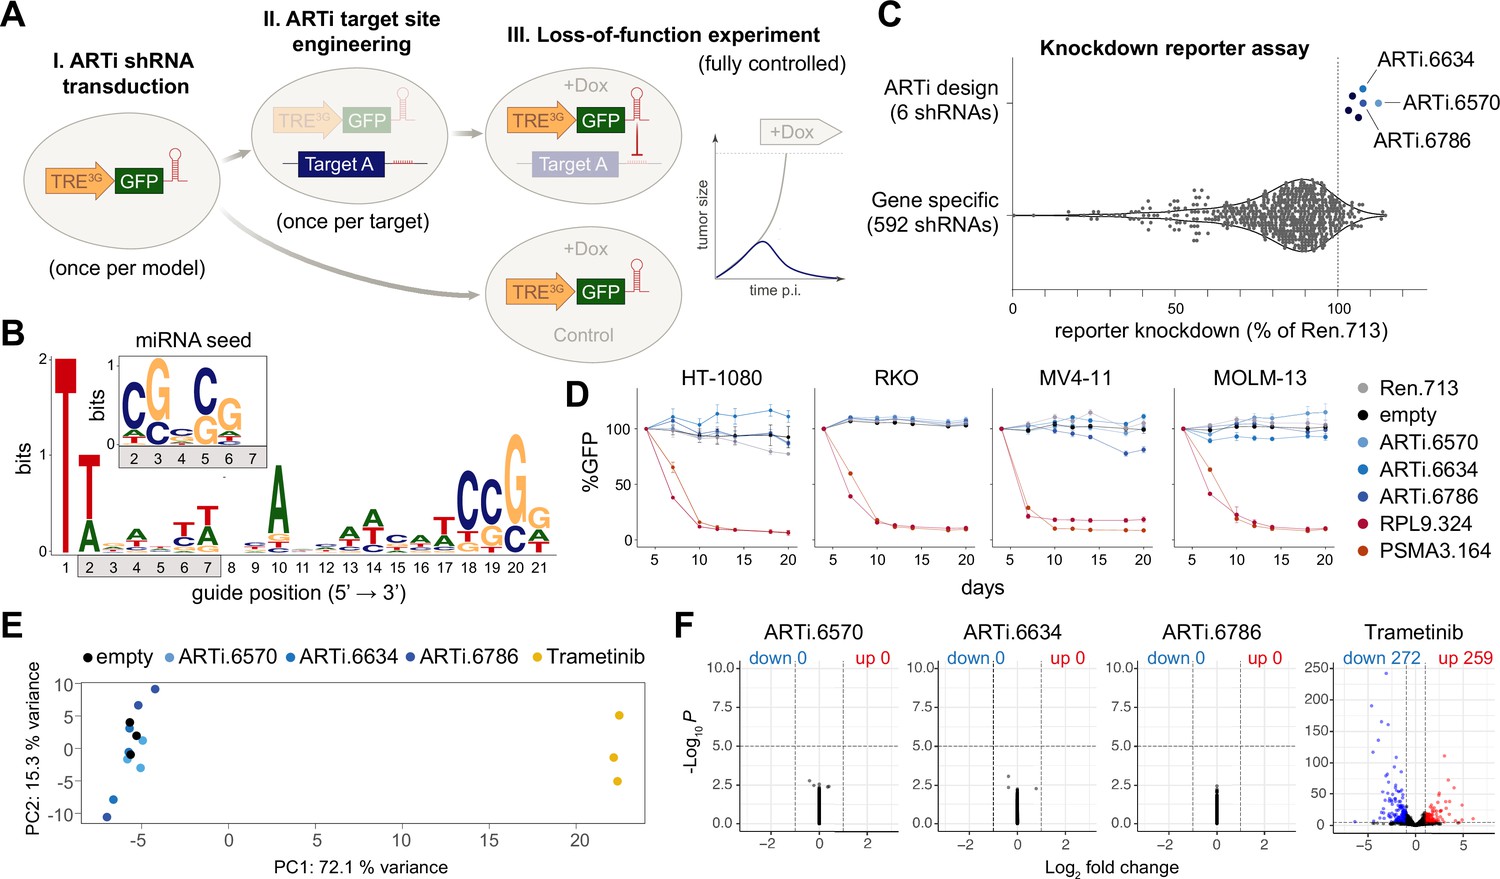
Design and selection ARTi-shRNAmirs.
(A) Schematic outline of the ARTi approach. (B) Sequence logo (https://weblogo.berkeley.edu) displaying nucleotide position biases of 2161 shRNAs with exceptionally high Designer of Small Interfering RNA (DSIR) scores (>105). Inlay depicts miRNA seed sequence biases. (C) Reporter assay comparing gene-specific shRNAs to ARTi-shRNAmirs. (D) Competitive proliferation assays in human cell lines after transduction with ARTi-shRNAmirs, neutral (shRen.713) and essential control shRNAs (shRPL9.324 or shPSMA3.164) (n=3, error bars represent SD). (E) Principal component (PC) analysis of gene expression profiling upon stable expression of indicated shRNAs or treatment with MEK inhibitor (trametinib) in RKO cells. (F) Volcano plots visualizing de-regulated genes upon expression of indicated shRNAs and trametinib treatment in RKO cells compared to empty vector control. ARTi, artificial RNA interference; shRNAmirs, micro-RNA embedded shRNAs.
Figure 1—figure supplement 1

Design and selection ARTi-shRNAmirs.
(A) Sequence logo displaying nucleotide position biases of seed sequences (guide positions 2–8) with the lowest off-target score in siSPOTR analysis (top 1%). (B) Sequence logo displaying position biases in sequences from a that harbor a T in guide position 2. (C) Knockdown efficiency of ARTi-shRNAmirs. Flow cytometric quantification of GFP knockdown efficiency in immortalized mouse embryonic fibroblastss (MEFs) 2 d after transduction with indicated ARTi-shRNAmir or control short-hairpin RNAs (shRNAs). Percent knockdown is normalized to shRen.713 control. shRen.660 served as a neutral control whose target site was not included in the reporter. Red asterisks indicate ARTi-shRNAmirs that were selected for follow-up studies. (D) Toxicity of ARTi-shRNAmirs. Competitive proliferation assays of three murine cell lines after transduction with ARTi-shRNAmirs, shRen.713, or shMyc.1834 control, showing the relative fraction of shRNA-expressing cells at indicated time points following the initial measurement (day 4 after shRNA transduction). (E) Principal component analysis of gene expression profiling in HT-1080 cells. Respective shRNAmirs and treatments are indicated in the respective colors. X-axis: principal component 1; Y-axis: principal component 2. (F) Volcano plots visualizing de-regulated genes in HT 1080 cells. All shRNAmirs and treatments were tested against the empty vector control. X-axis: -log10(p-value); Y-axis: log2 fold change. (G) Cell growth assay for ARTi-shRNAmir transduced cells and their parental controls in the presence and absence of dox. ARTi, artificial RNA interference; shRNAmirs, micro-RNA embedded shRNAs.
Figure 2 with 3 supplements
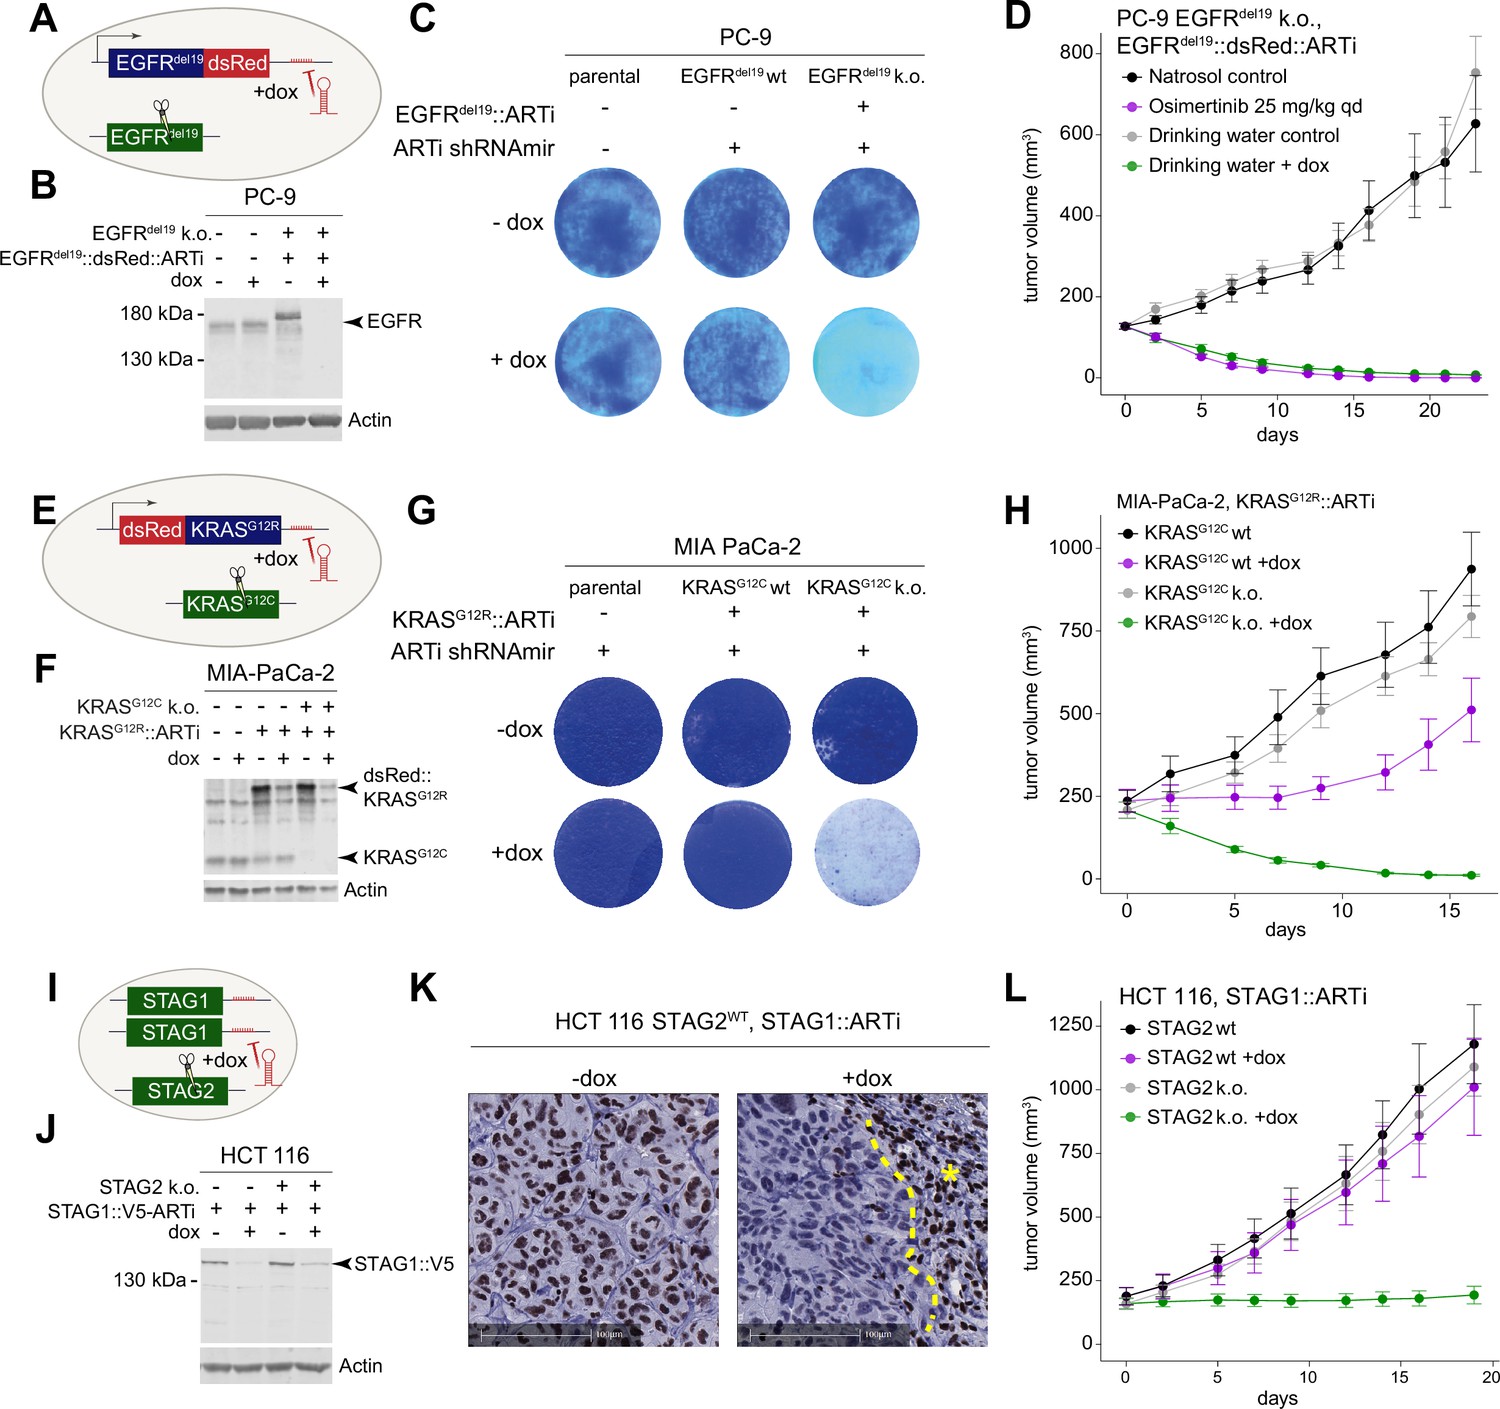
Experimental validation of the artificial RNA interference (ARTi) approach.
(A) Schematic of EGFRdel19::V5::dsRed::ARTi engineering in PC-9 cells. Blue color denotes overexpressed ARTi variant. Green denotes endogenous gene. (B) Western blot demonstrating knockdown of EGFRdel19::V5::dsRed::ARTi. Western blot is a representative example of three independent biological repeat experiments. (C) Proliferation assay and crystal violet staining of parental and engineered PC-9 cells in the absence or presence of doxycycline (dox). Crystal violet staining is a representative example of two independent biological repeat experiments.( D) In vivo experiment comparing dox-induced EGFRdel19::V5::dsRed::ARTi knockdown to pharmacological EGFRdel19 inhibition. Mean tumor volume and ± SEM is plotted for all in vivo experiments. (E) Schematic of MIA PaCa-2 engineering. Blue color denotes overexpressed ARTi variant. Green denotes endogenous gene. (F) Western blot for KRAS and Actin in indicated engineered MIA PaCa-2 cells in the presence and absence of dox. Western blot is a representative example of two independent biological repeat experiments. (G) Proliferation assay and crystal violet staining of parental and engineered MIA PaCa-2 cells in the absence or presence of dox. Crystal violet staining is a representative example of two independent biological repeat experiments. (H) Growth curves of tumors implanted with engineered MIA PaCa-2 cells in the absence and presence of dox in vivo. (I) Schematic of C-terminal endogenous tagging of STAG1. Green color denotes endogenous genes. (J) Western blot demonstrating knockdown of STAG1-ARTi. Western blot is a representative example of three independent biological repeat experiments. (K) Immunohistochemistry staining of STAG1 in engineered HCT 116 cells in the absence and presence of dox. Asterisk marks an area of murine fibroblasts that serve as an internal positive control. (I) Growth curves of tumors implanted with engineered HCT 116 cells in the absence and presence of dox.
-
Figure 2—source data 1
Original blots for Figure 2B and Figure 2—figure supplement 1B.
- https://cdn.elifesciences.org/articles/84792/elife-84792-fig2-data1-v1.zip
-
Figure 2—source data 2
Original blots for Figure 2F.
- https://cdn.elifesciences.org/articles/84792/elife-84792-fig2-data2-v1.zip
-
Figure 2—source data 3
Original blots for Figure 2J.
- https://cdn.elifesciences.org/articles/84792/elife-84792-fig2-data3-v1.zip
Figure 2—figure supplement 1

Validation of artificial RNA interference (ARTi) in vitro and in vivo – EGFR.
(A) Functional validation of the EGFRdel19 construct in Ba/F3 cells. Provided are GI50 values (nM) for indicated conditions and compounds (parental cells IL-3-dependent; other cells dependent on transgenes [no IL-3]). Numbers represent GI50 value calculated from three technical repeats. Three biological repeat experiments were conducted, and one representative experiment is shown in (A). (B) Western blot analysis confirming expression of EGFRdel19::V5::dsRed::ARTi constructs, knockout of endogenous EGFR and doxycycline (dox)-induced knockdown or EGFRdel19::V5::dsRed::ARTi. Western blot is a representative example of three independent biological repeat experiments. (C) Expression levels (y-axis: normalized counts) of the EGFRdel19::V5::dsRed::ARTi construct in parental and engineered PC-9 cells after 4 and 8 d of dox treatment or no treatment. Individual datapoints of three biological replicates overlay the boxplots. (D) Expression levels (y-axis: normalized counts) of the MAPK target gene DUSP6 in parental and engineered PC-9 cells after 4 and 8 d of dox treatment or no treatment. Individual datapoints of three biological replicates overlay the boxplots. (E) Heatmap visualizing the gene expression changes in MAPK pathway target and ERBB genes in engineered cells in the presence and absence of dox. (F) In vivo experiment comparing dox-induced expression of the ARTi-shRNAmir to drinking water control in PC-9 parental cells. Lines connect mean tumor volume data and ± SEM.
Figure 2—figure supplement 2
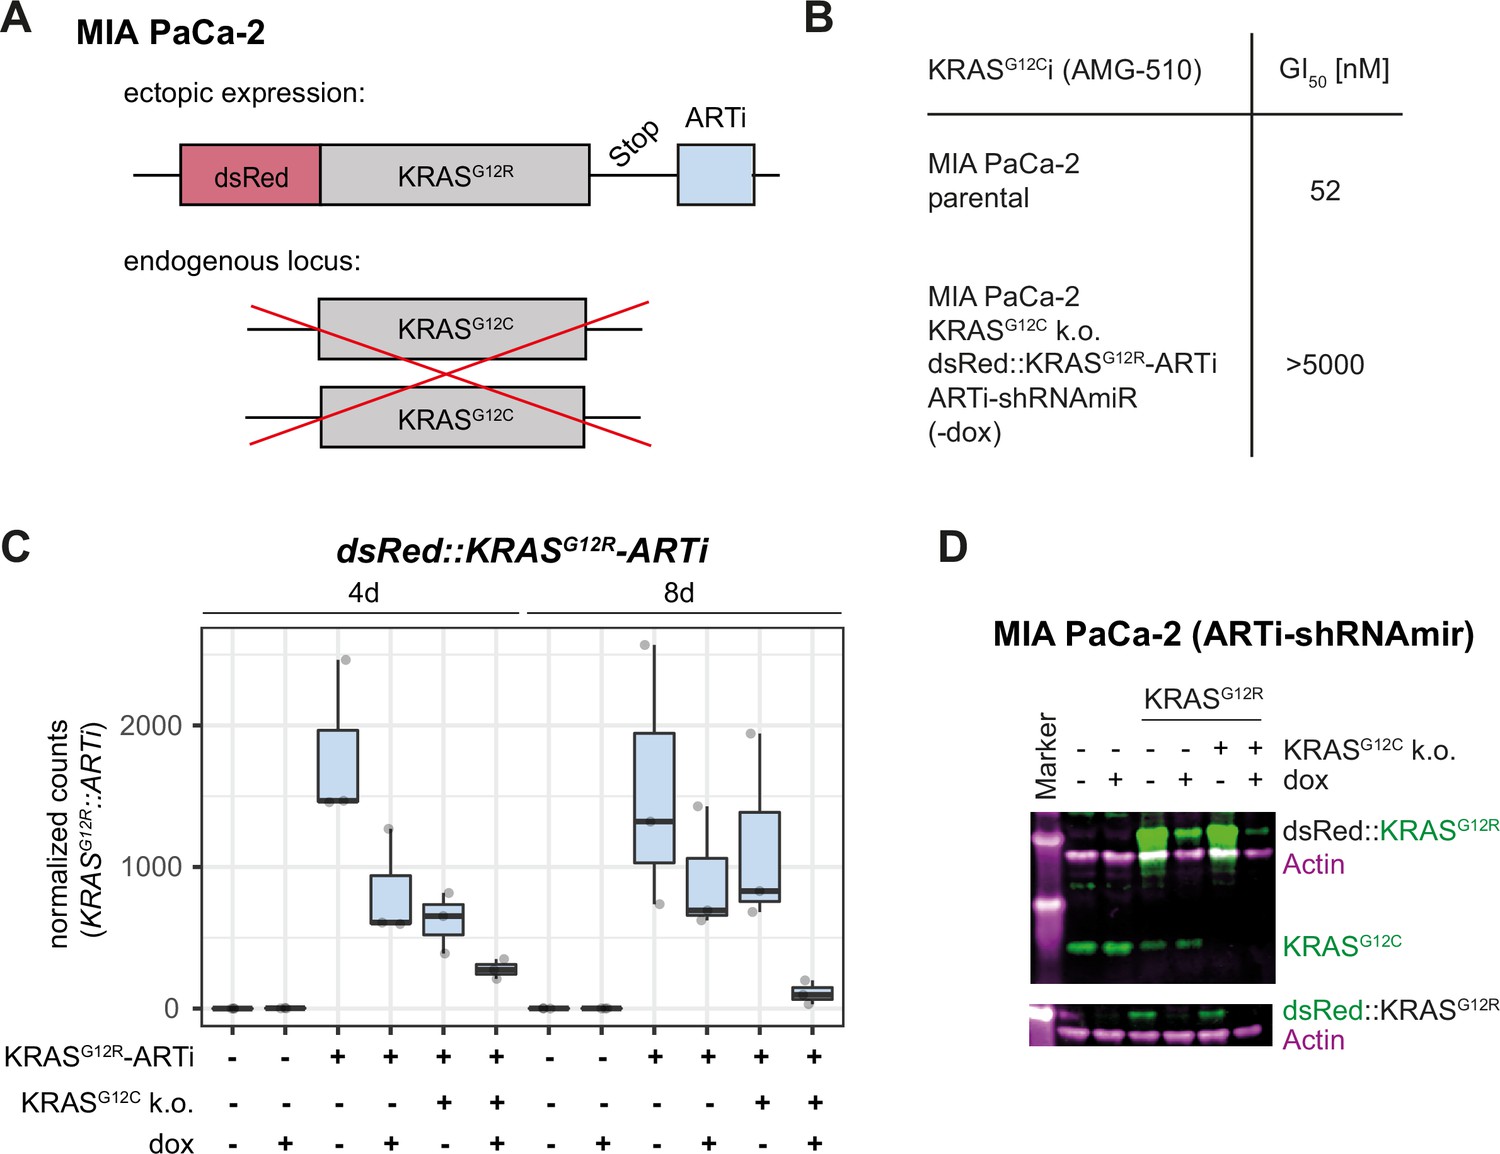
Validation of artificial RNA interference (ARTi) in vitro and in vivo – KRAS.
(A) Schematic of MIA PaCa-2 genome engineering. (B) AMG-510 GI50 values in MIA PaCa-2 parental and engineered cells. Numbers represent GI50 value calculated from three technical repeats. Three biological repeat experiments were conducted, and one representative experiment is shown in (B). (C) Expression levels (y-axis: normalized counts) of the dsRed::KRASG12R transgene in parental and engineered MIA PaCa-2 cells after 4 and 8 d of doxycycline (dox) treatment or no treatment. Individual datapoints of three biological replicates overlay the boxplots. (D) Western blot for KRAS (green) and Actin (magenta) (upper plot) and dsRed (green) and Actin (magenta) (bottom plot) for indicated engineered MIA PaCa-2 cells in the presence and absence of dox. Western blot is a representative example of three independent biological repeat experiments.
-
Figure 2—figure supplement 2—source data 1
Original blots for Figure 2—figure supplement 2D.
- https://cdn.elifesciences.org/articles/84792/elife-84792-fig2-figsupp2-data1-v1.zip
Figure 2—figure supplement 3
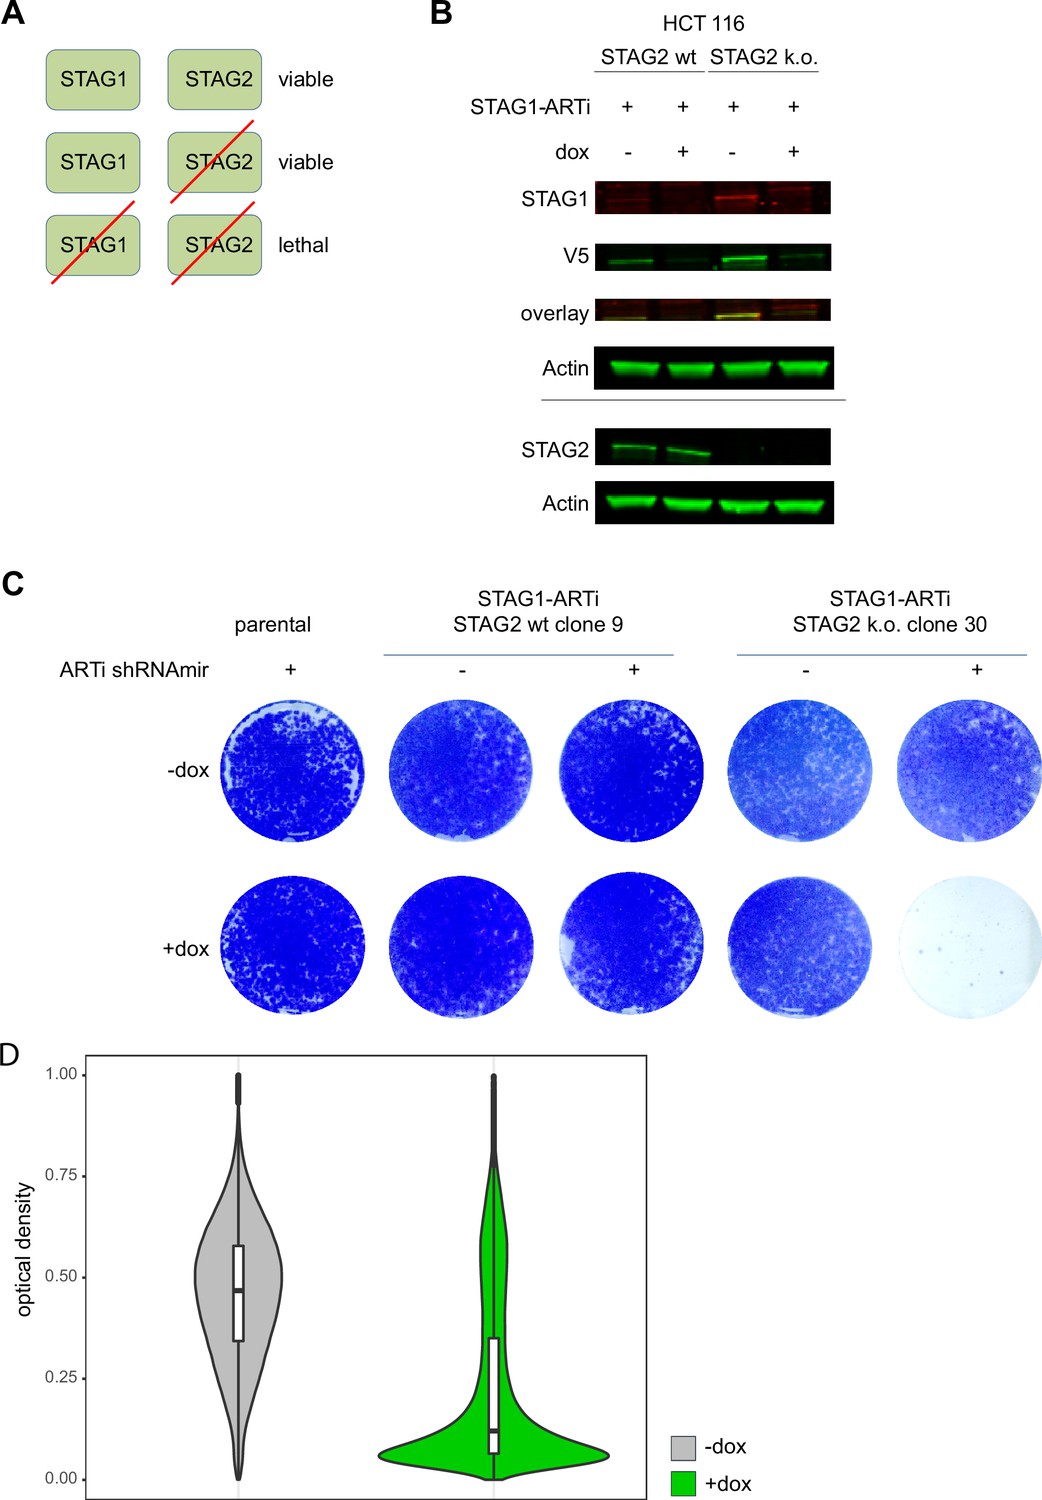
Validation of artificial RNA interference (ARTi) in vitro and in vivo – STAG1.
(A) Schematic of synthetic lethal interaction between STAG1 and STAG2. Cells survive loss of either paralog but are incapable of growing upon combined loss of STAG1 and STAG2. (B) Western blot confirmation of STAG2 knockout and ARTi-shRNAmir-induced knockdown of endogenous STAG1::V5::ARTi. Western blot is a representative example of three independent biological repeat experiments. (C) Proliferation assay of ARTi engineered HCT 116 cells in vitro, visualized by crystal violet staining following a 9-day doxycycline (dox) or control treatment. Staining is a representative example of three independent biological repeat experiments. (D) Quantification of nuclear Stag1 level (Figure 2k) using engineered HCT 116 cells in an in vivo xenotransplantation experiment the control group (-dox) and dox (+dox) treated group.
-
Figure 2—figure supplement 3—source data 1
Original blots for Figure 2—figure supplement 3B.
- https://cdn.elifesciences.org/articles/84792/elife-84792-fig2-figsupp3-data1-v1.zip
Additional files
Download links
A two-part list of links to download the article, or parts of the article, in various formats.
Downloads (link to download the article as PDF)
Open citations (links to open the citations from this article in various online reference manager services)
Cite this article (links to download the citations from this article in formats compatible with various reference manager tools)
Precision RNAi using synthetic shRNAmir target sites
eLife 12:RP84792.
https://doi.org/10.7554/eLife.84792.3


