Analysis of science journalism reveals gender and regional disparities in coverage
- University of Colorado School of Medicine, United States
Figures
Figure 1 with 1 supplement
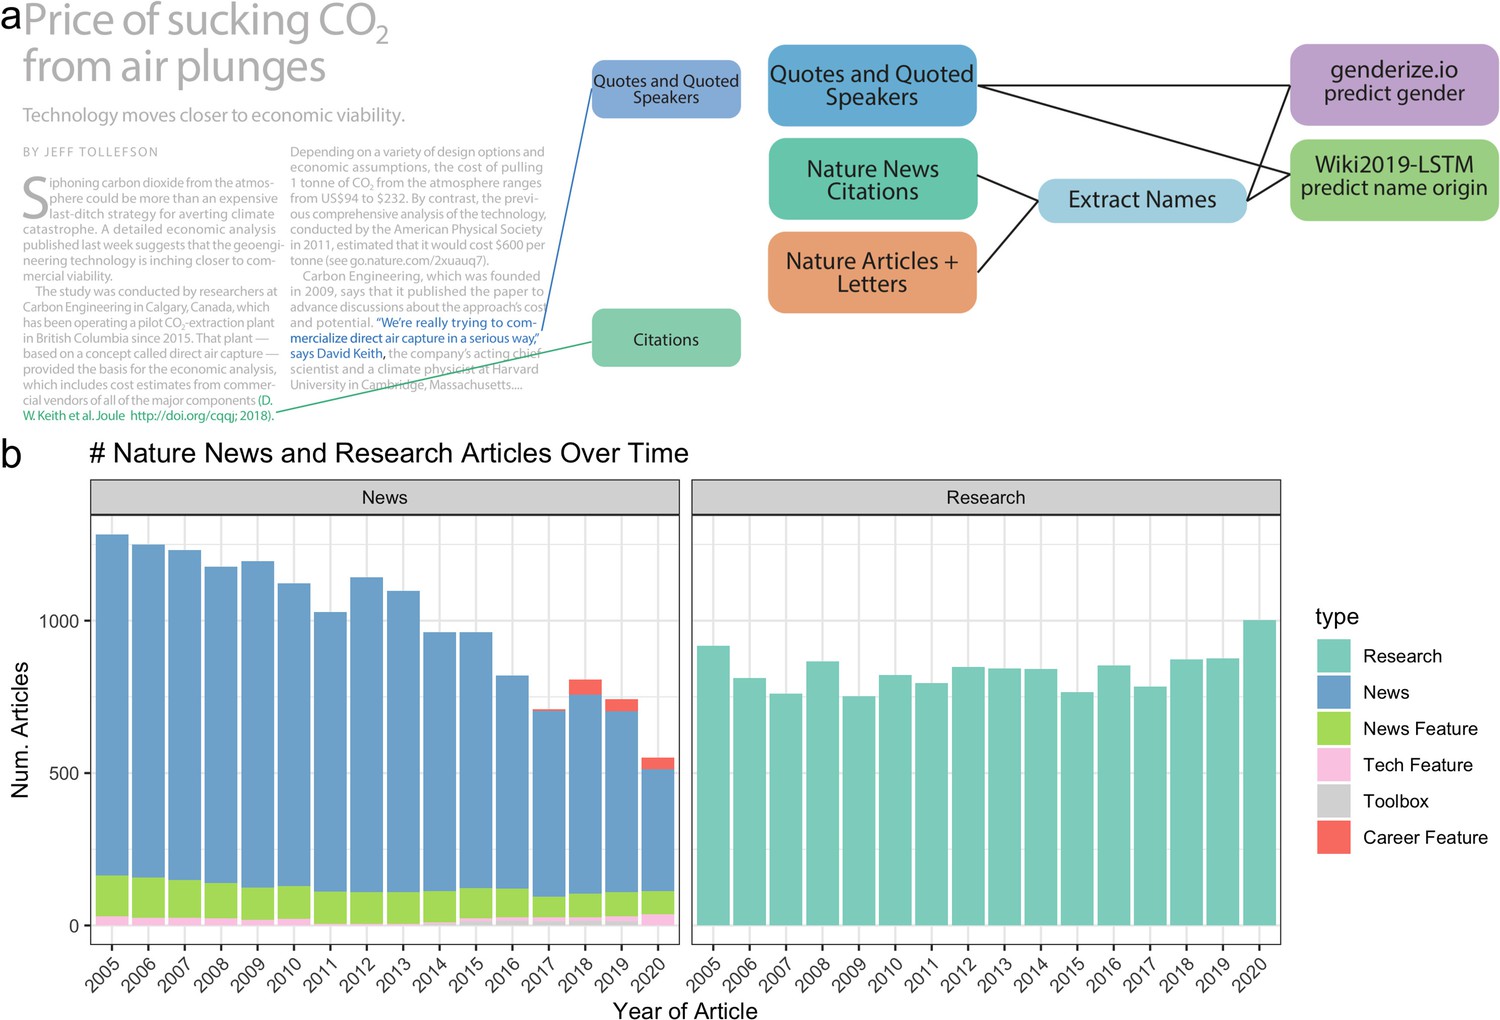
Data and processing pipeline overview.
(a), left, depicts an example news article and the type of data extracted from the text. Green and blue highlighted text depicts all quotes, and associated speakers identified by the coreNLP pipeline. A custom script described in section Methods identifies all citations. (a), right, charts the analyses done on the extracted names and locations from news articles and papers published by Nature. (b) shows the types and amounts of articles that we have used for analyses.
Figure 1—figure supplement 1

Benchmark data.
The performance of gender prediction for pipeline-identified quoted speakers.
Figure 2 with 2 supplements
Speakers predicted to be men are sometimes over-represented in quotes, but this depends on the year and article type.
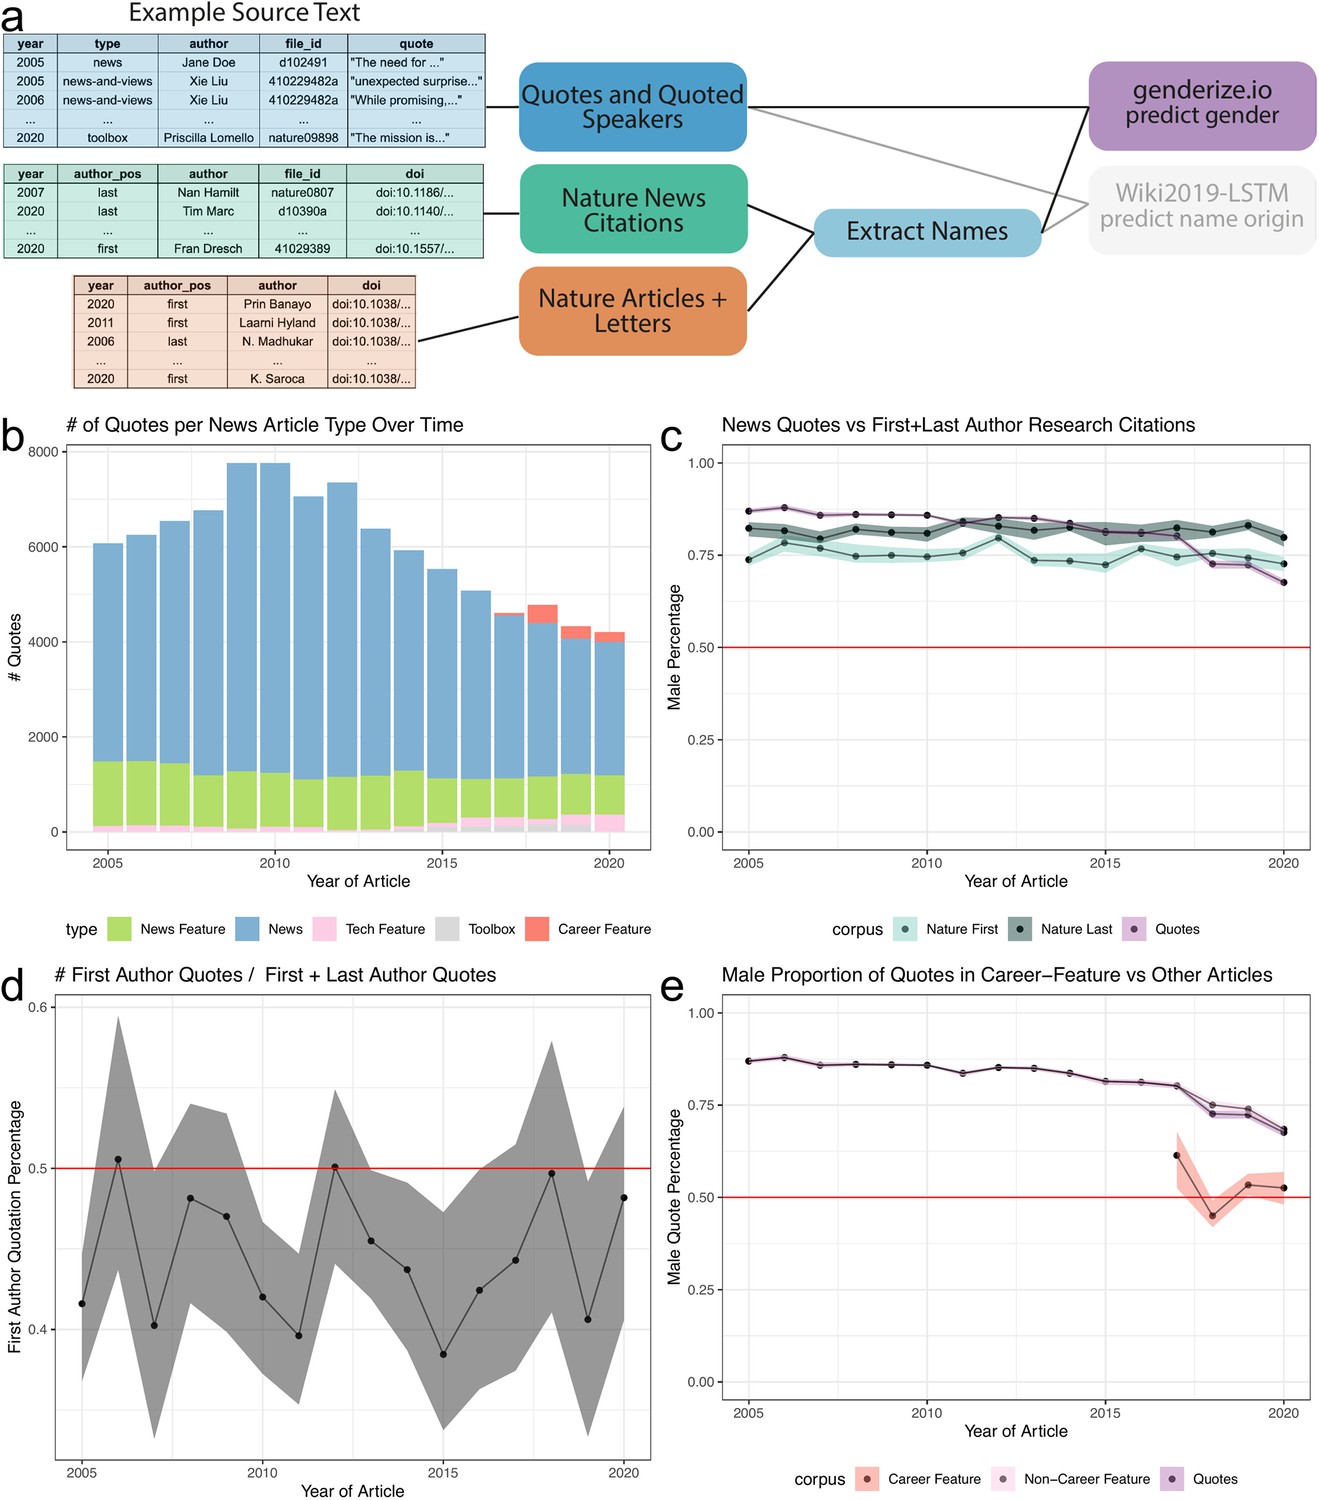
(a), left, depicts an example of the names extracted from quoted speakers in news articles and authors in papers. (a), right, highlighted the data types and processes used to analyze the predicted gender of extracted names. (b) shows an overview of the number of quotes extracted for each article type. (c) depicts three trend lines: purple: proportion of quotes for a speaker estimated to be a man; light blue: proportion of first author papers estimated to be a man; dark blue: proportion of last authors predicted to be a man. We observe that the proportion of quotes estimated to come from a man is steadily decreasing, most notably from 2017 onward. This decreasing trend is not due to a change in quotes from the first or last author, as observed in (d). (d) shows a consistent but slight bias toward quoting the last author of a cited article than the first author over time. (e) depicts the frequency of quote by article type highlighting an increase in quotes from ‘Career Feature’ articles. (e) depicts that the quotes obtained in this article type have reached parity. The colored bands represent a 5th and 95th bootstrap quantiles in all plots, and the point is the mean calculated from 1000 bootstrap samples.
Figure 2—figure supplement 1
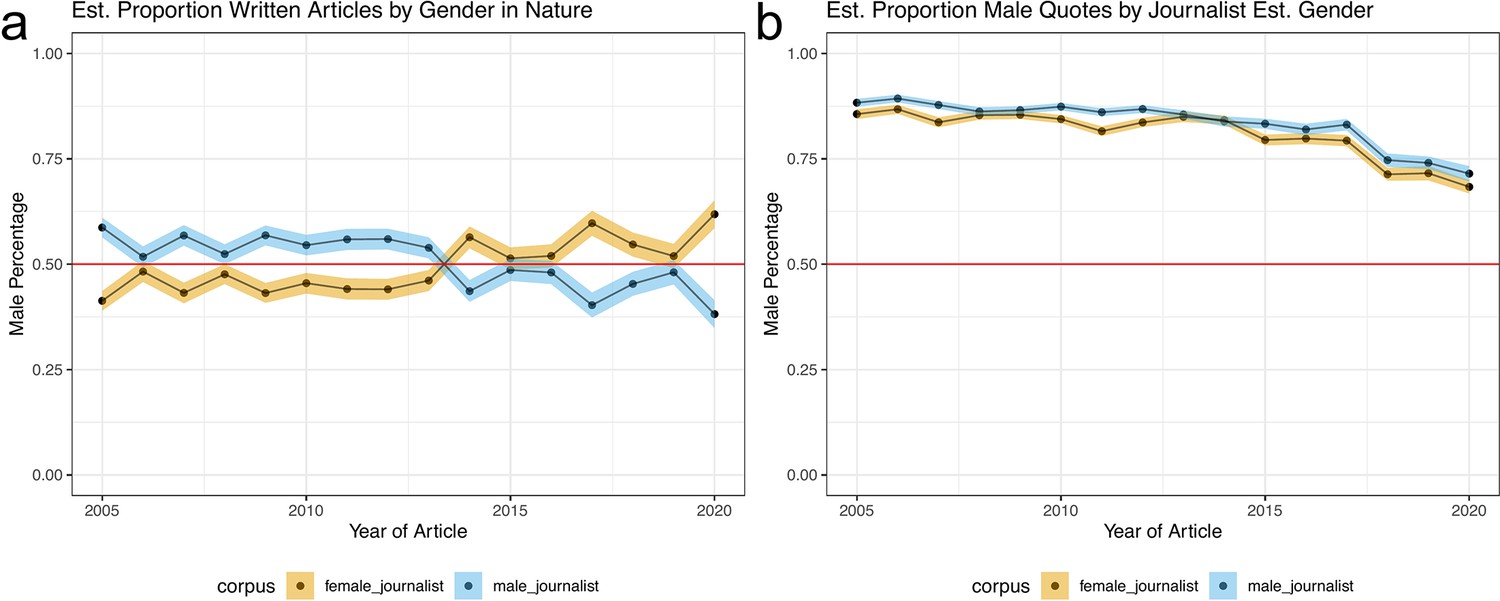
Speakers predicted to be men are over-represented in news quotes regardless of predicted journalist gender.
(a) depicts two trend lines: Yellow: proportion of Nature news articles written by a predicted women journalist; blue: proportion of Nature news articles written by a predicted men journalist. We observe a moderate gender difference in the number of articles written by men and women journalists. (b) depicts two trend lines: yellow: proportion of quotes predicted to be from men in an article written by a journalist predicted to be a woman; blue: proportion of quotes predicted to be from men in an article written by a journalist predicted to be a man. In all plots, the colored bands represent the 5th and 95th bootstrap quantiles and the point is the mean calculated from 1000 bootstrap samples.
Figure 2—figure supplement 2
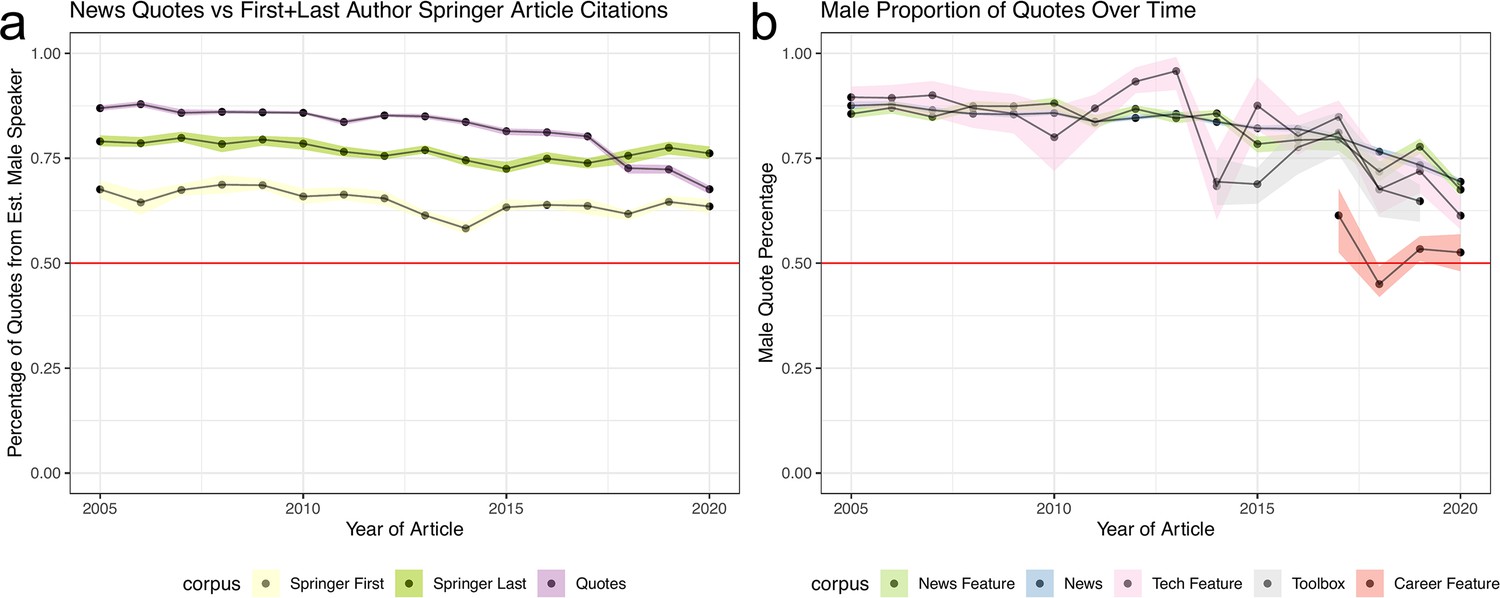
Speakers predicted to be men are over-represented in news quotes when compared against Springer Nature authorship.
(a) depicts three trend lines: purple: proportion of Nature quotes for a speaker estimated to be a man; light gray: proportion of The Guardian quotes for a speaker estimated to be a man; yellow: proportion of first author articles from an author estimated to be a man in Springer Nature; dark mustard: proportion of last author articles from an author estimated to be a man in Springer Nature. We observe a larger gender difference between first and last authors in Springer Nature articles, however the proportion of speakers estimated to be men is less than observed in Nature research articles. (b) depicts the proportion of quotes from predicted men broken down by article type. In all plots, the colored bands represent the 5th and 95th bootstrap quantiles and the point is the mean calculated from 1000 bootstrap samples.
Figure 3 with 4 supplements
Analysis of quotes and citations found over-representation of Celtic/English and under-representation of East Asian predicted name origins.
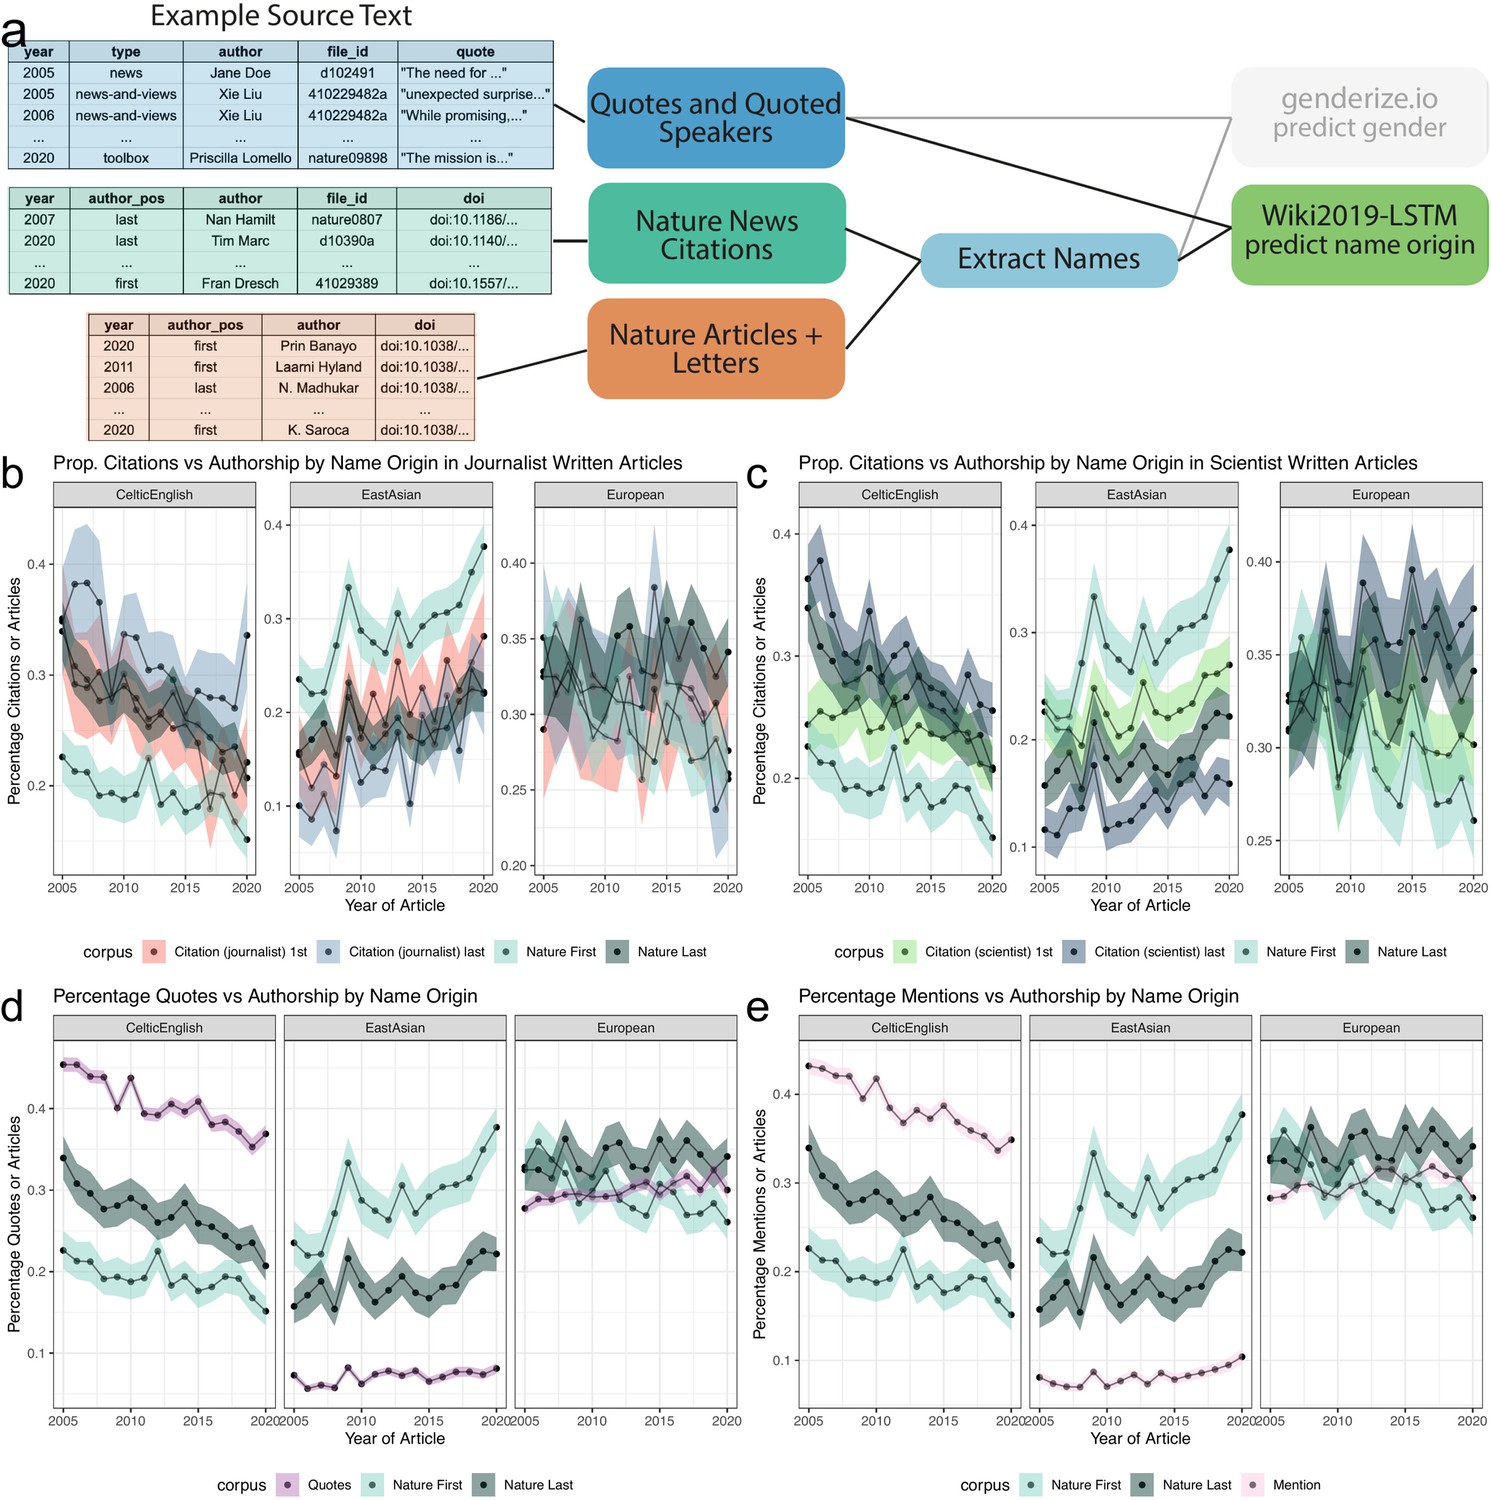
(a), left, depicts an example of the names extracted from quoted speakers and citations found within news articles and authors in papers. (a), right, highlights the data types and processes used to analyze the predicted origin of extracted names. (b and c) depict a comparison between the predicted name origins of last authors in Nature and cited papers in the news. (b and c) differ in the news article types. (b) calculates the predicted name origin proportion using only journalist-written articles, whereas (c) only uses scientist-written articles. The distinction between scientist- and journalist-written articles are defined by the article appearing in either the ‘Career Column’ or ‘News and Views’ sections, or another section, respectively. Similarly, (Panels d and e) depict two possible trend lines, comparing predicted name origins of either quoted or mentioned people against name origins of last authors of Nature research papers. For more precise numerical comparisons, the mean yearly fold change for each comparison is provided in Table 6.
Figure 3—figure supplement 1
Predicted Celtic/English, and European name origins are the highest cited, quoted, and mentioned.
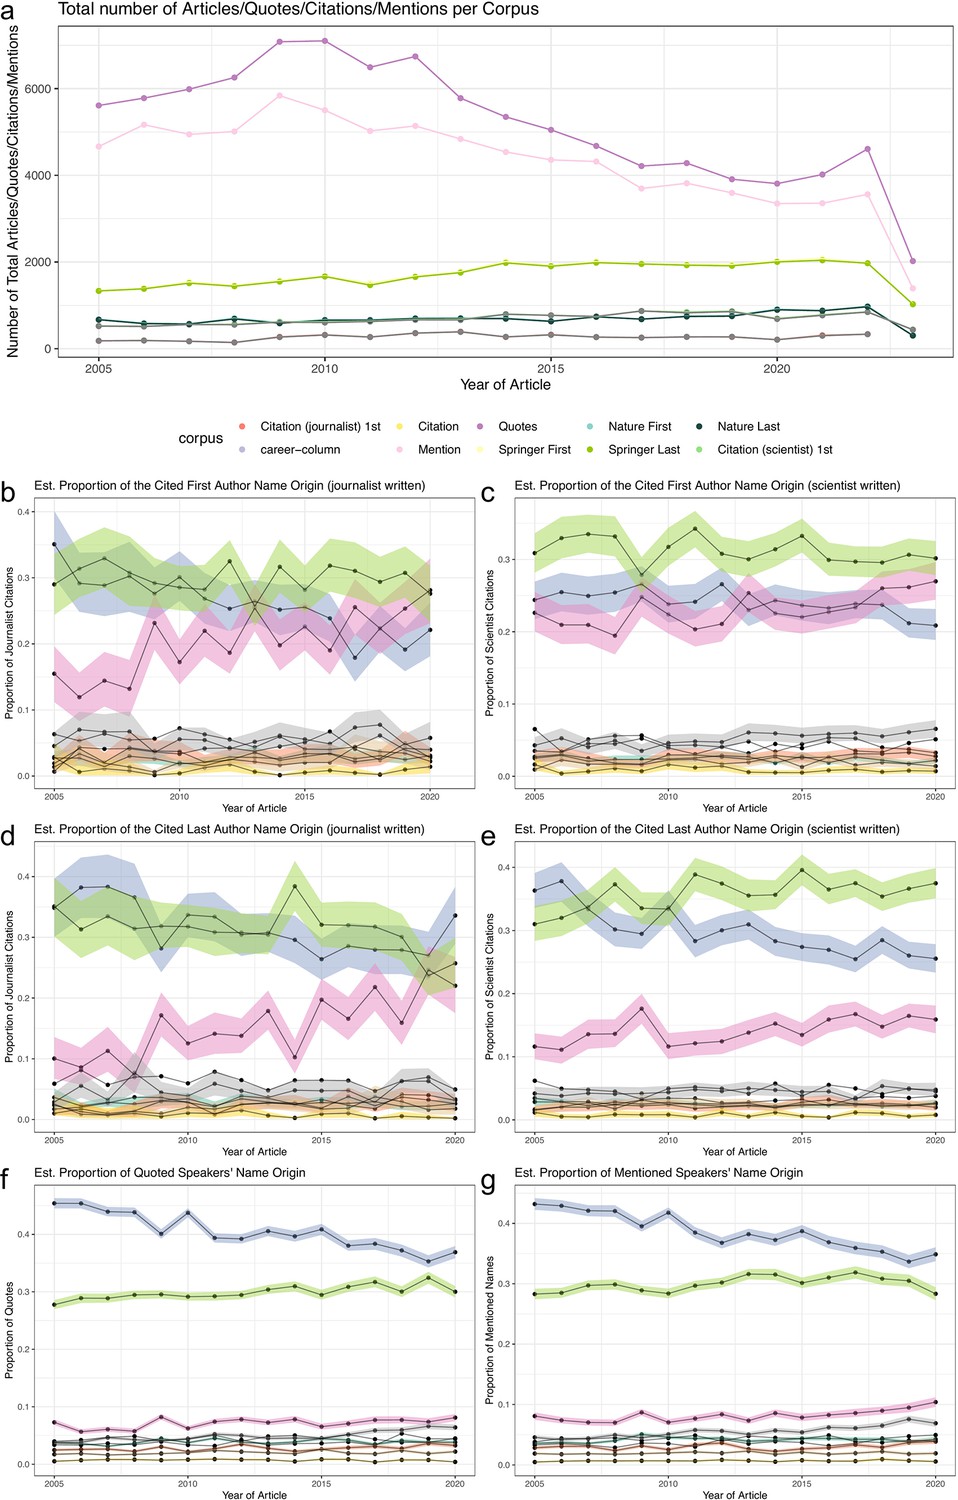
(a) depicts the number of quotes, mentions, citations, or research articles considered in the name origin analysis. (b–g) depicts the proportion of a name origin in a given dataset, citations in articles written by journalists or writers, quoted speakers or mentions. In all plots, the colored bands represent the 5th and 95th bootstrap quantiles and the point is the mean calculated from 1000 bootstrap samples.
Figure 3—figure supplement 2
Distribution of name origins Nature and Springer Nature articles.
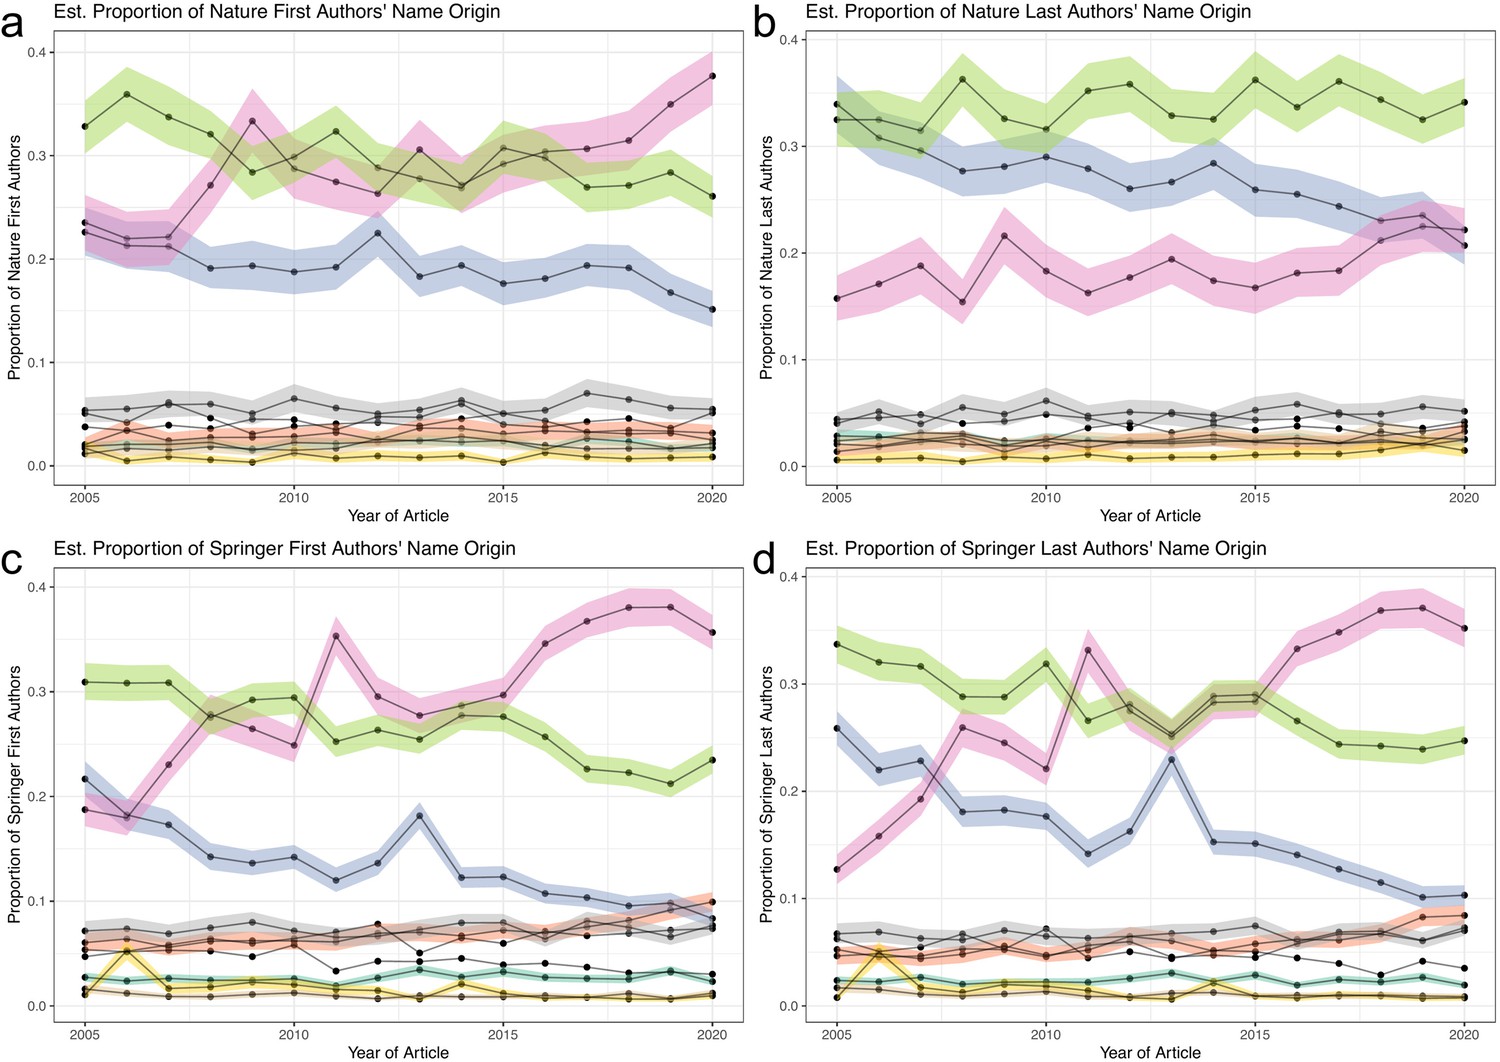
(a–d) depicts the predicted name origins of first and last authors in our background sets. (a and b) show the predicted name origins of Nature first and last authors, respectively. (c and d) show the predicted name origins of Springer Nature first and last authors, respectively.
Figure 3—figure supplement 3
Over-representation of predicted Celtic/English and under-representation of East Asian name origins are also found in comparison to Nature and Springer Nature articles.
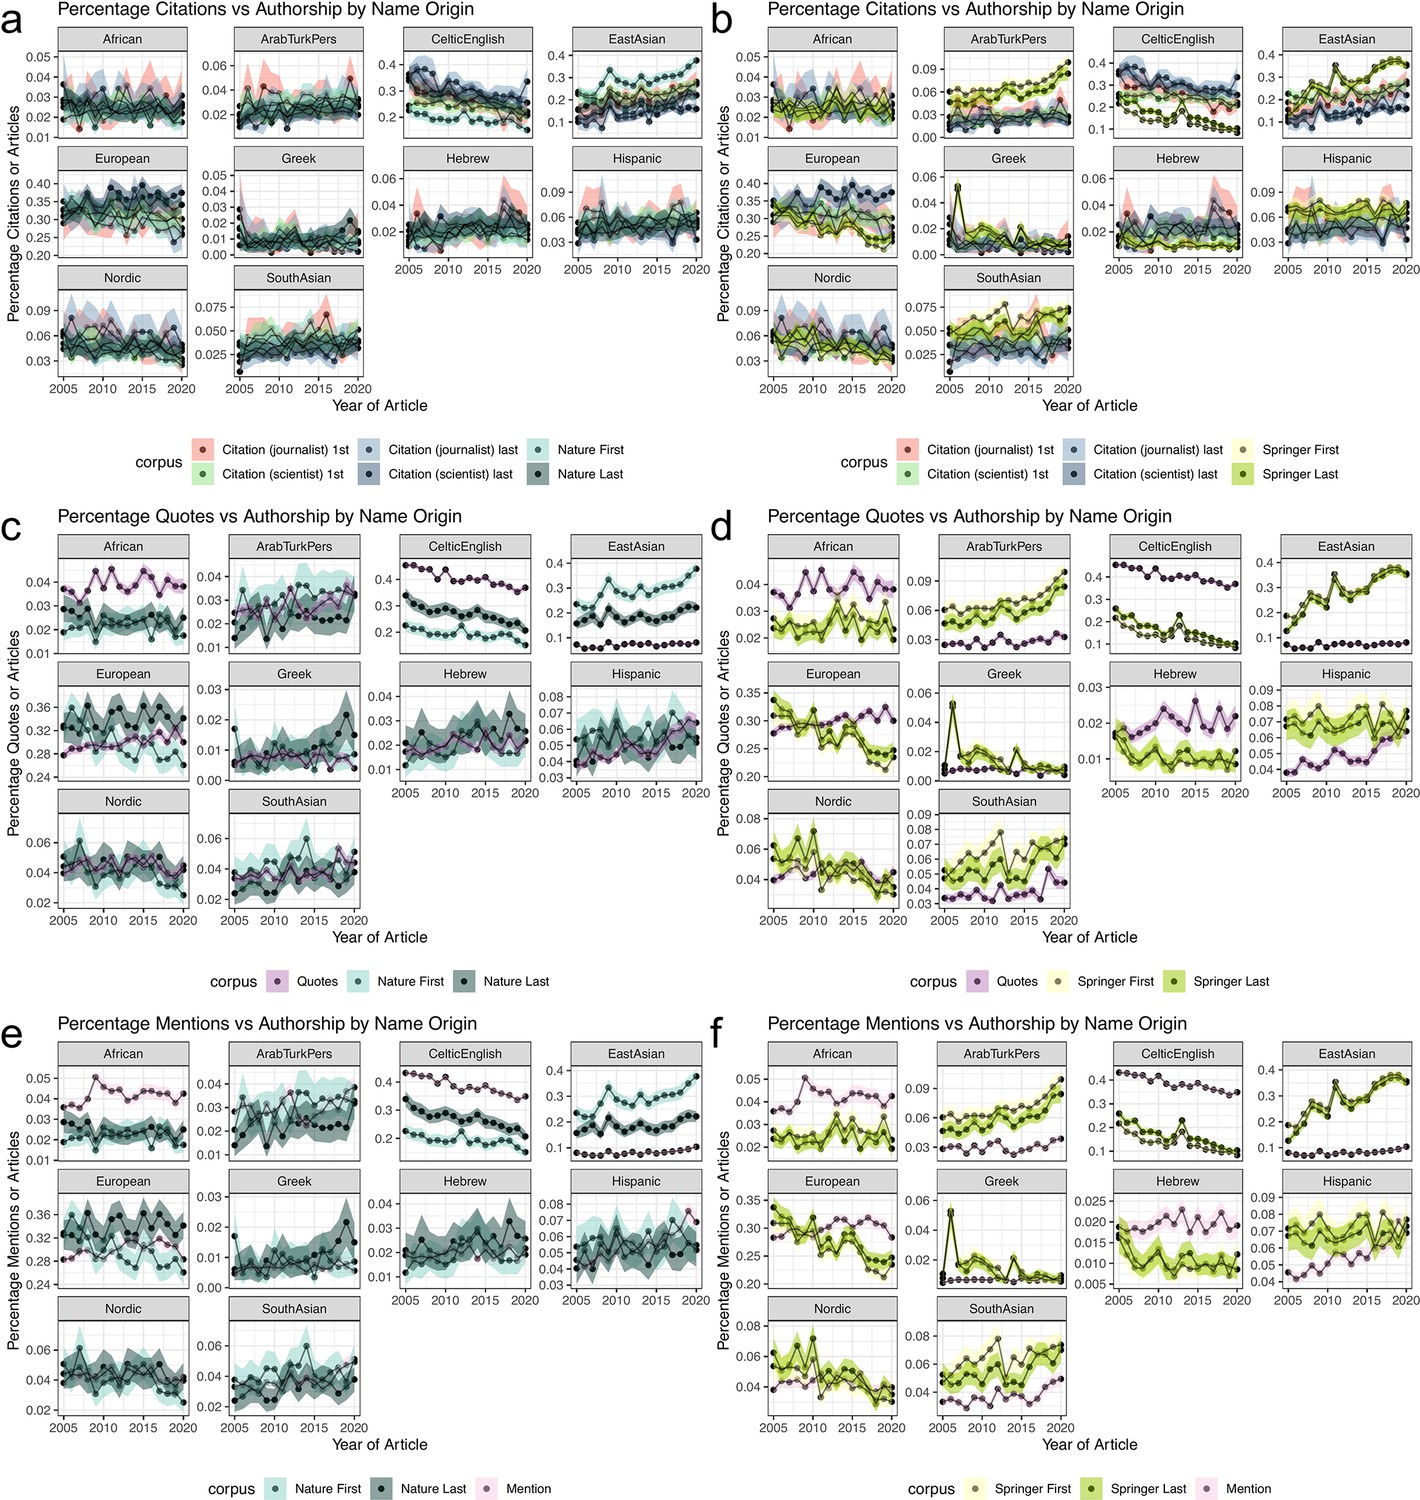
(a–f) depicts 10 plots, each for a possible name origin comparison against a background set. (a, c) and (e) compare the citation (a), quote (c), or mention (e) rate against Nature first and last author name origins. (b, d, and f) compare the citation (a), quote (c), or mention (e) rate against Springer Nature first and last author name origins. (a and b) additionally partition the citation rates by journalist-written articles and scientist-written articles, each further divided into first or last author position. For (c–f), only journalist-written articles are considered.
Figure 3—figure supplement 4
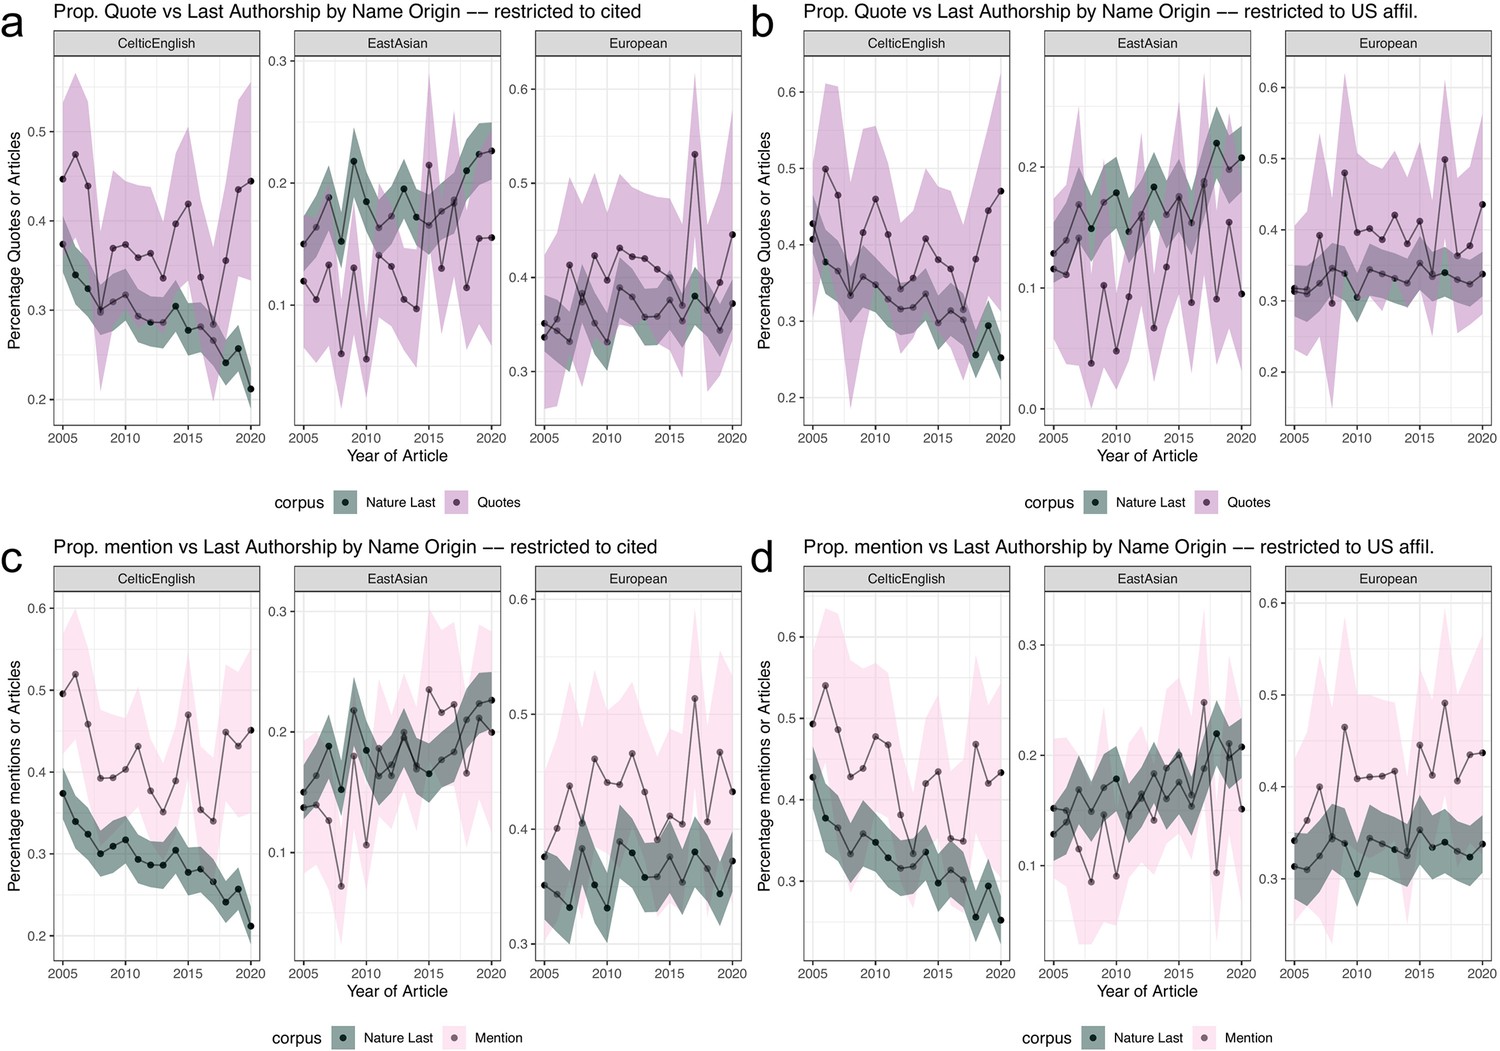
Over-representation of predicted Celtic/English and under-representation of East Asian quotes and mentions are reduced when additionally considering citation (a–d) depicts twelve plots, each for a possible name origin comparison against a background set.
(a and b) compare name origin proportions of quotes from people that were also cited in the same article. (c and d) compare name origin proportions from mentions of people that were also cited in the same article. In all plots, the colored bands represent the 5th and 95th bootstrap quantiles and the point is the mean calculated from 1000 bootstrap samples.
Tables
Table 1
Breakdown of quotes at major processing steps.
| Processing step | Frequency |
|---|---|
| Total quotes | 105,457 |
| Quotes with a full name or pronoun associated | 96,620 |
| Quotes with a gender prediction | 96,390 |
| Quote with a full name | 88,535 |
| Quotes with a name origin prediction | 100,457 |
Table 2
Breakdown of citations at major processing steps.
| Writer of article | Total citations | Total Springer Nature citations | First author citations with a full name | Last author citations with a full name | First author citations with a name origin prediciton | Last author citations with a name origin prediciton |
|---|---|---|---|---|---|---|
| Journalist | 15,713 | 5736 | 4452 | 4464 | 4449 | 4447 |
| Scientist | 40,707 | 14,597 | 11,276 | 11,170 | 11,276 | 11,152 |
Table 3
Breakdown of all Springer Nature papers at major processing steps.
| Processing step | Frequency |
|---|---|
| # Springer Nature articles | 38,400 |
| # First + last authors with a full name in Springer Nature articles | 55,370 |
| # First + last authors with a gender prediction in Springer Nature articles | 51,686 |
| # First + last authors with a name origin prediction in Springer Nature articles | 55,197 |
Table 4
Breakdown of all Nature papers at major processing steps.
| Processing step | Frequency |
|---|---|
| # Nature articles | 13,414 |
| # First + last authors with a full name in Nature articles | 21,996 |
| # First + last authors with a gender prediction in Nature articles | 21,173 |
| # First + last authors with a name origin prediction in Nature articles | 21,996 |
Table 5
Quoted speaker gender by name origin.
| Women | Men | Proportion men | |
|---|---|---|---|
| African | 270 | 1554 | 0.8519737 |
| ArabTurkPers | 346 | 1765 | 0.8360966 |
| CelticEnglish | 6399 | 33,329 | 0.8389297 |
| EastAsian | 1090 | 4438 | 0.8028220 |
| European | 4788 | 22,844 | 0.8267226 |
| Greek | 73 | 445 | 0.8590734 |
| Hebrew | 213 | 1303 | 0.8594987 |
| Hispanic | 760 | 2450 | 0.7632399 |
| Nordic | 593 | 2397 | 0.8016722 |
| SouthAsian | 465 | 2019 | 0.8128019 |
Table 6
Mean fold change comparison with Nature from bootstrap samples with 95% CI.
| CelticEnglish | EastAsian | European | |
|---|---|---|---|
| citation_journalist_first vs. nature_first | 1.36 (0.96, 1.74) | 0.7 (0.46, 0.91) | 1.01 (0.8, 1.25) |
| citation_journalist_last vs. nature_last | 1.18 (0.93, 1.54) | 0.82 (0.42, 1.27) | 0.93 (0.71, 1.19) |
| citation_scientist_first vs. nature_first | 1.26 (1.05, 1.5) | 0.81 (0.66, 1.02) | 1.05 (0.88, 1.22) |
| citation_scientist_last vs. nature_last | 1.11 (0.95, 1.31) | 0.77 (0.58, 0.99) | 1.06 (0.93, 1.19) |
| quote vs. nature_first | 2.12 (1.77, 2.51) | 0.25 (0.2, 0.32) | 1.01 (0.81, 1.22) |
| quote vs. nature_last | 1.52 (1.32 1.75) | 0.39 (0.3, 0.49) | 0.89 (0.79, 1.01) |
| mention vs. nature_first | 2.03 (1.67, 2.39) | 0.29 (0.23, 0.36) | 1.02 (0.81, 1.22) |
| mention vs. nature_last | 1.44 (1.26, 1.67) | 0.45 (0.35, 0.54) | 0.89 (0.79, 1) |
Table 7
Mean fold change comparison with Springer Nature from bootstrap samples with 95% CI.
| CelticEnglish | EastAsian | European | |
|---|---|---|---|
| citation_journalist_first vs. springer_first | 1.99 (1.42, 2.64) | 0.69 (0.47, 0.96) | 1.14 (0.89, 1.47) |
| citation_journalist_last vs. springer_last | 2.01 (1.31, 3.08) | 0.56 (0.3, 0.82) | 1.12 (0.91, 1.37) |
| citation_scientist_first vs. springer_last | 1.54 (0.95, 2.17) | 0.91 (0.62, 1.64) | 1.13 (0.91, 1.93) |
| citation_scientist_last vs. nature_last | 1.11 (0.95, 1.31) | 0.77 (0.58, 0.99) | 1.06 (0.93, 1.19) |
| quote vs. springer_last | 2.58 (1.74, 3.6) | 0.28 (0.2, 0.54) | 1.08 (0.84, 1.35) |
| quote vs. nature_last | 1.52 (1.32, 1.75) | 0.39 (0.3, 0.49) | 0.89 (0.79, 1.0) |
| mention vs. springer_last | 2.45 (1.65, 3.42) | 0.32 (0.23, 0.59) | 1.08 (0.85, 1.32) |
| mention vs. nature_last | 1.44 (1.26, 1.67) | 0.45 (0.35, 0.54) | 0.89 (0.79, 1) |
Table 8
Quoted speaker name origin, by journalist name origin.
| Journalist name origin | African | Arab Turk Pers | Celtic English | East Asian | European | Greek | Hebrew | Hispanic | Nordic | South Asian |
|---|---|---|---|---|---|---|---|---|---|---|
| CelticEnglish | 0.020 | 0.025 | 0.484 | 0.038 | 0.319 | 0.006 | 0.016 | 0.033 | 0.035 | 0.022 |
| EastAsian | 0.018 | 0.017 | 0.354 | 0.243 | 0.250 | 0.004 | 0.016 | 0.026 | 0.036 | 0.035 |
| European | 0.022 | 0.023 | 0.420 | 0.086 | 0.326 | 0.005 | 0.016 | 0.043 | 0.032 | 0.027 |
Table 9
Quoted + cited speaker name origin, by journalist name origin.
| Journalist name origin | African | Arab Turk Pers | Celtic English | East Asian | European | Greek | Hebrew | Hispanic | Nordic | South Asian |
|---|---|---|---|---|---|---|---|---|---|---|
| CelticEnglish | 0.016 | 0.027 | 0.368 | 0.070 | 0.363 | 0.008 | 0.017 | 0.023 | 0.083 | 0.025 |
| EastAsian | 0.002 | 0.077 | 0.377 | 0.143 | 0.167 | 0.000 | 0.012 | 0.133 | 0.019 | 0.080 |
| European | 0.014 | 0.028 | 0.363 | 0.116 | 0.352 | 0.006 | 0.030 | 0.026 | 0.035 | 0.030 |
Table 10
Quoted speakers (with US-affiliated citation) name origin, by journalist name origin.
| Journalist name origin | African | Arab Turk Pers | Celtic English | East Asian | European | Greek | Hebrew | Hispanic | Nordic | South Asian |
|---|---|---|---|---|---|---|---|---|---|---|
| CelticEnglish | 0.011 | 0.023 | 0.378 | 0.086 | 0.361 | 0.010 | 0.021 | 0.029 | 0.056 | 0.025 |
| EastAsian | 0.000 | 0.066 | 0.340 | 0.148 | 0.209 | 0.000 | 0.005 | 0.148 | 0.033 | 0.049 |
| European | 0.021 | 0.030 | 0.410 | 0.111 | 0.300 | 0.012 | 0.023 | 0.019 | 0.030 | 0.046 |
Additional files
Download links
A two-part list of links to download the article, or parts of the article, in various formats.
Downloads (link to download the article as PDF)
Open citations (links to open the citations from this article in various online reference manager services)
Cite this article (links to download the citations from this article in formats compatible with various reference manager tools)
Analysis of science journalism reveals gender and regional disparities in coverage
eLife 12:RP84855.
https://doi.org/10.7554/eLife.84855.3


