Selective integration of diverse taste inputs within a single taste modality
- Zuckerman Mind Brain Behavior Institute, Columbia University, United States
- Neuroscience Graduate Program, Emory University, United States
- Department of Biology, Emory University, United States
Figures
Figure 1
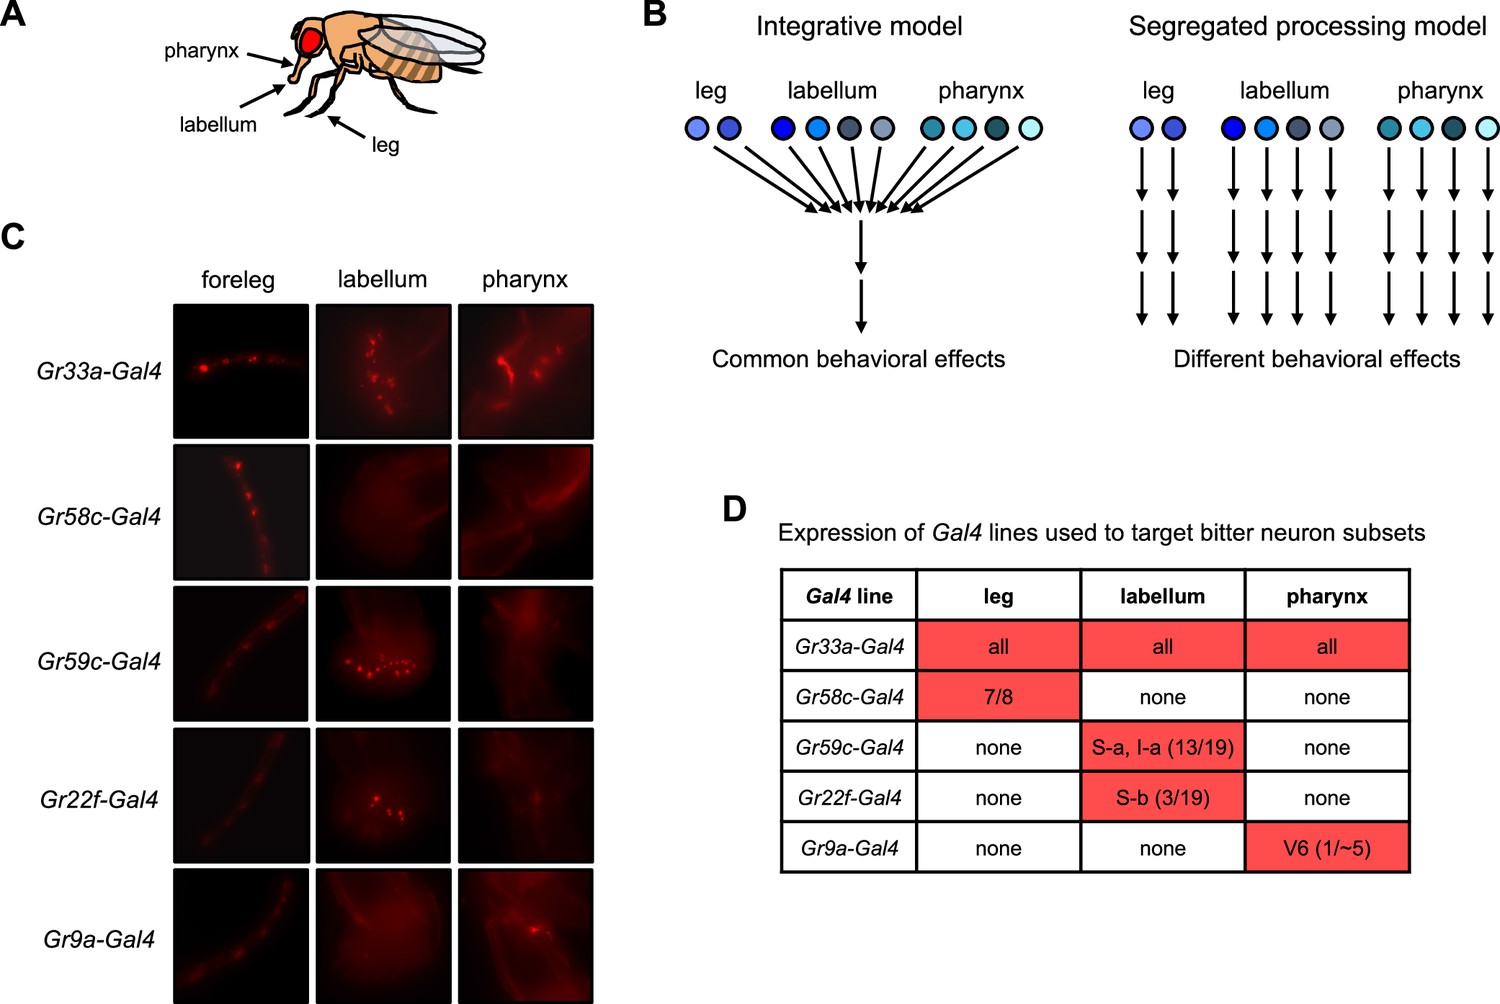
Models for bitter taste processing and Gal4 lines to target bitter neuron subsets.
(A) Schematic depicting three major taste organs in the fly. (B) Models for how different subsets of bitter-sensing neurons could be processed in the brain. (C–D) Expression patterns of Gal4 lines used to target subsets of bitter-sensing neurons. (C) Expression of each Gal4 line in the foreleg, labellum, and pharynx. Endogenous expression of the TdT marker was imaged in flies carrying each Gal4 along with UAS-Chrim-TdT. Autofluorescence that does not represent labeled cells is visible in some pictures, such as at leg joints. (D) Table summarizing each expression pattern, based on previous studies cited in the text. Numbers refer to the number of cells per side (left or right) that each line is expressed in relative to the total number of bitter-sensing cells in that organ (leg refers to all three legs). Source data is provided for the table in D.
-
Figure 1—source data 1
Expression pattern of Gal4 lines used to target bitter neuron subsets.
- https://cdn.elifesciences.org/articles/84856/elife-84856-fig1-data1-v1.xlsx
Figure 2 with 1 supplement
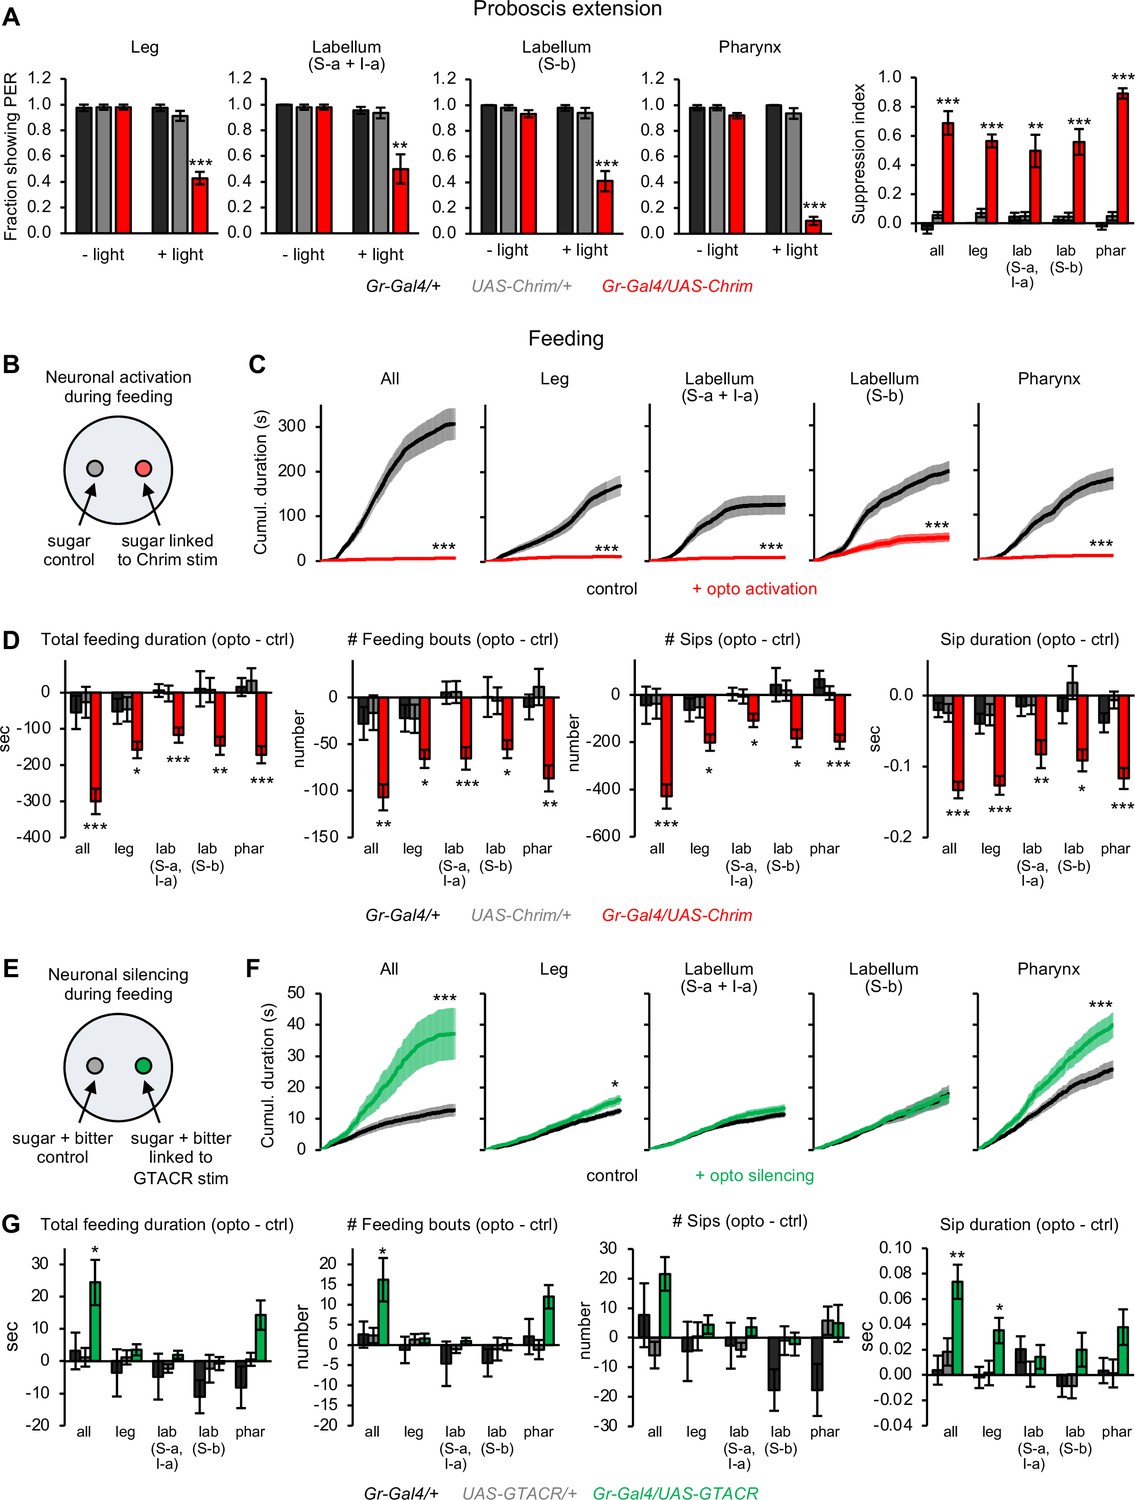
Bitter neuron subsets in different organs act in parallel to regulate feeding responses.
(A) Effect of activating bitter neuron subsets on proboscis extension response (PER) to 100 mM sucrose (n=5–8 sets of flies). Bar graphs for each neuronal subset (left) represent the fraction of flies showing PER with and without light stimulation. Bar graph on the right shows the degree of PER suppression elicited by neuronal activation, quantified as: 1 – (PER with light/PER without light). (B, E) Schematic of optoPAD setup used to test how neuronal activation (B) or silencing (E) affects feeding. Food sources contained 100 mM sucrose for activation experiments (B) and 50 mM sucrose +1 mM quinine for silencing experiments (E). (C, D, F, G) Effects of bitter neuron activation (C–D; n=40–48 flies) or silencing (F–G; n=40–62 flies) on feeding for 1 hr. (C, F) Cumulative feeding duration on the control and opto stim food sources for experimental flies. Values for the last time point (1 hr) were compared for control versus opto stim using paired t-tests. (D, G) Bars represent the difference in each feeding parameter between the control and opto stim food for each genotype. For each feeding measure, experimental flies were compared to both controls, and effects not labeled with an asterisk are not significant. In all panels, Gal4 lines used were Gr33a-Gal4 (all bitter neurons), Gr58c-Gal4 (leg), Gr59c-Gal4 (labellum, S-a + I-a), Gr22f-Gal4 (labellum, S-b), and Gr9a-Gal4 (pharynx). For all figures: *p<0.05, **p<0.01, ***p<0.001, ns = not significant (p>0.05). Unless otherwise specified, two groups were compared using unpaired t-tests and more than two groups were compared using one-way ANOVA followed by Dunnett’s test comparing experimental flies to each control.
Figure 2—figure supplement 1
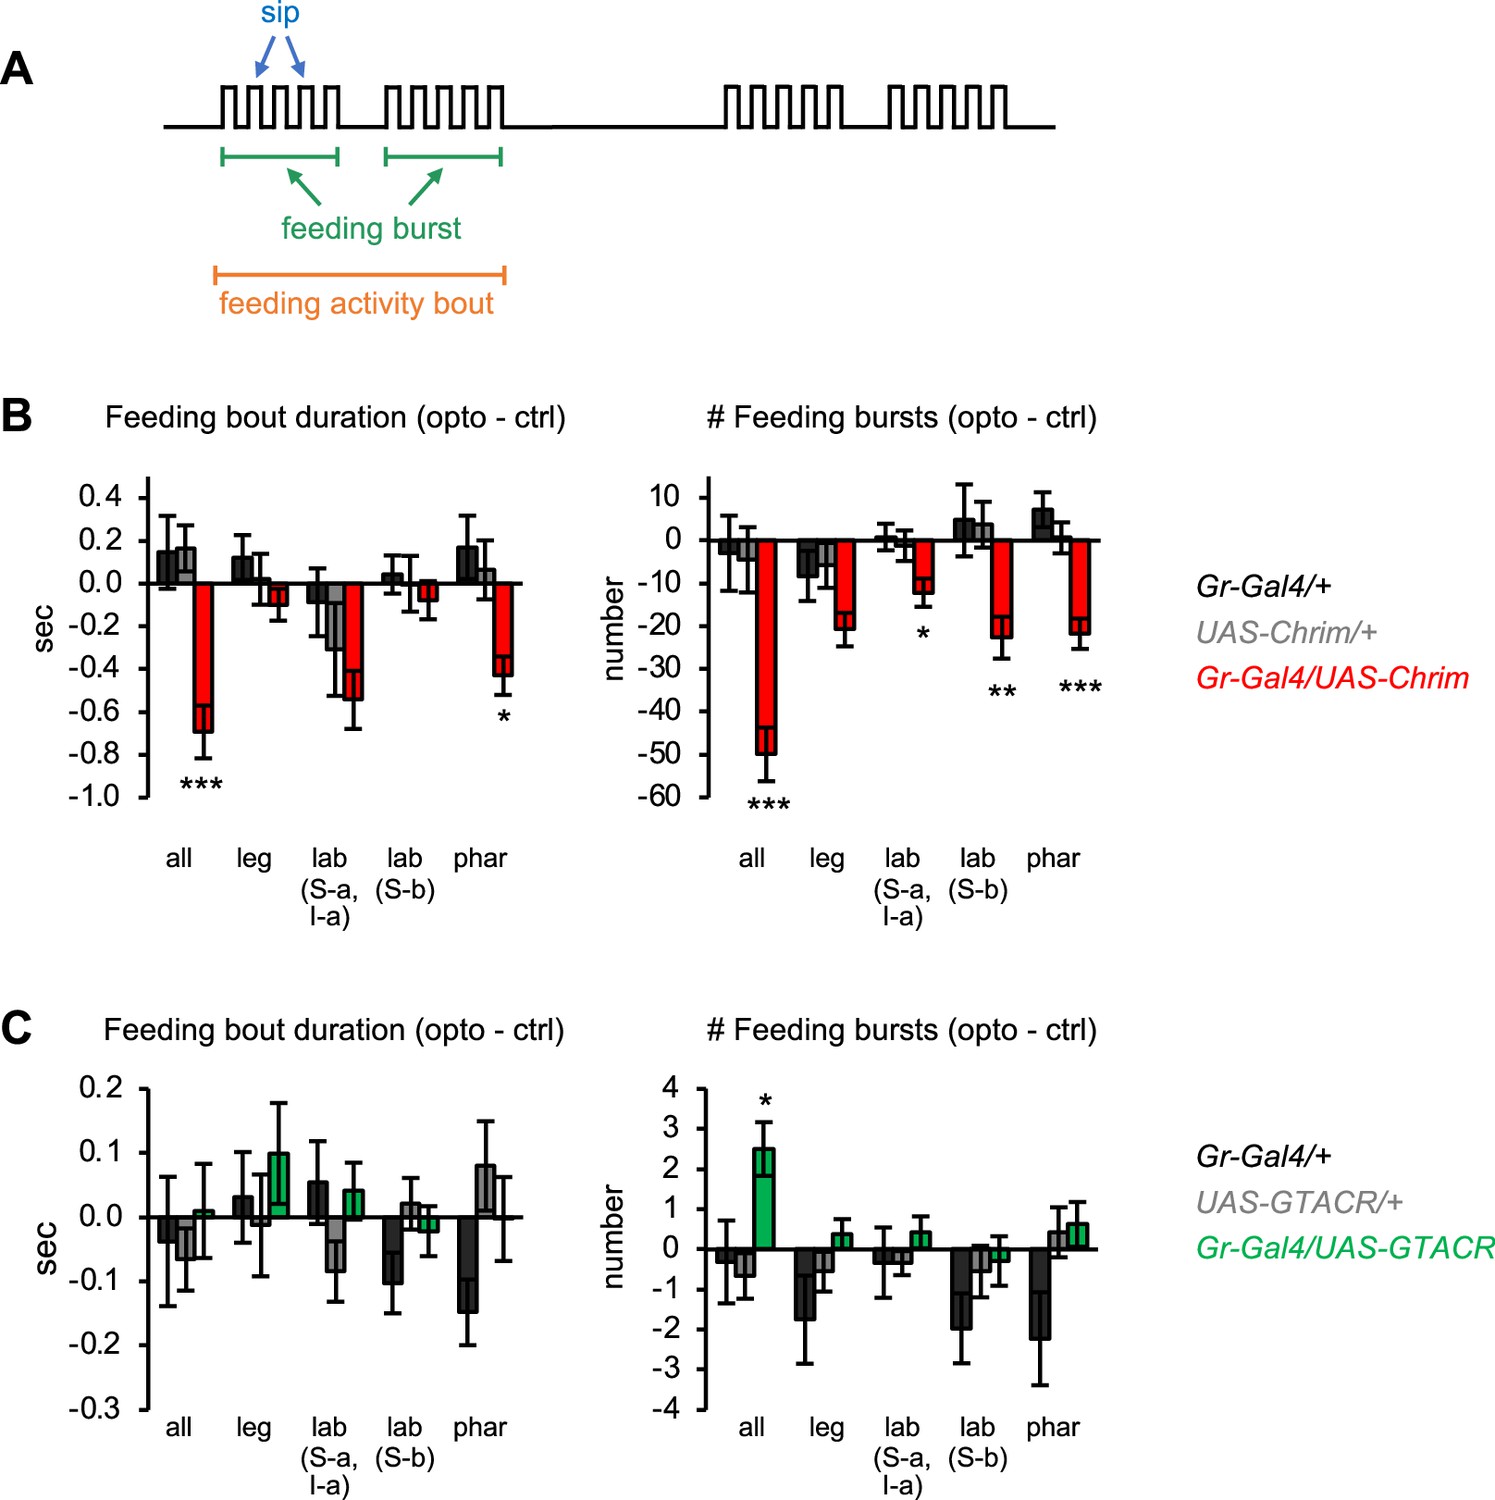
Additional characterization of the effects of bitter neuron manipulations on feeding.
(A) Schematic of the microstructure of fly feeding behavior, as defined in Itskov et al., 2014. Feeding activity bouts are periods of time when the fly is frequently interacting with the food, while sips represent individual food contacts. Feeding bouts may contain feeding bursts, defined as three or more consecutive sips separated by inter-burst intervals smaller than double the median inter-sip interval. (B–C) Effects of bitter neuron activation (B) or silencing (C) on parameters not shown in Figure 2: duration of individual feeding bouts (left) and number of feeding bursts (right). These data are derived from the same experiments shown in Figure 2 (n=40–62 flies). Bar graphs show the difference in each parameter between the control and opto stim food for each genotype. Experimental effects not labeled with an asterisk are not significant. Gal4 lines used were Gr33a-Gal4 (all bitter neurons), Gr58c-Gal4 (leg), Gr59c-Gal4 (labellum, S-a + I-a), Gr22f-Gal4 (labellum, S-b), and Gr9a-Gal4 (pharynx).
Figure 3 with 2 supplements
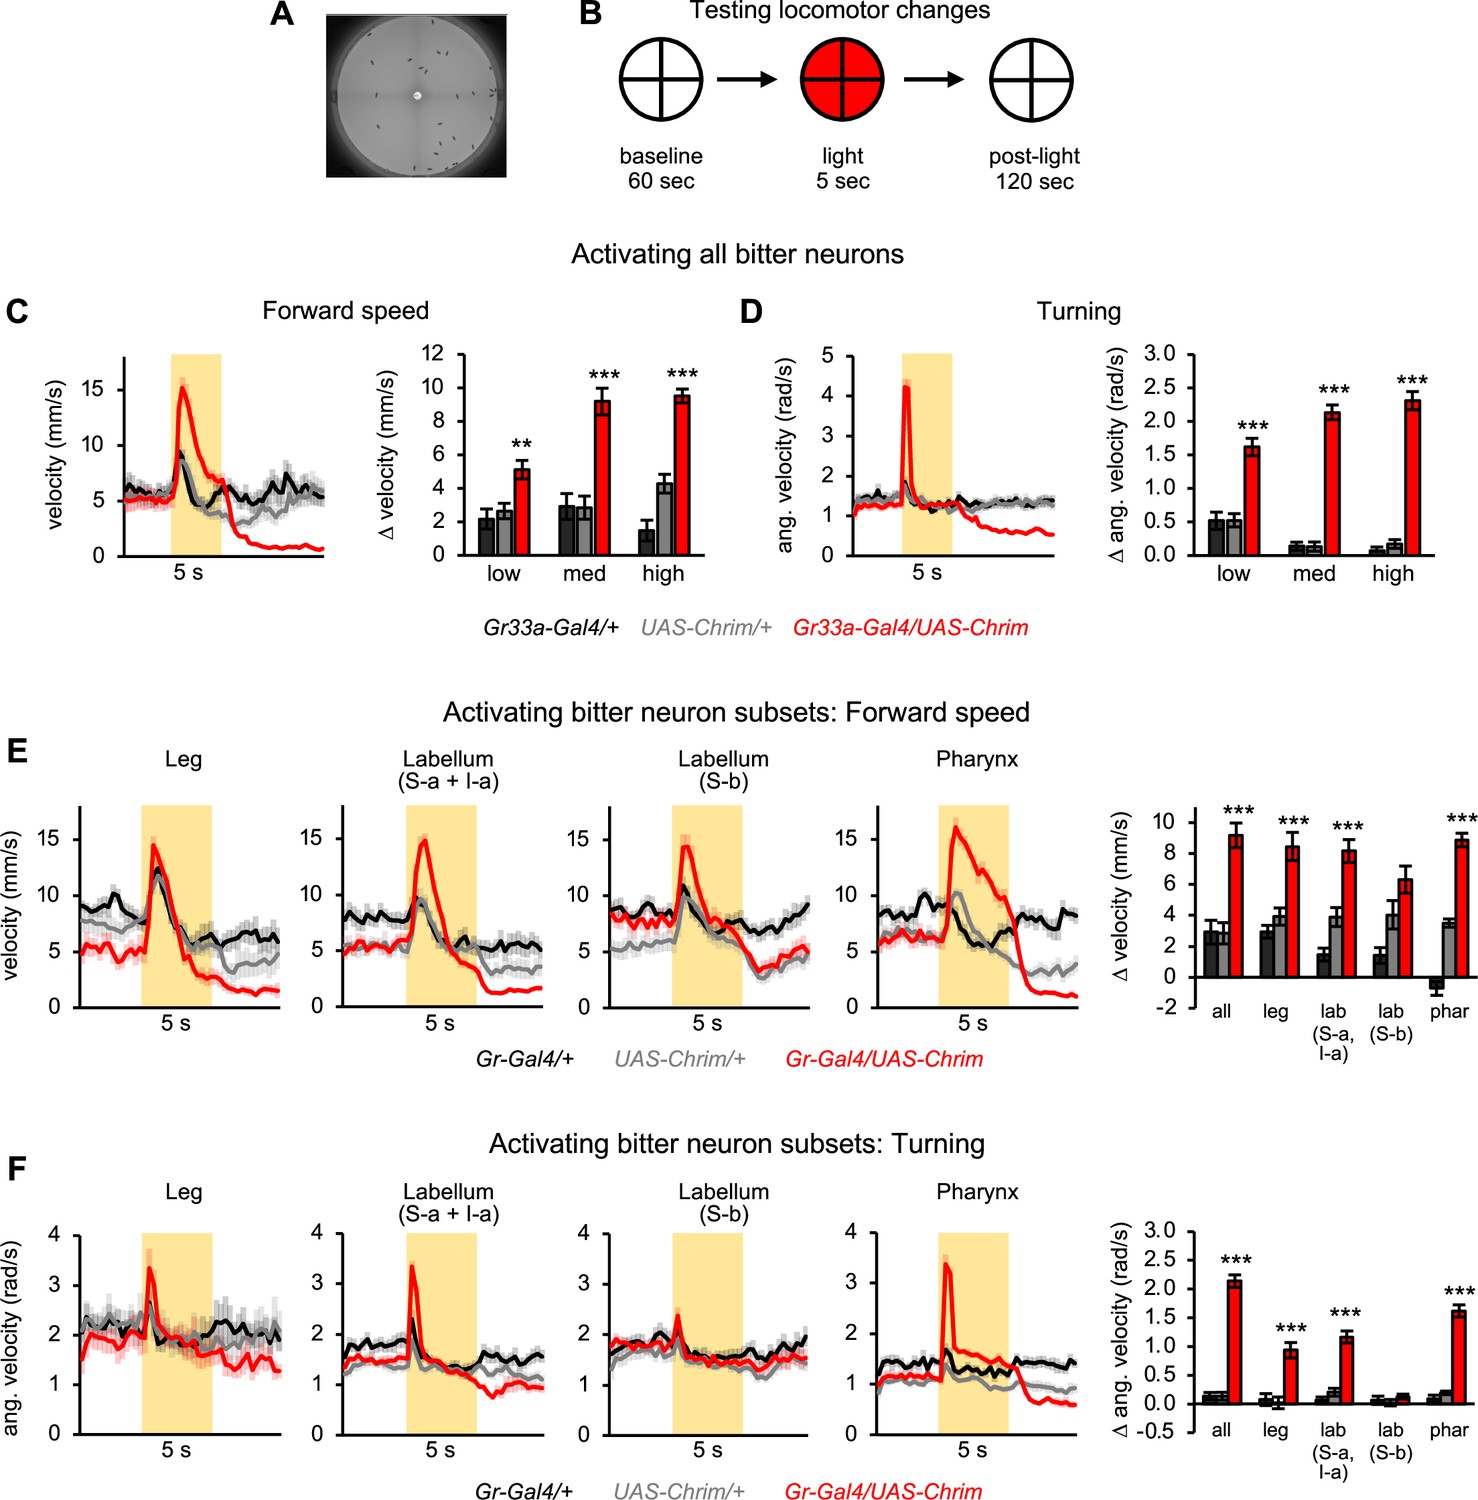
Bitter neuron subsets in three different organs elicit similar effects on locomotion.
(A) Arena used for tracking flies during optogenetic activation. (B) Schematic of protocol to test the effect of bitter neuron activation on locomotion. 5 s light stimulation was used at three different light intensities (low, medium, high). (C–D) Locomotor effects elicited by activating all bitter-sensing neurons using Gr33a-Gal4 (n=11–12 trials). Left graphs show forward (C) and angular (D) velocity over time for medium light intensity (shading indicates light on). Bar graphs quantify the change in these parameters at light onset. (E–F) Locomotor effects elicited by activating bitter neuron subsets with medium intensity light (n=10–12 trials). Effects of other light intensities are shown in Figure 3—figure supplement 2. Traces show forward (E) or angular (F) velocity over time (shading indicates light on). Bar graphs quantify the change in these parameters at light onset. Gal4 lines used were Gr33a-Gal4 (all bitter neurons), Gr58c-Gal4 (leg), Gr59c-Gal4 (labellum, S-a + I-a), Gr22f-Gal4 (labellum, S-b), and Gr9a-Gal4 (pharynx). Experimental effects not labeled with an asterisk are not significant.
Figure 3—figure supplement 1

Additional characterization of locomotor effects elicited by activating all bitter neurons.
(A) Fraction of flies moving when all bitter neurons were activated using Gr33a-Gal4 (n=11–12 trials). Traces show behavior with medium intensity light stimulation. Bar graphs show change in behavior at light onset. (B) Locomotor suppression following activation of all bitter neurons (n=11–12 trials). Post-light locomotor suppression persists for nearly a minute. Line graph shows velocity during the first 60 s (blue shading) after 5 s stimulation with medium intensity light (yellow shading); this is the same experiment as shown in Figure 3C–D (n=11–12 trials). (C–D) Locomotor effects elicited by activating all bitter-sensing neurons with 50 Hz pulsed light (n=5–6 trials). Left graphs show forward (C) and angular (D) velocity over time for medium light intensity (shading indicates light on). Bar graphs quantify the change in these parameters at light onset.
Figure 3—figure supplement 2

Additional characterization of locomotor effects elicited by subsets of bitter neurons.
(A) Change in forward speed (top) or turning (bottom) elicited by low or high intensity light stimulation (n=10–12 trials). Results for medium intensity stimulation are shown in Figure 3E–F. (B) Quantification of locomotor suppression elicited by the offset of optogenetic stimulation at each light intensity (n=10–12 trials). For all panels, Gal4 lines used were Gr33a-Gal4 (all bitter neurons), Gr58c-Gal4 (leg), Gr59c-Gal4 (labellum, S-a + I-a), Gr22f-Gal4 (labellum, S-b), and Gr9a-Gal4 (pharynx).
Figure 4 with 2 supplements
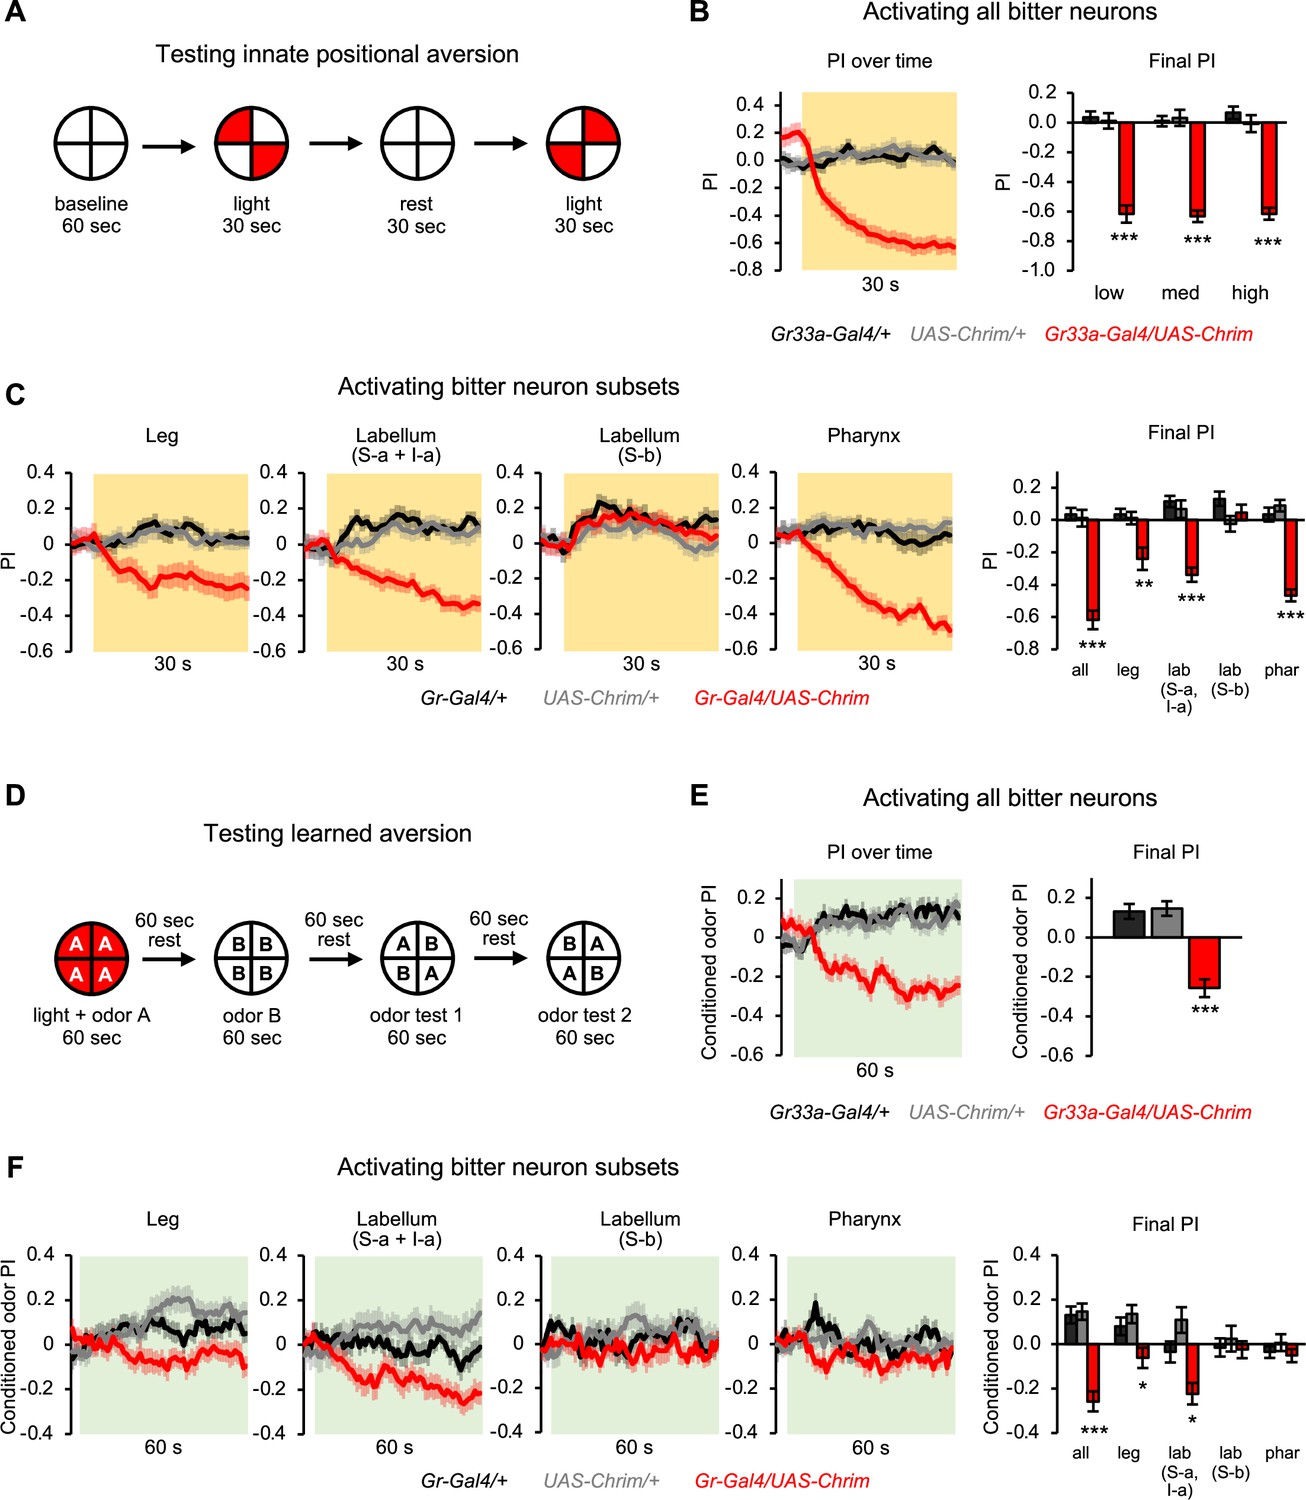
Subsets of bitter neurons in multiple organs elicit innate and learned aversion.
(A) Protocol to test the effect of bitter neuron activation on innate positional aversion. (B–C) Effect of activating all bitter-sensing neurons (B) or subsets of bitter neurons (C) on innate aversion (n=20–24 trials, 10–12 sets of flies). Light preference is quantified by the preference index (PI): (# flies in light quadrants – # flies in non-light quadrants)/total # flies. Negative values indicate aversion. Line graphs show the PI over 30 s of low intensity light stimulation (shading indicates light on), including both of the sequential test periods when the lighted quadrants were switched. Flies may appear to show a positive PI before light onset because of the repeated tests: after the first test they continue to avoid the previously illuminated quadrants until the next test. Bar graphs show the final PI (average over last 5 s of light presentation) for each genotype at all light intensities (B) or low light intensity (C). Effects of bitter neuron subsets at other light intensities are shown in Figure 4—figure supplement 2. (D) Protocol to test the effect of bitter neuron activation on learned odor aversion. (E–F) Effects of activating all bitter-sensing neurons (E) or subsets of bitter neurons (F) on learned aversion (n=20–24 trials, 10–12 sets of flies). Learned preference was quantified as the PI for the conditioned odor during the test periods, calculated as: (# flies in CS+ quadrants – # flies in CS- quadrants)/total # flies. Negative values indicate aversion. Data from odor tests 1 and 2 are combined. Line graphs show the conditioned odor PI during the odor test periods (shading indicates odors on). Bar graphs show the final PI (average over last 5 s of test) for each genotype. In all panels, experimental effects not labeled with an asterisk are not significant, and Gal4 lines used were Gr33a-Gal4 (all bitter neurons), Gr58c-Gal4 (leg), Gr59c-Gal4 (labellum, S-a + I-a), Gr22f-Gal4 (labellum, S-b), and Gr9a-Gal4 (pharynx). Figure 4A has been adapted from Figure 2A from Aso et al., 2014b and Figure 4D has been adapted from Figure 1D from Aso and Rubin, 2016.
Figure 4—figure supplement 1
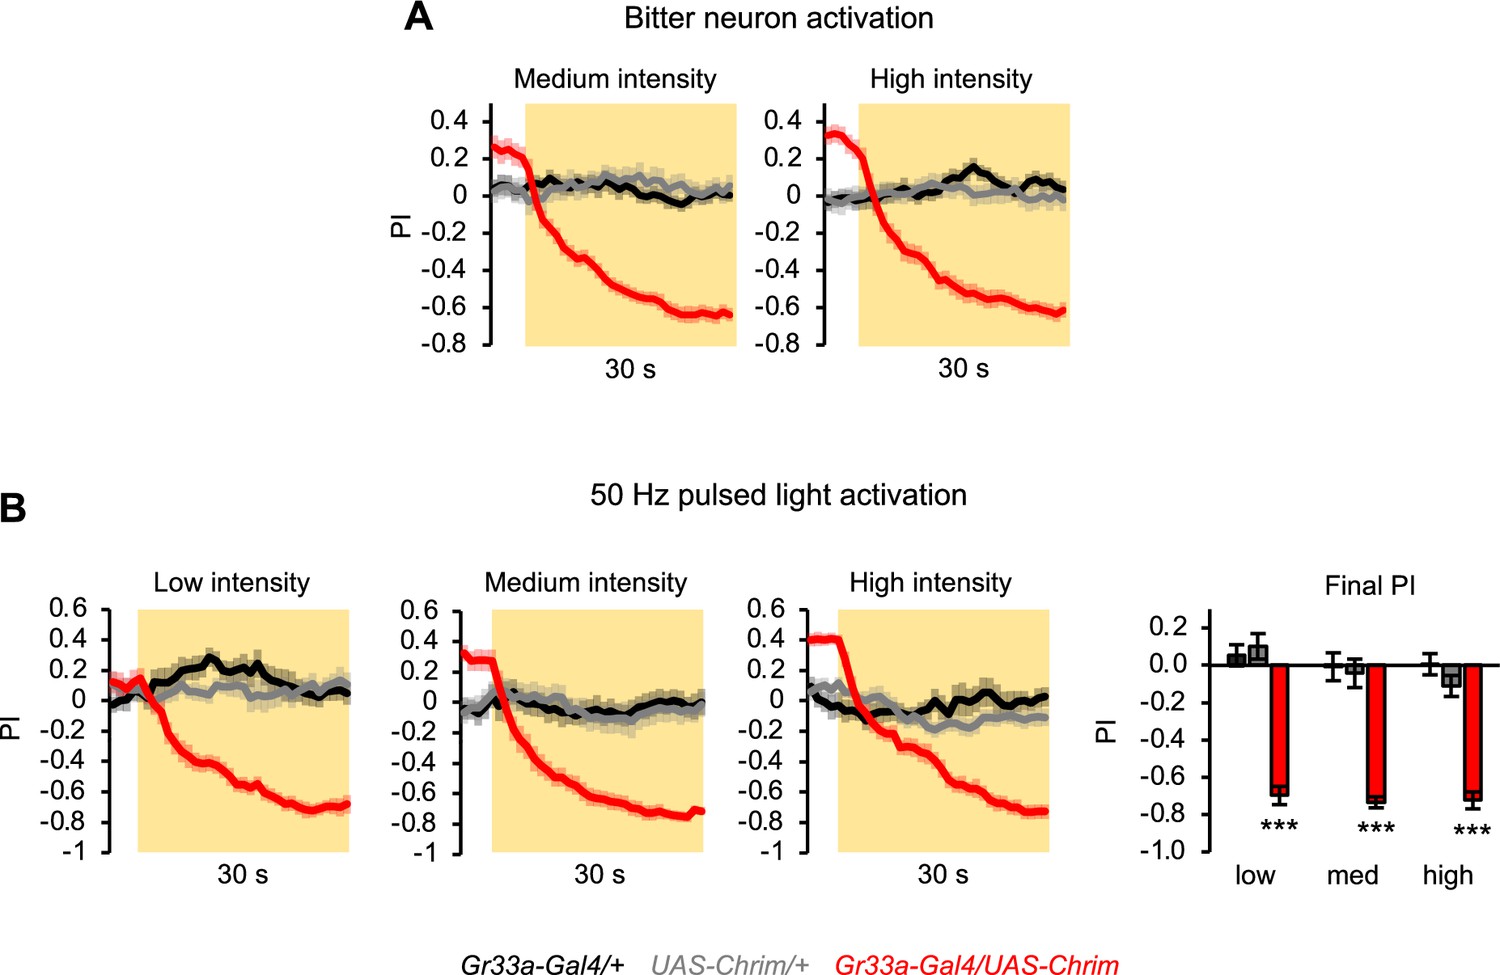
Additional characterization of innate aversion elicited by activating all bitter neurons.
(A) Innate positional aversion elicited by the activation of all bitter-sensing neurons at medium or high light intensity (n=22–24 trials, 11–12 sets of flies). Traces for low light intensity and statistical analysis of final preference index (PI) values are shown in Figure 4B. (B) Innate aversion elicited by activating all bitter neurons with 50 Hz pulsed light (n=10–12 trials, 5–6 sets of flies). In all panels, Gr33a-Gal4 was used to activate all bitter-sensing neurons.
Figure 4—figure supplement 2
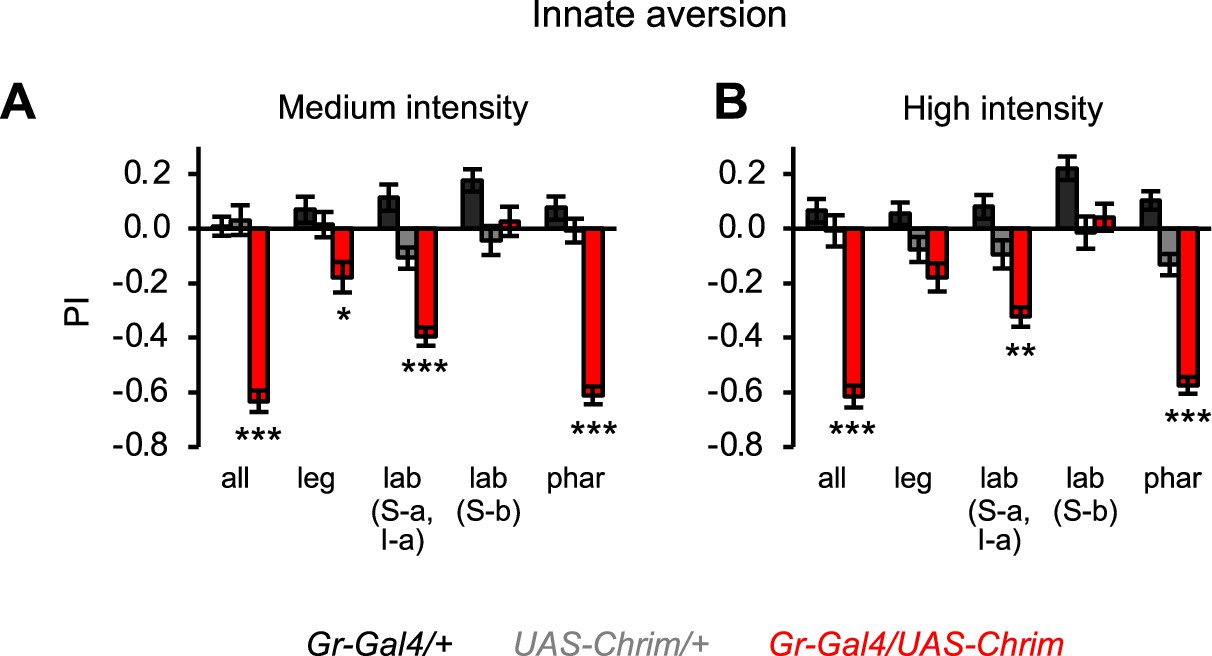
Effects of bitter neuron subsets on innate positional aversion at other light intensities.
Graphs show the preference index (PI) during the last 5 s of light presentation at medium (A) or high (B) light intensity (n=20–24 trials, 10–12 sets of flies). The effect of low intensity light is shown in Figure 4C. Experimental effects not labeled with an asterisk are not significant. Gal4 lines used were Gr33a-Gal4 (all bitter neurons), Gr58c-Gal4 (leg), Gr59c-Gal4 (labellum, S-a + I-a), Gr22f-Gal4 (labellum, S-b), and Gr9a-Gal4 (pharynx).
Figure 5
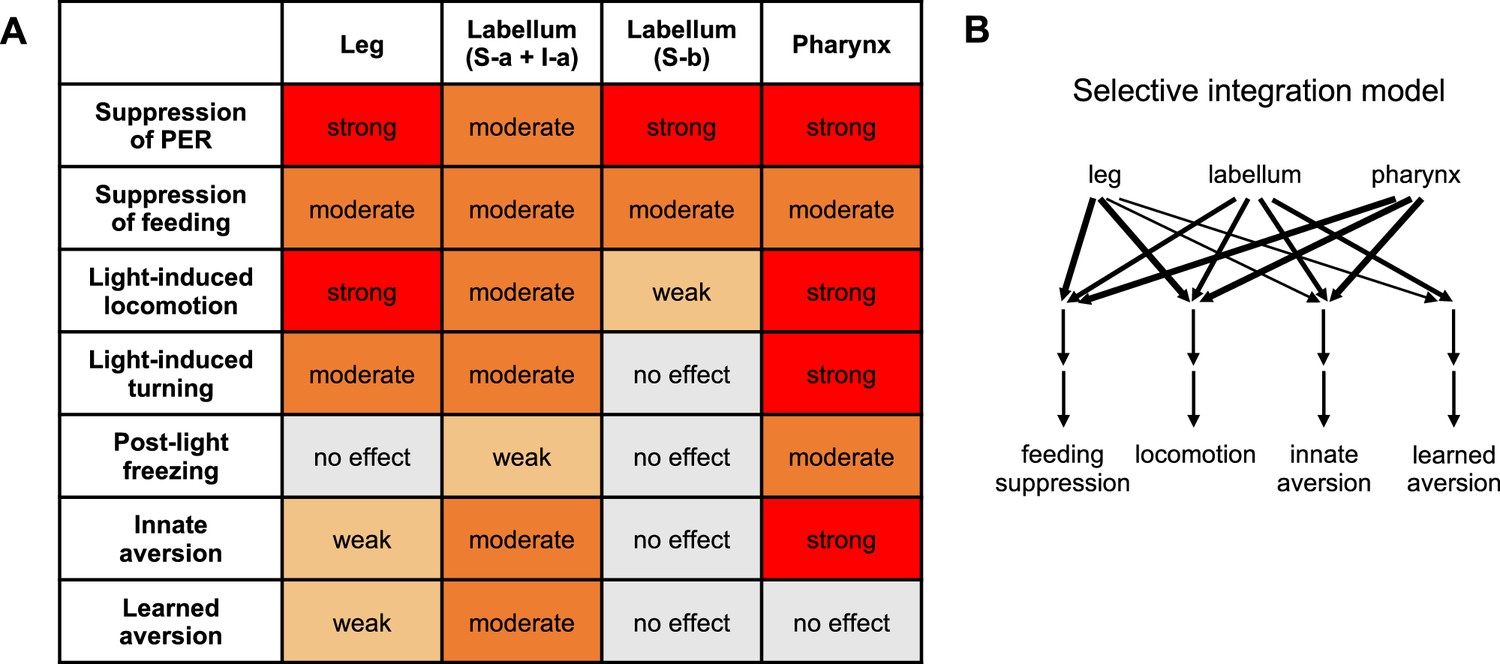
Summary of behavioral effects elicited by optogenetic activation of bitter neuron subsets.
(A) Effects are color-coded by strength, relative to the effect of activating all bitter neurons with Gr33a-Gal4. All observed effects went in the same direction. See Materials and methods for details of how effects were quantified. Note that the ‘moderate’ effect of all subsets on feeding is primarily due to the fact that flies consumed less of the control food compared to activating all bitter neurons (leading to a smaller difference between control and opto stim), but all subsets exerted an almost complete suppression of feeding. (B) Model for how different inputs contribute to different types of behavior. Line widths represent the strength of the effect (weak, moderate, or strong). For simplicity, we are only defining four behavioral categories: feeding suppression includes both feeding and proboscis extension response (PER) experiments, and locomotion includes the three measures shown in the table. The strongest effect for each category was used. Results with I-a + S-a neurons (not S-b) were used to interpret the role of the labellum, since positive results are more informative than negative results. Source data is provided for the table in Figure 5A.
-
Figure 5—source data 1
Summary of behavioral effects elicited by optogenetic activation of bitter neuron subsets.
- https://cdn.elifesciences.org/articles/84856/elife-84856-fig5-data1-v1.xlsx
Figure 6 with 1 supplement
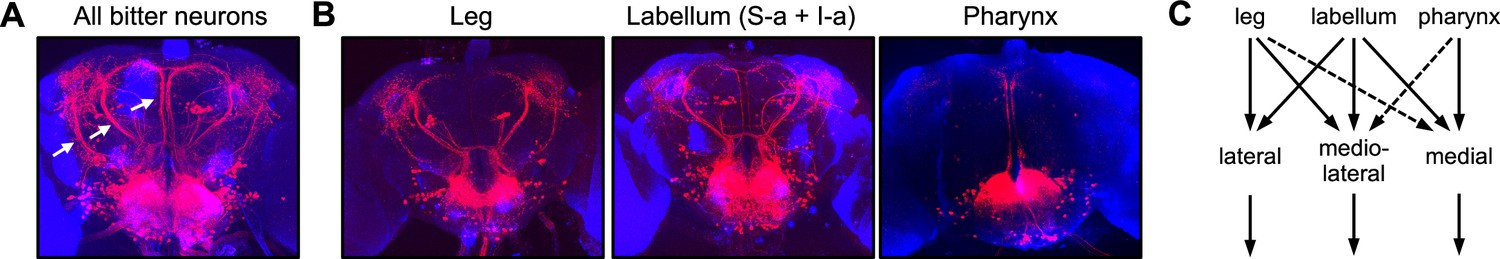
Bitter inputs from different organs are relayed to overlapping downstream pathways.
(A) The entire population of second-order bitter neurons was labeled by trans-Tango tracing from Gr33a-Gal4-expressing cells. Arrows denote the three major tracts (lateral, mediolateral, and medial) projecting out of the subesophageal zone (SEZ) to the dorsal brain. (B) Neurons postsynaptic to specific bitter neuron subsets were labeled with trans-Tango. Gal4 lines used were Gr58c-Gal4 (leg), Gr59c-Gal4 (labellar S-a + I-a), and Gr9a-Gal4 (pharynx). Tracing from labellar S-b cells labeled by Gr22f-Gal4 yielded very weak trans-Tango staining that could not be interpreted, so it is not shown here. (C) Summary of inputs from different subsets of bitter neurons onto second-order projection pathways. Dotted lines indicate weak input based on weak or inconsistent trans-Tango staining. See Figure 6—figure supplement 1 for additional trans-Tango images that include presynaptic Gal4 expression.
Figure 6—figure supplement 1
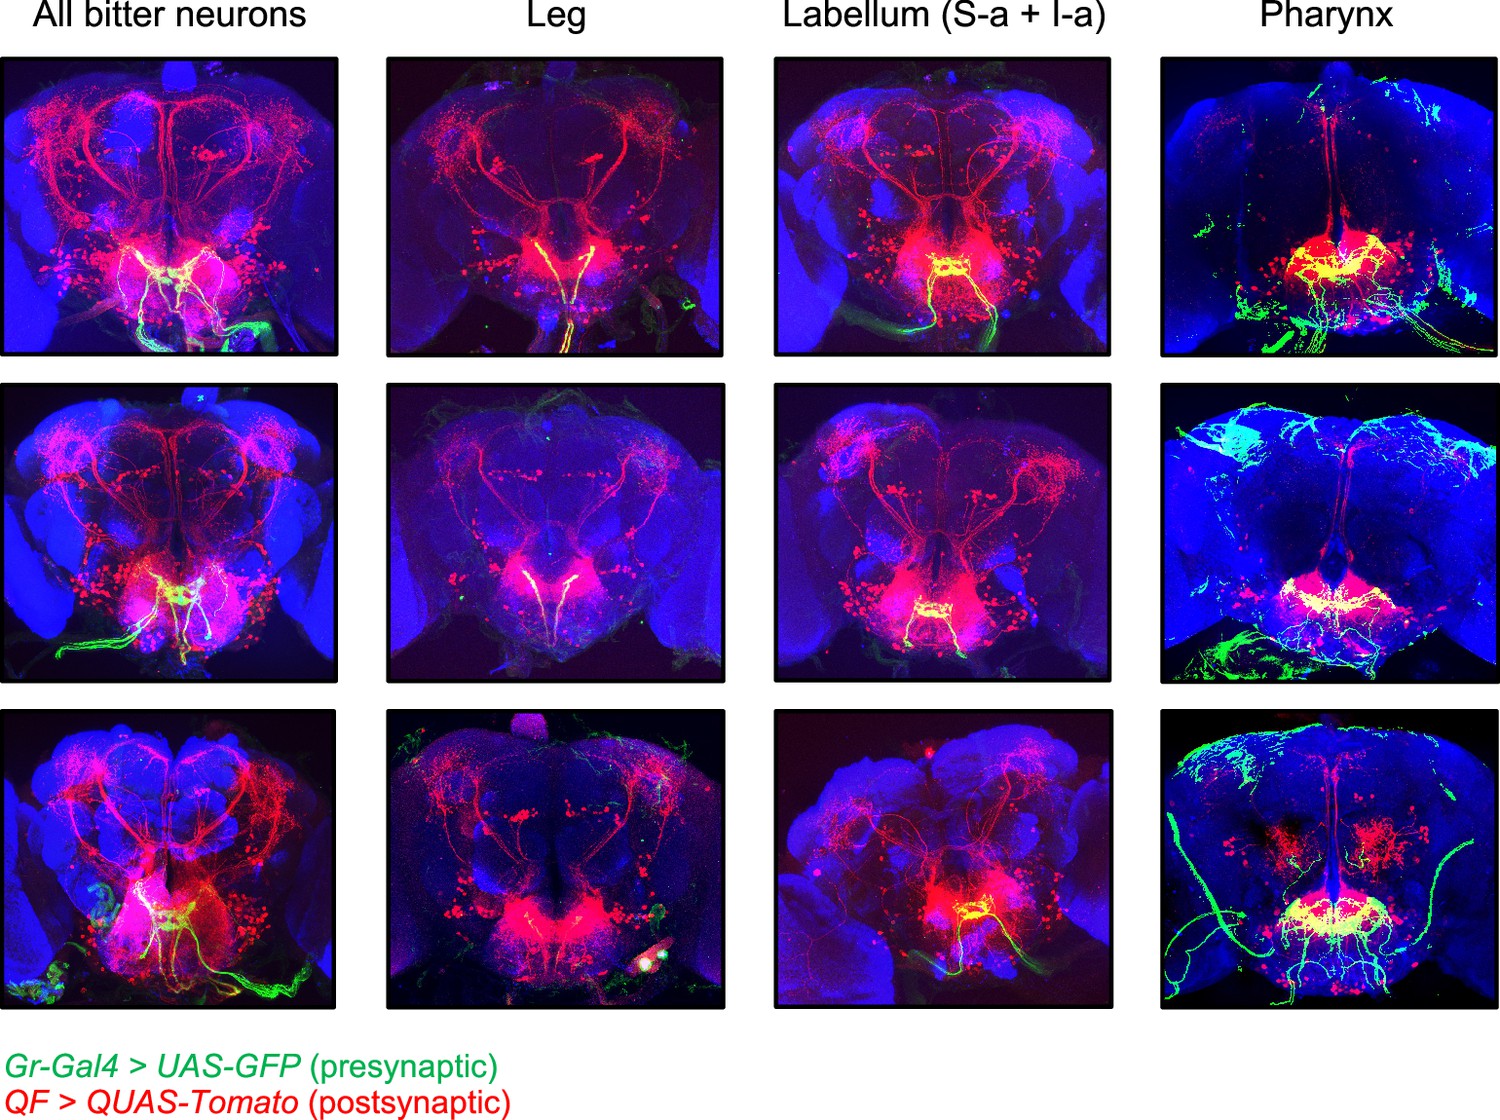
Additional images of trans-Tango labeling.
Additional images of trans-Tango labeling, with presynaptic bitter-sensing neurons labeled in green and postsynaptic second-order neurons labeled in red. The top row represents the same brains shown in Figure 6, but with presynaptic green staining included. The bottom two rows show additional examples for each genotype. In some cases brain slices at the anterior or posterior edges are not included for certain channels if there was nonspecific staining impeding the visualization of labeled cells, but all slices with neuronal labeling are shown. Note that green staining outside of the subesophageal zone (SEZ) with Gr9a-Gal4 does not represent neuronal projections but rather nonspecific staining at the surface of the brain, due to issues with the immunostaining protocol. trans-Tango labeling of neurons innervating the antennal lobe was observed in a small number of brains with Gr9a-Gal4 (e.g., bottom example) and was correlated with the presence of a presynaptic projection in the antennal lobe.
Figure 7 with 2 supplements
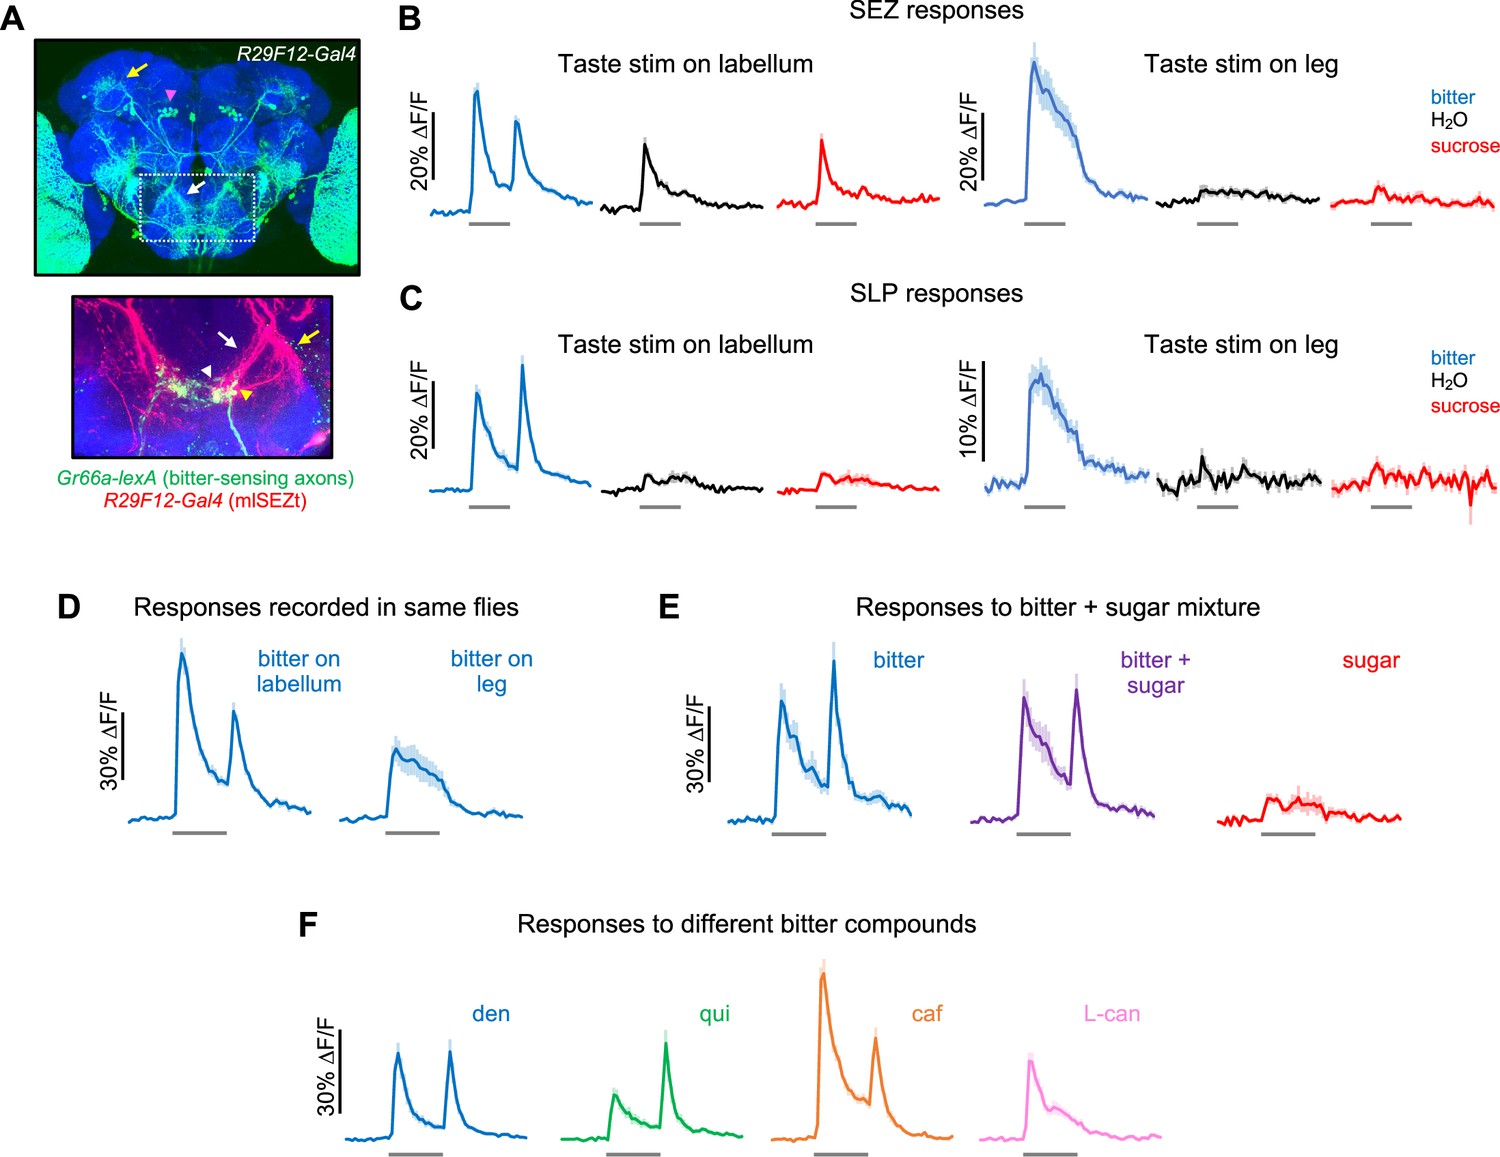
Second-order mlSEZt bitter neurons receive input from multiple organs.
(A) Top: R29F12-Gal4 expression pattern (maximum intensity projection created from images generated by the Janelia FlyLight Project Team). Brain slices at the far anterior and posterior edges are not included to maximize visibility of mlSEZt cells. Pink arrowhead shows mlSEZt cell bodies; white and yellow arrows show mlSEZt projections in the subesophageal zone (SEZ) and superior lateral protocerebrum (SLP), respectively. Box depicts approximate area of the SEZ shown in the bottom image. Bottom: SEZ image with mlSEZt neurons (R29F12-Gal4 driving UAS-TdTomato, red) colabeled with bitter-sensing neurons (Gr66a-lexA driving lexAop-GCaMP6f, green). Medial and lateral branches of the mlSEZt projections are denoted by white and yellow arrows, respectively. Based on morphology, most of the visible bitter sensory projections likely arise from the labellum (white arrowhead); bitter axons from the leg have a stick-like projection just lateral to the labellar projections (yellow arrowhead). (B–F) GCaMP responses of mlSEZt neurons. R29F12-Gal4 was used to drive UAS-GCaMP6f. For all imaging traces, the gray bar denotes 5 s taste presentation. Unless otherwise specified, the bitter stimulus was 10 mM denatonium and the sugar stimulus was 100 mM sucrose. (B–C) GCaMP responses of mlSEZt projections in the SEZ (B) or SLP (C) with taste stimuli applied to the labellum (left) or foreleg (right). Response magnitudes across these four conditions are not directly comparable because they include different sets of flies. (B) n=15–22 trials, 4 flies (labellar stimulation); n=15–19 trials, 4 flies (leg stimulation). (C) n=25–34 trials, 7 flies (labellar stimulation); n=12–19 trials, 3–4 flies (leg stimulation). (D) Responses of mlSEZt projections in the SEZ to labellar or tarsal bitter stimulation imaged in the same flies (n=11–14 trials, 3 flies). (E) Responses of mlSEZt projections in the SLP when sugar, bitter, or a sugar-bitter mixture was applied to the labellum (n=16 trials, 4 flies). (F) Responses of mlSEZt projections in the SLP when different bitter compounds were applied to the labellum (n=22–23 trials, 6 flies).
Figure 7—figure supplement 1
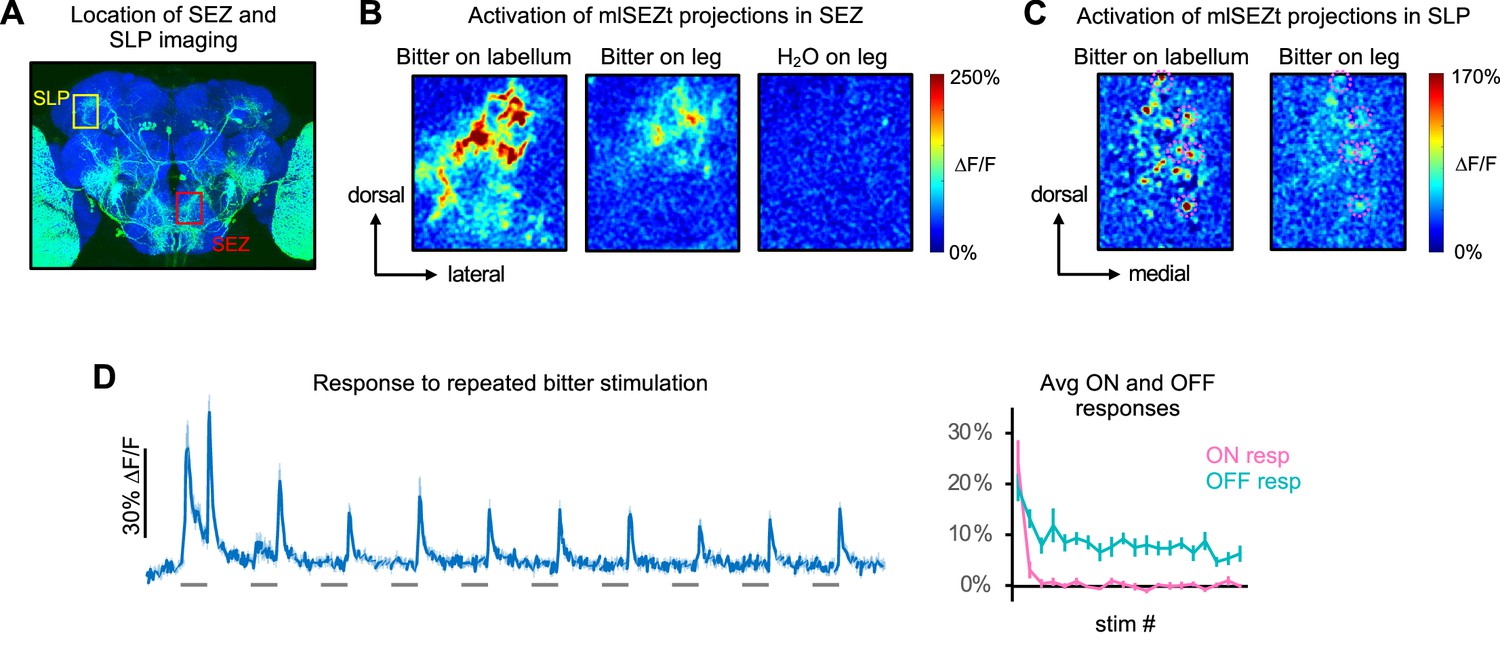
Further characterization of mlSEZt responses.
(A) Image of R29F12-Gal4 expression (same image as Figure 7A) showing the approximate location of subesophageal zone (SEZ) and superior lateral protocerebrum (SLP) imaging examples in panels B and C, respectively. (B) Heatmaps of areas in the SEZ activated by labellar or tarsal stimulation. A single hemisphere was imaged. Response to H2O is shown as a negative control. (C) Heatmaps of areas in the SLP activated by labellar or tarsal stimulation. Pink dotted circles denote individual puncta activated by both organs. (D) Responses of mlSEZt neurons to repeated bitter stimulation at 10 s intervals (n=7 experiments, 5 flies). Left: GCaMP trace. Right: average ON and OFF responses for each stimulus repetition. Bitter was applied to the labellum and SLP projections were imaged. In panels B–D, R29F12-Gal4 was used to drive UAS-GCaMP6f and 10 mM denatonium was used as the bitter stimulus.
Figure 7—figure supplement 2
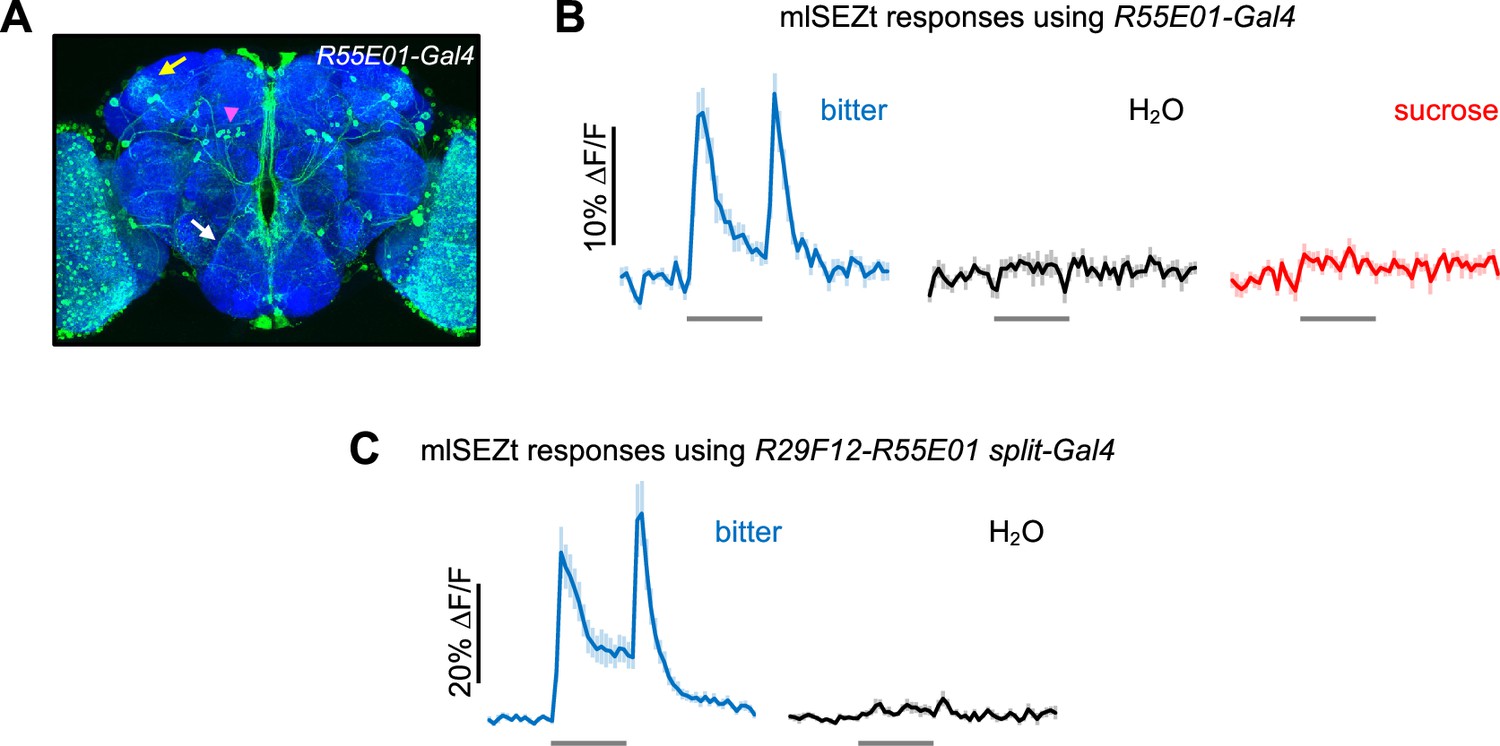
Responses of mlSEZt cells labeled by R55E01-Gal4 and R29F12-R55E01 split-Gal4.
(A) R55E01-Gal4 expression pattern (maximum intensity projection created from images generated by the Janelia FlyLight Project Team). Brain slices at the far anterior and posterior edges are not included in order to maximize visibility of mlSEZt cells. Pink arrowhead shows mlSEZt cell bodies; white and yellow arrows show their projections in the subesophageal zone (SEZ) and superior lateral protocerebrum (SLP), respectively. (B) Taste responses of mlSEZt projections in the SLP using R55E01-Gal4 driving UAS-GCaMP6f (n=12 trials, 3 flies). (C) Taste responses of mlSEZt projections in the SEZ using the split-Gal4 (R29F12-AD; R55E01-DBD) to drive UAS-GCaMP6f (n=10–15 trials, 3 flies). In panels B–C, tastants were applied to the labellum and 10 mM denatonium was used as the bitter stimulus.
Figure 8 with 3 supplements
Second-order mlSEZt neurons regulate a subset of taste-related behaviors.
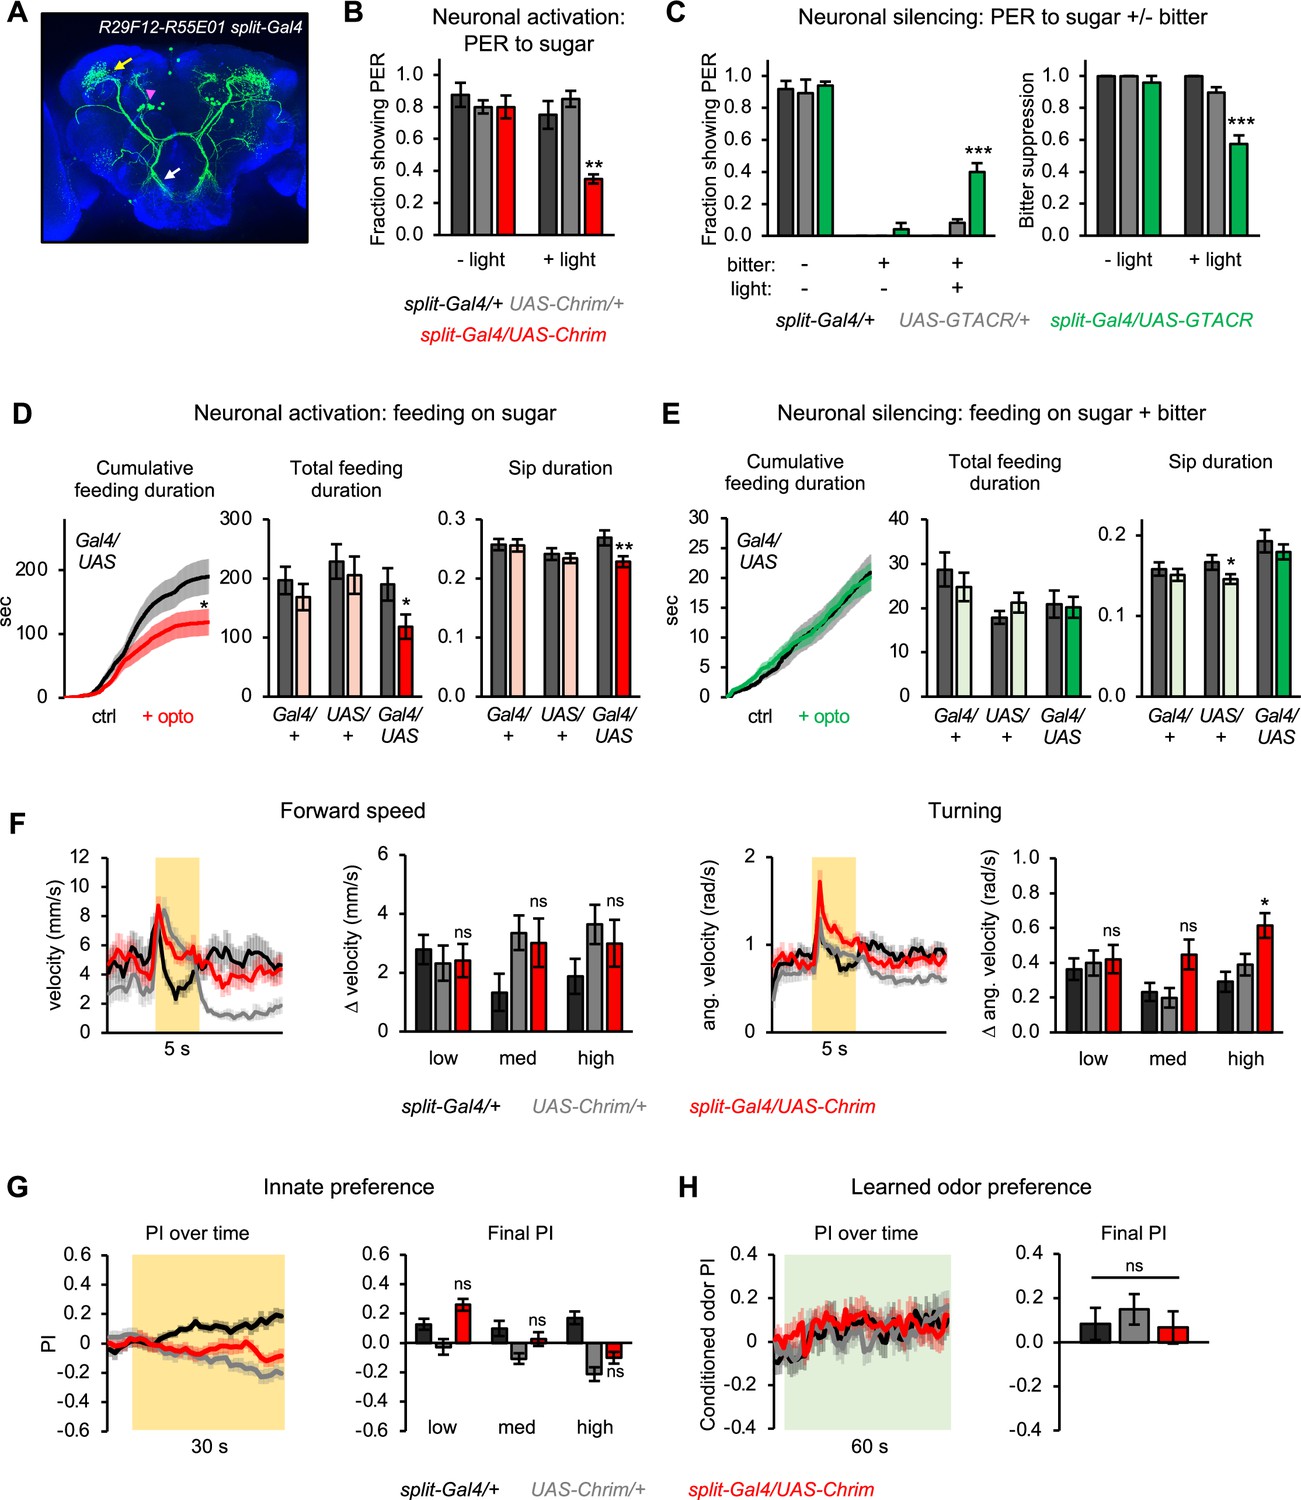
(A) Expression pattern of split-Gal4 line (R29F12-AD+R55E01-DBD) labeling mlSEZt neurons with high specificity. Pink arrowhead shows mlSEZt cell bodies; white and yellow arrows denote their projections in the subesophageal zone (SEZ) and superior lateral protocerebrum (SLP), respectively. (B–H) mlSEZt neurons were activated or silenced using R29F12-R55E01 split-Gal4 driving UAS-Chrimson or UAS-GTACR, respectively. (B) Effect of activating mlSEZt neurons on proboscis extension response (PER) to 50 mM sucrose (n=4 experiments, 40 flies). (C) Effect of silencing mlSEZt neurons on bitter suppression of PER, tested by adding 10 mM quinine to 50 mM sucrose (n=5 experiments, 46–50 flies). Left graph shows PER in each condition (3 of the 9 conditions produced zero PER, so bars are at zero with zero error). Right graph shows the degree of bitter suppression based on the left graph, quantified as: 1 – (PER with bitter/PER without bitter). (D–E) Effect of activating (D; n=42–47 flies) or silencing (E; n=66–69 flies) mlSEZt neurons on feeding, as measured over 1 hr in the optoPAD (same setup as shown in Figure 2B and E, respectively). Food sources contained 100 mM sucrose for activation experiments (D) or 50 mM sucrose + 1 mM quinine for silencing experiments (E). Left graphs show cumulative feeding duration on the control and opto stim food sources for experimental flies. Values for the last time point (1 hr) were compared using paired t-tests. Cumulative feeding for controls is shown in Figure 8—figure supplement 1. Bar graphs on the right represent total feeding duration or sip duration on the control versus opto stim food for each genotype. Paired t-tests were used to compare values for control versus opto stim food. Comparisons not labeled with an asterisk are not significant. (F–H) Effects of mlSEZt neuron activation on locomotion (F; n=11–12 trials), innate preference (G; n=22–24 trials, 11–12 sets of flies), and learned odor preference (H; n=14–16 trials, 7–8 sets of flies). Effects of high intensity light stimulation are shown in panels F and G; for other intensities, see Figure 8—figure supplement 2.
Figure 8—figure supplement 1
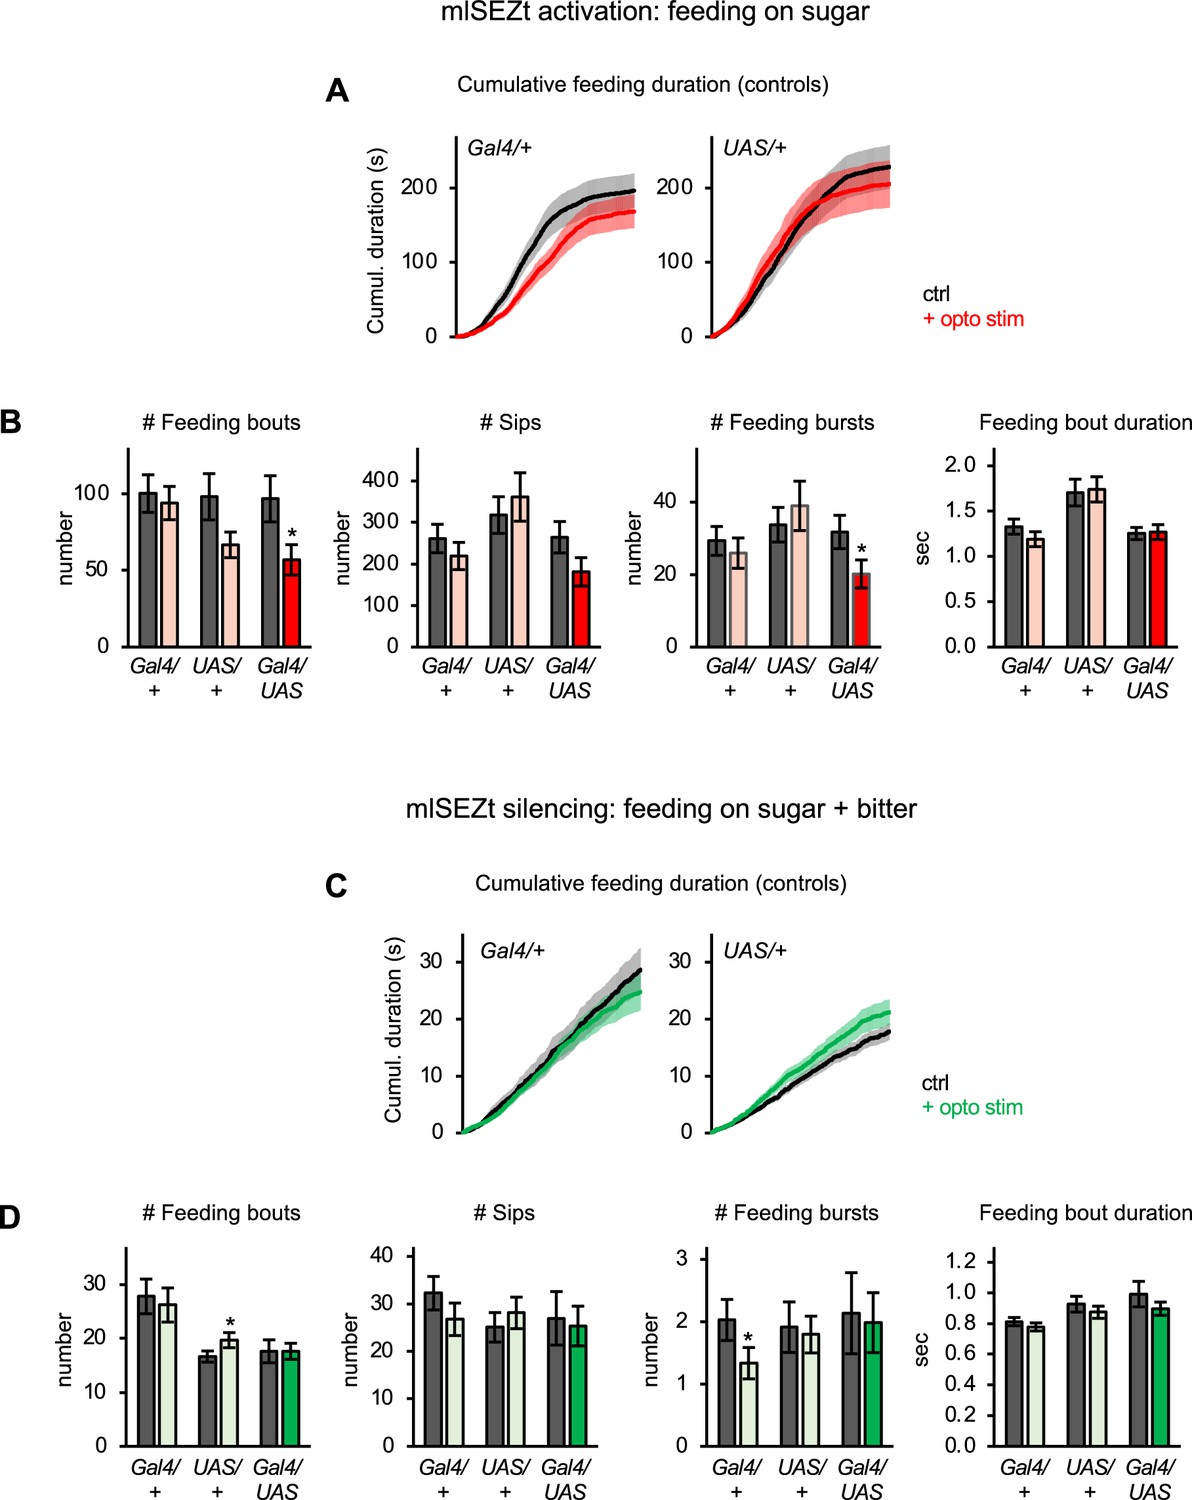
Additional characterization of mlSEZt effects on feeding behavior.
(A–D) Additional characterization of the effects of activating (A–B; n=42–47 flies) or silencing (C–D; n=66–69 flies) mlSEZt neurons. These data are derived from the same experiments shown in Figure 8D–E. (A, C) Cumulative feeding duration on the control and opto stim food sources for control flies. The same plots for experimental flies are shown in Figure 8D–E. (B, D) Effects of mlSEZt activation or silencing on feeding parameters not shown in Figure 8D–E (paired t-tests comparing values for control versus opto stim food). Comparisons not labeled with an asterisk are not significant.
Figure 8—figure supplement 2
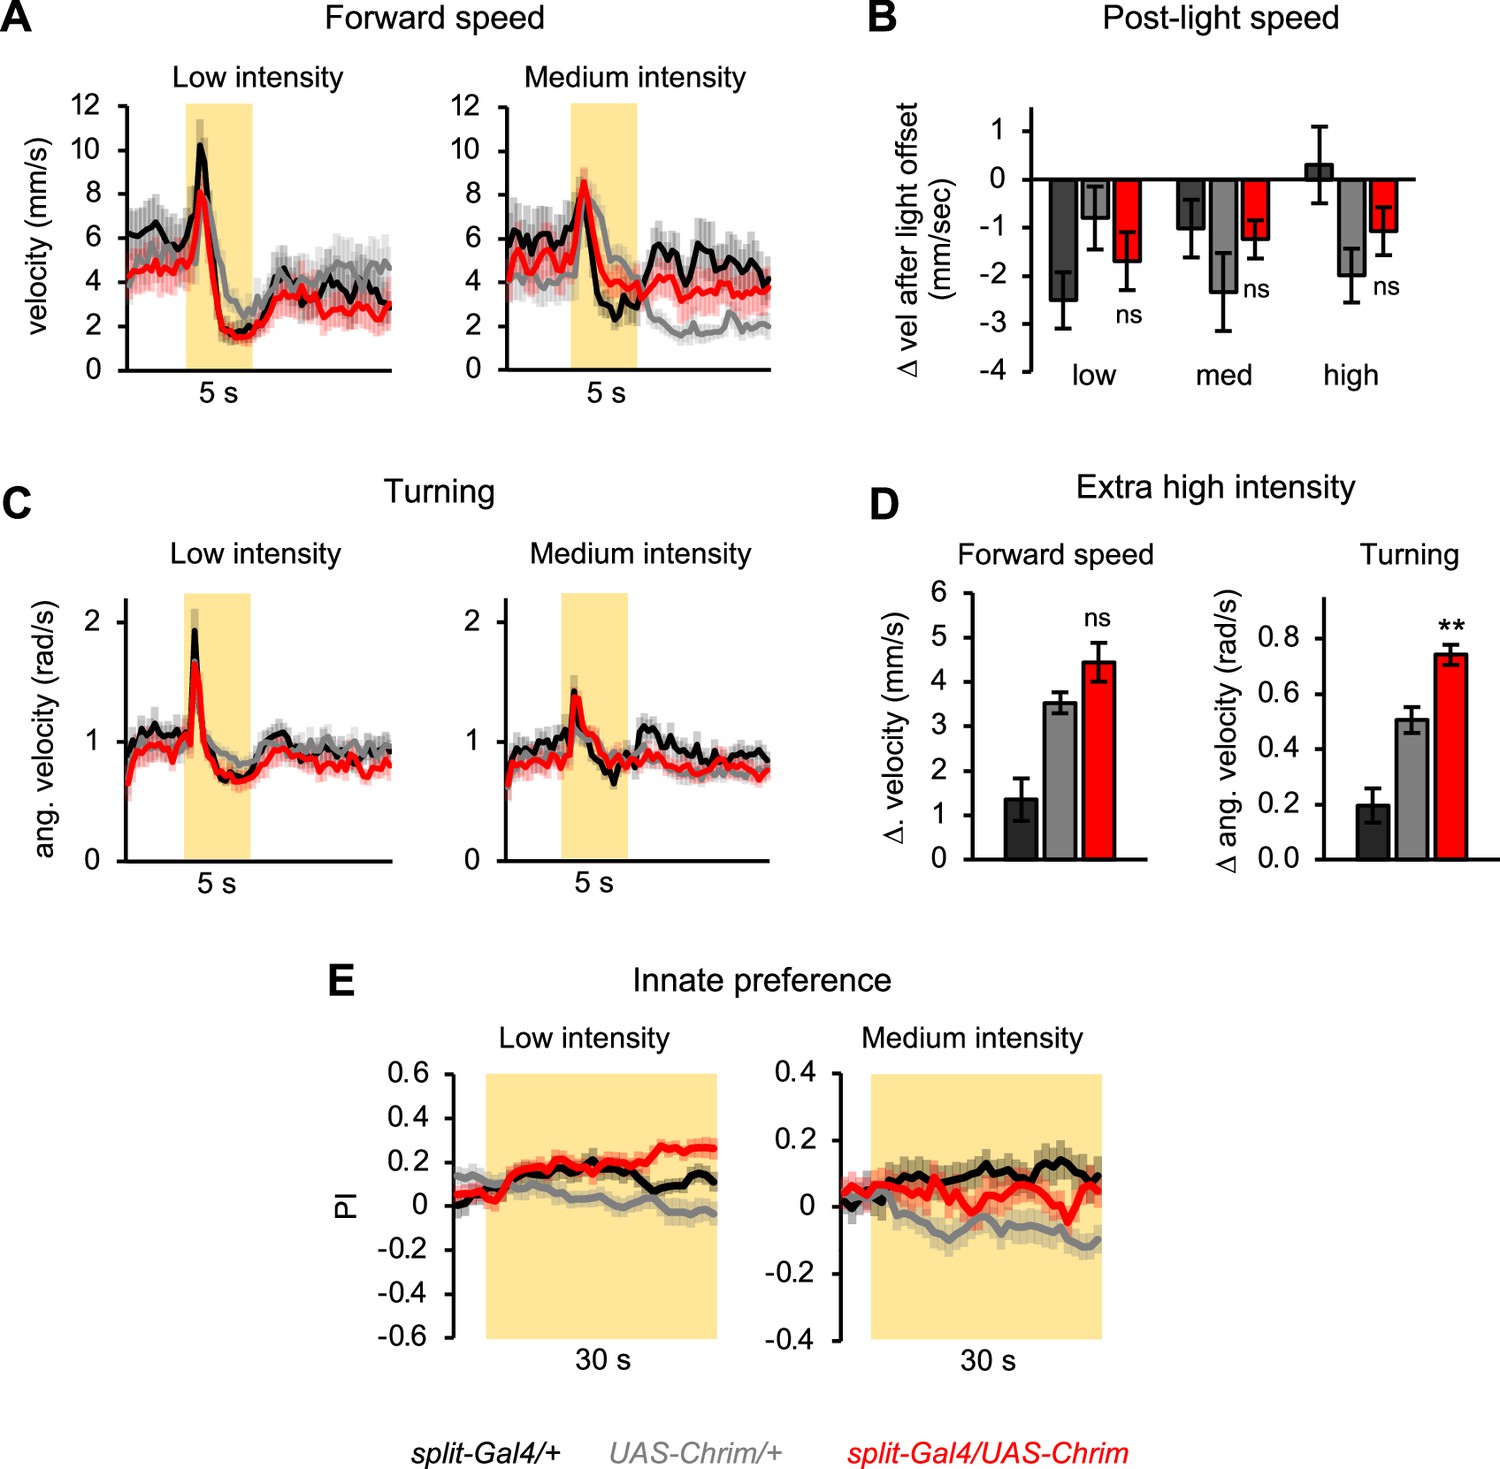
Additional characterization of mlSEZt effects on locomotor and preference behaviors.
(A–D) mlSEZt neurons were activated using R29F12-R55E01 split-Gal4 driving UAS-Chrimson. (A, C) Effects of low and medium intensity light stimulation on forward velocity (A) or turning (C) (n=11–12 trials). Effects of high intensity light are shown in Figure 8F. (B) Quantification of the change in forward velocity at light offset. (D) Locomotor effects using an even higher light intensity (44 µW/mm2) than normally tested (n=12 trials). (E) Innate preference for low and medium intensity light stimulation (n=22–24 trials, 11–12 sets of flies). Preference for high intensity light is shown in Figure 8G.
Figure 8—figure supplement 3

Effects of silencing mlSEZt neurons on locomotor and preference behaviors elicited by bitter neuron activation.
(A–D) Effects of activating bitter-sensing neurons (Gr66a-lexA driving Aop-Chrim) while silencing mlSEZt neurons (mlSEZt split-Gal4 driving UAS-Kir). Flies lacking Aop-Chrim were used as a negative control that should not show effects of bitter activation, and flies lacking either the mlSEZt split-Gal4 or UAS-Kir were used as positive controls that should show the effects of bitter activation without mlSEZt silencing. (A–B) Effect of light stimulation on forward velocity (A) and turning (B) (n=5–11 trials). High intensity stimulation is shown in the line graphs. Bar graphs show change in forward or angular velocity at light onset for each light intensity. (C) Innate preference for light stimulation (n=10–22 trials, 5–11 sets of flies). (D) Conditioned odor preference elicited by light stimulation (n=20 trials, 10 sets of flies). In all panels, no significant effect of mlSEZt silencing is apparent because the experimental group (bitter activation + mlSEZt silencing) does not differ from both positive controls (bitter activation only).
Figure 9 with 2 supplements
Downstream pathways from mlSEZt cells.
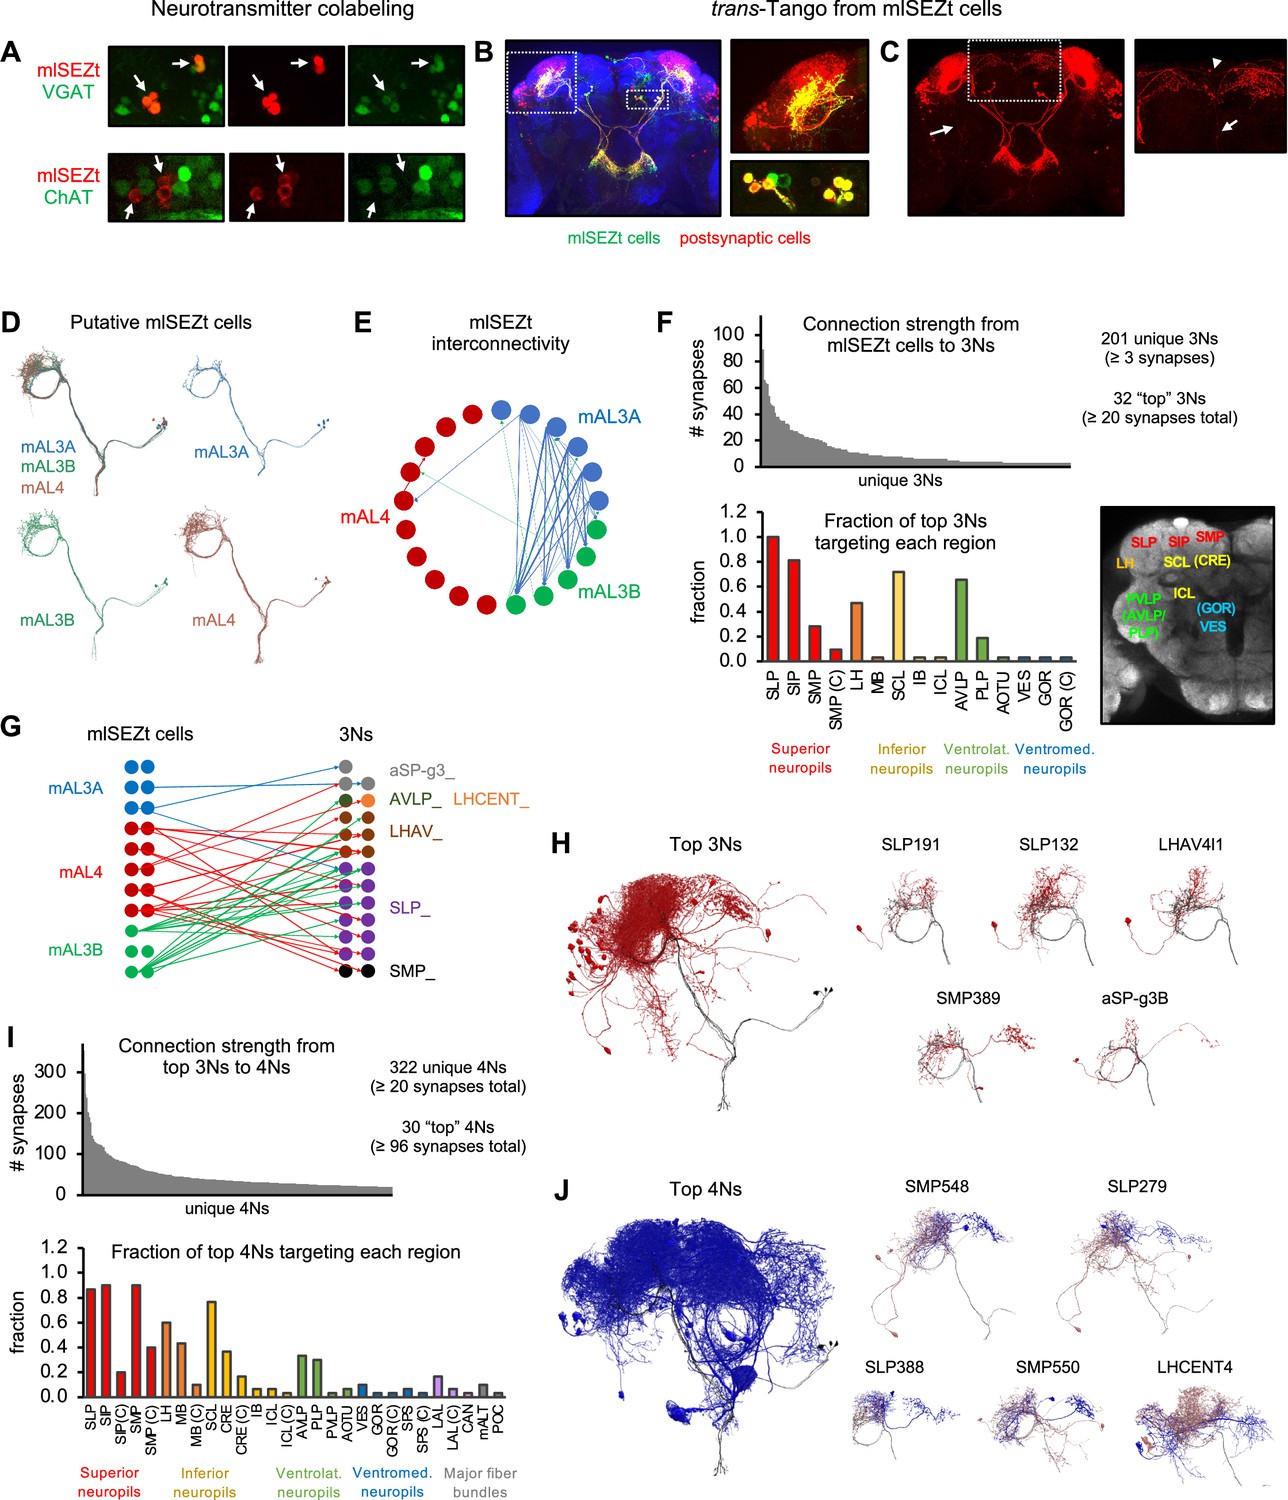
(A) Colabeling of mlSEZt cells with markers for GABAergic (top) or cholinergic (bottom) neurons. Each row shows mlSEZt labeling (red), the neurotransmitter marker (green), and both channels overlaid. Arrows point to the location of mlSEZt cells in each image. Flies contained R29F12-Gal4 driving UAS-TdT (red) and either VGAT-lexA (top) or ChAT-lexA (bottom) driving Aop-GCaMP6f (green). Additional images are shown in Figure 9—figure supplement 2. (B) Left: trans-Tango labeling of cells postsynaptic to mlSEZt neurons (using the mlSEZt split-Gal4 line). Right: Magnified images showing superior lateral protocerebrum (SLP) staining (top) and cell bodies (bottom). Many cell bodies are colabeled in both red and green, representing lateral connections between mlSEZt cells. (C) Left: Same image as panel B with only the red channel shown for greater visibility. Arrow shows a ventral projection out of the SLP. Right: Magnified image of the SMP showing a projection to the contralateral hemisphere (arrowhead) and ventral projection toward the SEZ (arrow). For clarity, magnified images in panels B and C represent a subset of the z-slices shown in the whole-brain picture, with brightness and contrast adjusted. (D) Putative mlSEZt neurons in the connectome. (E) Interconnectivity between mlSEZt neurons. Connections with at least 5 synapses are shown. Line weights represent connection strength (number of synapses; maximum = 30). (F) Top: Distribution of connection strength from mlSEZt cells to each 3N. The y-axis represents the total number of synapses each 3N receives from all 21 mlSEZt cells. Bottom left: Fraction of top 3Ns projecting to each brain region. Parenthetical ‘C’ refers to the specified region in the hemisphere contralateral to the mlSEZt projection. See Table 1 for abbreviations. Bottom right: Frontal brain slice showing the approximate locations of major regions targeted by 3Ns or 4Ns. Regions in parentheses are not visible in the specific plane shown but are located at that x-y position in an anterior or posterior plane. See Ito et al., 2014 or NeuPrint Explorer for precise region locations. (G) Connectivity between mlSEZt cells and top 3Ns, showing connections with at least 10 synapses (thus not all of the top 3Ns are represented). Line weights represent connection strength (number of synapses; maximum = 18). 3Ns are color-coded based on cell type name prefixes in the connectome, which reflect the cell body location or types defined in previous studies. (H) Left: All top 3Ns (red) shown along with four mlSEZt cells (gray). Right: Top five 3N cell types (red) that receive the strongest mlSEZt input, each shown along with three input mlSEZt cells (gray). (I) Top: Distribution of connection strength from top 3Ns to each 4N receiving ≥20 synapses. The y-axis represents the total number of synapses from top 3Ns onto each 4N. Bottom: Fraction of the top 30 4Ns projecting to each brain region. (J) Left: All top 4Ns (blue) shown along with four mlSEZt cells (gray). Right: Five of the top 4N cell types (blue). Each 4N is shown along with 2–3 input 3Ns (red) and 2–3 mlSEZt inputs to those 3Ns (gray).
Figure 9—figure supplement 1

Morphology of mlSEZt neurons in male brains.
Examples of mlSEZt cells in male brains labeled with the split-Gal4 line (R29F12-AD+R55E01-DBD). No reproducible differences in morphology were identified between mlSEZt neurons in male and female brains (see Figure 8A for female example).
Figure 9—figure supplement 2
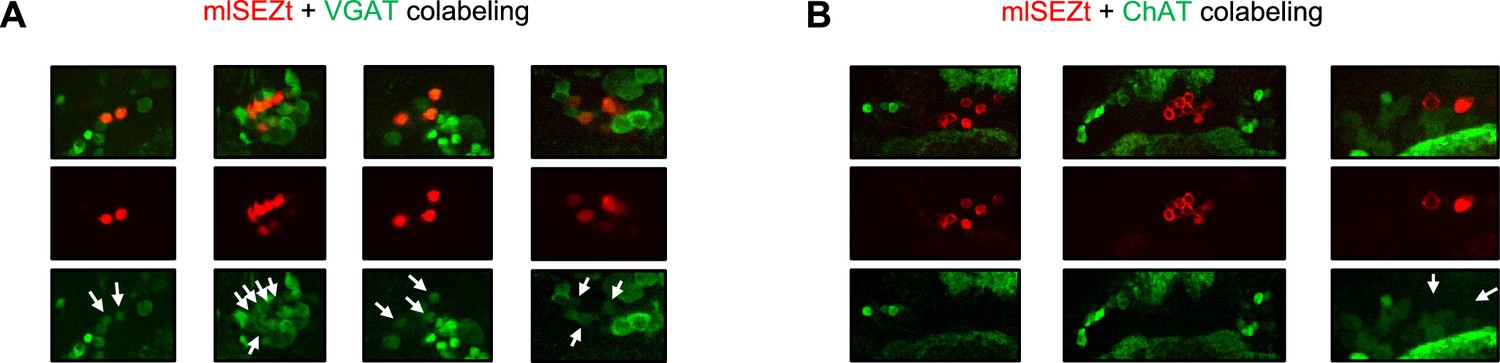
Additional images of mlSEZt colabeling with neurotransmitter markers.
(A–B) Additional images showing colabeling of mlSEZt cells with markers for GABAergic (A) or cholinergic (B) neurons. Each column shows mlSEZt labeling (red), the neurotransmitter marker (green), and both channels overlaid. Arrows in the green channel images point to the location of mlSEZt cells to highlight the presence (A) or absence (B) of overlapping green signal. For ChAT labeling (B), some images are cropped widely to demonstrate that ChAT-labeled cells can be clearly observed in the same plane even though ChAT labeling is not present in mlSEZt cells. Flies contained R29F12-Gal4 driving UAS-TdT (red) and either VGAT-lexA (A) or ChAT-lexA (B) driving Aop-GCaMP6f (green).
Tables
Table 1
List of 3Ns receiving at least 20 synapses from mlSEZt cells.
Percent input from mlSEZt refers to the percent of total input synapses the cell receives that come from mlSEZt cells. Target regions for each cell refer to areas where the cell has output synapses. All target regions are ipsilateral to the mlSEZt projections unless specified with ‘(C)’, denoting contralateral innervation. Abbreviations follow NeuPrint conventions: AOTU (anterior optic tubercle), AVLP (anterior ventrolateral protocerebrum), GOR (gorget), IB (inferior bridge), ICL (inferior clamp), LH (lateral horn), MB (mushroom body; includes all lobes and calyxes), PLP (posterior lateral protocerebrum), SCL (superior clamp), SIP (superior intermediate protocerebrum), SLP (superior lateral protocerebrum), SMP (superior medial protocerebrum), VES (vest).
| 3N cell type | Cell ID | # mlSEZt input cells | mlSEZt input types | # mlSEZt synapses | % Input from mlSEZt | Target regions |
|---|---|---|---|---|---|---|
| SLP191 | 420973599 | 7 | mAL3A, mAL3B | 64 | 6.6 | AVLP, SCL, SIP, SLP |
| SLP132 | 359892669 | 6 | mAL3A, mAL4 | 54 | 2.1 | AVLP, LH, SCL, SIP, SLP |
| SMP389 | 575197482 | 8 | mAL3A, mAL3B,mAL4 | 48 | 3.4 | AVLP, PLP, SCL, SIP, SLP, SMP |
| SLP191 | 421313563 | 8 | mAL3A, mAL3B, mAL4 | 47 | 5.0 | AVLP, LH, SCL, SIP, SLP |
| aSP-g3B | 421650982 | 5 | mAL3A | 46 | 12.9 | AVLP, PLP, SCL, SIP, SLP, SMP, SMP(C) |
| LHAV4l1 | 360236724 | 4 | mAL4 | 41 | 3.3 | AVLP, LH, SCL, SIP, SLP |
| SLP179_b | 420623873 | 5 | mAL3B, mAL4 | 38 | 3.7 | SCL, SIP, SLP |
| LHAV2f2_b | 574710121 | 5 | mAL3A, mAL3B, mAL4 | 38 | 7.9 | AVLP, LH, SCL, SLP |
| LHAV2f2_a | 604735525 | 4 | mAL3B, mAL4 | 36 | 9.4 | AVLP, LH, SCL, SLP |
| LHAV2f2_b | 573346324 | 5 | mAL3A, mAL4 | 35 | 5.5 | AVLP, LH, SCL, SLP |
| aSP-g3A | 329919036 | 5 | mAL3A, mAL3B, mAL4 | 35 | 6.3 | SIP, SLP, SMP(C), SMP |
| LHAV1e1 | 390271033 | 4 | mAL3A, mAL3B, mAL4 | 35 | 2.2 | AVLP, LH, SCL, SIP, SLP |
| SLP015_e | 393340402 | 4 | mAL3B, mAL4 | 33 | 6.0 | SIP, SLP |
| SLP011 | 297519736 | 7 | mAL3A, mAL4 | 33 | 2.2 | LH, SCL, SIP, SLP |
| SLP179_b | 391311186 | 5 | mAL3B, mAL4 | 32 | 3.3 | SIP, SLP |
| SLP015_c | 359240144 | 5 | mAL3B, mAL4 | 28 | 3.1 | AVLP, SCL, SIP, SLP |
| aSP-g3B | 485430336 | 5 | mAL3A | 27 | 9.2 | AVLP, SCL, SIP, SLP, SMP |
| SLP187 | 578521941 | 2 | mAL3B | 27 | 11.8 | SIP, SLP |
| SLP187 | 607820937 | 2 | mAL3B | 26 | 7.3 | AVLP, SCL, SLP |
| SLP376 | 298254384 | 4 | mAL3B, mAL4 | 25 | 0.6 | SIP, SLP, SMP |
| SLP216 | 5813011119 | 7 | mAL3A, mAL3B, mAL4 | 25 | 1.0 | AOTU, AVLP, GOR, GOR(C), IB, ICL, LH, PLP, SCL, SIP, SLP, SMP, SMP(C) |
| SLP215 | 608534097 | 3 | mAL3B, mAL4 | 24 | 1.1 | AVLP, PLP, SCL, SLP, VES |
| SLP015_c | 359926923 | 4 | mAL3B, mAL4 | 23 | 5.4 | SIP, SLP |
| SLP187 | 483711811 | 3 | mAL3B | 23 | 8.9 | SLP |
| SLP259 | 5813040707 | 4 | mAL3B, mAL4 | 23 | 1.7 | AVLP, SCL, SIP, SLP, SMP |
| AVLP024 | 420965117 | 3 | mAL3B | 22 | 1.2 | AVLP, LH, PVLP, SCL, SIP, SLP |
| LHCENT1 | 328861282 | 4 | mAL4 | 22 | 0.2 | AVLP, LH, MB, SCL, SIP, SLP, SMP |
| LHAV6a10 | 5813047255 | 3 | mAL4 | 22 | 6.5 | LH, SIP, SLP |
| SLP015_e | 329206628 | 2 | mAL4 | 21 | 3.2 | SIP, SLP |
| SMP550 | 452689494 | 3 | mAL3B, mAL4 | 21 | 0.4 | AVLP, LH, PLP, SCL, SIP, SLP, SMP |
| SLP018 | 451663172 | 4 | mAL3A, mAL3B, mAL4 | 20 | 3.1 | AVLP, LH, SCL, SIP, SLP |
| SLP057 | 5813019955 | 4 | mAL3B, mAL4 | 20 | 0.5 | AVLP, LH, PLP, SCL, SIP, SLP |
Table 2
List of top 30 4Ns.
Top 30 4Ns were selected and sorted based on the total number of synapses from top 3Ns. Percent input from 3Ns refers to the percent of total input synapses the cell receives that come from the top 3Ns. Target regions for each cell refer to areas where the cell has output synapses. All target regions are ipsilateral to the mlSEZt projections unless specified with ‘(C)’, denoting contralateral innervation. Abbreviations not defined in Table 2: CAN (cantle), CRE (crepine), LAL (lateral accessory lobe), POC (posterior optic commissure), PVLP (posterior ventrolateral protocerebrum), SPS (superior posterior slope), mALT (medial antennal lobe tract).
| 4N cell type | Cell ID | # 3N input cells | 3N input cell types | # synapses from 3Ns | % input from 3Ns | Target regions |
|---|---|---|---|---|---|---|
| SMP548 | 297580589 | 16 | AVLP024, LHAV1e1, SLP015_c, SLP015_e, SLP057, SLP179_b, SLP191, SLP216, SMP389, SMP550, aSP-g3A, aSP-g3B | 363 | 6.3 | AVLP, LH, PLP, SCL, SIP, SLP, SMP |
| SLP279 | 360591860 | 8 | LHAV1e1, LHCENT1, SLP015_e, SLP018, SLP179_b, SLP216, SMP550, aSP-g3A | 354 | 8.4 | SCL, SIP, SLP, SMP, SMP(C) |
| LHCENT4 | 517506265 | 4 | LHAV4l1, LHCENT1, SLP057, SMP389 | 297 | 4.6 | AVLP, LH,, MB, PLP, SCL, SIP, SLP, SMP, mALT |
| DM1_lPN | 542634818 | 1 | LHCENT1 | 247 | 2.4 | AL, LH, MB, SCL, SLP, mALT |
| LHMB1 | 5813020988 | 2 | LHCENT1, SLP057 | 238 | 3.5 | CRE, LH, MB, SCL, SIP, SLP, SMP |
| SLP388 | 298258611 | 11 | AVLP024, SLP015_e, SLP018, SLP179_b, SLP191, SLP216, SMP389, aSP-g3B | 203 | 3.1 | SCL, SIP, SLP, SMP, SMP(C) |
| SMP550 | 452689494 | 7 | AVLP024, LHAV1e1, SLP018, SLP216, SMP389, aSP-g3B | 201 | 4.2 | AVLP, LH, PLP, SCL, SIP, SLP, SMP |
| oviIN | 423101189 | 2 | SMP389, SMP550 | 190 | 0.8 | CAN, CRE, CRE(C), GOR, IB, LAL, SIP, SIP(C), SMP, SMP(C), SPS, VES |
| LHCENT9 | 330268940 | 10 | AVLP024, LHAV1e1, LHCENT1, SLP132, SLP191, SMP389, aSP-g3A, aSP-g3B | 177 | 1.4 | AOTU, AVLP, LH, MB, SCL, SIP, SLP, SMP |
| SLP212 | 5812980529 | 14 | AVLP024, SLP015_e, SLP018, SLP057, SLP132, SLP191, SLP216, SMP389, SMP550, aSP-g3A, aSP-g3B | 145 | 6.7 | SIP, SLP, SMP, SMP(C) |
| SMP108 | 298258513 | 3 | SLP057, SMP389, SMP550 | 145 | 0.6 | CRE, CRE(C), LAL, LH, MB, MB(C), SCL, SIP(C), SIP, SLP, SMP, SMP(C) |
| oviDNa | 550655668 | 2 | SLP216, SMP550 | 137 | 12.3 | CRE, SCL, SIP, SLP, SMP, SMP(C), VES |
| MBON18 | 5813020828 | 1 | LHCENT1 | 132 | 1.0 | LH, MB, SCL, SIP, SLP |
| LHPD4c1 | 421641859 | 9 | LHAV1e1, LHAV4l1, LHCENT1, SLP011, SLP018, SLP057, SLP132, SLP187 | 130 | 2.5 | LH, SCL, SIP, SLP, SMP |
| SLP113 | 390589591 | 6 | AVLP024, LHAV2f2_b, LHAV4l1, LHCENT1, SLP132 | 127 | 10.5 | LH, SIP, SLP, SMP |
| LHPV10b1 | 604709727 | 2 | LHCENT1, SLP057 | 125 | 2.8 | CRE, LH, MB, PLP, PVLP, SCL, SIP, SLP, SMP |
| SMP156 | 673776769 | 3 | SLP216, SMP389, SMP550 | 124 | 2.1 | CRE, GOR(C), IB, ICL(C), ICL, LAL, MB, SMP, SMP(C), SPS, SPS(C) |
| SMP385 | 5813083780 | 2 | SMP389, SMP550 | 124 | 2.0 | CRE, CRE(C), LAL, LAL(C), SCL, SIP, SIP(C), SMP, SMP(C), |
| SLP440 | 328870472 | 13 | LHAV1e1, SLP015_c, SLP015_e, SLP018, SLP057, SLP179_b, SLP191, SLP376, aSP-g3B | 123 | 3.0 | LH, SCL, SIP, SLP, SMP, SMP(C) |
| LHPV5e1 | 328611004 | 5 | LHAV1e1, LHAV4l1, LHCENT1, SLP015_e, SLP132 | 123 | 1.1 | CRE, CRE(C), LH, MB(C), SCL, SIP, SIP(C), SLP, SMP, SMP(C) |
| SMP029 | 604070433 | 3 | SLP216, SMP389, SMP550 | 120 | 6.7 | AVLP, LH, MB, PLP, SCL, SIP, SLP, SMP |
| SMP311 | 5813049378 | 2 | SMP389, SMP550 | 117 | 7.5 | AVLP, ICL, PLP, SCL, SIP, SLP, SMP |
| PPL201 | 328533761 | 6 | LHAV1e1, LHCENT1, SLP011, SLP015_e, SLP057, SLP179_b | 117 | 1.4 | AVLP, CRE, LH, MB, PLP, POC, SCL, SIP, SLP, SMP, mALT |
| SMP109 | 5813009620 | 2 | SMP389, SMP550 | 107 | 1.7 | AOTU, CRE, CRE(C), LAL, LAL(C), MB, SIP, SMP, VES |
| SMP029 | 541347811 | 4 | SLP215, SLP216, SMP389, SMP550 | 106 | 5.8 | AVLP, MB, PLP, SCL, SIP, SLP, SMP |
| SMP503 | 361312808 | 12 | AVLP024, LHCENT1, SLP011, SLP015_e, SLP018, SLP132, SLP187, SLP215, SMP389, SMP550, aSP-g3B | 102 | 1.5 | AVLP, CRE, LH, MB, PLP, SCL, SIP, SIP(C), SLP, SMP, SMP(C) |
| SLP113 | 421271305 | 8 | LHAV2f2_a, LHAV2f2_b, LHAV4l1, LHCENT1, SLP132, SLP187 | 102 | 10.0 | LH, SIP, SLP, SMP, SMP(C) |
| MBON18 | 457196444 | 1 | LHCENT1 | 97 | 3.6 | LH, MB(C), SCL, SIP, SIP(C), SLP |
| SLP149 | 5813009312 | 9 | LHAV1e1, LHAV4l1, LHCENT1, SLP015_c, SLP018, SLP057, SLP179_b, SLP376 | 97 | 4.3 | SIP, SLP, SMP |
| SLP441 | 5813078542 | 13 | LHAV1e1, LHCENT1, SLP011, SLP015_c, SLP015_e, SLP057, SLP179_b, SLP191, SLP259, SLP376, aSP-g3B | 96 | 3.3 | AVLP, SCL, SIP, SLP, SMP |
Key resources table
| Reagent type (species) or resource | Designation | Source or reference | Identifiers | Additional information |
|---|---|---|---|---|
| Genetic reagent (Drosophila melanogaster) | Gr33a-Gal4 | Moon et al., 2009 | BDSC: 31425 | |
| Genetic reagent (Drosophila melanogaster) | Gr58c-Gal4 | Weiss et al., 2011 | BDSC: 57646 | |
| Genetic reagent (Drosophila melanogaster) | Gr59c-Gal4 | Weiss et al., 2011 | BDSC: 57650 | |
| Genetic reagent (Drosophila melanogaster) | Gr22f-Gal4 | Weiss et al., 2011 | BDSC: 57610 | |
| Genetic reagent (Drosophila melanogaster) | Gr9a-Gal4 | Weiss et al., 2011 | BDSC: 57596 | |
| Genetic reagent (Drosophila melanogaster) | R29F12-Gal4 | Jenett et al., 2012 | BDSC: 49495 | |
| Genetic reagent (Drosophila melanogaster) | R55E01-Gal4 | Jenett et al., 2012 | BDSC: 39117 | |
| Genetic reagent (Drosophila melanogaster) | R29F12-AD | Dionne et al., 2018 | BDSC: 71164 | |
| Genetic reagent (Drosophila melanogaster) | R55E01-DBD | Dionne et al., 2018 | BDSC: 69662 | |
| Genetic reagent (Drosophila melanogaster) | Gr66a-lexA | Thistle et al., 2012 | BDSC: 93024 | |
| Genetic reagent (Drosophila melanogaster) | VGAT-lexA | Deng et al., 2019 | BDSC: 84441 | |
| Genetic reagent (Drosophila melanogaster) | ChAT-lexA | Deng et al., 2019 | BDSC: 84379 | |
| Genetic reagent (Drosophila melanogaster) | UAS-Chrimson-TdT | Duistermars et al., 2018 | N/A | |
| Genetic reagent (Drosophila melanogaster) | UAS-GTACR1-TdT | B Noro | N/A | |
| Genetic reagent (Drosophila melanogaster) | UAS-Kir2.1 | Baines et al., 2001 | BDSC: 6595 | |
| Genetic reagent (Drosophila melanogaster) | trans-Tango reporter (UAS-Myr-GFP, QUAS-mtdTomato; trans-Tango) | Talay et al., 2017 | BDSC: 77124 | |
| Genetic reagent (Drosophila melanogaster) | UAS-GCaMP6f | Chen et al., 2013 | BDSC: 42747 | |
| Genetic reagent (Drosophila melanogaster) | UAS-TdTVK5 | D Hattori | N/A | |
| Genetic reagent (Drosophila melanogaster) | UAS-TdTp40 | G Rubin and B Pfeiffer | BDSC: 32222 | |
| Genetic reagent (Drosophila melanogaster) | lexAop-GCaMP6f | D Kim; Hattori et al., 2017 | BDSC 44277 | |
| Antibody | Anti-GFP (chicken polyclonal) | Aves Labs | Cat# GFP-1020; RRID: AB_10000240 | 1:1000 |
| Antibody | Anti-DsRed (rabbit polyclonal) | Clontech | Cat# 632496; RRID: AB_10013483 | 1:500 |
| Antibody | Anti-bruchpilot (nc82; mouse monoclonal) | Development Studies Hybridoma Bank | Cat# nc82; RRID: AB_2314866 | 1:10 |
| Antibody | Alexa Fluor 488 (goat anti-chicken polyclonal) | Life Technologies | Cat# A11039; RRID: AB_2534096 | 1:500 |
| Antibody | Alexa Fluor 568 (goat anti-rabbit polyclonal) | Life Technologies | Cat# A11036; RRID: AB_10563566 | 1:500 |
| Antibody | Alexa Fluor 633 (goat anti-mouse polyclonal) | Life Technologies | Cat# A21052; RRID: AB_2535719 | 1:500 |
| Software, algorithm | Prism, version 9 | GraphPad | N/A | |
| Software, algorithm | MATLAB | Mathworks | N/A | |
| Software, algorithm | FlyTracker | Caltech; Eyjolfsdottir et al., 2014 | N/A | http://www.vision.caltech.edu/Tools/FlyTracker/ |
Additional files
Download links
A two-part list of links to download the article, or parts of the article, in various formats.
Downloads (link to download the article as PDF)
Open citations (links to open the citations from this article in various online reference manager services)
Cite this article (links to download the citations from this article in formats compatible with various reference manager tools)
Selective integration of diverse taste inputs within a single taste modality
eLife 12:e84856.
https://doi.org/10.7554/eLife.84856


