Expanding the stdpopsim species catalog, and lessons learned for realistic genome simulations
- Department of Ecology and Evolutionary Biology, University of Arizona, United States
- Department of Ecology and Evolutionary Biology, University of California, Los Angeles, United States
- Embark Veterinary, Inc, United States
- Section for Molecular Ecology and Evolution, Globe Institute, University of Copenhagen, Denmark
- Institute of Ecology and Evolution, University of Oregon, United States
- School of Mathematics and Statistics, University of Melbourne, Australia
- Ancestry DNA, United States
- 54Gene, Inc, United States
- Universite Paris-Saclay, CNRS, INRIA, Laboratoire Interdisciplinaire des Sciences du Numerique, France
- School of Life Sciences, University of Glasgow, United Kingdom
- Department of Computational Biology, Cornell University, United States
- Department of Cell and Systems Biology, University of Toronto, Canada
- Department of Biology, University of Toronto Mississauga, Canada
- Department of Evolutionary Anthropology, University of Vienna, Austria
- Human Evolution and Archaeological Sciences (HEAS), University of Vienna, Austria
- Department of Evolutionary Genetics, Max Planck Institute for Evolutionary Anthropology, Germany
- Computer Technologies Laboratory, ITMO University, Russian Federation
- Agricultural Institute of Slovenia, Department of Animal Science, Slovenia
- Entomology Department, The Ohio State University, United States
- Department of Genetics, University of Cambridge, United Kingdom
- Department of Zoology, University of Cambridge, United Kingdom
- Department of Ecology, Evolution, and Organismal Biology, Brown University, United States
- Center for Computational Molecular Biology, Brown University, United States
- Department of Genetics and Evolution, Federal University of Sao Carlos, Brazil
- Department of Genetics, Stanford University School of Medicine, United States
- Department of Cell and Molecular Biology, National Bioinformatics Infrastructure Sweden, Science for Life Laboratory, Uppsala University, Sweden
- Department of Integrative Biology, University of California, Berkeley, United States
- Department of Biostatistics, University of Washington, United States
- Broad Institute of MIT and Harvard, United States
- Big Data Institute, Li Ka Shing Centre for Health Information and Discovery, University of Oxford, United Kingdom
- Cluster of Excellence - Controlling Microbes to Fight Infections, Eberhard Karls Universit¨at Tubingen, Germany
- School of Life Sciences and The Biodesign Institute, Arizona State University, United States
- The Roslin Institute and Royal (Dick) School of Veterinary Studies, University of Edinburgh, United Kingdom
- Department of Molecular and Cellular Biology, University of Arizona, United States
- Department of Integrative Biology, University of Wisconsin–Madison, United States
- Department of Mathematics, University of Oregon, United States
- Department of Genetics, University of North Carolina at Chapel Hill, United States
- Efi Arazi School of Computer Science, Reichman University, Israel
Figures
Figure 1
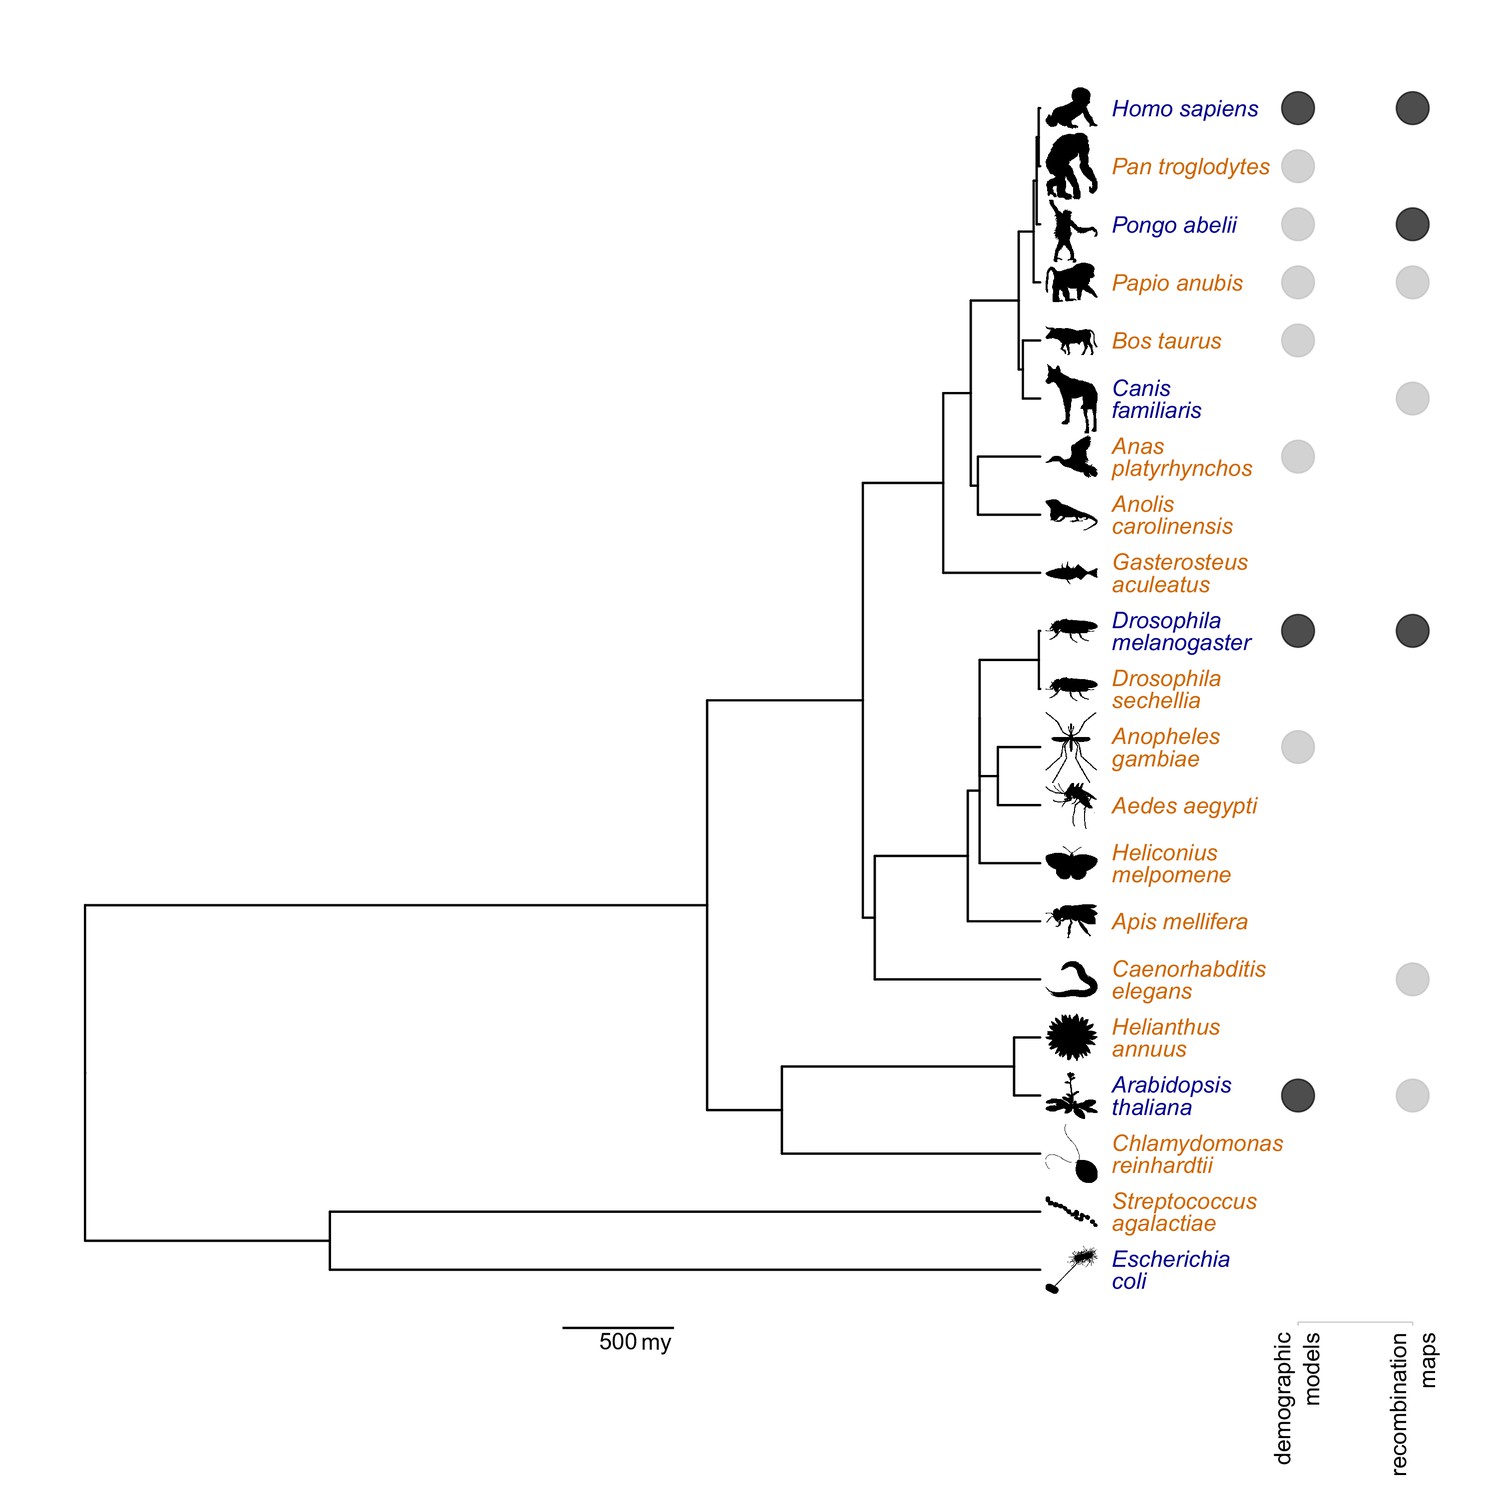
Phylogenetic tree of species available in the stdpopsim catalog, including the six species we published in the original release (Adrion et al., 2020, in blue), and 15 species that have since been added (in orange).
Solid circles indicate species that have one (light gray) or more (dark gray) demographic models and recombination maps. Branch lengths were derived from the divergence times provided by TimeTree5 (Kumar et al., 2022). The horizontal bar below the tree indicates 500 million years (my). Source code for generating the tree is given in Figure 1—source code 1 and 2.
-
Figure 1—source code 1
R code for generating the figure.
- https://cdn.elifesciences.org/articles/84874/elife-84874-fig1-code1-v1.zip
-
Figure 1—source code 2
Newick-format tree used as input in R code.
- https://cdn.elifesciences.org/articles/84874/elife-84874-fig1-code2-v1.zip
Figure 2
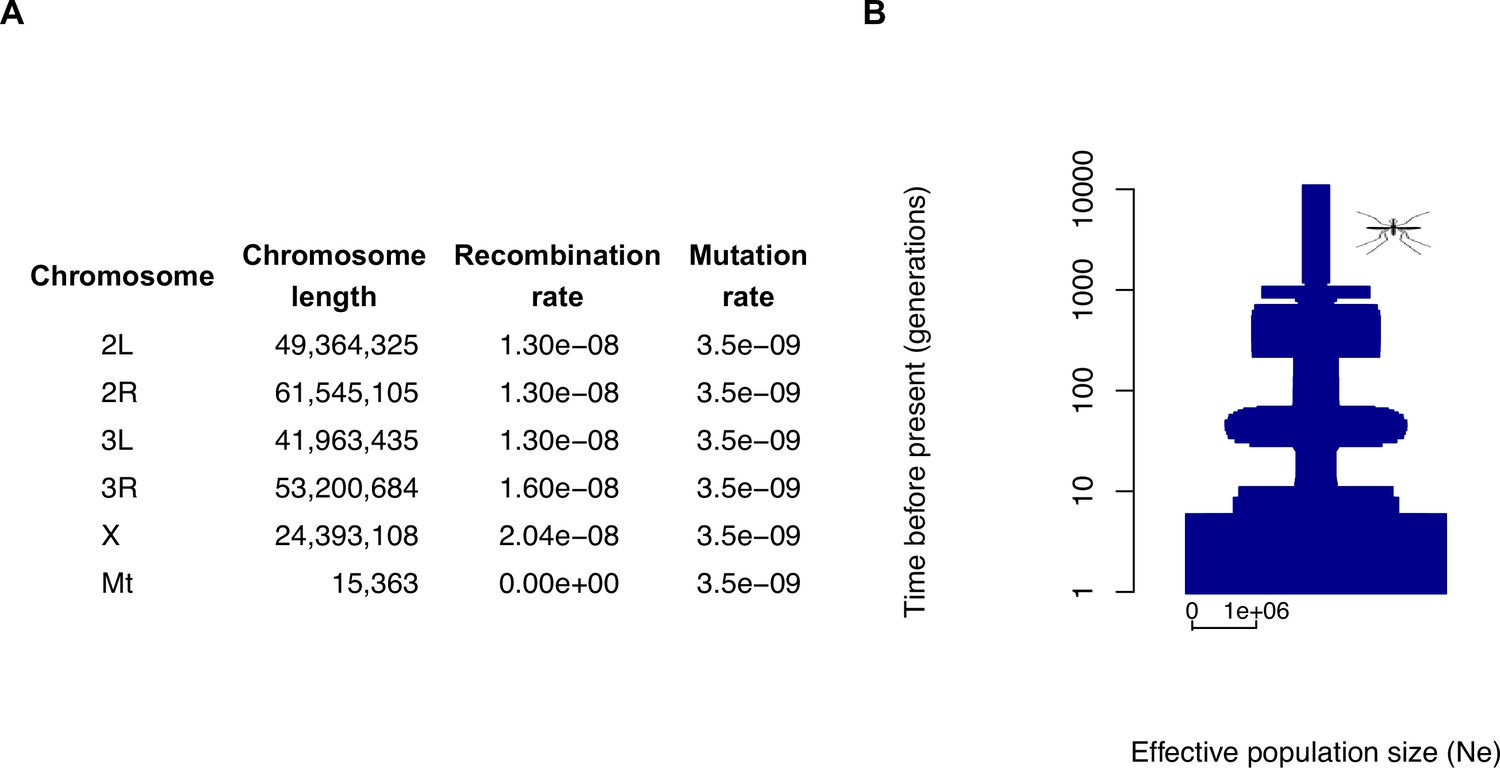
The species parameters and demographic model used for Anopheles gambiae in the stdpopsim catalog.
(A) The parameters associated with the genome build and species, including chromosome lengths, average recombination rates (per base per generation), and average mutation rates (per base per generation). (B) A graphical depiction of the demographic model, which consists of a single population whose size changes throughout the past 11,260 generations in 67-time intervals (note the log scale). The width at each point depicts the effective population size (), with the horizontal bar at the bottom indicating the scale for . This figure is adapted from the data on the stdpopsim catalog documentation page (see Data availability) and plotted with POPdemog (Zhou et al., 2018). Source code for generating the figure is given in Figure 2—source code 1.
-
Figure 2—source code 1
R code for generating the figure.
- https://cdn.elifesciences.org/articles/84874/elife-84874-fig2-code1-v1.zip
Tables
Table 1
Guidelines for dealing with missing parameters.
For each parameter, we provide a suggested course of action, and mention the main discrepancies between simulated data and real genomic data that could be caused by misspecification of that parameter.
| Missing parameter | Suggested action | Possible discrepancies |
|---|---|---|
| Mutation rate | Borrow from the closest relative with a citable mutation rate | Number of polymorphic sites |
| Recombination rate | Borrow from the closest relative with a citable recombination rate | Patterns of linkage disequilibrium |
| Gene conversion rate and tract length | Set the rate to 0 or borrow from the closest relative with a citable rate | Lengths of shared haplotypes across individuals |
| Demographic model | Set the effective population size () to a value that reflects the observed genetic diversity | Features of genetic diversity that are captured by the site frequency spectrum, such as the prevalence of low-frequency alleles |
Additional files
Download links
A two-part list of links to download the article, or parts of the article, in various formats.
Downloads (link to download the article as PDF)
Open citations (links to open the citations from this article in various online reference manager services)
Cite this article (links to download the citations from this article in formats compatible with various reference manager tools)
Expanding the stdpopsim species catalog, and lessons learned for realistic genome simulations
eLife 12:RP84874.
https://doi.org/10.7554/eLife.84874.3


