Increased cortical plasticity leads to memory interference and enhanced hippocampal-cortical interactions
- Donders Institute for Brain, Cognition and Behaviour, Radboud University Nijmegen, Netherlands
- Institute of Intelligent Systems and Robotics, CNRS, Sorbonne Université, France
- Laboratory of Neurobiology, CIMES, University of Malaga, Spain
Figures
Figure 1 with 1 supplement
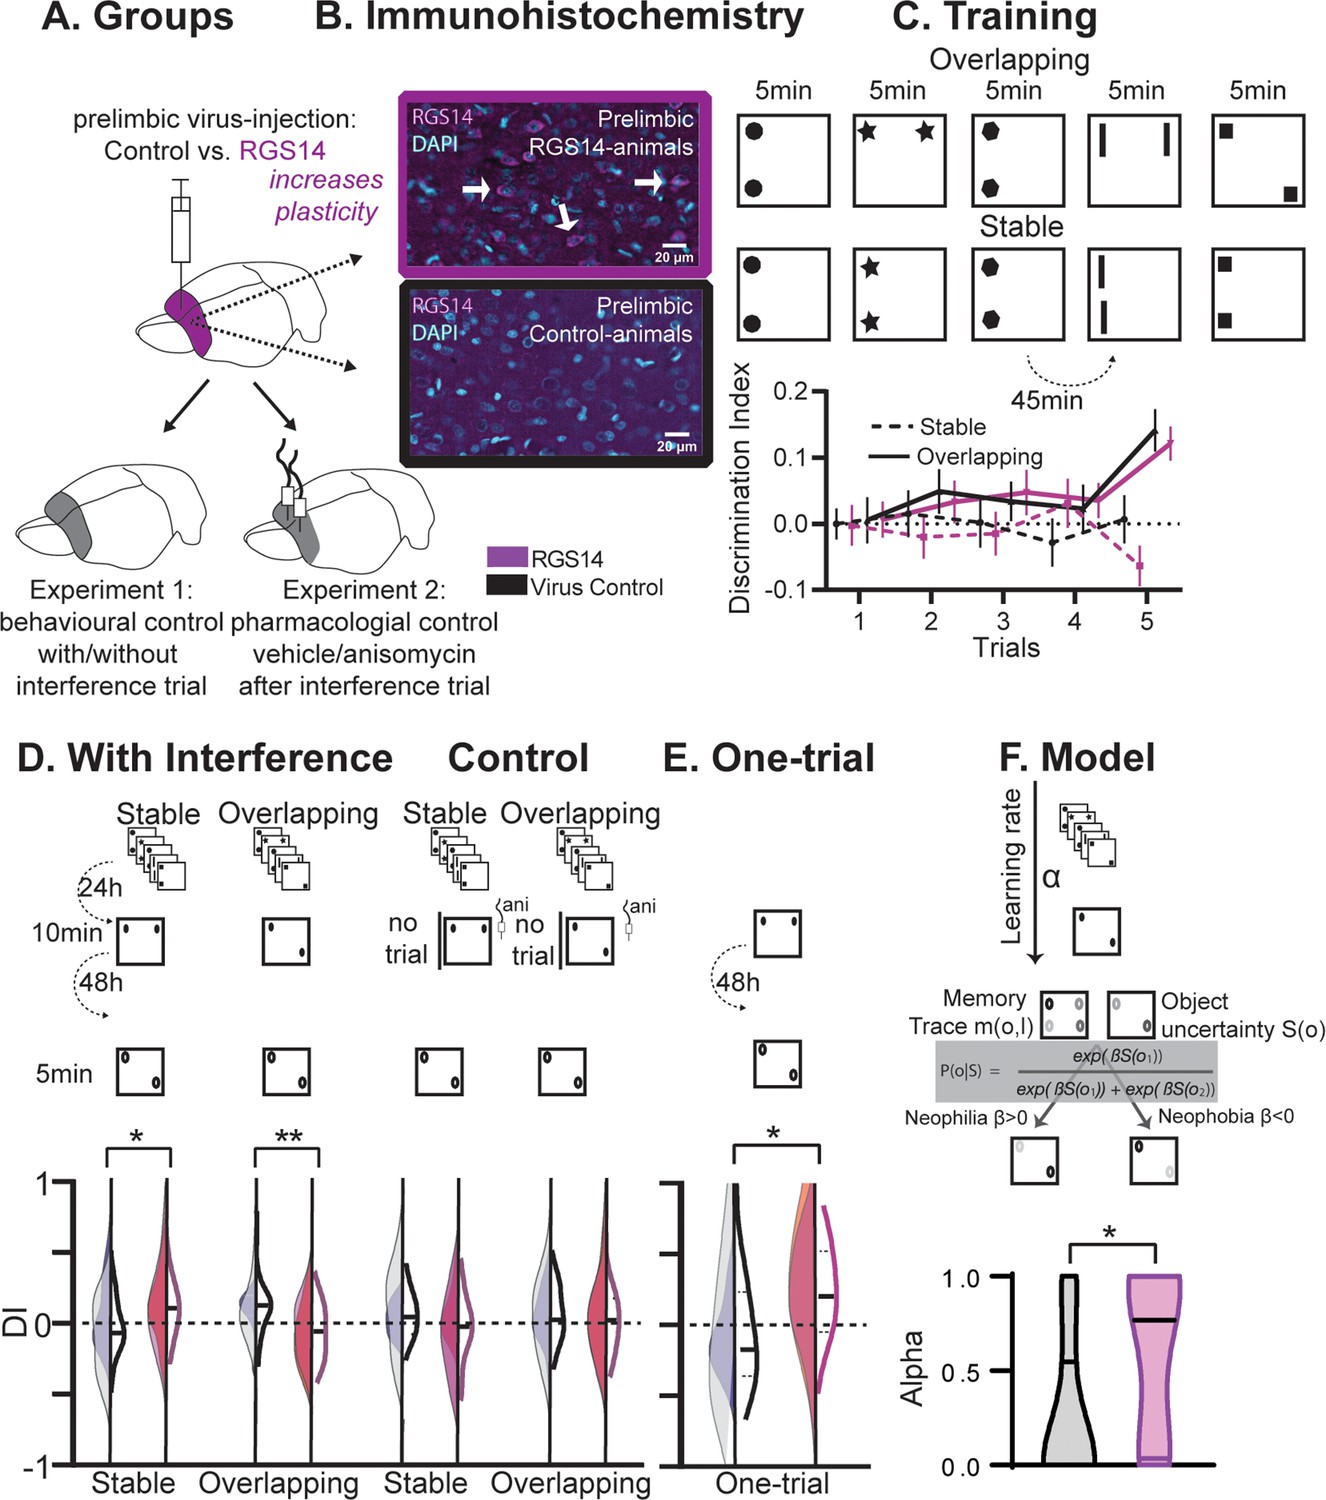
Behavioral experiments.
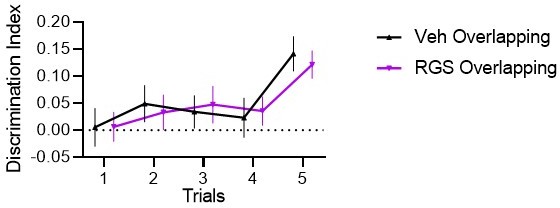
(A) Half the animals were injected with a lentivirus for the overexpression of RGS14414 increasing plasticity in the prelimbic cortex, the other half had a control virus. These animals were included in either Experiment 1 (behavioral control), or were implanted with canula to the prelimbic cortex for Experiment 2 (pharmacological controls, total n=65 with n=16–17 per experimental group). (B) Immunohistochemistry for RGS14 expression in treated and control animals (purple, cyan DAPI staining). (C) Object Space Task training contains five trials with 45 min inter-trial-intervals. In Overlapping one location always contains an object, while the other object moves each trial. In Stable the configuration always remains the same. Discrimination Index (exploration time moved-not moved/sum) over training trials show slowly rising discrimination in Overlapping and not Stable with preference for the less often used locations especially in the 5th trial as expected (Genzel et al., 2019) (rmANOVA condition F1,65=16.9 p<0.001, conditionXtrial F4, 260=3.3 p=0.012, all other p>0.37, DI interference and exploration times see Figure 1—figure supplement 1). Of note, object locations and configurations were counterbalanced across animals. (D) 24 hr after training animals had an interference trial (10 min, different and same configuration as last training trial for Stable and Overlapping, respectively) followed by a test trial another 48 hr later (again different and same configuration as interference trial for Stable and Overlapping, respectively). In the control conditions (right side), for Experiment 1 there was no interference and in Experiment 2 animals were infused with anisomycin after the interference trial. Virus control grey, RGS-overexpressing purple, lighter shades experiment 1 (with or without interference trial), darker shades experiment 2 (with or without anisomycin infusion). There was a significant interaction where interference had the opposite effect in each condition according to virus manipulation (rmANOVA with condition, interference/drug, experiment, virus; cond*int/drug*virus F1,61=13.2 p<0.001; stable with interference t63=2.1 p=0.039, overlapping with interference t63=3.1 p=0.003, other p>0.12). (E) One-trial control followed 48 hr later by test, RGS14-overexpressing animals performed better than controls (t30=2.2 p=0.037). (F) Model-fitting show that RGS14-overexpressing animals have a higher learning rate α (KS-D=0.46 p=0.044). *p<0.05, **p<0.01.
Figure 1—figure supplement 1

Object Space Task.
(A) Discrimination Index for the interference trial (left violin plots, right bar graph for comparison to 24 hr Test trial in Genzel et al., 2019). Stars for one-sample t-test to chance (0) *p<0.05, **p<0.01. There was no significant effect of condition, group nor interaction (all p>0.52). (B) Exploration times for all trials and conditions (C). Examples of objects used.
Figure 2 with 3 supplements
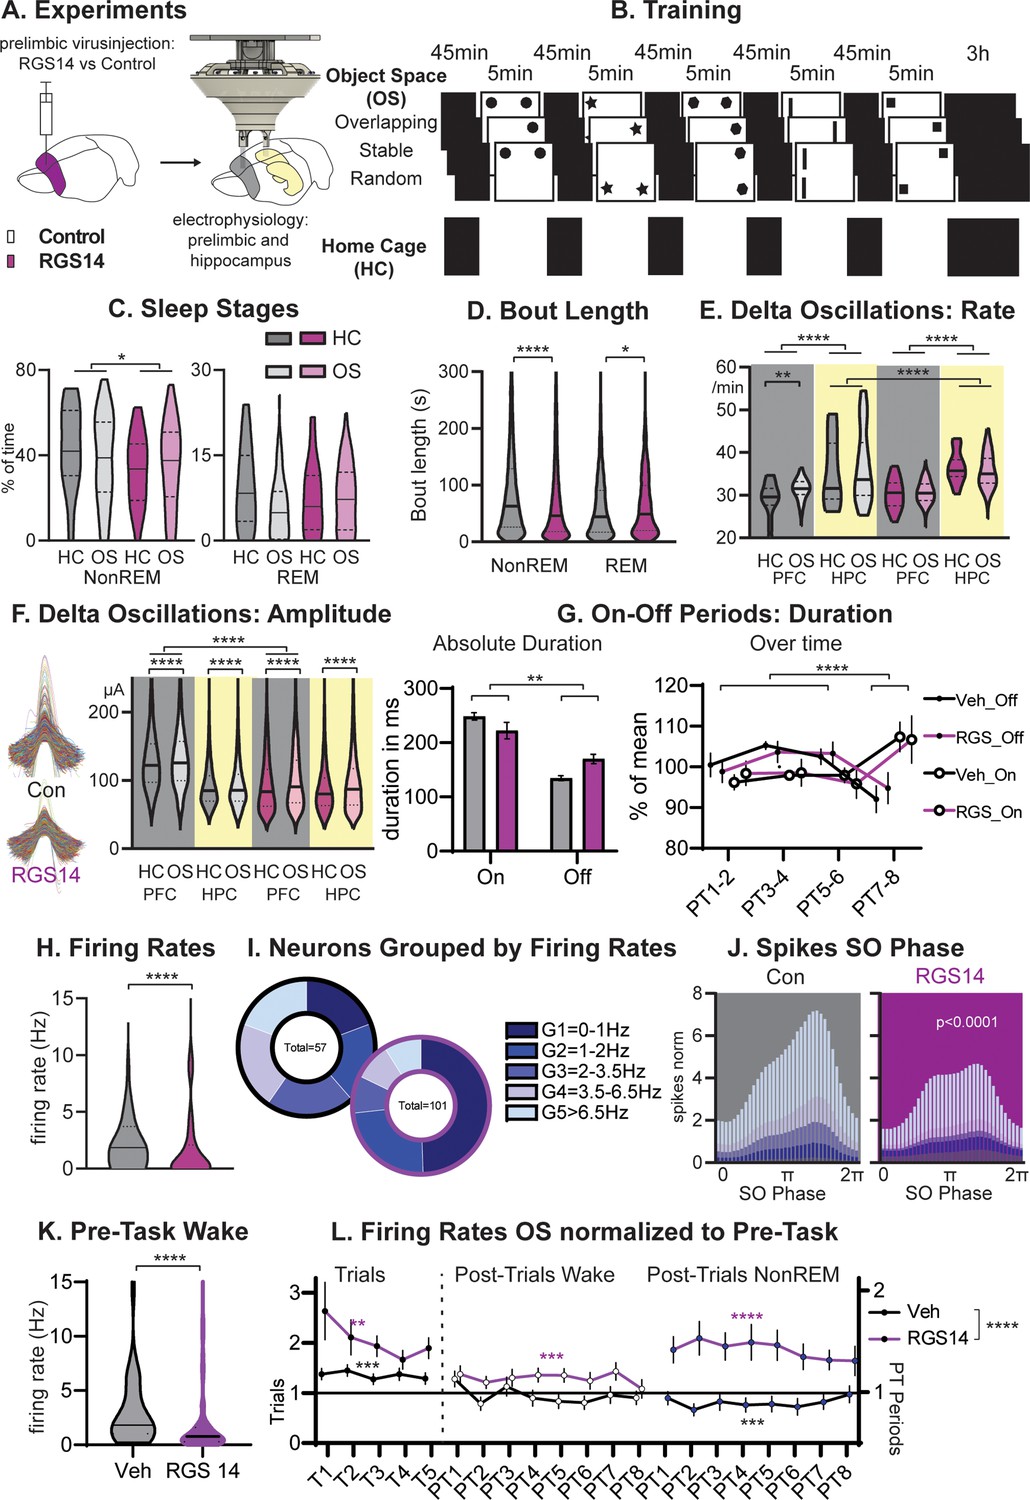
Sleep and Firing Rates.
(A) Animals received RGS14 overexpressing (n=4) or control (n=4) virus and were implanted with a hyperdrive (10 tetrode prelimbic, 6 tetrodes hippocampus) three weeks later. (B) Animals ran the three conditions of the Object Space Task (OS, Stable and Overlapping as described above, Random with constantly moving objects) and a home cage control (HC, same structure of the day but remained awake in recording box during trial periods). (C) Controls had more NonREM sleep (KS-D=0.17 p=0.05) and no change in REM sleep (KS-D=0.15 p=0.12). (D) NonREM bout length was longer in controls (MW U=6887019 p<0.0001) but REM length was shorter (MW U=501,849 p=0.048. (E) In both groups, hippocampal delta rates were higher than cortical rates (p<0.0001). The rate of delta oscillations in the cortex increased in controls (KS-D=0.11 p=0.007) but not in RGS14 after OS, the rate of hippocampal delta oscillations was overall higher for RGS14 than controls (KS-D=0.31; p<0.0001). (F). In controls delta oscillations were larger in the cortex than hippocampus, in contrast in RGS14 the cortex showed the same amplitude delta-waves as the hippocampus (Cortex Con vs RGS14 KS-D=0.34 p<0.0001). In both groups and brain areas delta amplitude increased after OS (KS-D >0.02 p<0.0001)). (G) There was a significant interaction in duration of On-Off periods underlying delta-waves with RGS14-overexpressing animals presenting with longer Off-periods (groupXtype interaction ANOVA F1,164=9.0 p=0.0031, type F1,164=65.0 p<0.0001). But the time course of on-off durations did not differ between groups (PTXtype interaction ANOVA F3,152=946.6 p<0.0001, no interaction with group all p>0.8) (H) RGS14-overexpresssing animals had more neurons with lower firing rates (KS-D=0.36 p<0.0001, for split by other states see Figure 2—figure supplement 2). (I) Division of neurons according to their firing rates (Chi-square4=20.13 p=0.0005). (J) Spikes were less phase locked to the slow oscillation phase (circ stats p<0.0001 for each neuron group) and less G4-5 neurons led to less spikes during the upstate in RGS14. (K) Firing rates during the pre-task period, only including wake since few animals slept (KS-D=0.41 p<0.0001) (L) Firing rates on OS days normalized to Pre-Task (wake). From left to right during task (trials, left), post-trial periods wake in recording box, and during NonREM sleep. RGS14 overall showed larger increases in firing rates from pre-task than controls (ANOVA virus F1, 2545 = 52,43 p<0.0001). In all time periods RGS14 showed an increase to pre-task (one-sample t-test to 1 P=0.003–0001), in Controls during task there was an increase (p=0.0004) during PT wake no change (p=0.3), and during PT NonREM a decrease in firing rates (p=0.0005) Control grey, RGS-overexpressing purple, darker shades home cage (HC), lighter shades Object Space Task (OS), *p<0.05, **p<0.01,****p<0.0001.
Figure 2—figure supplement 1
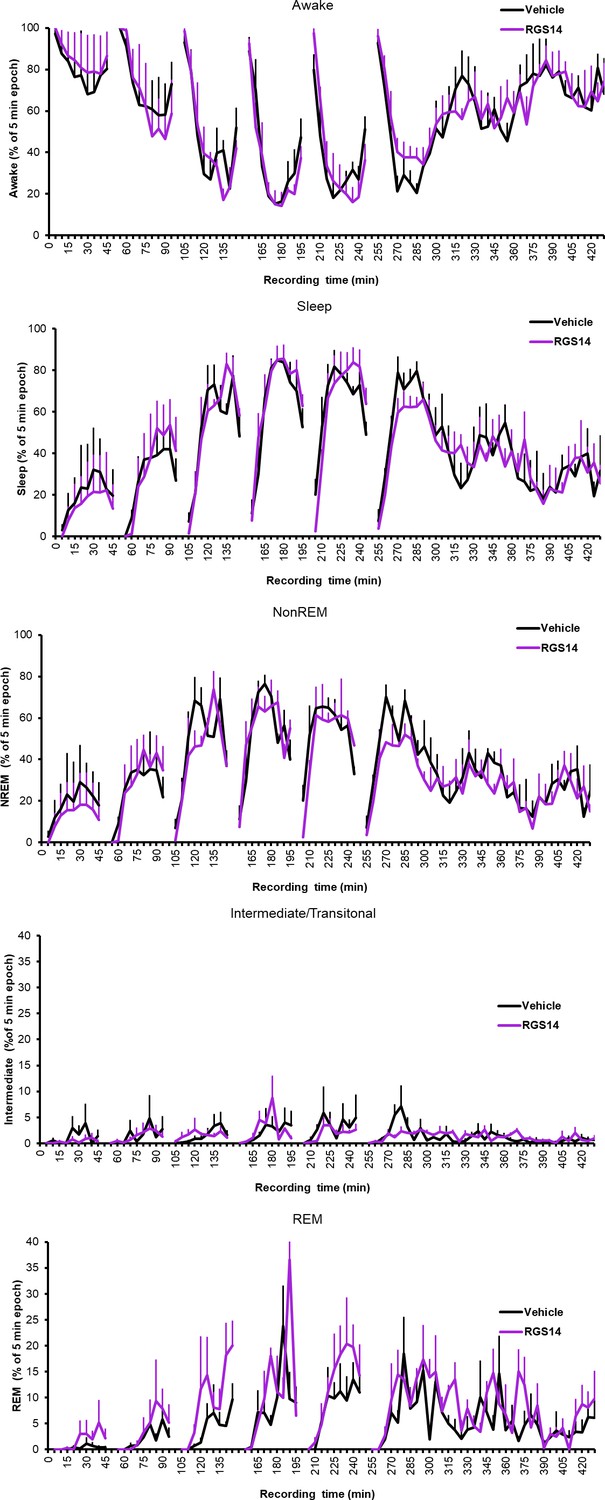
Wake and sleep states for each 5 min bin the sleep recording box.
Averaged across conditions, SEM calculated with n=animal.
Figure 2—figure supplement 2
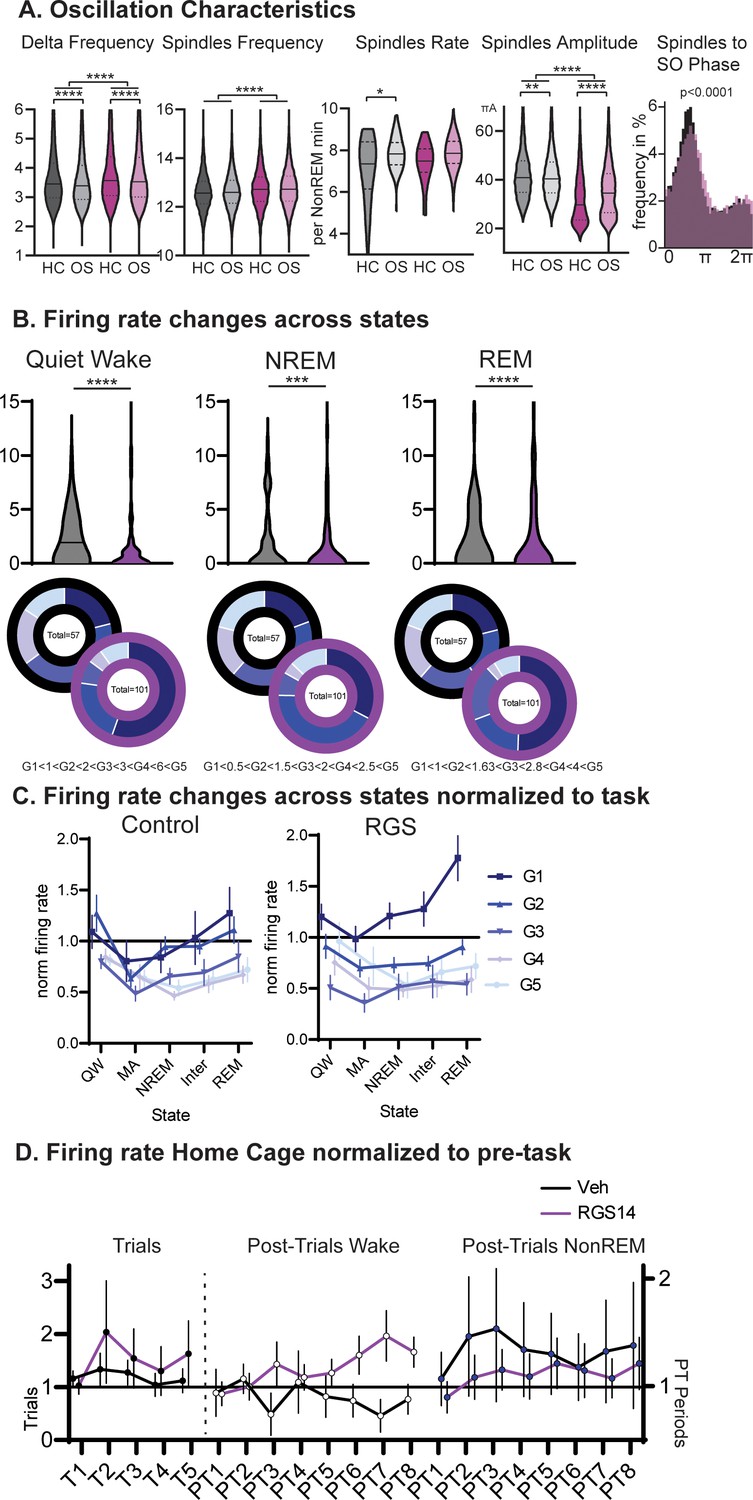
Oscillations and Firing Rates.
(A) Intrinsic frequency of Delta waves and spindles. Spindle Rate and Amplitude as well as SO coupling. (B) Firing rates during wake in the sleep recording box (Quiet Wake), NREM and REM. For each state a new pentile split in vehicles and margins applied to RGS animals. Findings from wake are replicated. (C) Average firing rate per neuron group (1–5, normalized to wake) and consciousness state. Quiet wake is wake in the sleep recording box, microarousal is wake <15 s in the sleep recording box. (D) Firing rates on Home Cage days normalized to pre-task for trials and post-trial period (left wake, right NonREM).
Figure 2—figure supplement 3

Placement of tetrodes per rat and brain area.
Histology of injection site for virus.
Figure 3
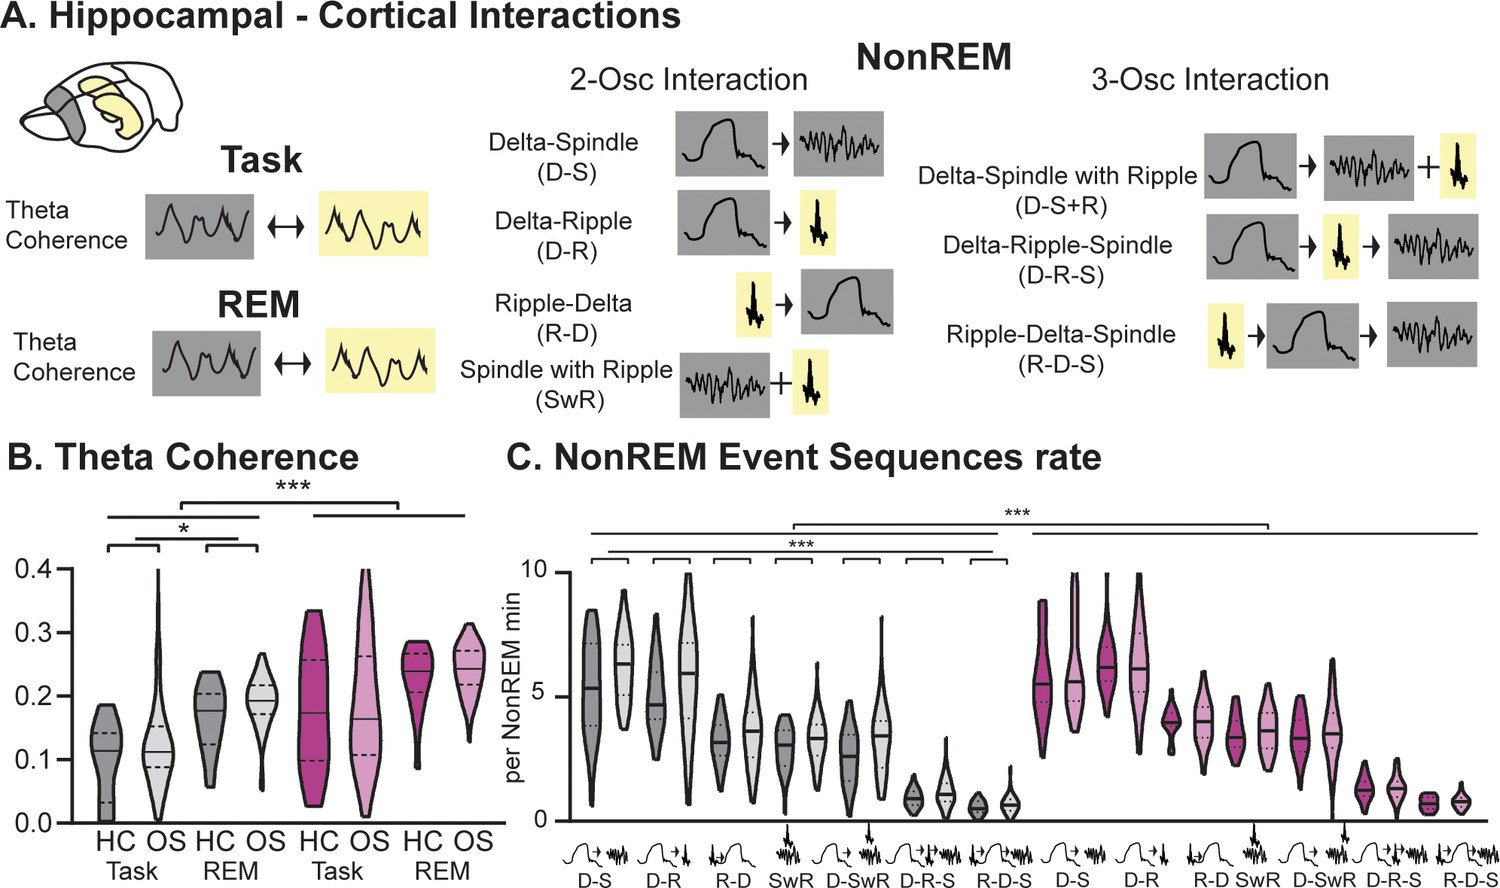
Hippocampal-Cortical interactions.
(A) Brain area interactions are known in Task and REM as theta coherence (Benchenane et al., 2010), in NonREM as oscillatory coupling. (B) RGS14 showed higher theta coherence (treatment F1,285=31.8 p<0.001). Only controls showed higher coherence after learning (controls OS vs HC F1,144=5.2 p=0.024, RGS14 OS vs HC F1,141=0.6 p=0.44). (C) RGS14 showed generally higher rates of oscillations sequences (treatment F1,856=18.7 p<0.001), but only in controls could a learning-dependent increase be observed (controls OS vs HC F1,420=12.3 p=0.001, RGS OS vs HC F1,436=1.3 p=0.25). Control grey, RGS-overexpressing purple, darker shades home cage (HC), lighter shades Object Space Task (OS) *p<0.05, **p<0.01, ***p<0.001, ****p<0.0001.
Figure 4 with 3 supplements
Ripples.
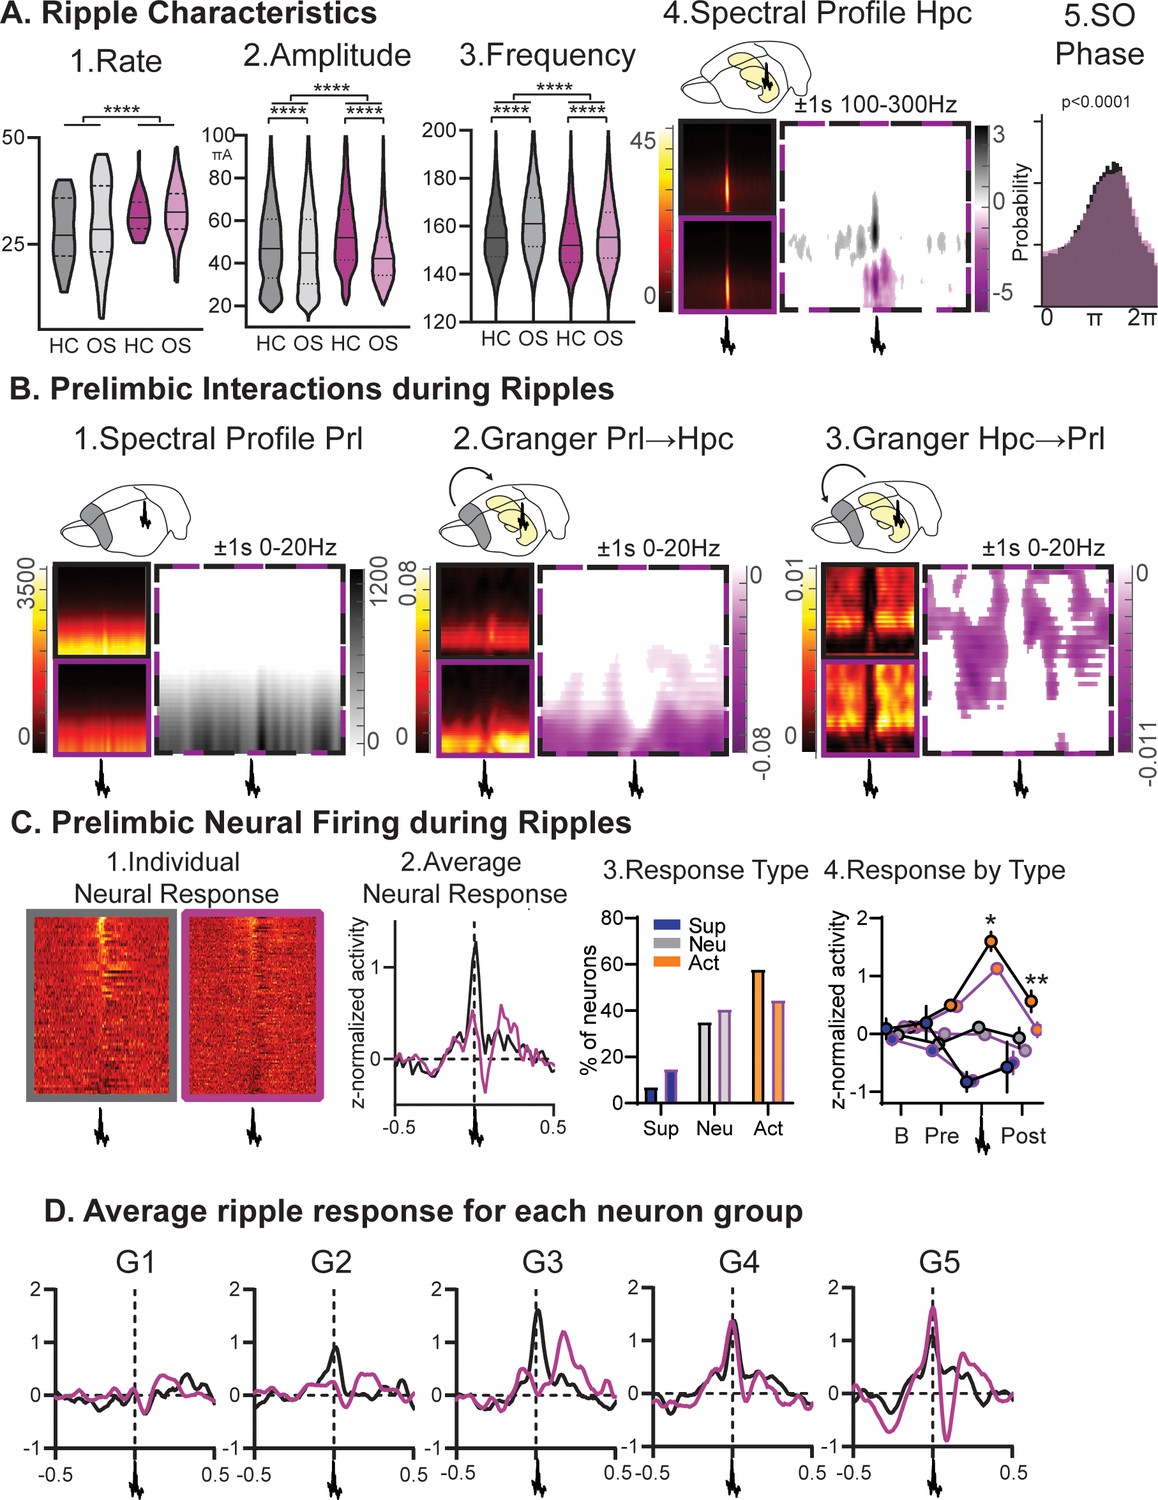
(A) RGS14-overexpressing animals showed changes in 1. ripple rate, 2. amplitude, and 3. frequency (rate KS-D=0.33 p<0.0001, amplitude KS-D=0.13 p<0.0001, frequency KS-D=0.13 p<0.0001). In both groups OS led to a decrease in amplitude and increase in frequency (vehicle KS-D=0.06 p<0.0001, RGS KS-D=0.25 p<0.0001). 4. On the right hippocampal (Hpc) spectral profile 1 s before and after the ripple in the 100–300 Hz range (black Con, purple RGS, dotted Con vs RGS with statistically significant contrast with pixel-based correction for multiple comparison, grey con higher, purple RGS14 higher). 5. Ripples showed less slow oscillation (SO) phase locking in RGS (phase lock circ stat. p<0.0001) (B) 1. This was also reflected in decreased delta power around the ripple (Prelimbic PrL spectral profile 1 s before and after the ripple in the 0–20 Hz range). 2. Time-frequency granger analysis showed higher delta Prl→Hpc and 3. higher theta/beta Hpc→Prl directional connectivity (black Con, purple RGS, dotted Con vs RGS with statistically significant contrast with pixel-based correction for multiple comparison). (C) Neural firing during ripples in prelimbic cortex. From left to right: 1. individual neuron response (each row one neuron) aligned to ripple (middle); 2. average response across neurons (rmANOVA treat*time F98,15288=2.7 p<0.001); 3. neurons were categorized into types with ripple suppressed (blue), ripple neutral (grey) and ripple active (orange, Chi-square 3.46 p=0.18); 4.for each types the response at baseline (200–120ms before ripple), pre-ripple (120 ms-40ms before ripple), during ripple (40ms before – 40ms after ripple peak), and post-ripple (40 ms-120ms after ripple, rmANOVA treat*ripple response F2,162=3.2 p=0.043, post-hoc RGS vs. Con active neurons during p=0.015 and after p=0.003). (D) Same ripple response as in C.2. but now split for the five firing-rate defined neuron groups. Especially faster firing neurons (veh G2-G5, RGS14 G4 and G5) showed higher ripple responses. Control grey, RGS-overexpressing purple, darker shades home cage (HC), lighter shades Object Space Task (OS), *p<0.05, **p<0.01, ***p<0.001, ****p<0.0001.
Figure 4—figure supplement 1
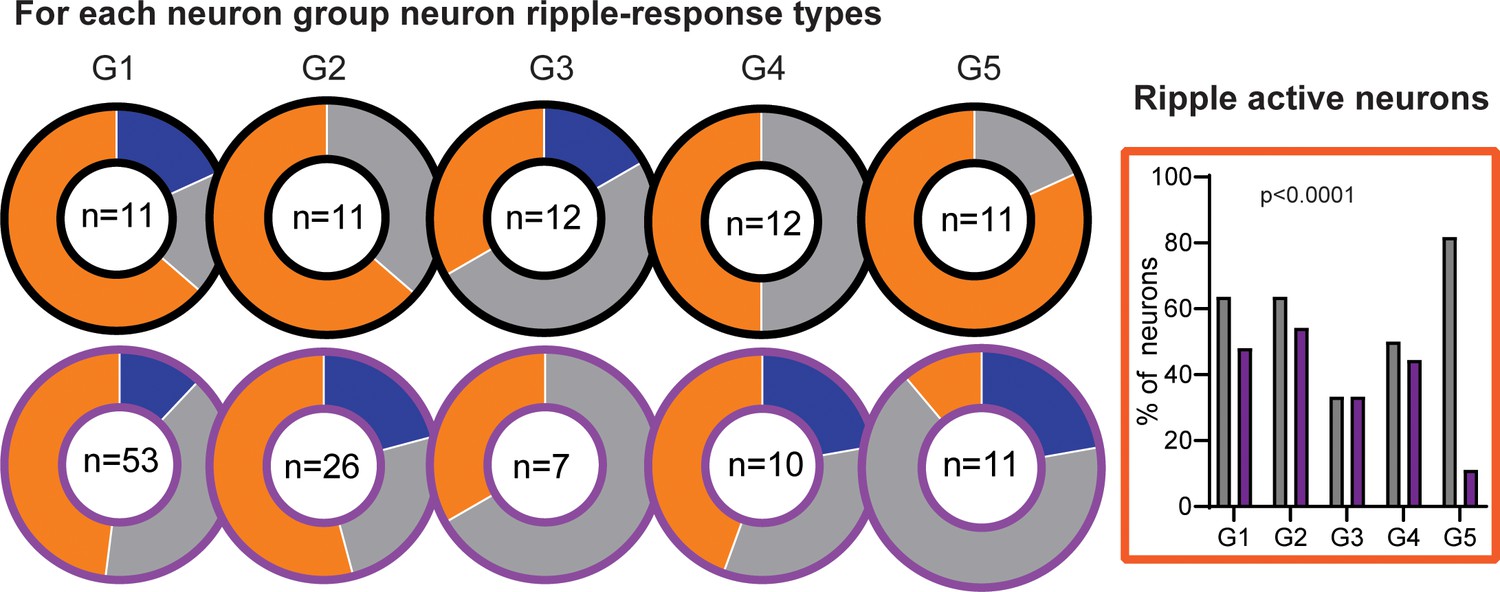
Classification into ripple-supressed (blue), ripple-neutral (grey) and ripple-active (orange) neurons per firing rate group.
On the right ripple active neurons per neuron group. There was a significant effect where in RGS there are less G5 neurons that are ripple active.
Figure 4—figure supplement 2

Hippocampal (top) and prelimbic (bottom) spectral profile around ripple events for control animals (black) and RGS14 (purple) and the contrast (pixel-based correction for multiple comparison).
Purple RGS14 higher, grey Control higher. From top to bottom windows 100–300 Hz, 20–100 Hz and 0–20 Hz.
Figure 4—figure supplement 3
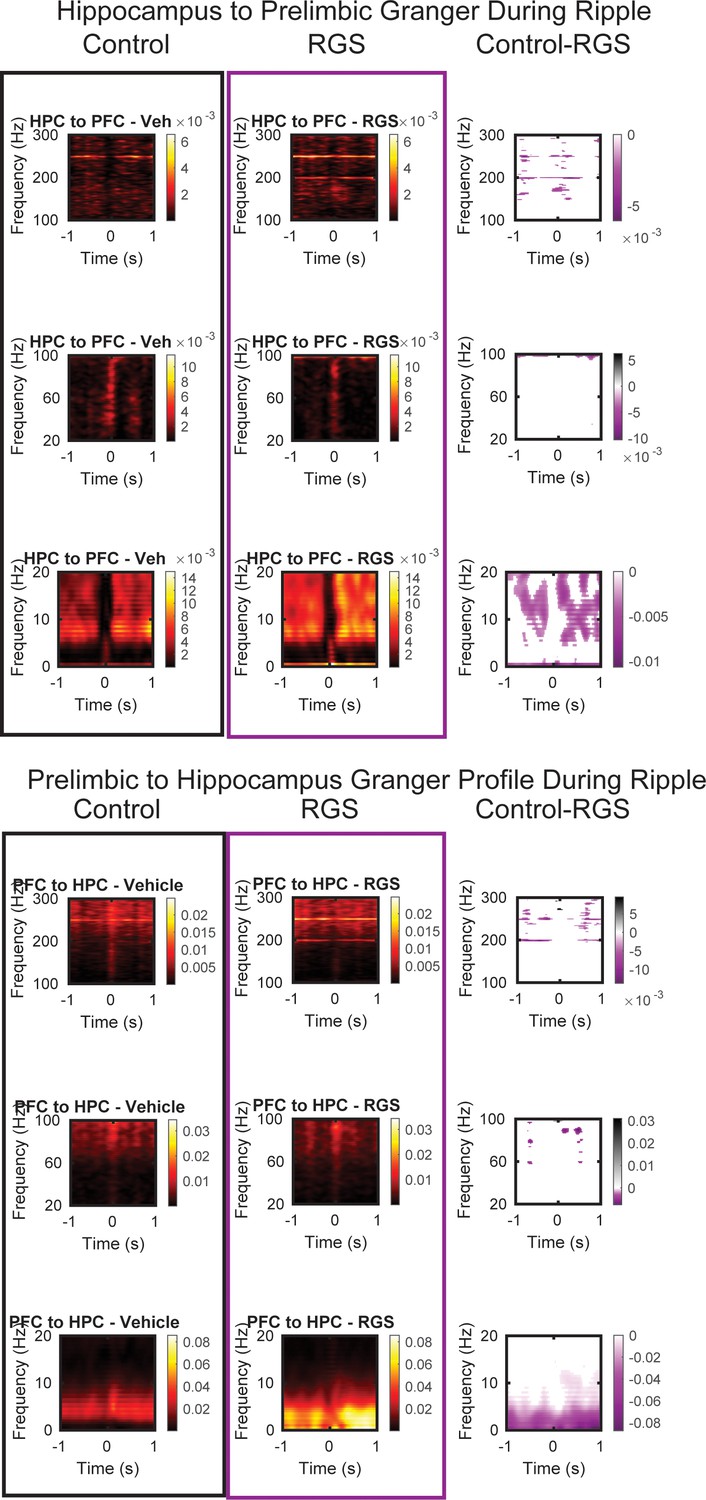
Hippocampal to prelimbic (top) and prelimbic to hippocampus (bottom) granger time frequency analysis around ripple events for control animals (black) and RGS14 (purple) and the contrast (pixel-based correction for multiple comparison).
Purple RGS14 higher, grey Control higher. From top to bottom windows 100–300 Hz, 20–100 Hz and 0–20 Hz.
Figure 5
Conditions.
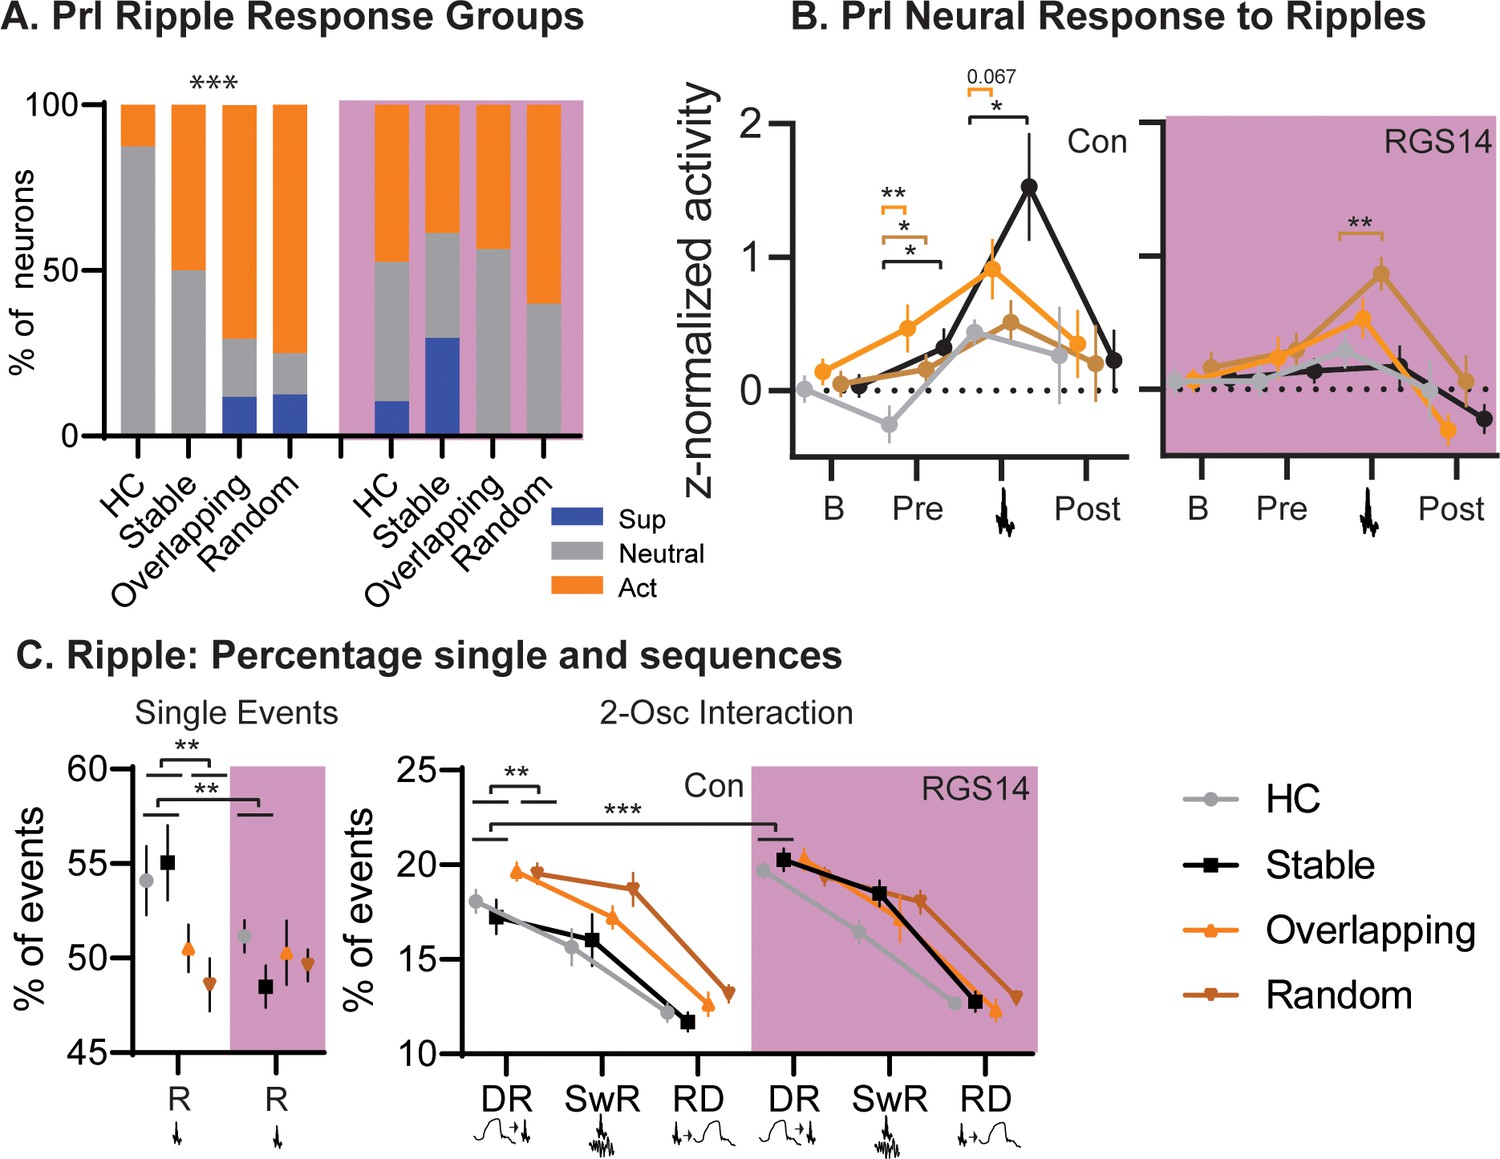
(A) For each condition the percent of neurons that are ripple modulated (suppressed/blue or active/orange) or not (neutral/grey). In controls Overlapping and Random had more ripple-modulated cells, in RGS14 this was already the case for Home Cage and Stable (Chi-square combining Sup and Act to avoid 0, Con Chi-square3=17.1 p=0.0007. RGS14 Chi-square3=3.8 p=0.28.) (B). Ripple response for each condition. There was a significant treatment, condition, time interaction (rmANOVA, Time F3,450=24.6 p<0.001, treatment F1,150=4.4 p=0.037, TimeXtreatment F3,450=4.3 p=0.005, TreatmentXCondition F3,150=2.9 p=0.038, timeXtreatmentXcondition F9,450=1.1 p=0.005). Baseline (200–120ms before ripple), pre-ripple (120 ms-40ms before ripple), during ripple (40ms before – 40ms after ripple peak), and post-ripple (40 ms-120ms after ripple).(C). Single and 2-Osc ripple events split for conditions (normalized to count of all ripple events). In vehicles overlapping and random less ripples occurred as single ripples (R) but more followed delta waves (DR), which was not the case for RGS14 (rmANOVA type F3,681=2269.9 p<0.0001, TypeXTreatment F3,681=4.2 p=0.006, TypeXCondition F3,681=2.4 p=0.013, TypeXTreatmentXCondtion F9,681=2.3 p=0.018). *p<0.05, **p<0.01, ***p<0.001.
Figure 6
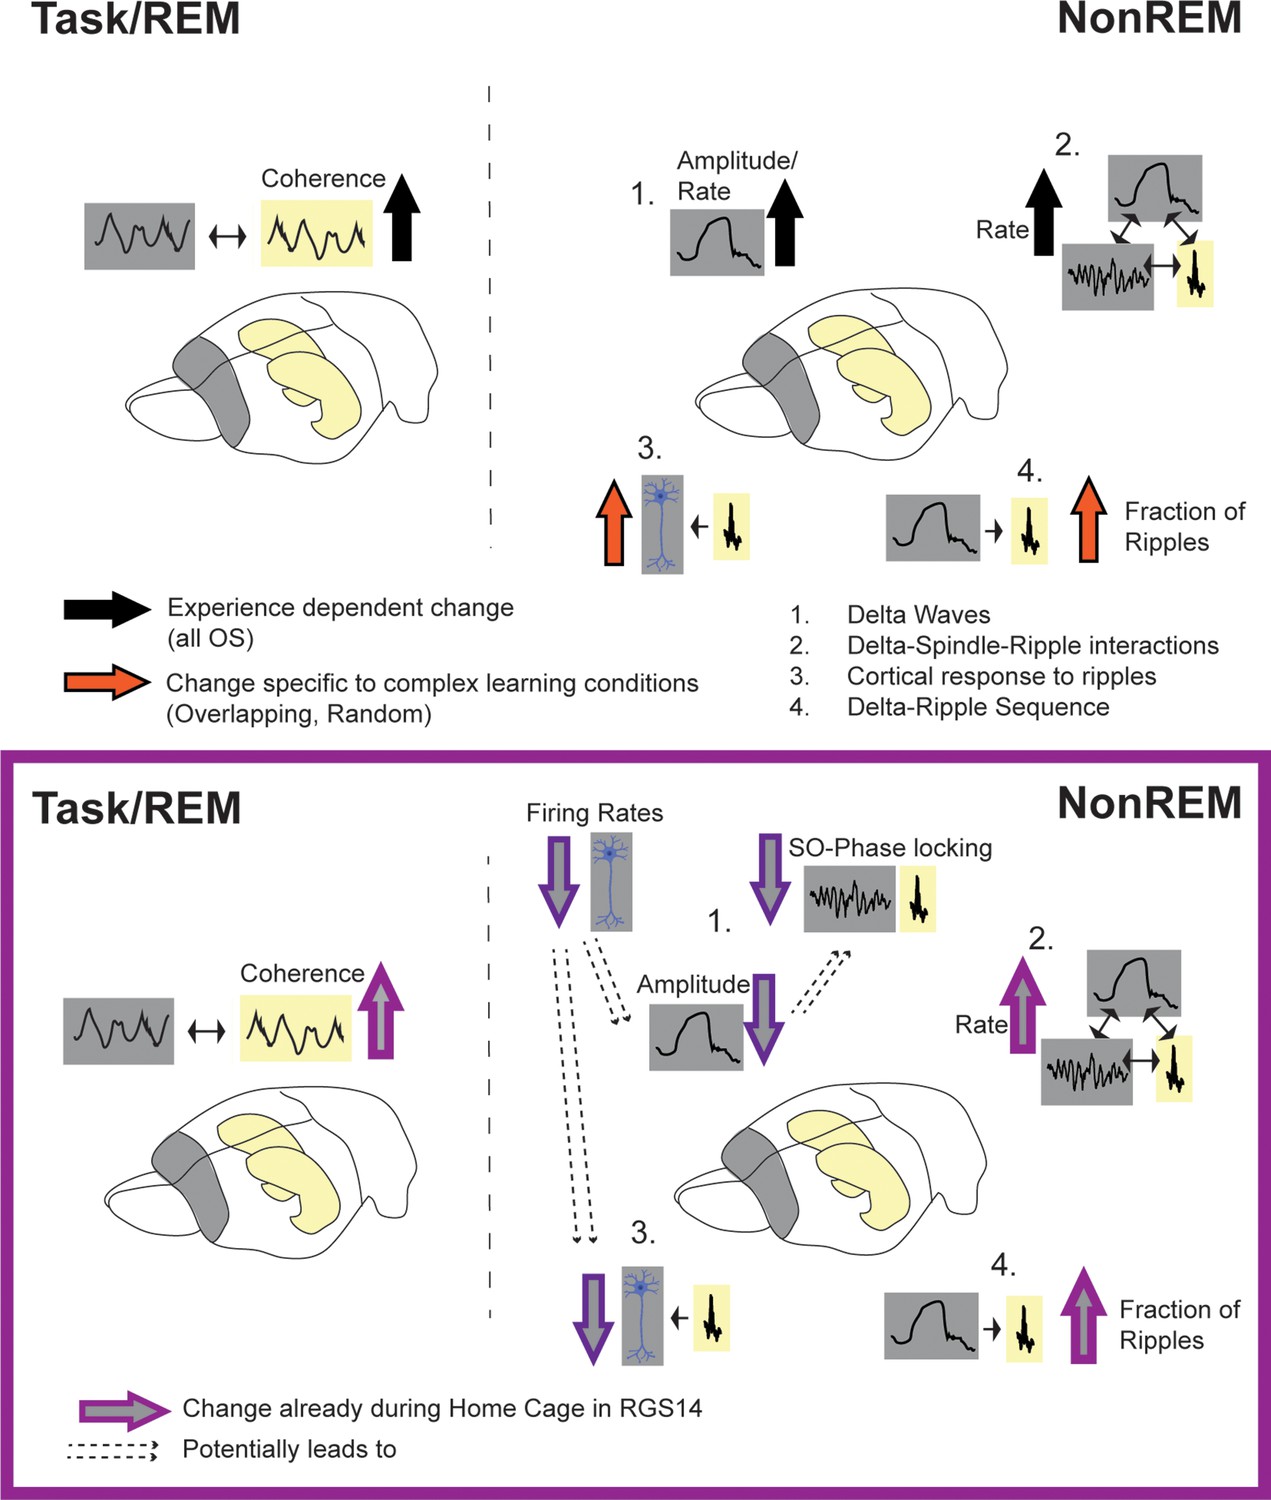
Summary of results.
Top: effects of experience (black arrow, all OS vs HC) and complex learning (orange arrows, Overlapping/Random) in controls. Experience dependent effects: increased hippocampal-cortical theta-coherence during task and REM, increased delta-amplitude in NonREM (1) and increased spindle and delta rate leading also to more oscillatory coupling events (2). Complex Learning effects: increase number of neurons responsive to ripples (3) and increased fraction of ripples following a delta-wave (4). Bottom: Changes in RGS14. Learning effects already seen in Home Cage (light purple): increased theta coherence, increase oscillatory coupling rate (2) and increased Delta-Ripple fraction (4). But decreased, hippocampal-like firing rates lead to smaller cortical delta-waves (more similar to hippocampal delta-waves) and less slow oscillation (SO) phase locking (1) as well as decreased cortical response to ripples (3).
Author response image 1

Author response image 2
Additional files
Download links
A two-part list of links to download the article, or parts of the article, in various formats.
Downloads (link to download the article as PDF)
Open citations (links to open the citations from this article in various online reference manager services)
Cite this article (links to download the citations from this article in formats compatible with various reference manager tools)
Increased cortical plasticity leads to memory interference and enhanced hippocampal-cortical interactions
eLife 12:e84911.
https://doi.org/10.7554/eLife.84911


