Competition between myosin II and βH-spectrin regulates cytoskeletal tension
- Waksman Institute and Department of Molecular Biology and Biochemistry, Rutgers University, United States
- Department of Physiology and Cell Biology, Dorothy M. Davis Heart and Lung Research Institute, The Ohio State University College of Medicine, United States
Figures
Figure 1 with 3 supplements
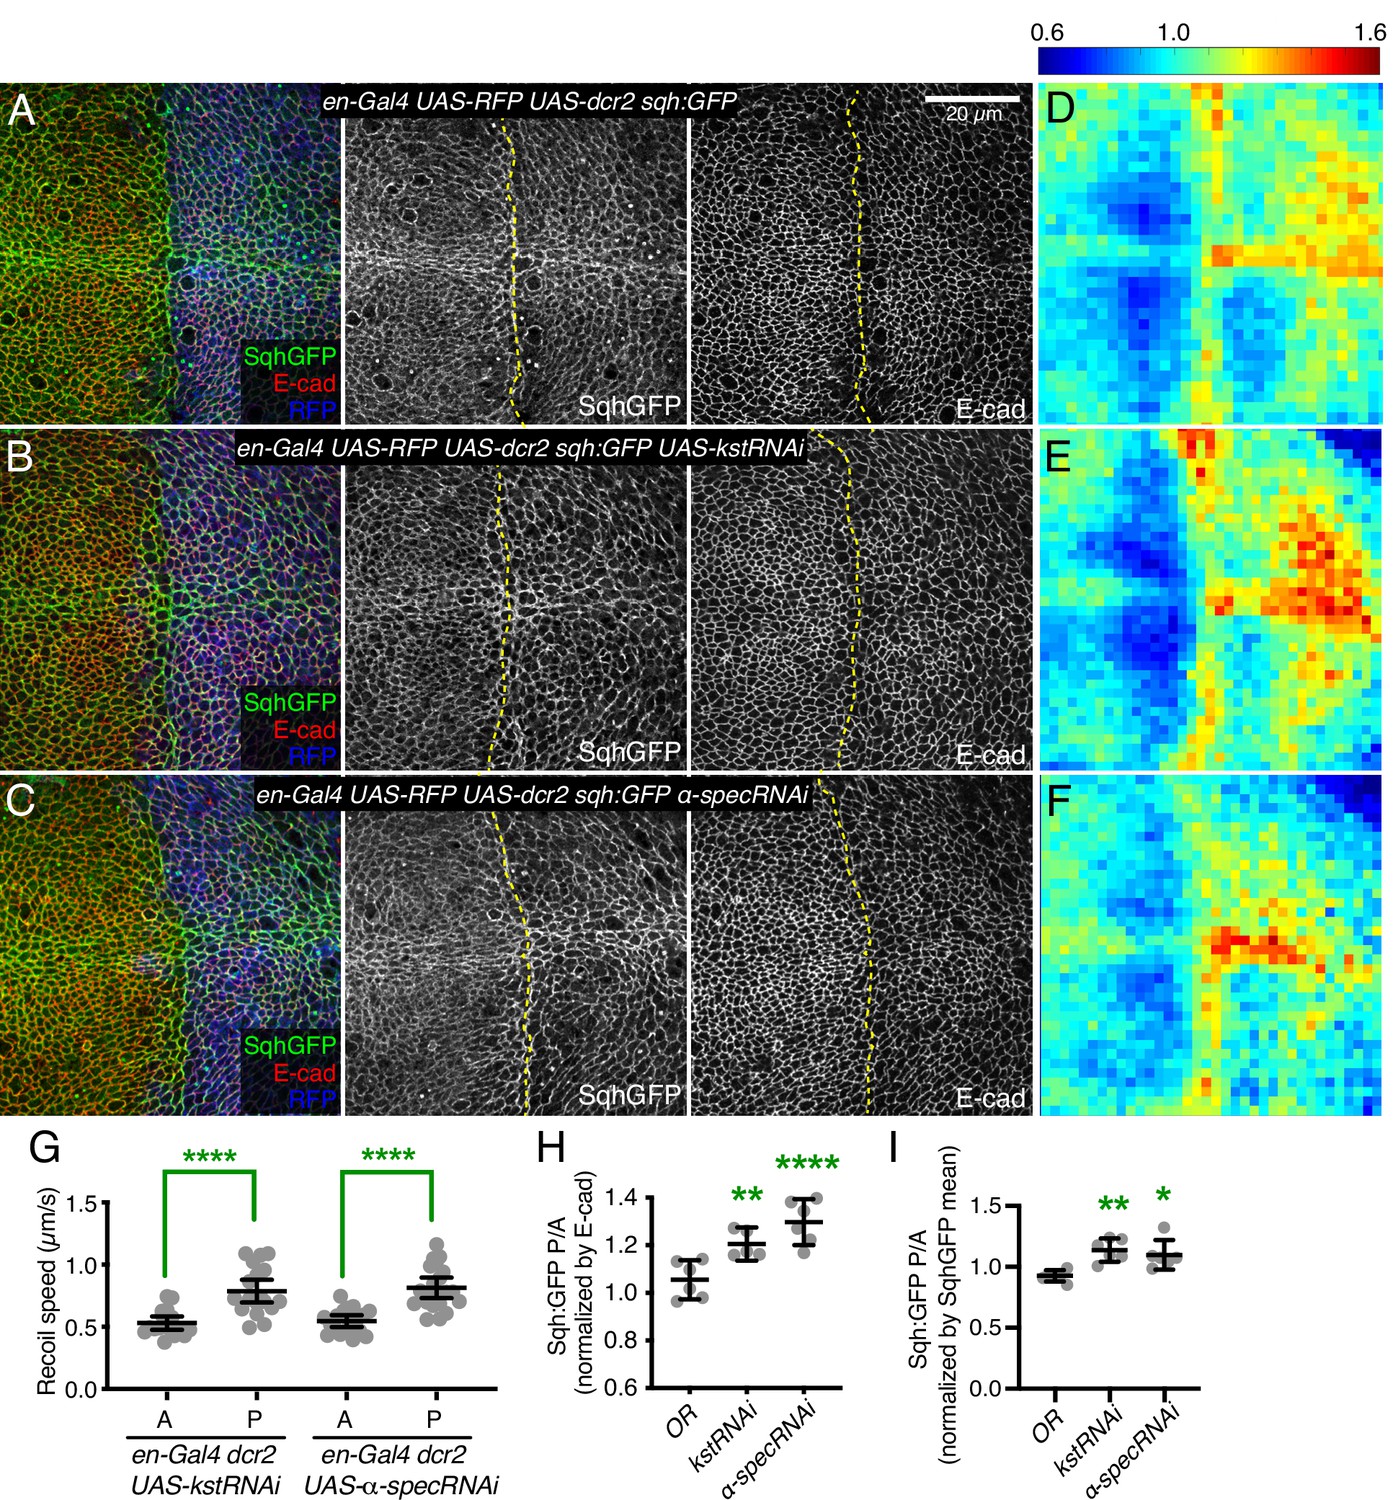
Knockdown of β-heavy spectrin (βH-Spec) or α-spectrin (α-Spec) increases junctional myosin levels in wing discs.
(A–C) Apical sections of wing discs stained for E-cad (red/gray) expressing en-Gal4 UAS-RFP UAS-dcr2 sqh:GFP crossed to control (Oregon-R, OR) (A), UAS-kstRNAi(v37075) (B), or UAS-α-specRNAi (C) showing the effect on Sqh:GFP (green/gray) levels and localization in the posterior compartment (marked by RFP, blue). Dashed yellow line marks A/P compartment boundary. Scale bar = 20 µm; all images are at the same magnification. Panels to the right, in gray, show single channels, as indicated. (D–F) Heat maps of relative junctional Sqh:GFP intensity of wing discs. Average levels of Sqh:GFP relative to E-cad levels are shown for the different genotypes analyzed in A–C. Heat map scale is indicated on the top. Number of wing discs used for analysis: Control (OR), n=6; UAS-kstRNAi, n=5; UAS-α-specRNAi, n=6. (G) Average recoil velocities after laser cutting of cell junctions in anterior (A) or posterior (P) compartments of wing discs expressing UAS-kstRNAi or UAS-α-specRNAi in posterior cells under en-Gal4 control (n=20). (H–I) Quantification of Sqh:GFP normalized to E-cadherin in posterior cells (P) compared to anterior cells (A) in wing disc expressing the indicated constructs, displayed as individual values, normalized by E-cad (H) or normalized by the mean intensity of Sqh:GFP (I). Data are shown as mean±95% CI. Statistical significance in (G) was determined by Student’s t-test between A and P. For (H) and (I), statistical significance was determined by a one-way analysis of variance (ANOVA) with Dunnett’s multiple comparison test relative to the control (Oregon-R): ns: not significant, *p<0.05; **p≤0.01; ***p≤0.001; ****p≤0.0001.
Figure 1—figure supplement 1
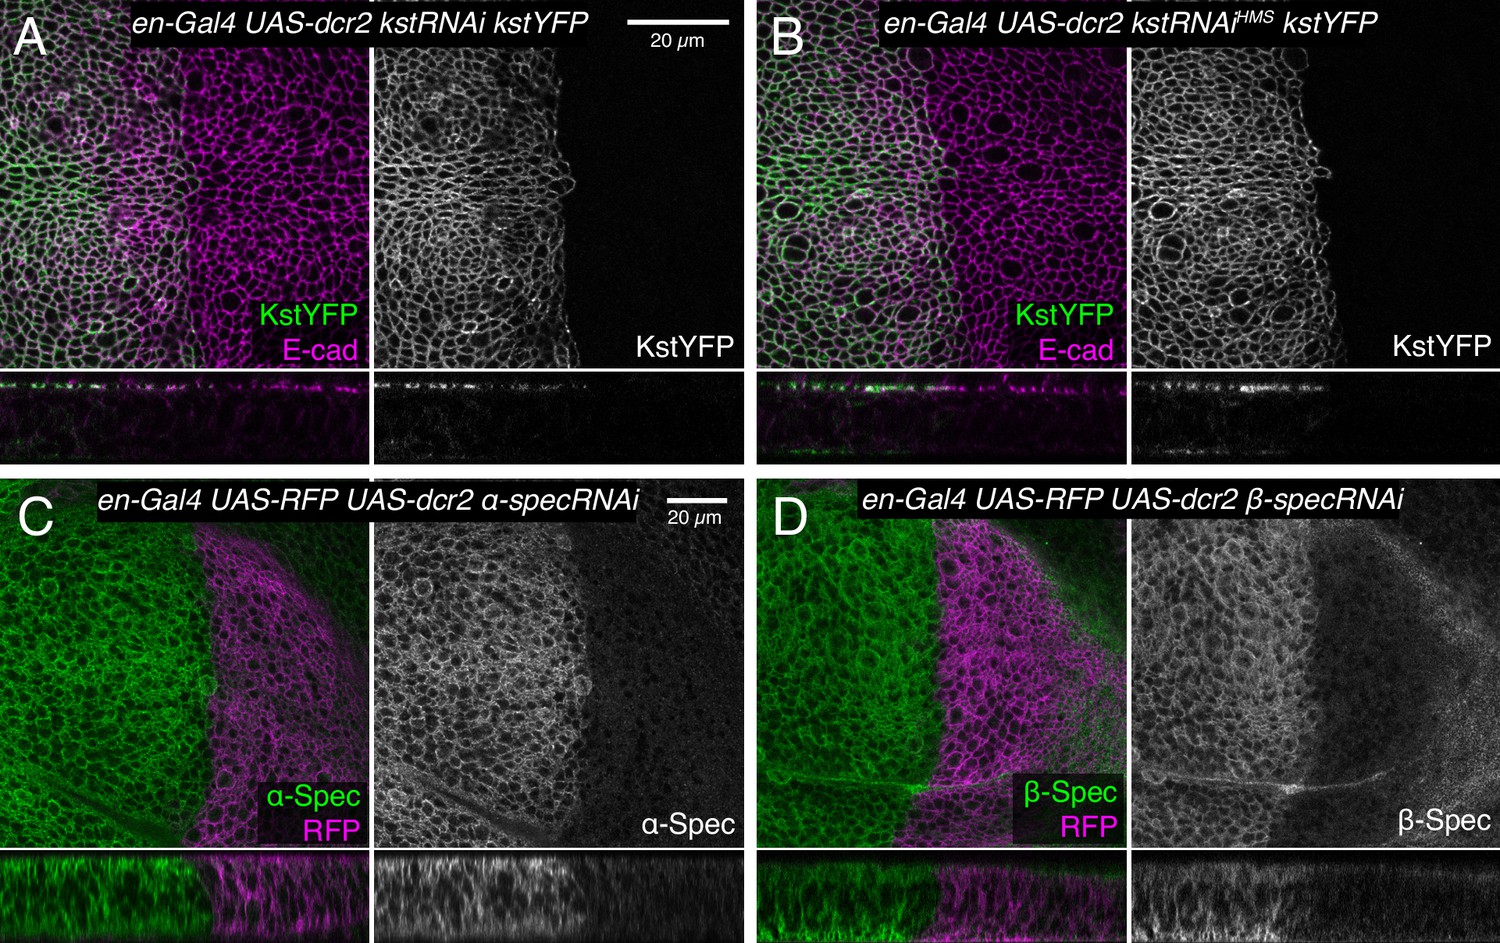
Validation of RNAi lines.
(A–B) Horizontal (upper panels) and vertical (lower panels) sections of third instar wing imaginal discs expressing en-Gal4 UAS-dcr2 Kst:YFP (green/gray) crossed with UAS-kstRNAi(v37075) (A) and UAS-kstRNAi(HMS00882) (B), stained for E-cad (magenta). (C–D) Horizontal (upper panels) and vertical (lower panels) sections of third instar wing imaginal discs expressing en-Gal4 UAS-RFP (magenta) UAS-dcr2 crossed with UAS-α-specRNAi (C) or UAS-β-specRNAi (D) immunostained with α-Spec antibody or β-spectrin (β-Spec) antibody, respectively (green/gray). Gray scale images show the spectrin alone. β-SpecRNAi severely reduced β-Spec staining in most of the wing disc but some signal remains near the peripodial membrane, which likely reflects non-specific staining by the anti-sera. Scale bar = 20 µm.
Figure 1—figure supplement 2
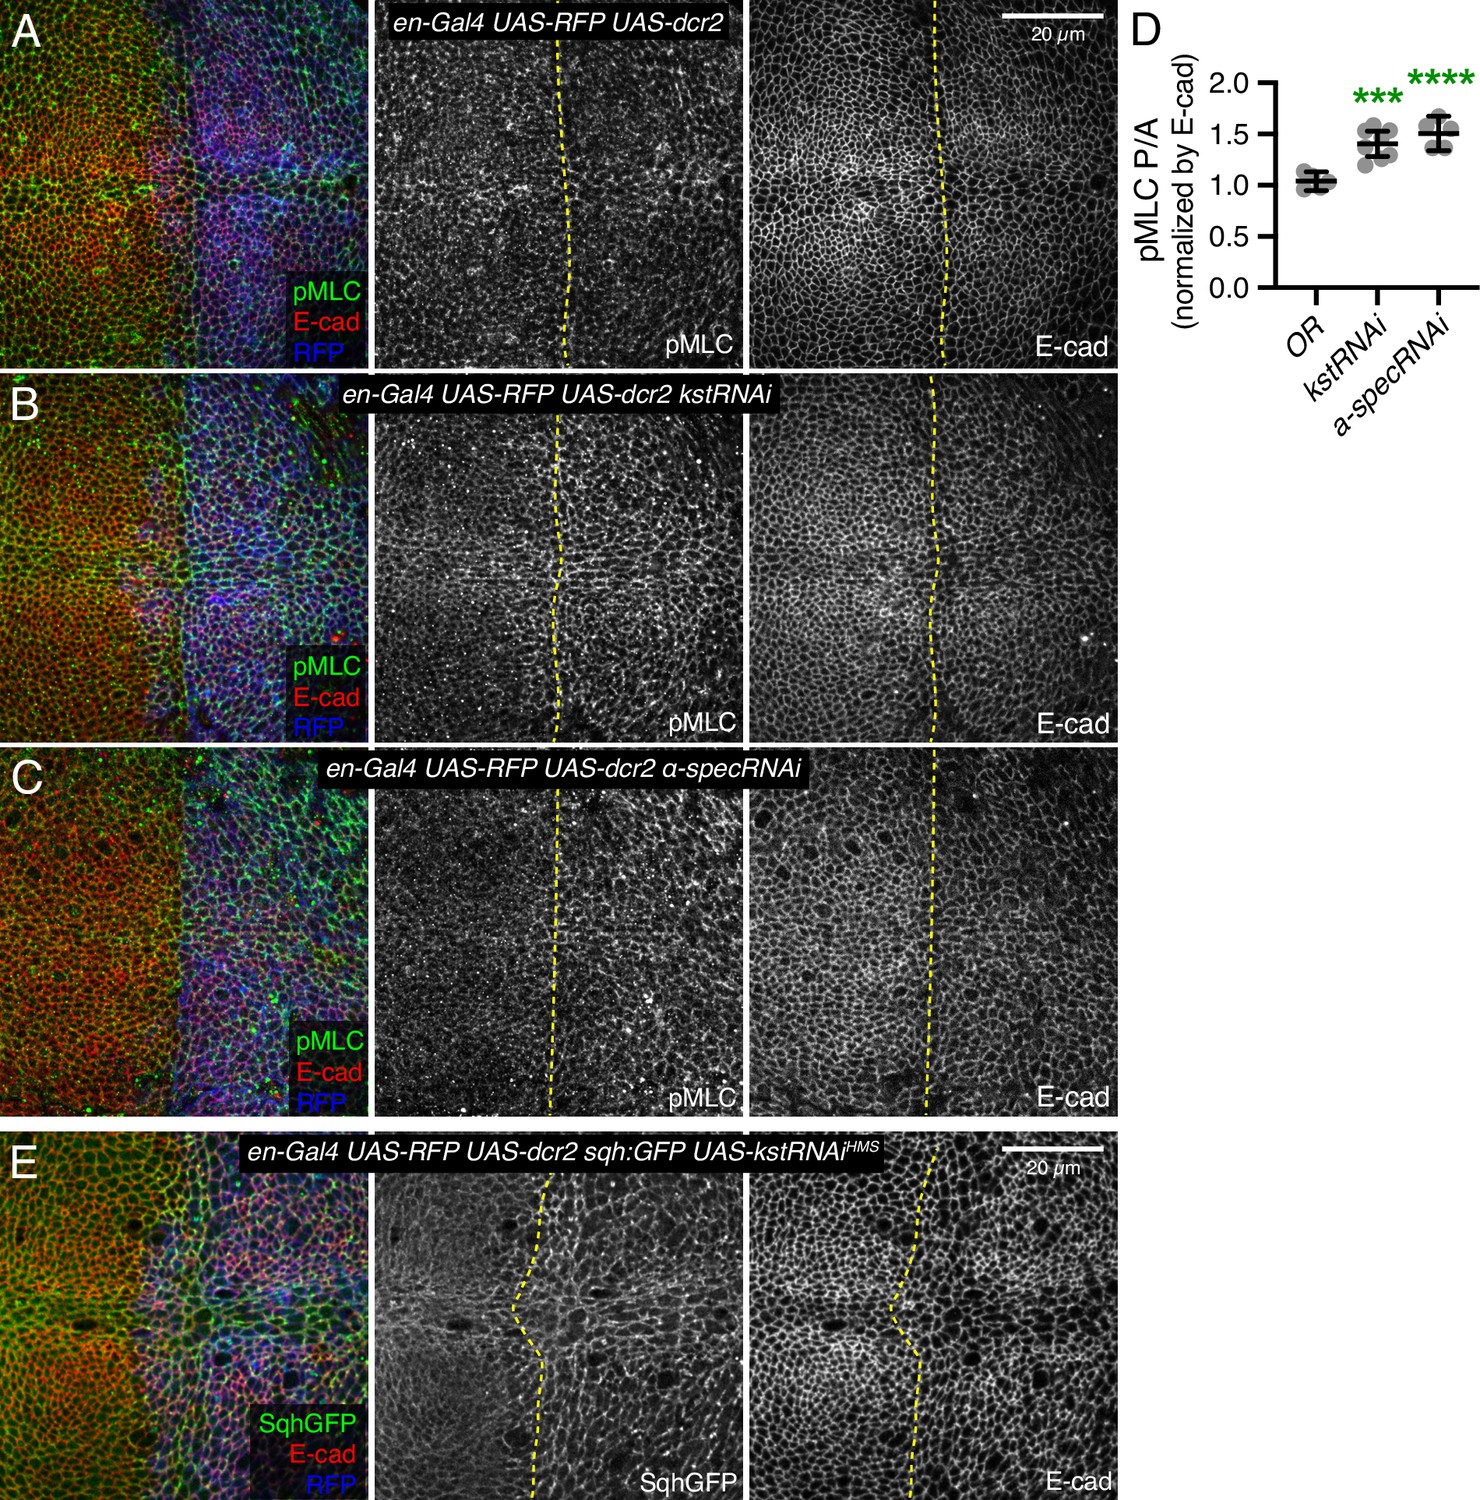
Modulation of levels of total and active myosin in wing discs by spectrins.
(A–C) Apical sections of third instar wing imaginal discs expressing en-Gal4 UAS-dcr2 UAS-RFP (blue) crossed with control (A), UAS-kstRNAi(v37075) (B), and UAS-α-SpecRNAi (C), stained with pMLC antibody (green/gray) and E-cad (red/gray). (D) Quantification of pMLC normalized to E-cadherin in posterior cells (P) compared to anterior cells (A) in wing discs expressing the indicated constructs, displayed as individual values. Number of wing discs used for analysis: Control (OR), n=5; UAS-kstRNAi, n=8, UAS-α-SpecRNAi, n=5. Error bars show mean with 95% CI. Statistical significance was determined by one-way analysis of variance (ANOVA) with Dunnett’s multiple comparison test. Statistical comparisons are shown relative to the control (OR). ***p≤0.001, ****p<0.0001. (E) Third instar wing imaginal discs expressing en-Gal4 UAS-dcr2 UAS-RFP (blue) sqh:GFP (green) in combination with UAS-kstRNAi(HMS00882). Panels to the right, in gray, show single channels, as indicated.
Figure 1—figure supplement 3

α-Spectrin (α-Spec) knockdown decreases wing disc thickness.
(A–C) Lateral views of wing discs expressing en-Gal4 UAS-RFP UAS-dcr2 crossed with control (Oregon-R, OR) (A), UAS-kstRNAi(v37075) (B), or UAS-α-specRNAi (C), stained with phalloidin to label F-actin (green), Hoechst to label nuclei (blue) and with the posterior compartment marked by RFP (red) and mounted with 40 µm spacers to avoid compressing the discs. Dashed lines indicate 30 μm from the A/P boundary. Scale bar = 20 μm. (D) Quantification of wing imaginal disc thickness determined 30 μm from the A/P boundary in anterior (A) and posterior (P) sides for the different genotypes indicated. Statistical significance was determined by Student’s t-test. ns: not significative; **p≤0.01; ***p≤0.001.
Figure 2 with 1 supplement
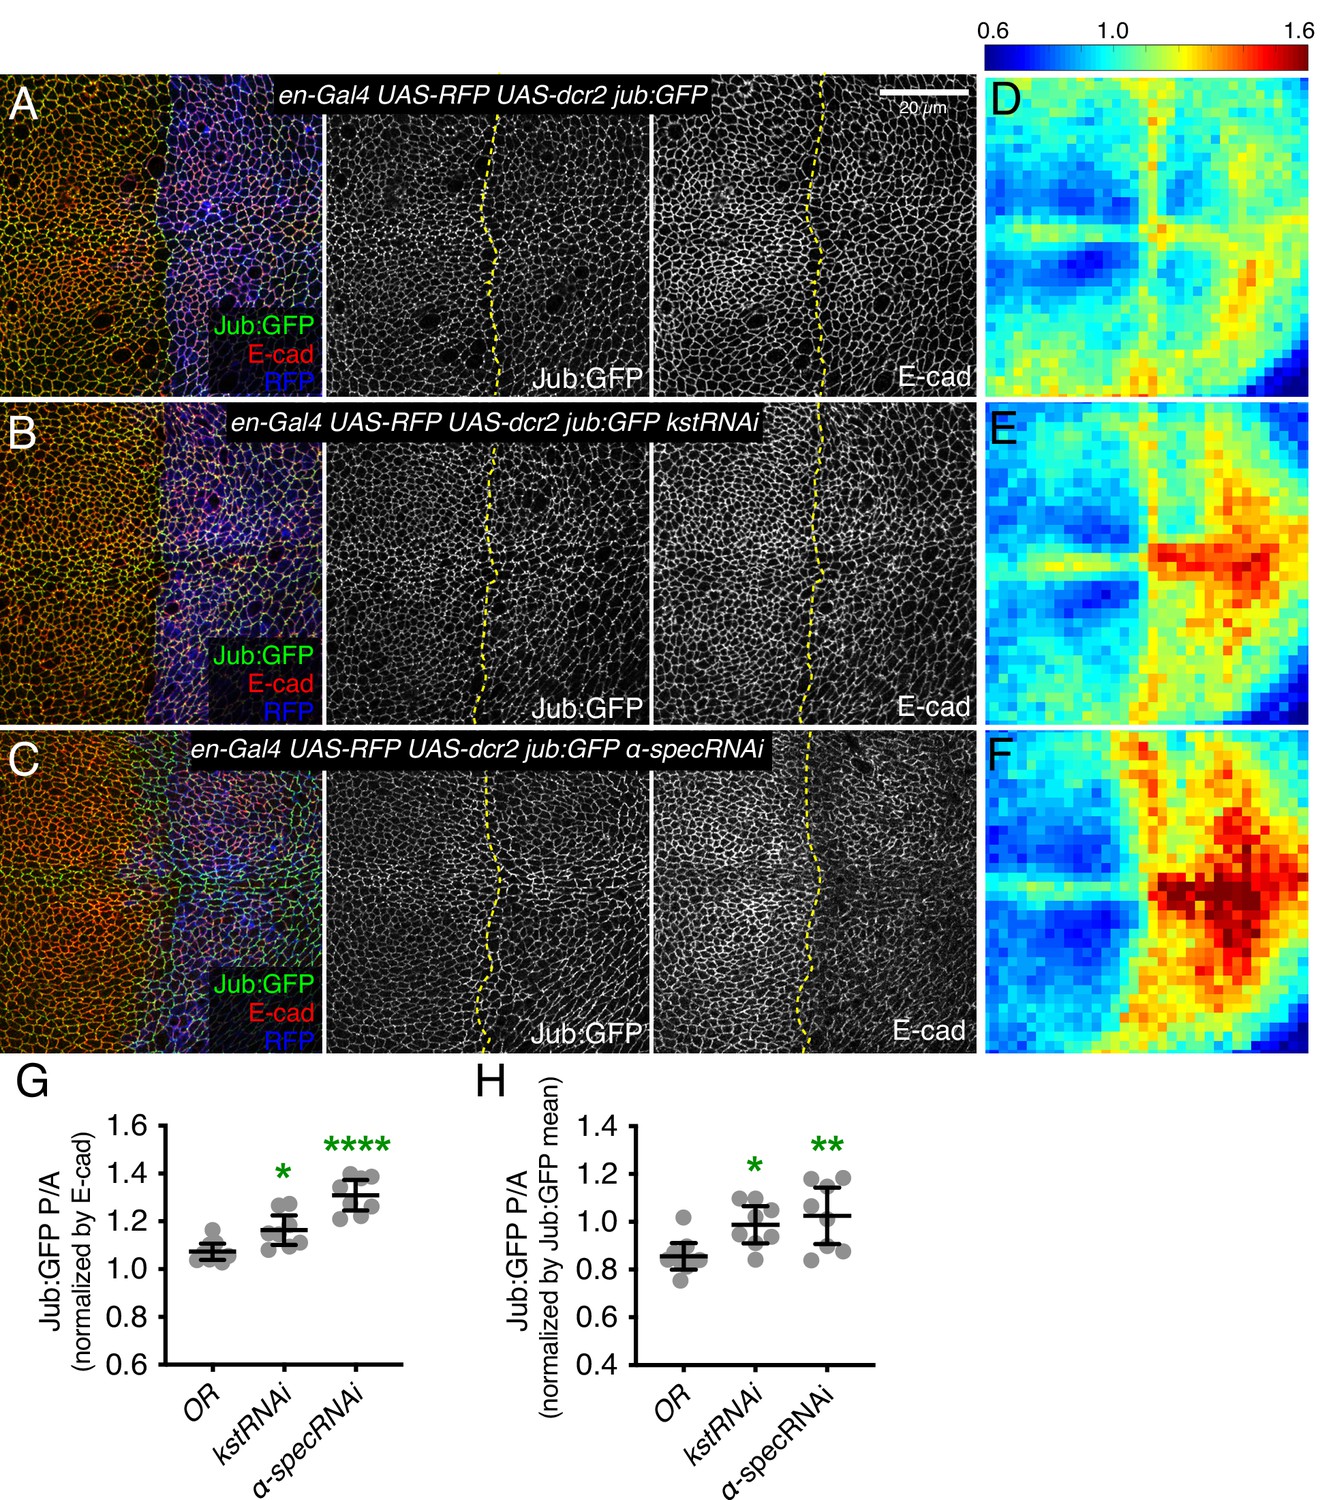
Knockdown of β-heavy spectrin (βH-Spec) or α-spectrin (α-Spec) increases junctional Jub levels in wing discs.
(A–C) Apical sections of wing discs expressing en-Gal4 UAS-RFP UAS-dcr2 Jub:GFP crossed to control (Oregon-R, OR) (A), UAS-kstRNAi(v37075) (B), or UAS-α-specRNAi (C) stained for E-cad (red/gray) showing the effect on Jub:GFP (green/gray) in the posterior compartment (marked by RFP, blue). Dashed yellow line marks the A/P compartment boundary. Panels to the right, in gray, show single channels, as indicated. Scale bar = 20 μm. (D–F) Heat maps of relative junctional Jub:GFP intensity of wing discs. Levels of Jub:GFP relative to E-cad levels are shown for the different genotypes analyzed. Heat map scale is indicated on the top. Number of wing discs used for analysis: Control (OR), n=9; UAS-kstRNAi, n=8; UAS-α-specRNAi, n=8. (G–H) Quantification of Jub:GFP normalized to E-cadherin (G) or to Jub:GFP mean intensity (H) in posterior cells compared to anterior cells (P/A) in wing discs expressing the indicated constructs, displayed as individual values. Data are shown as mean±95% CI. Statistical significance was determined by one-way analysis of variance (ANOVA) with Dunnett’s multiple comparison test relative to the control (Oregon-R): ns: not significant, *p<0.05; **p≤0.01; ***p≤0.001; ****p≤0.0001.
Figure 2—figure supplement 1

β-Heavy spectrin (βH-Spec) modulates the recruitment of Jub:GFP to adherens junctions (AJs).
(A) Third instar wing disc expressing en-Gal4 UAS-dcr2 UAS-RFP (blue) Jub:GFP (green/gray) in combination with UAS-kstRNAi(HMS00882) (A) stained for E-cad (red/gray). Dashed yellow line marks A/P compartment boundary. (B, C) Apical sections of wing discs expressing en-Gal4 UAS-RFP UAS-dcr2 Jub:GFP crossed to control (Oregon-R, OR) (B), UAS-kstRNAi(v37075) (C) from Figure 2. Columns to the right show higher magnification views of the Jub:GFP channel anterior (a) and posterior boxes (p).
Figure 3 with 1 supplement
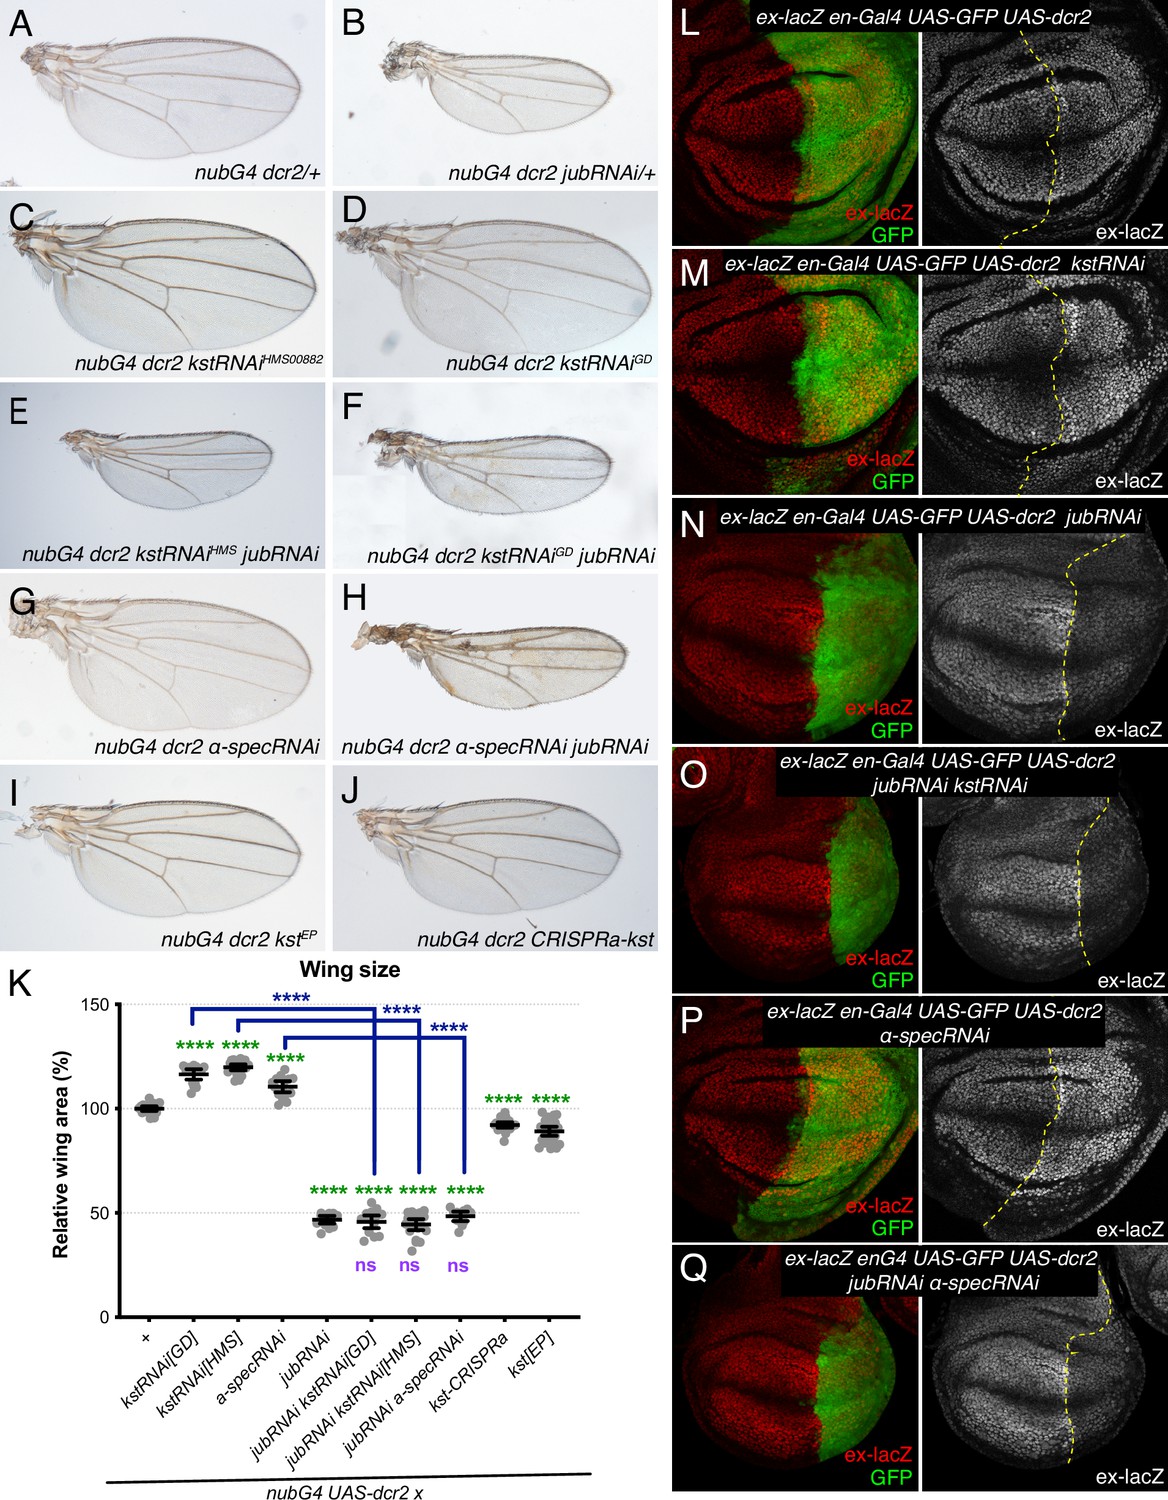
Jub is required for β-heavy spectrin (βH-Spec) and α-spectrin (α-Spec) regulation of wing size and ex-lacZ.
(A–J) Representative adult wings from flies cultured at 29°C and expressing UAS transgenes altering spectrin and/or Jub expression under control of a nub-Gal4 (nubG4) driver. (K) Quantification of wing area (mean±95% CI). Number of wing discs used for analysis: Control (OR), n=20; UAS-kstRNAi[GD], n=20; UAS-kstRNAi[HMS], n=21; UAS-α-specRNAi, n=20; UAS-jubRNAi, n=20, UAS-jubRNAi UAS-kstRNAi[GD], n=20; UAS-jubRNAi UAS-kstRNAi[HMS], n=20; UAS-jubRNAi UAS-α-specRNAi, n=20; UAS-kstCRISPRa, n=22; UAS-kst[EP], n=26. Statistical significance was determined by a one-way analysis of variance (ANOVA) with Tukey’s multiple comparison test. Statistical comparisons are shown relative to nub-Gal4 UAS-dcr2/+in green, relative to nub-Gal4 UAS-dcr2 UAS-jubRNAi in purple and relative to UAS-kstRNAi in blue. (L–Q) Third-instar wing discs expressing ex-lacZ en-Gal4 UAS-dcr2 UAS-GFP (green) crossed to OR (L), UAS-kstRNAi (M), UAS-jubRNAi (N), UAS-jubRNAi UAS-kstRNAi (O), UAS-α-specRNAi (P), UAS-jubRNAi UAS-α-specRNAi (Q), stained for expression of ex-lacZ (red/white). Dashed yellow line indicates the A/P compartment boundary.
Figure 3—figure supplement 1
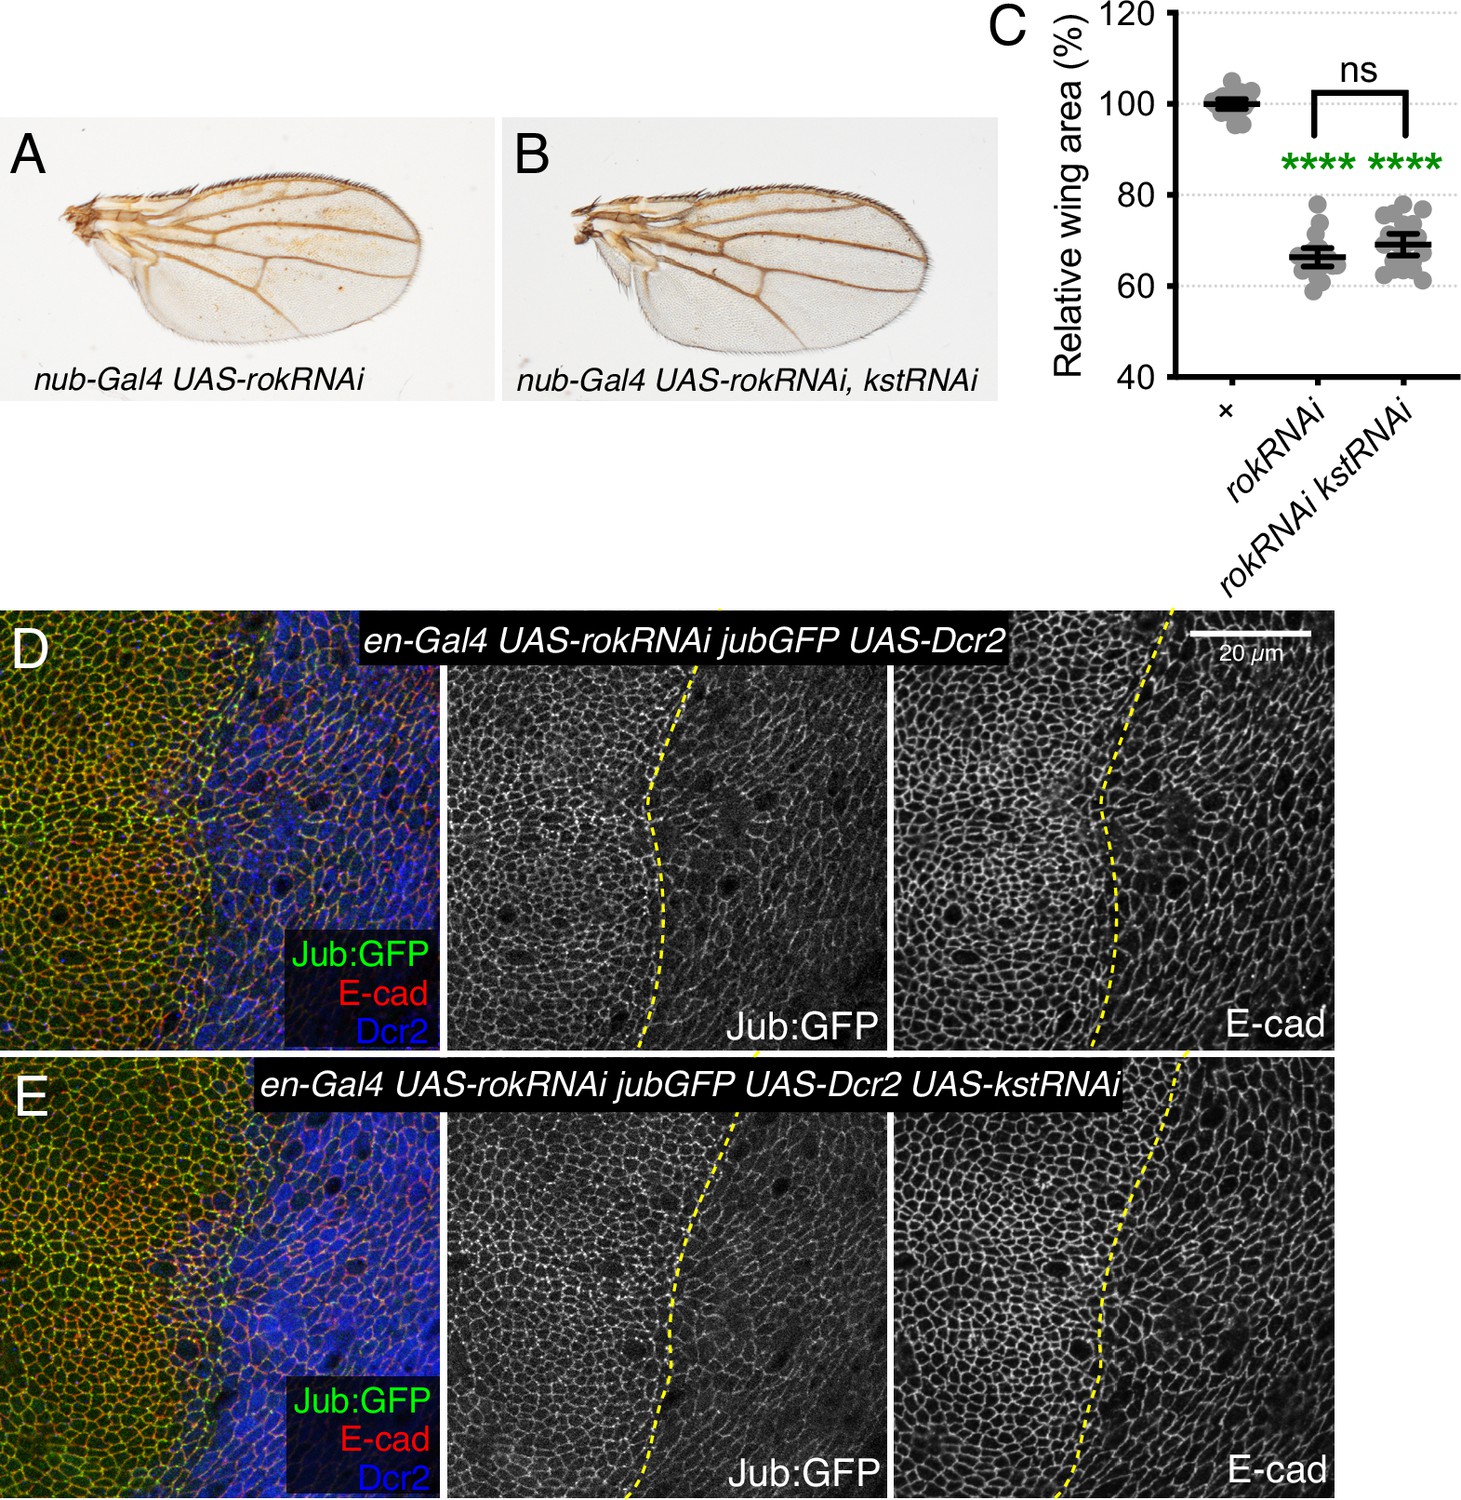
kst phenotypes are suppressed by reduction of tension.
(A–B) Representative adult wings from flies cultured at 29°C expressing nub-Gal4 and UAS transgenes reducing myosin activity (UAS-rokRNAi) enhancing RNAi (UAS-Dcr2) and in (B) knocking down βH-Spec (UAS-kstRNAi(v37075)). (C) Quantification of wing area (mean and 95% CI, n=20). Statistical significance was determined by one-way analysis of variance (ANOVA) with Tukey’s multiple comparison test. Statistical comparisons are shown relative to nub-Gal4 UAS-dcr2 (data from Figure 3) in green or between nub-Gal4 UAS-dcr2 UAS-rokRNAi genotypes in black. (D–E) Sections of wing imaginal discs expressing en-Gal4 UAS-rokRNAi UAS-Dcr2 Jub:GFP crossed to control (Oregon-R) (D) or UAS-kstRNAi(v37075) (E) stained for E-cad (red/gray) showing the effect of reducing cytoskeletal tension on Jub:GFP (green/gray) in the posterior compartment (marked by Dcr2 immunostaining, blue). Scale bar = 20 μm.
Figure 4
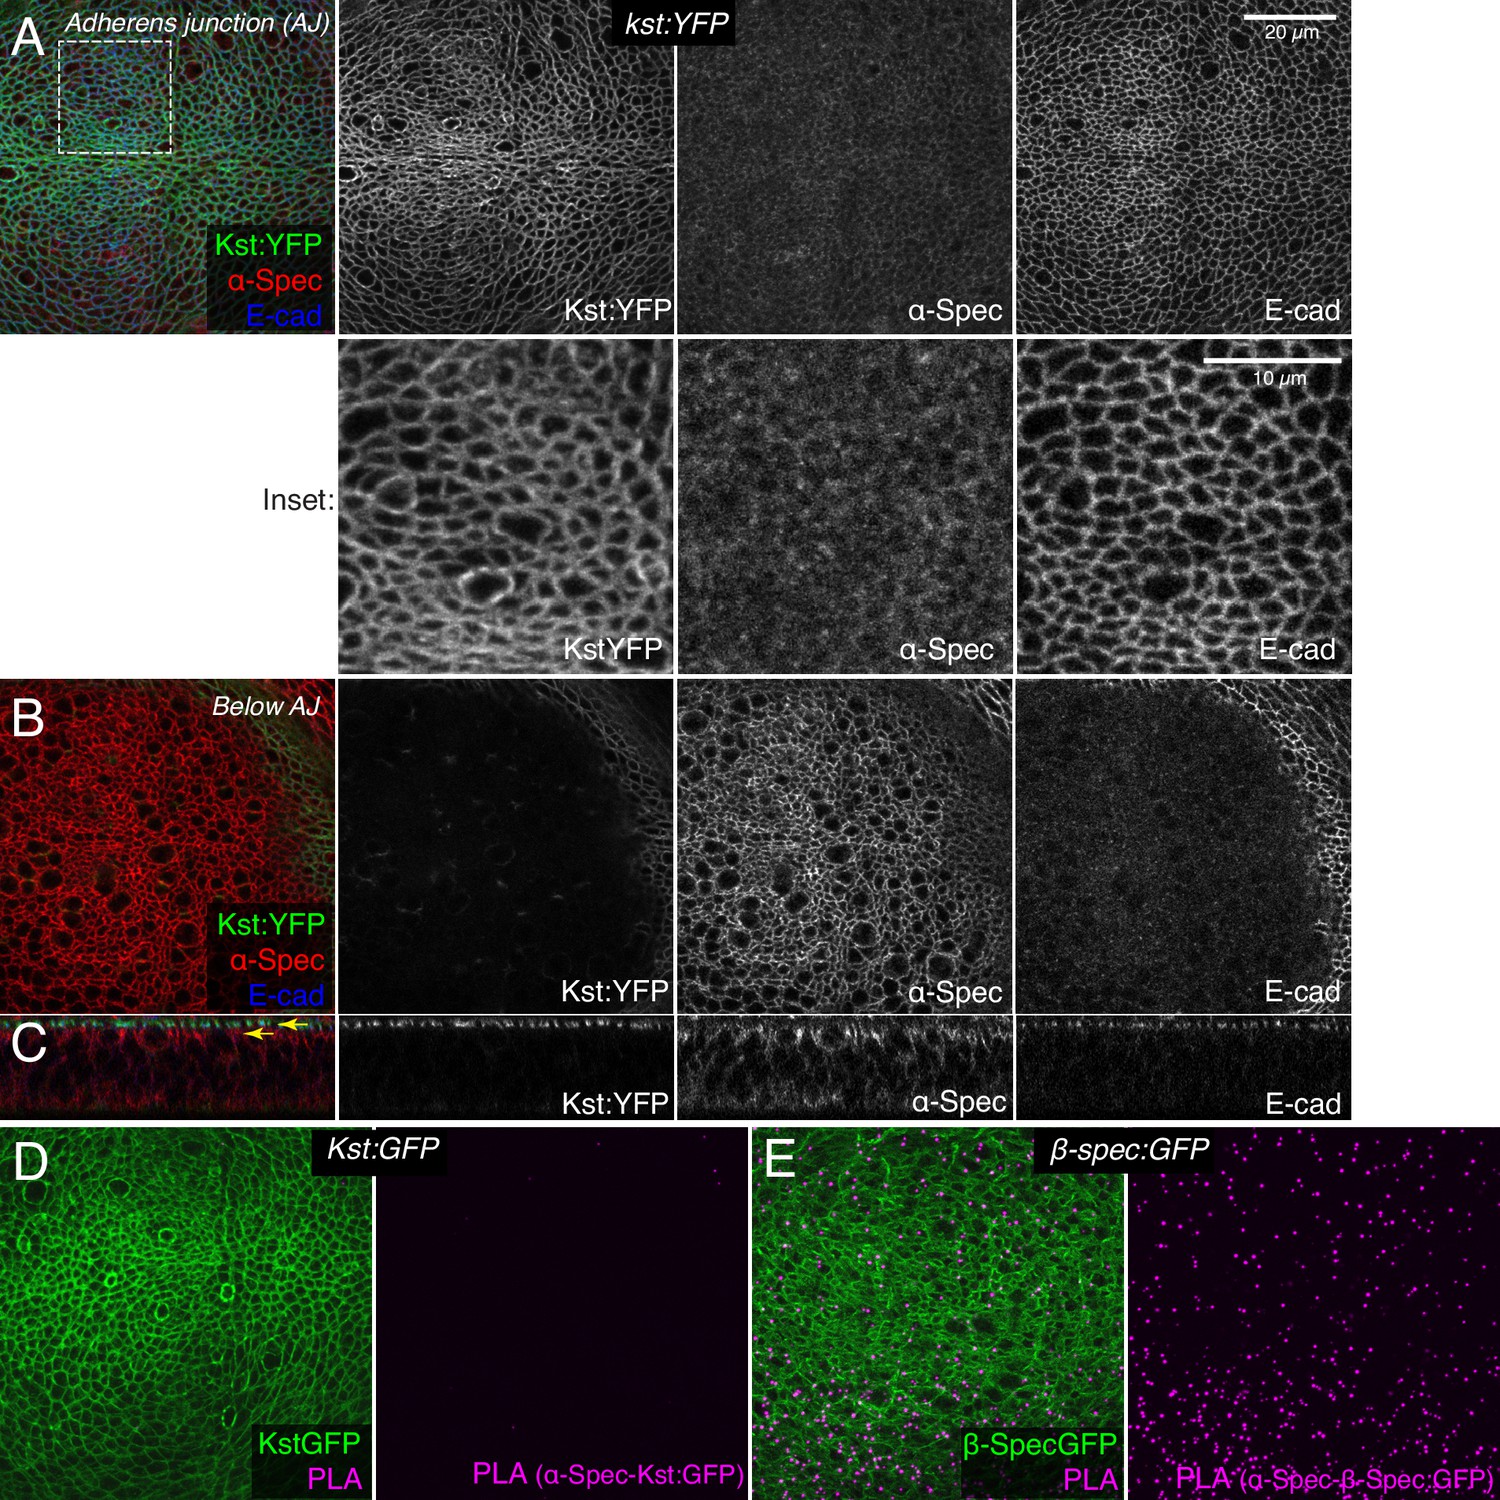
β-Heavy spectrin (βH-Spec) and α-spectrin (α-Spec) do not co-localize in wing discs.
(A–C) Wing discs expressing Kst:YFP immunostained with α-Spec (red/gray) and E-cad (blue/gray) antibodies showing the localization of βH-Spec (Kst:YFP, green/gray) and α-Spec at the adherens junction (AJ) (A), below the AJ (B) and in cross sections (C). Upper yellow arrow in cross section indicates AJ layer, lower yellow arrow indicates ‘Below AJ’ layer. Inset shows higher magnification of single channels from the boxed region in A. (D, E) Wing discs expressing Kst:GFP (D) or β-Spec:GFP (E), with GFP in green and signal from proximity ligation assays (PLA) using rabbit anti-GFP and mouse α-Spec antibodies in magenta.
Figure 5
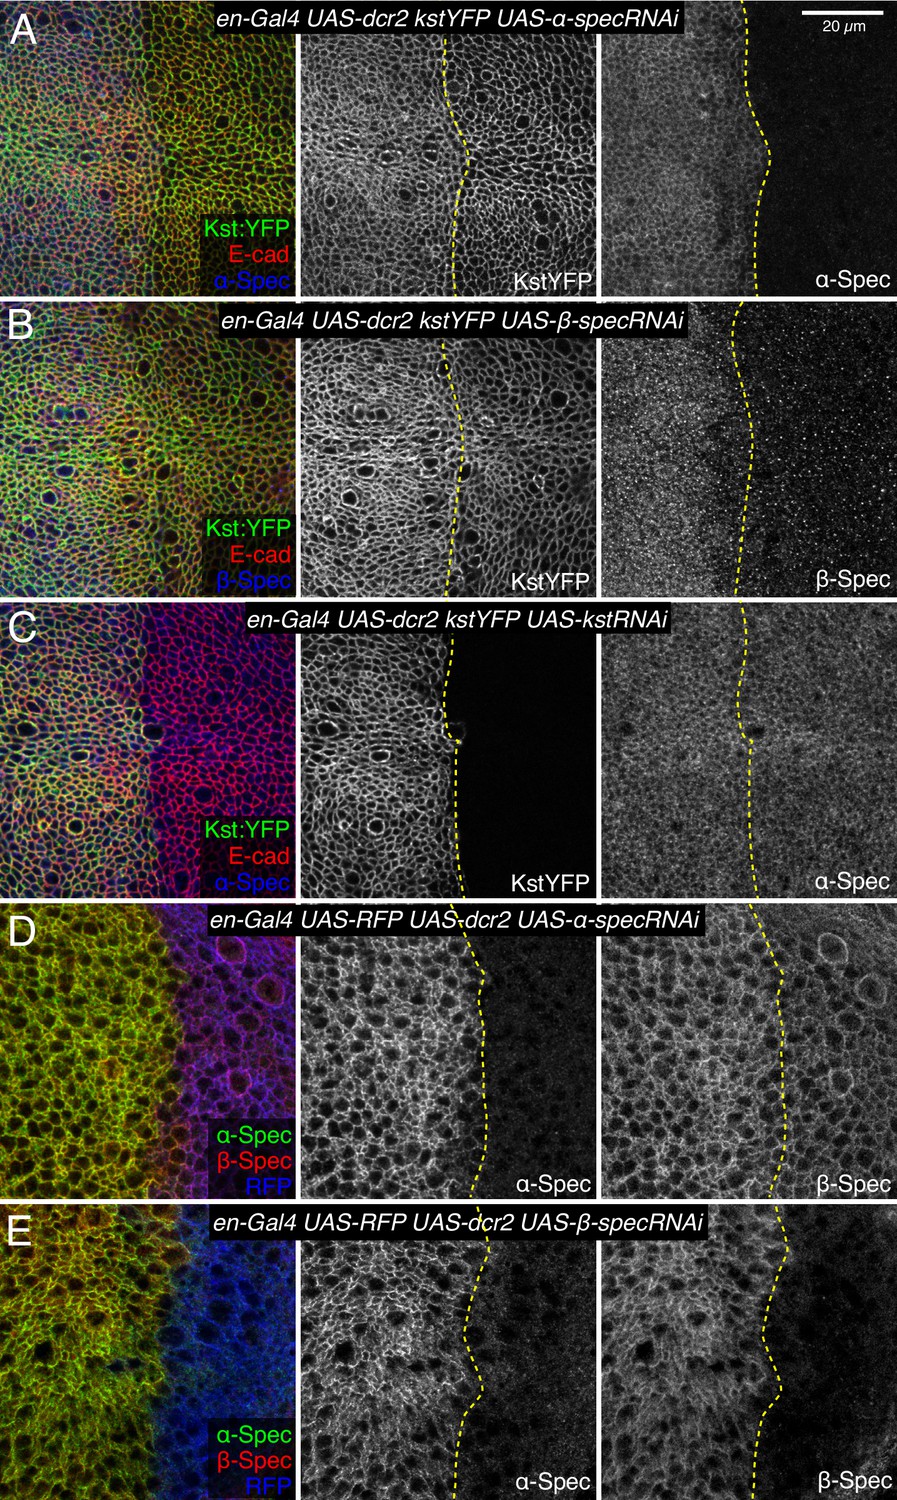
Influence of spectrin knockdowns on spectrin subunit localization in wing discs.
(A–C) Apical sections of wing discs expressing en-Gal4 UAS-dcr2 Kst:YFP (green/gray) along with UAS-α-specRNAi (A), UAS-β-specRNAi (B), and UAS-kstRNAi (C) immunostained for α-spectrin (α-Spec) (A and C, blue/gray) or β-spectrin (β-Spec) antibodies (B, blue/gray). The adherens junction (AJ) layers were obtained by ImSAnE, using as a reference the E-cad channel and seven layers were projected (2.1 μm). (D,E) Sections of wing discs expressing en-Gal4 UAS-RFP (blue) UAS-dcr2 crossed with UAS-α-specRNAi (D) or UAS-β-specRNAi (E) stained with mouse α-Spec (green/gray) and rabbit β-Spec antibody (red/gray). Dashed yellow lines indicate the A/P compartment boundary. Scale bar = 20 μm.
Figure 6 with 1 supplement
β-Heavy spectrin (βH-Spec) co-localizes with myosin and is regulated by myosin activity.
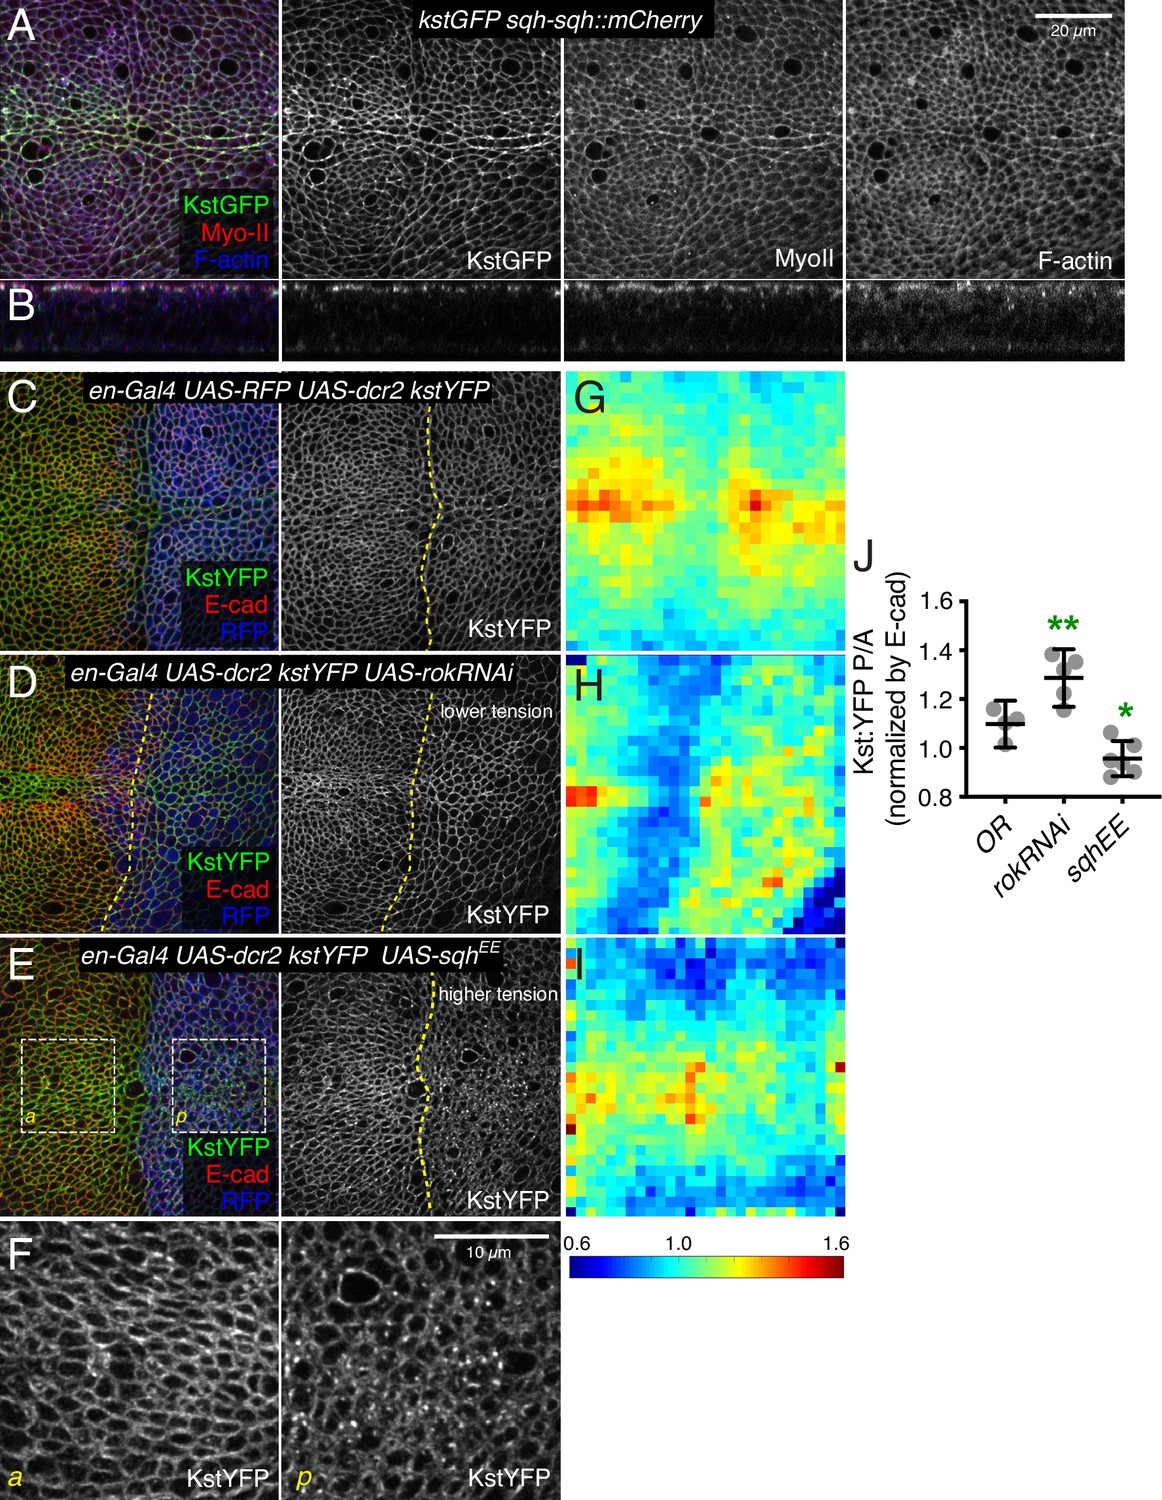
(A,B) Wing disc co-expressing Kst:GFP (green/gray) and the labeled myosin II subunit sqh:mCherry (red/gray) in apical horizontal sections (A) and lateral sections (B), co-stained with phalloidin for F-actin (blue/gray). (C–E) Apical sections of wing discs expressing en-Gal4 UAS-RFP UAS-dcr2 kst:YFP crossed to (Oregon R, OR) (C), UAS-rokRNAi (D), or UAS-sqhEE (E) in the posterior compartment (marked by RFP, blue), showing the effect of altering myosin activity on Kst:YFP. Dashed yellow lines mark the A/P compartment boundary. Scale bar = 20 μm. (F) Higher magnification of the boxed regions indicated in E. Scale bar = 10 μm. (G–I) Heat maps of junctional Kst:YFP intensity relative to E-cad in en-Gal4 UAS-RFP UAS-dcr2 kst:YFP crossed to (Oregon R, OR) (C), UAS-rokRNAi (D), or UAS-sqhEE (E) wing discs (n=5 for each genotype), as in the representative examples shown in C–E. Heat map scale is at bottom. (J) Quantification of Kst:YFP intensity normalized to E-cadherin in posterior cells (P) compared to anterior cells (A) in wing discs expressing the indicated constructs under en-Gal4 control (n=5). Data are shown as mean±95% CI, error bars indicate CI. Statistical significance was determined by a one-way analysis of variance (ANOVA) with Dunnett’s multiple comparison test relative to the control (Oregon-R): ns: not significant, *p<0.05; **p≤0.01.
Figure 6—figure supplement 1

Additional analysis of β-heavy spectrin (βH-Spec) localization and the effect of changes in tension on myosin.
(A) Lateral view of a wing imaginal disc co-expressing Kst:GFP (green) and the labeled myosin II subunit sqh:mCherry (magenta) stained with α-spectrin (α-Spec) antibody (blue). Scale bar = 10 µm. (B) Linescan along the yellow line in A showing the intensities of Kst:GFP (green), Sqh::mCherry (magenta), and α-Spec. (C) Apical sections of a wing disc expressing en-Gal4 UAS-RFP UAS-dcr2 sqh:GFP crossed to UAS-rokRNAi in the posterior compartment (marked by Dcr2 immunostaining, blue), showing the effect of decreasing myosin activity on Sqh:GFP (green/gray). (D) Apical sections of a wing disc expressing en-Gal4 UAS-dcr2 zip:GFP (myosin heavy chain subunit tagged with GFP) crossed to UAS-sqhEE in the posterior compartment (marked by RFP, blue), showing the effect of increasing myosin activity on Zip:GFP (green/gray). Discs were also stained for E-cad (red/gray). As described previously (Rauskolb et al., 2014), decreasing myosin activity decreases myosin levels near apical junctions and increasing myosin activity increases myosin levels near apical junctions. Scale bar = 20 μm.
Figure 7 with 1 supplement
β-Heavy spectrin (βH-Spec) overexpression reduces in junctional tension in wing discs.
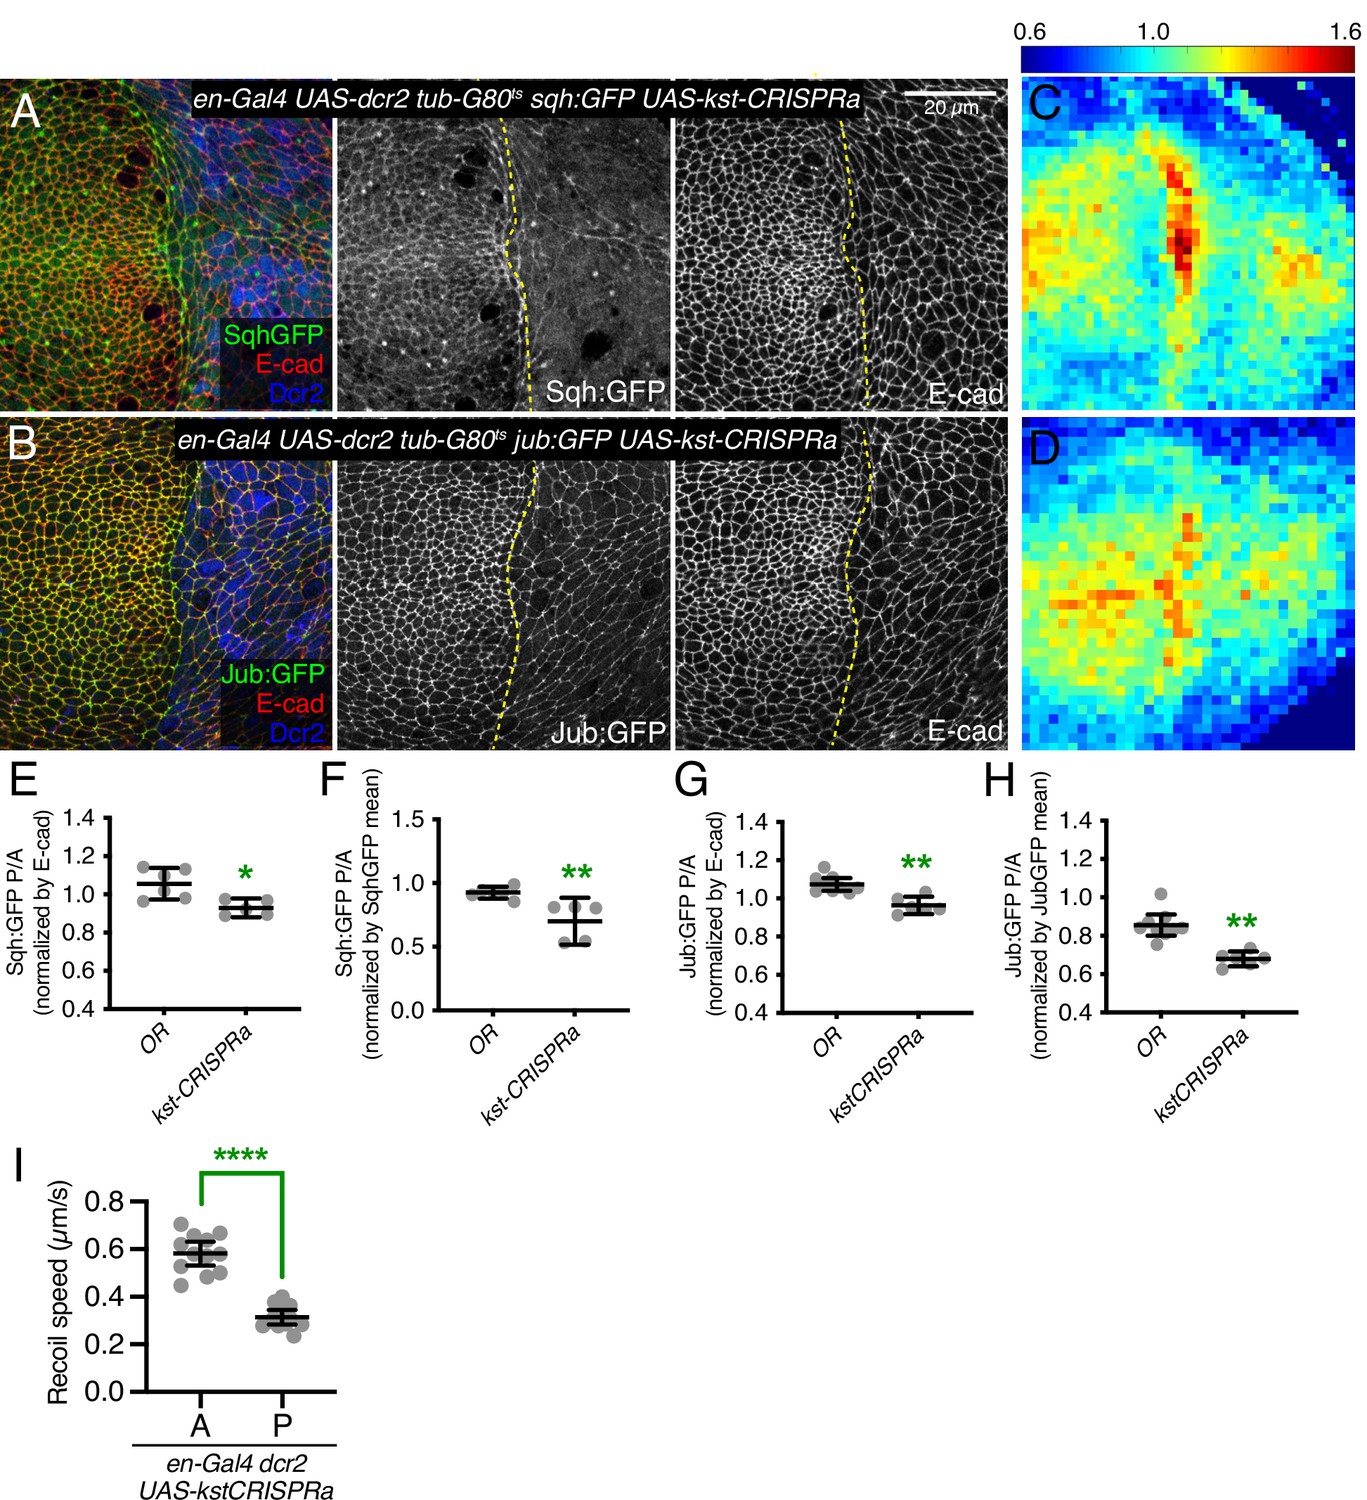
(A–B) Apical sections of wing imaginal discs expressing en-Gal4 UAS-RFP UAS-dcr2 sqh:GFP (A) or en-Gal4 UAS-RFP UAS-dcr2 jub:GFP (B) crossed to UAS-kst-CRISPRa showing the effect on Sqh:GFP or Jub:GFP levels and localization in the posterior compartment (marked by RFP, blue). Yellow dashed line indicates the A/P compartment boundary. Scale bar = 20 μm; all images are at the same magnification. (C–D) Heat maps of relative junctional Sqh:GFP (C) or Jub:GFP (D) intensity of wing discs. Levels of Sqh:GFP relative to E-cad levels are shown for the different genotypes analyzed in A–B. Heat map scale is indicated on the top. Number of wing discs used for analysis: UAS-kst-CRISPRa with Sqh:GFP, n=5; UAS-kst-CRISPRa with Jub:GFP, n=6. (E–F) Quantification of Sqh:GFP overlapping E-cad in posterior cells (P) compared to anterior cells (A) in wing disc expressing the indicated constructs, displayed as individual values, normalized by E-cad (E) or normalized by the mean intensity of Sqh:GFP (F). (G–H) Quantification of Jub:GFP overlapping E-cad in posterior cells (P) compared to anterior cells (A) in wing disc expressing the indicated constructs, displayed as individual values, normalized by E-cad (G) or normalized by the mean intensity of Jub:GFP (H). (I) Average recoil velocities after laser cutting of cell junctions in anterior (A) or posterior (P) compartments of wing discs expressing UAS-kstCRISPRa in posterior cells (n=20). Data are shown as mean±95% CI. Statistical significance for (E-I) was determined by Student’s t-test, *p<0.05; **p≤0.01; ***p≤0.001; ****p≤0.0001.
Figure 7—figure supplement 1
Additional analysis of βH-Spec overexpression.
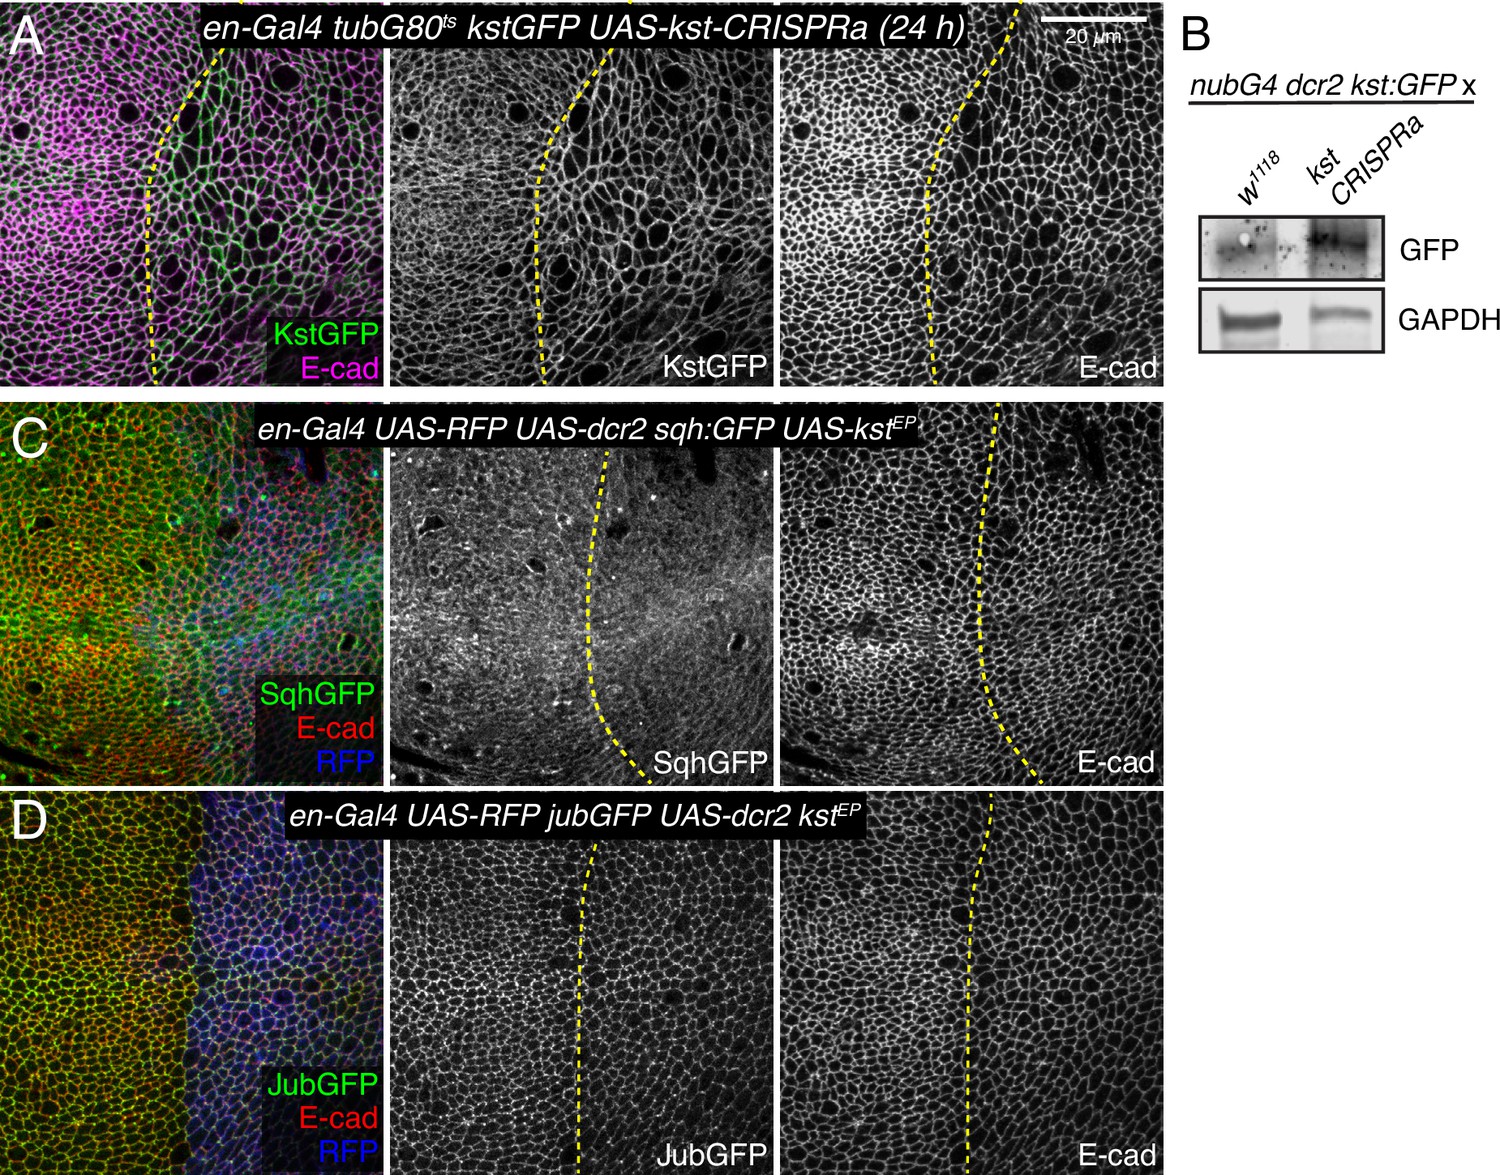
(A) Apical sections of a wing imaginal disc expressing en-Gal4 tubG80ts kst:GFP crossed with UAS-kstCRISPRa, stained for E-cad (magenta). Expression of Kst:GFP (green) was induced by transferring the flies from 18°C to 29°C for 24 hr. (B) Western blots of wing disc lysates with the genotypes shown in the figure: nub-Gal4 UAS-Dcr2 kst:GFP crossed with w1118 (control) and UAS-kstCRISPRa (experimental). Kst:GFP was detected using a GFP antibody. GAPDH was used as a loading control. (C) Third instar wing imaginal discs expressing enGal4 UAS-dcr2 UAS-RFP sqh:GFP in combination with UAS-kstP[EPgy2]EY01010. (D) Third instar wing imaginal discs expressing enGal4 UAS-dcr2 UAS-RFP jub:GFP in combination with UAS-kstP[EPgy2] EY01010.
Figure 8 with 1 supplement
β-Heavy spectrin (βH-Spec) and myosin have overlapping binding sites on F-actin.
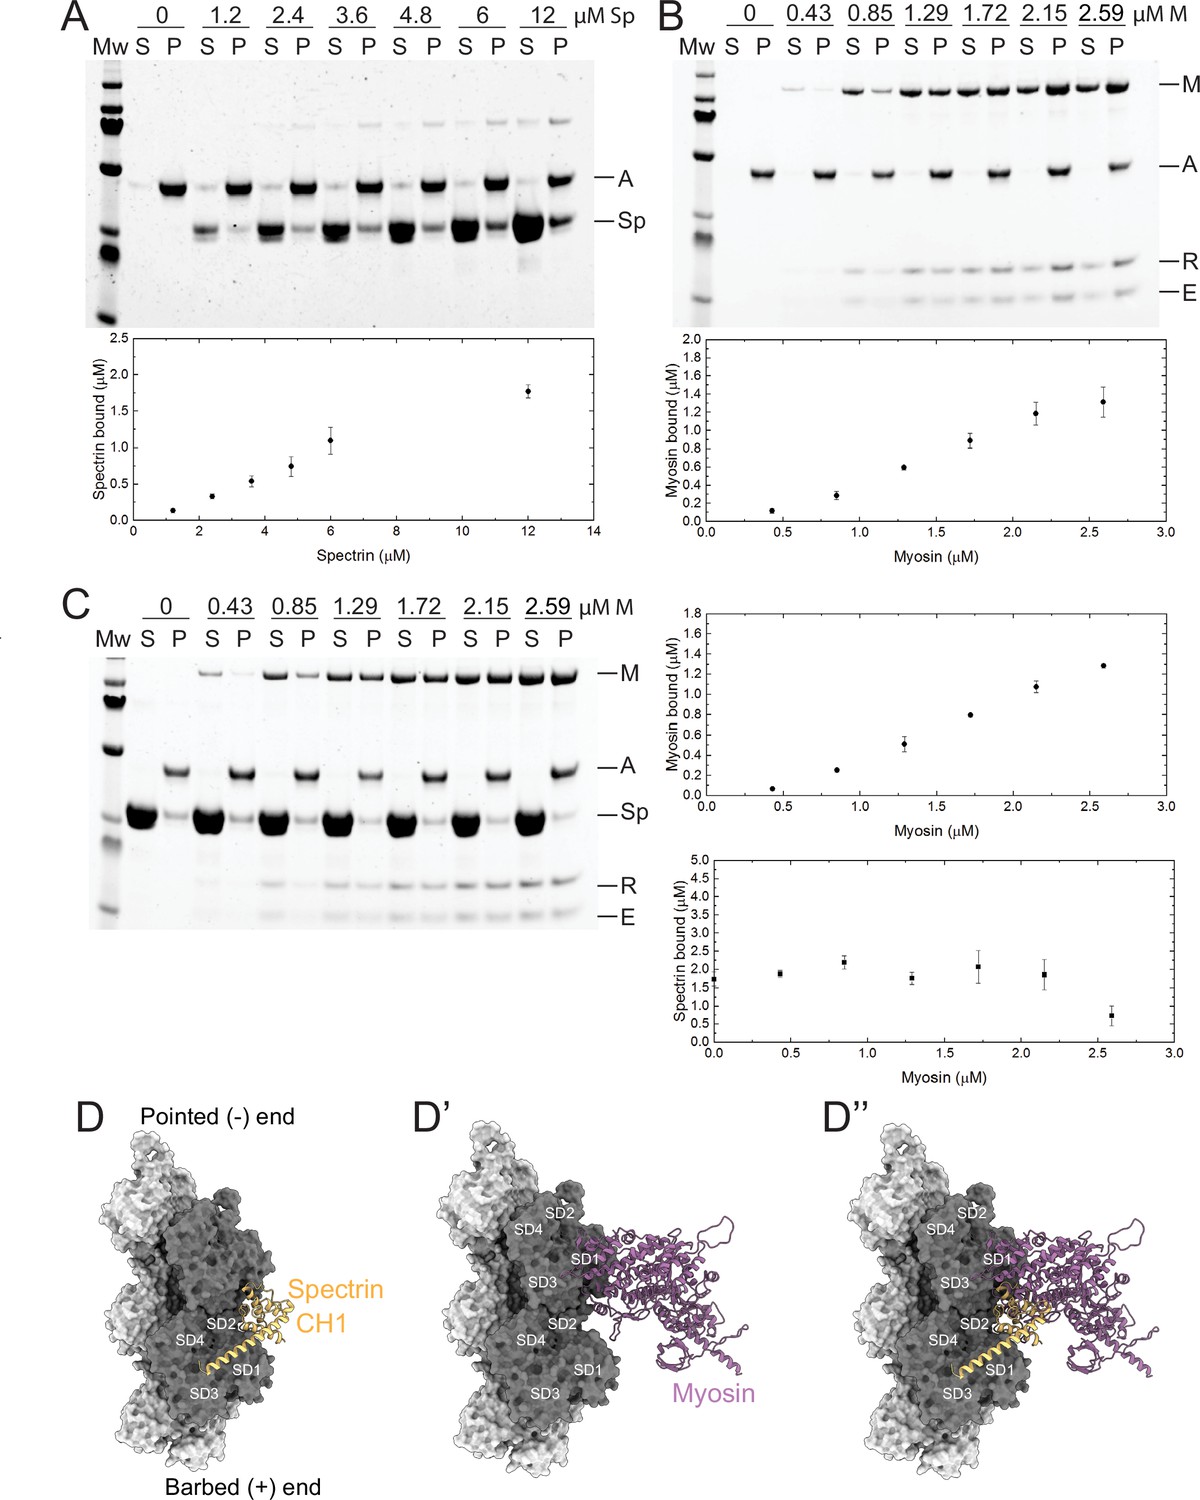
(A–C) Co-sedimentation assays with βH-Spec CH domains (spectrin), F-actin, and myosin II subfragment-1-like protein (myosin). For all sedimentation assays, A, M, Sp, E, and R refer to F-actin, myosin heavy chain, spectrin, myosin essential light chain, and myosin regulatory light chain, respectively. Mw indicates marker and S and P refer to supernatant and pellet, respectively. Quantification shows mean ± SD of the sedimentation behavior of spectrin and myosin with F-actin (n=3). (A) Co-sedimentation assay between spectrin (0–12 μM) and F-actin (2 μM). (B) Co-sedimentation assay between myosin (0–2.59 μM) and F-actin (2 μM). (C) Co-sedimentation assay between spectrin (12 μM), myosin (0–2.59 μM), and F-actin (2 μM). Quantification shows that myosin reduces spectrin binding by ~50% (bottom panel). (D–D’’) Model of the Drosophila CH1 domain (yellow) bound to F-actin (gray). (D) Model of the Drosophila myosin motor domain (purple) bound to F-actin (gray). (D’) Superimposition of the CH1 and myosin motor domain on F-actin. The two strands of the actin filament are shown in light and dark gray and subdomains are indicated.
Figure 8—figure supplement 1

Additional examination of competition between β-heavy spectrin (βH-Spec) and myosin for F-actin.
(A) Quantification of the binding behavior of myosin to F-actin in the presence and absence of spectrin in co-sedimentation assays. The similarity in actin binding indicates that pre-loading spectrin does not interfere with myosin binding to F-actin under these assay conditions. (B) Model of the Drosophila CH1-CH2 domain (CH1, yellow; CH2, blue) bound to F-actin (gray). (B’) Model of the Drosophila myosin motor domain (purple) bound to F-actin (gray). (B’’) Superimposition of the CH1-CH2 and myosin motor domain on F-actin. The two strands of the actin filament are shown in light and dark gray and subdomains are indicated.
Additional files
Download links
A two-part list of links to download the article, or parts of the article, in various formats.
Downloads (link to download the article as PDF)
Open citations (links to open the citations from this article in various online reference manager services)
Cite this article (links to download the citations from this article in formats compatible with various reference manager tools)
Competition between myosin II and βH-spectrin regulates cytoskeletal tension
eLife 12:RP84918.
https://doi.org/10.7554/eLife.84918.3


