Functional and pharmacological analyses of visual habituation learning in larval zebrafish
- Laboratoire MeLiS, UCBL - CNRS UMR5284 - Inserm U1314, Institut NeuroMyoGène, Faculté de Médecine et de Pharmacie, France
- The Ohio State University, Department of Neuroscience, United States
- Department of Molecular and Cellular Biology, Faculty of Arts and Sciences, Harvard University, United States
- Center for Brain Science, Faculty of Arts and Sciences, Harvard University, United States
- Department of Cell and Developmental Biology, University of Pennsylvania, Perelman School of Medicine, United States
Figures
Figure 1 with 1 supplement
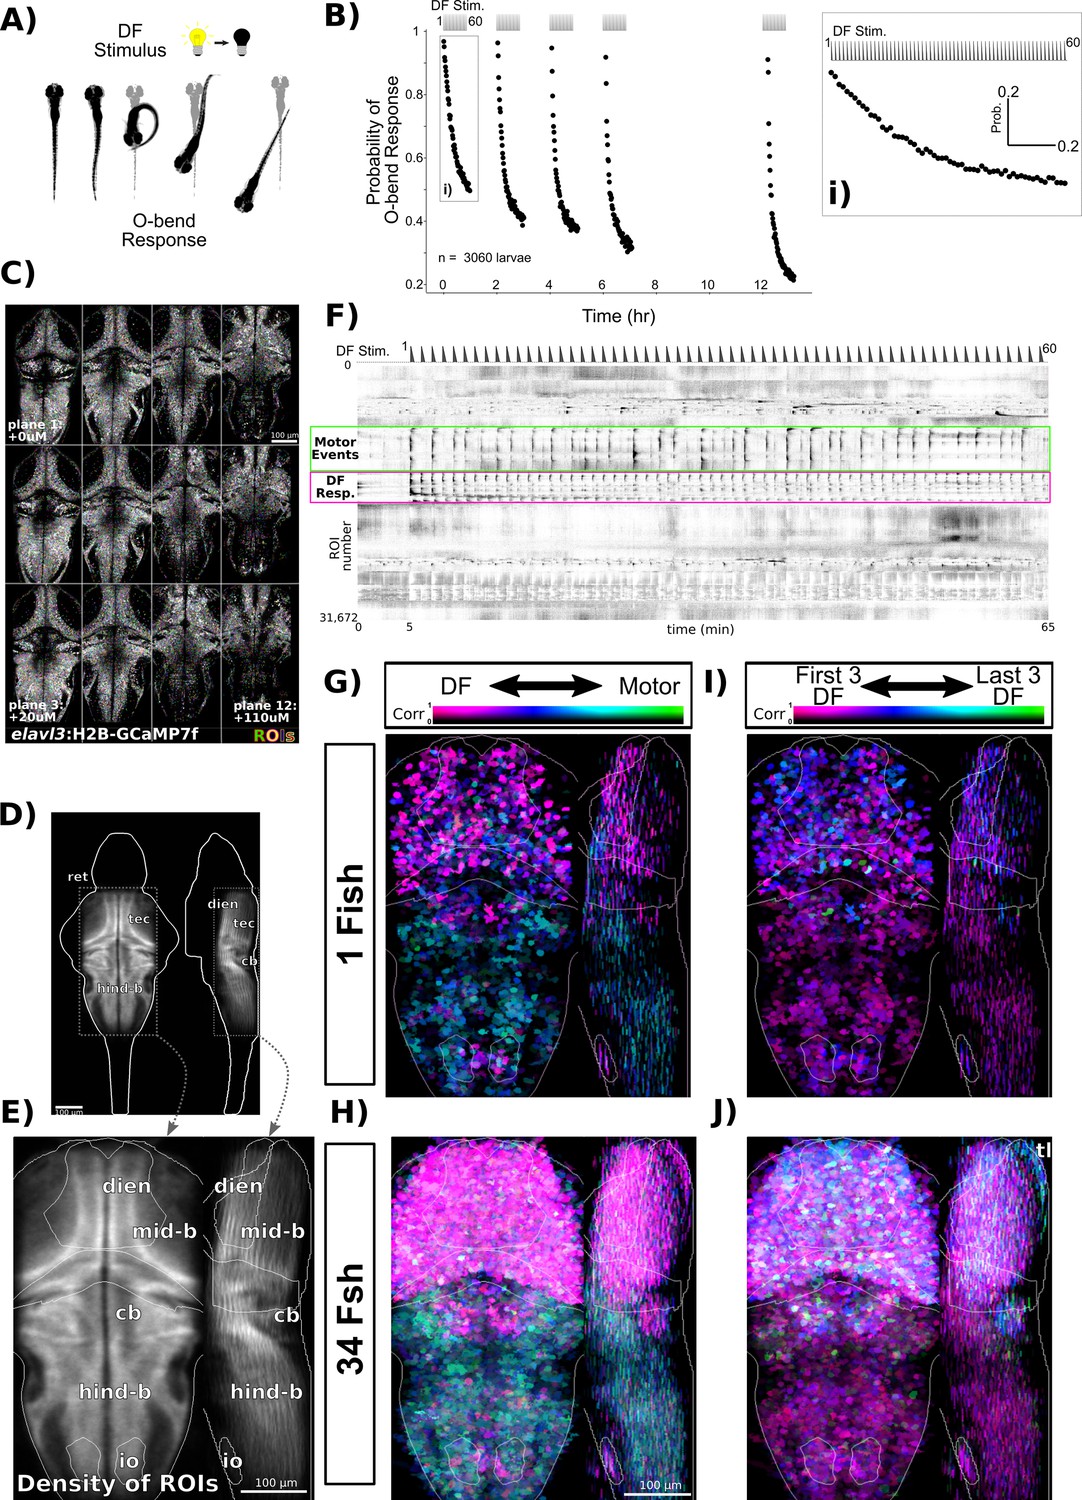
Volumetric two-photon Ca2+ imaging of dark flash (DF) habituation.
(A) In response to a DF, larval zebrafish execute a high-amplitude turn called an O-bend response. (B) Habituation results in a progressive decrease in response probability to DFs repeated at 1 min intervals, delivered in four blocks of 60 stimuli, separated by 1 hr of rest (from 0:00 to 7:00), and after a 5 hr retention period (12:00-). Inset (i) shows an expanded view of the first training block. (C) Tg(elavl3:H2B-GCaMP7f) larvae were imaged across 12 z-planes at 10 µm steps. Regions of Interest (ROIs) are overlaid in random colours. (D) Density of detected ROIs registered and plotted in the Z-Brain coordinate space. n = 1,050,273 ROIs across 34 larvae. (E) Cropped field of view used for plotting and analysing Ca2+ imaging data and approximate anatomical localizations of major brain areas: dien, diencephalon; mid-b, midbrain; cb, cerebellum; hind-b, hindbrain; io, inferior olive; ret, retina; tec, tectum. (F) Functional responses of neurons to 60 DFs at 1 min intervals, plotted as a clustered heatmap (‘rastermap’; Pachitariu et al., 2017, https://github.com/MouseLand/rastermap, copy archived at MouseLand, 2023) where rows represent individual neurons ordered by the similarities in their activity. Darker shades reflect increased activity. This clustering reveals neurons that are tuned to the DF stimuli (pink box) or motor events (green box). Dashed trace above the heatmap depicts the DF stimulus convolved with a kernel approximating H2B-GCaMP7f kinetics. (G) ROIs in an individual fish plotted based on their correlation and tuning to regressors defining either motor or DF stimulus events, highlighting the spatial distributions of these tunings across the imaged population. Plotted as a maximum intensity projection. (H) Same analysis as (G), but across the entire population of 34 larvae. (I) ROIs in an individual fish plotted based on their correlation and tuning to regressors defining either the first or last three DF stimuli. (J) Same analysis as (I), but across the entire population of 34 larvae. tl, torus longitudinalis.
Figure 1—figure supplement 1
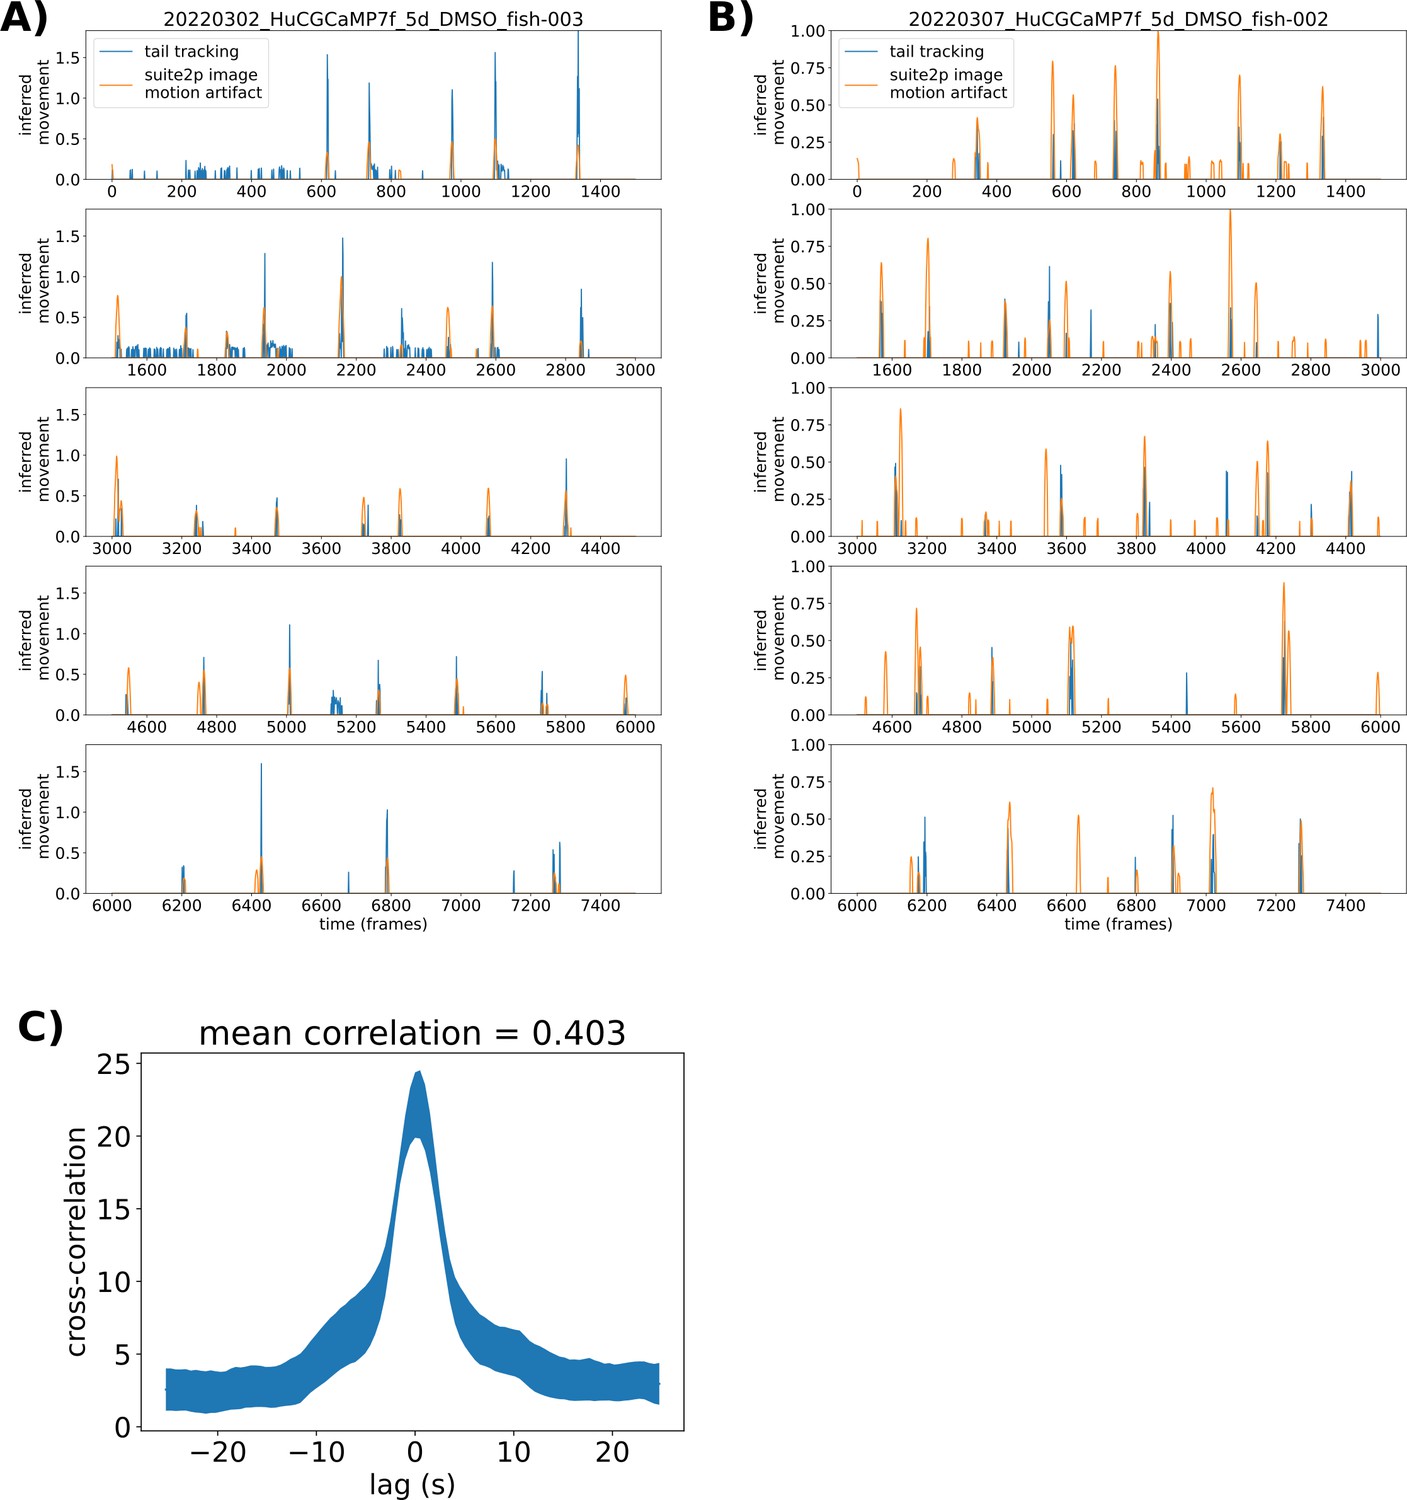
Validation of motion analysis based on image artefacts during two-photon imaging.
(A) Motion indexes as calculated based on tail tracking (blue) and based on decreases in the correlation between individual frames and the reference frame used for motion alignment (orange) across the entire imaging experiment (65 min). (B) Same analysis as (A), for a different larva. (C) Cross-correlation plot comparing the two motion index vectors. Mean across six larvae, and line thickness = standard error.
Figure 2
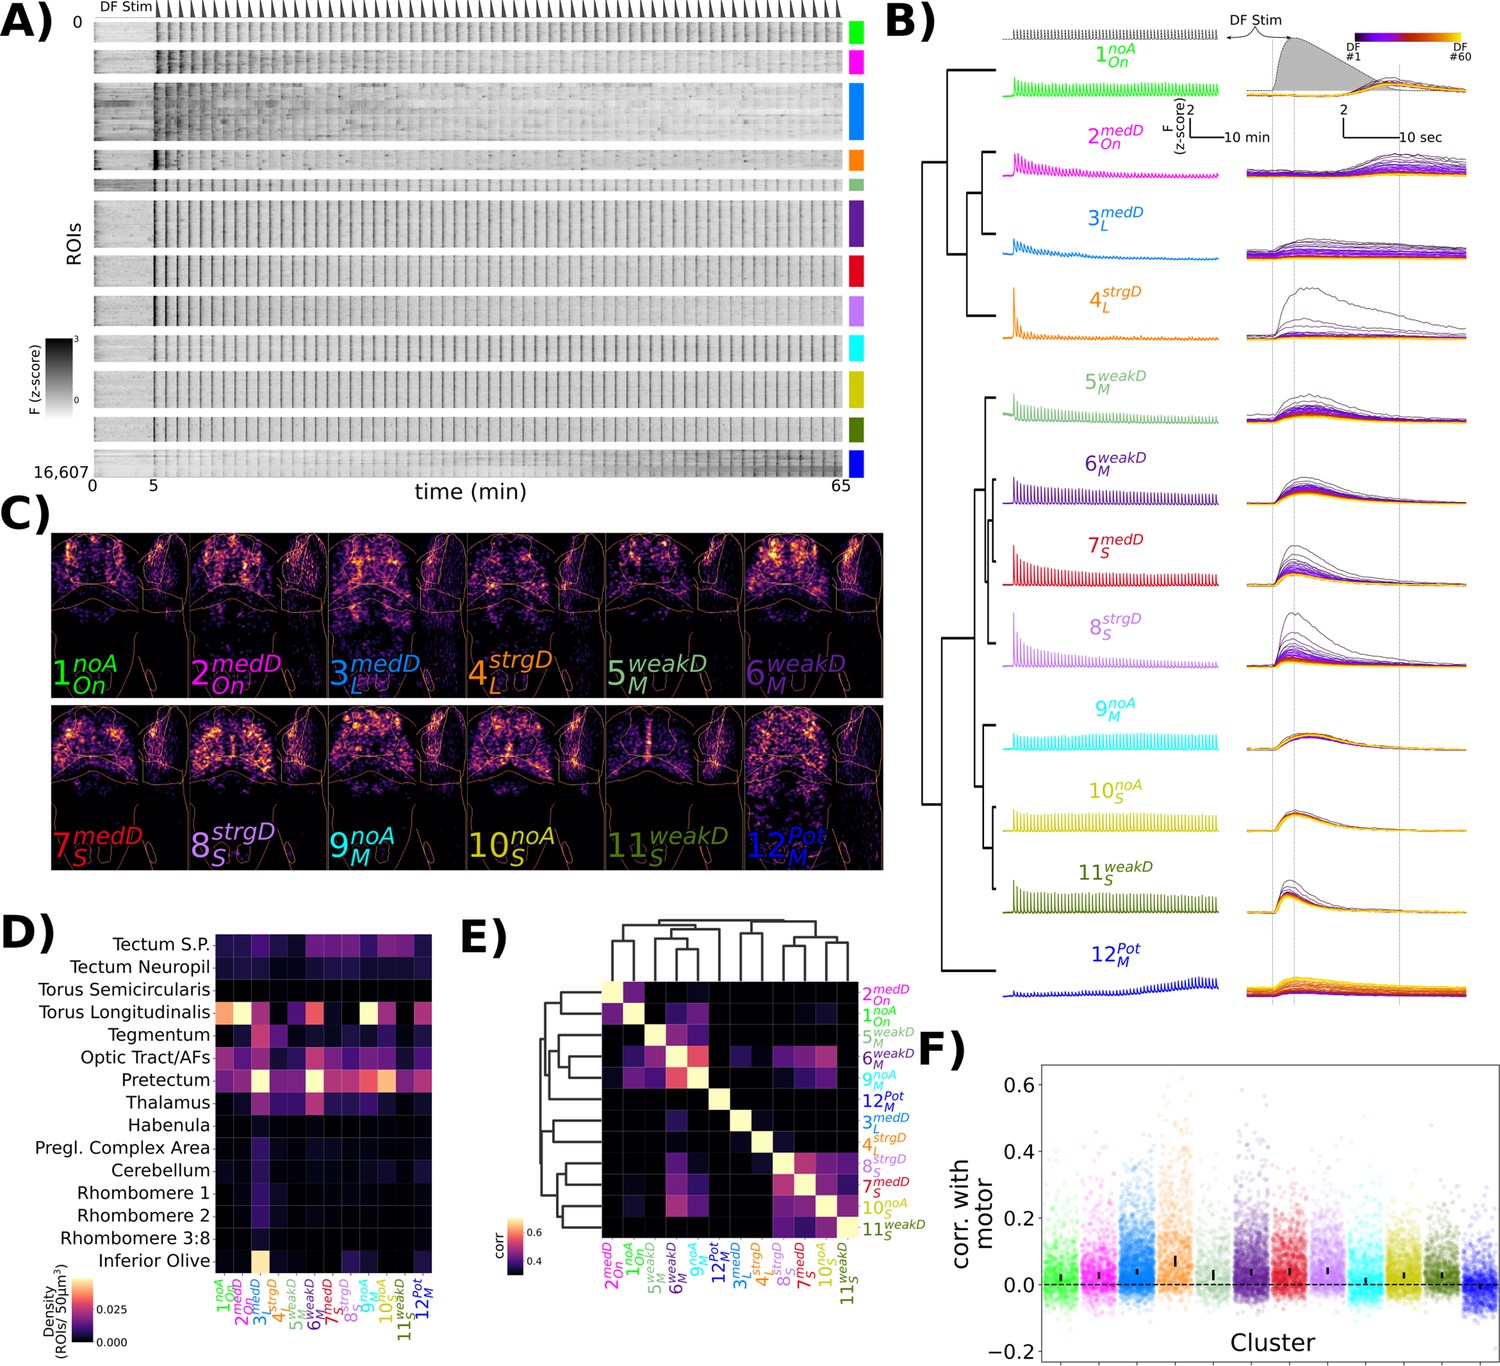
Characterization of functional response types during habituation learning.
(A) Heatmap of the response profiles of ROIs categorized into 12 functional clusters. n = 16,607 ROIs from 34 larvae. (B) Average z-scored fluorescence of each functional cluster plotted for the whole experiment (left column) and centred on each dark flash (DF) stimulus (right column), demonstrating the differences in both Adaptation Profiles and Response Shape for each cluster. Clusters were identified using Affinity Propagation clustering (affinity = Pearson correlation, damping = 0.9, preference = -9), and organized using hierarchical clustering, distance = complete, correlation. Dashed lines in the top panels are the DF stimulus convolved with a kernel approximating H2B-GCaMP7f kinetics, used as the regressor in the analysis. (C) Summed intensity projection of the ROIs belonging to each functional cluster in Z-Brain coordinate space depicting their physical locations in the brain. Projection images are normalized to the maximum value. (D) Heatmap depicting the density of each cluster that is found within different Z-Brain regions. (E) Correlogram calculated from the Pearson correlation in downsampled volumes for the ROI centroid positions for each cluster (see ‘Methods’). Hierarchical clustering, distance = complete, correlation. (F) Correlation between motor events and the Ca2+ traces for each ROI assigned to the functional clusters. dots = individual ROIs, bar height = 99.99999% confidence interval around the median value.
Figure 3
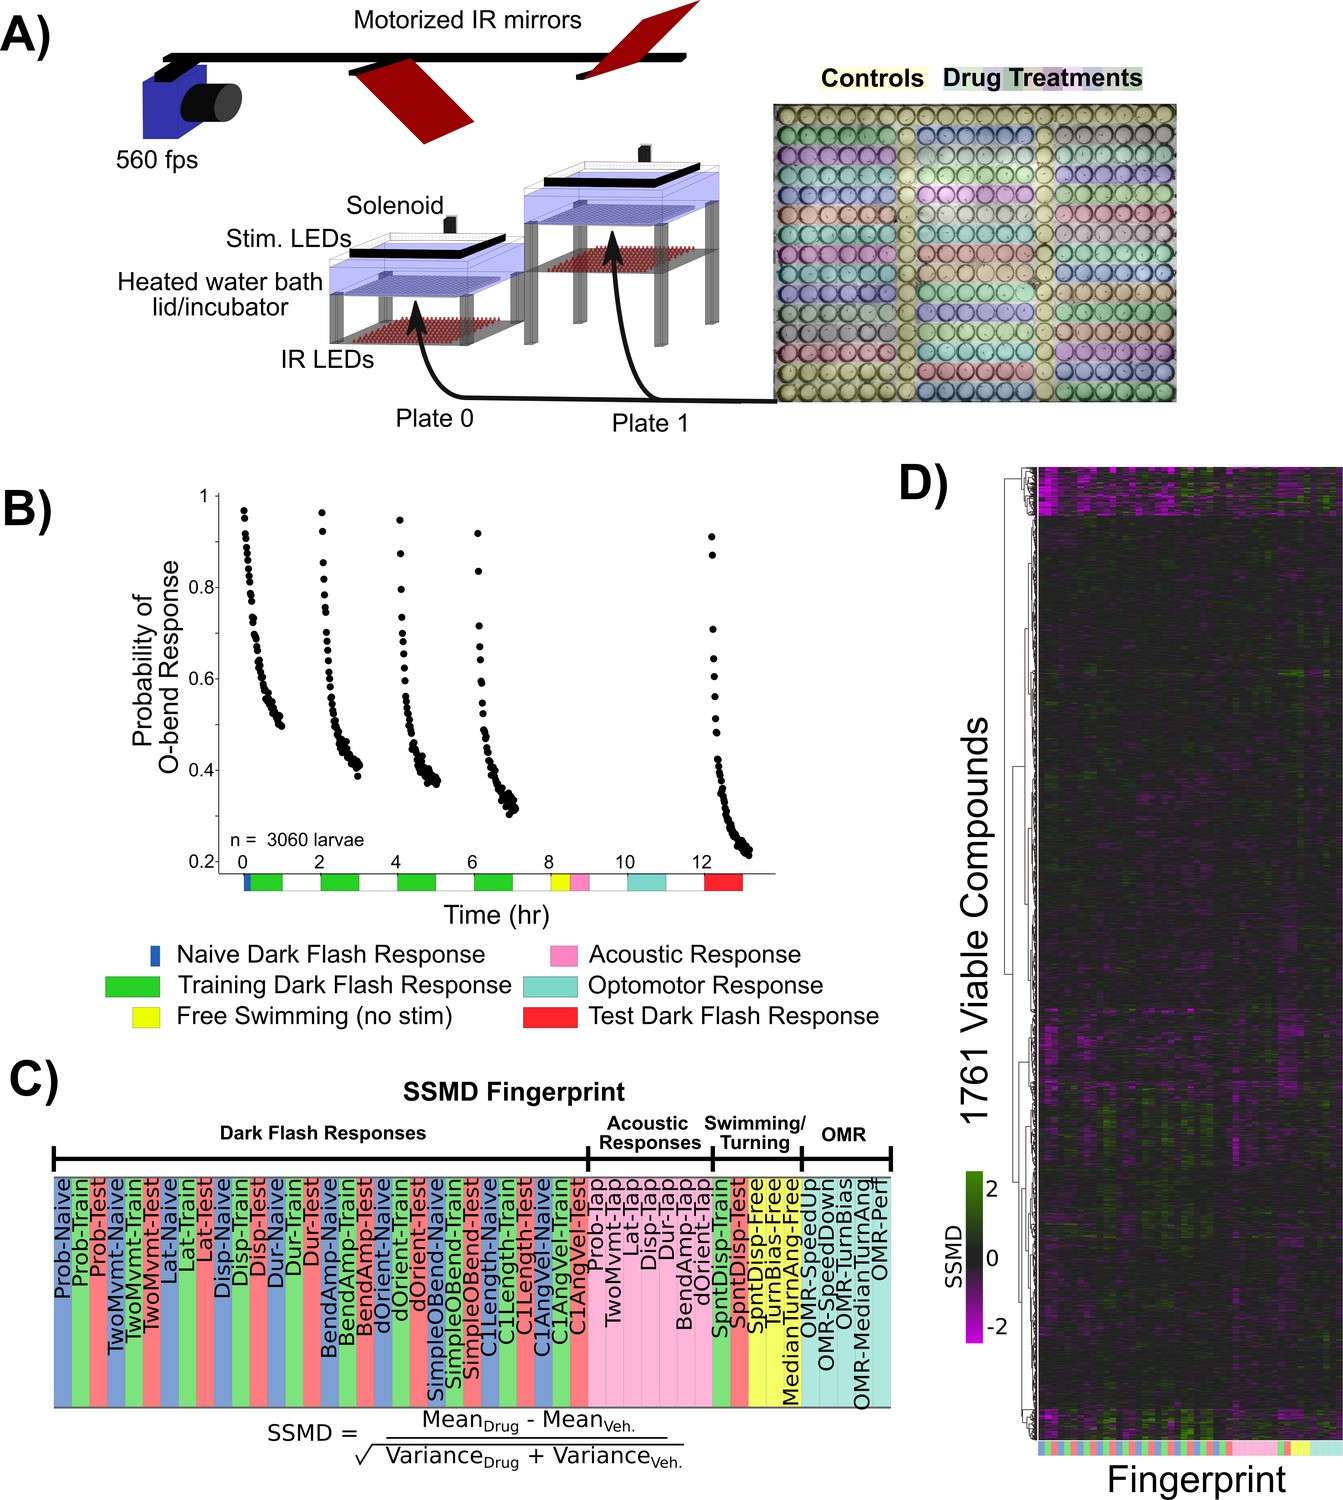
Pharmacological screening for dark flash habituation modulators.
(A) Screening setup to record larval zebrafish behaviour in 300-well plates, which are placed below a 31°C water bath that acts as a heated lid for the behaviour plates. Two 300-well plates are imaged in alternation using mirrors mounted on stepper motors. Fish are illuminated with infrared LEDs and imaged with a high-speed camera recording at 560 frames per second (fps). Visual stimuli are delivered by a rectangular ring of RGB LEDs, and acoustic stimuli are delivered via a solenoid mounted on the back of the water tank. Colours overlaid on the 300-well plate indicate the arrangement of small-molecule treatments and controls (yellow). (B) Habituation results in a progressive decrease in responsiveness to dark flashes repeated at 1 mi intervals, delivered in four training blocks of 60 stimuli, separated by 1 hr of rest (from 0:00 to 7:00). This epoch is separated into periods reflective of the naive response (first five stimuli, blue), and the remaining 235 stimuli during training (green). From 8:00 to 8:30, no stimuli are delivered and fish are monitored for spontaneous behaviour (yellow). From 8:30 to 9:00, fish are given acoustic stimuli via the solenoid tapping on the water bath (pink). From 10:00 to 11:00, fish are stimulated with alternating leftward and rightward motion using the RGB LEDs to induce the optomotor response and turning towards the direction of motion (light blue). Finally, at 12:00–13:00, larvae are given 60 additional dark flashes during the test period (red). Same data as Figure 1B. (C) The strictly standardized mean difference (SSMD) is calculated across these different time periods, behaviours, and the different components of O-Bend behavioural habituation (Randlett et al., 2019). All compounds were dosed at 10 µM in 0.1% DMSO (n = 6 larvae), relative to 0.1% DMSO vehicle controls (n = 60 larvae). (D) These vectors are assembled across all screened compounds that were viable and did not cause death or paralysis of the larvae. Displayed as a hierarchically clustered heatmap of behavioural fingerprints (vectors of SSMD values). Clustering distance = ward, standardized Euclidean.
-
Figure 3—source data 1
Small-molecule library, Selleckchem Bioactive: FDA-approved/FDA-like small molecules.
- https://cdn.elifesciences.org/articles/84926/elife-84926-fig3-data1-v1.csv
-
Figure 3—source data 2
Behavioural fingerprint parameter descriptions.
- https://cdn.elifesciences.org/articles/84926/elife-84926-fig3-data2-v1.xlsx
-
Figure 3—source data 3
Behavioural fingerprints for viable compounds.
- https://cdn.elifesciences.org/articles/84926/elife-84926-fig3-data3-v1.xlsx
Figure 4
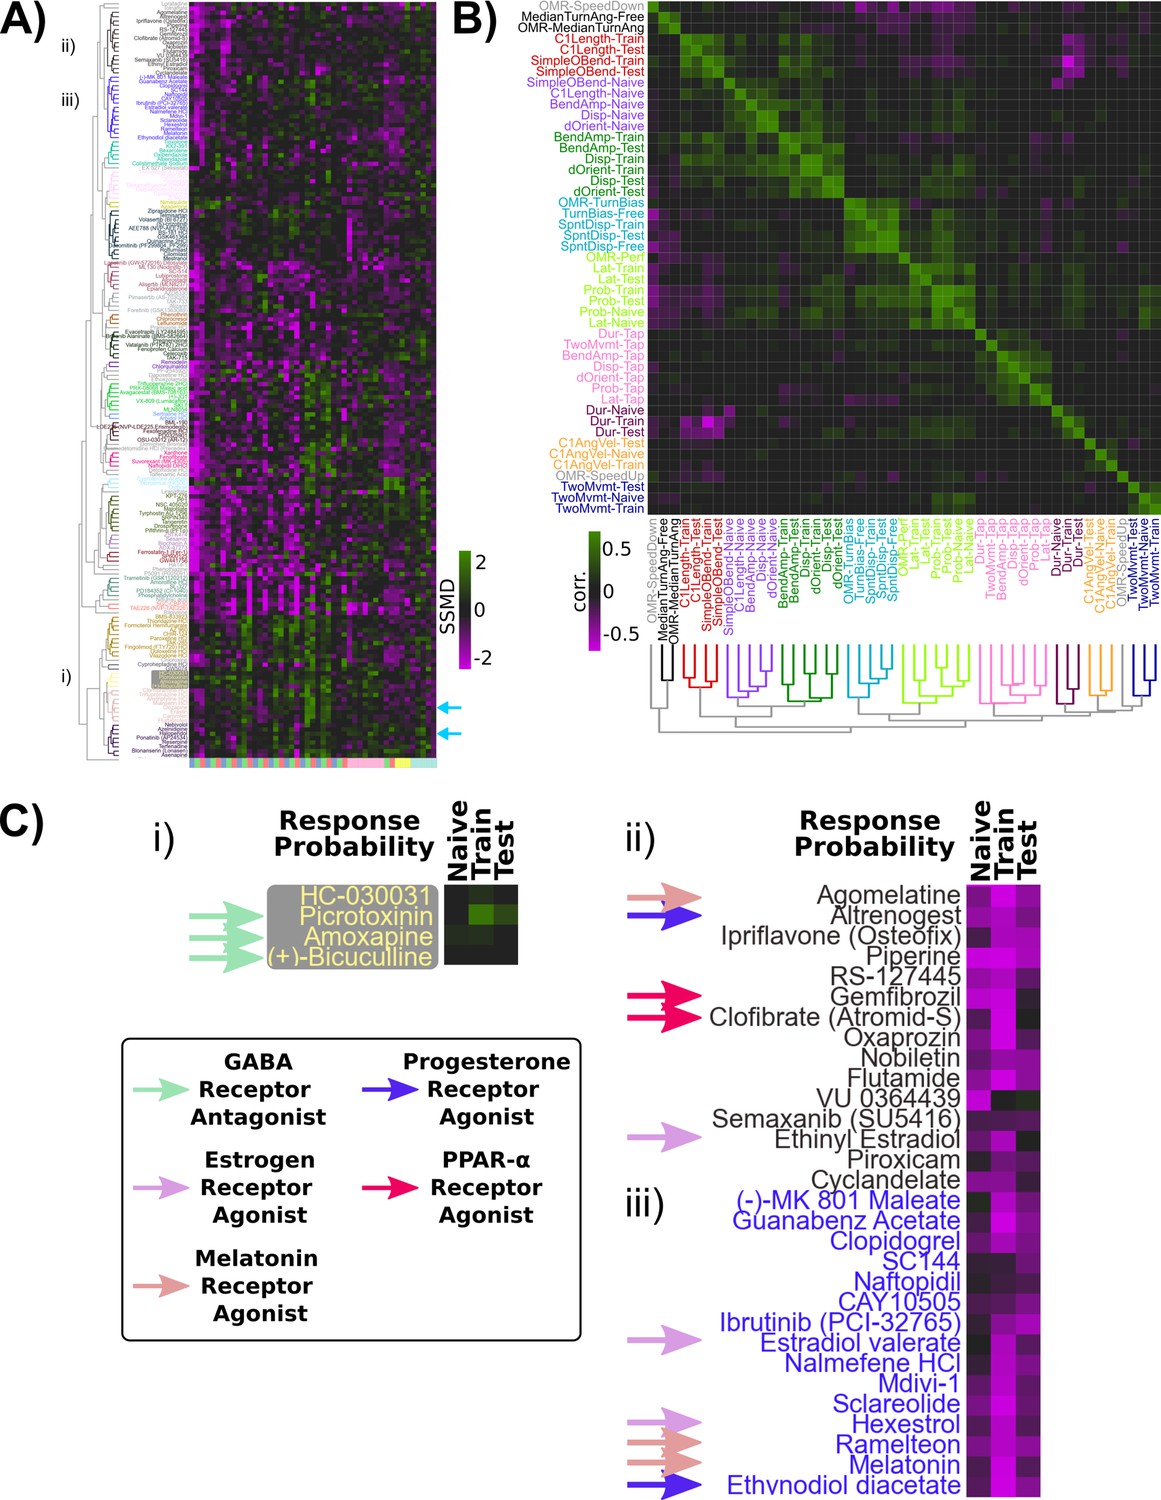
Pharmaco-behavioural analyses of behaviour-modifying compounds.
(A) Clustered heatmap of the behavioural fingerprints for the 176 hits of the screen, showing at least one behaviour measure with . Clustering distance = ward, standardized Euclidean, colour/cluster threshold = 9.5. This led to the re-identification of haloperidol and clozapine as habituation modifiers (light blue arrows). (B) Clustered correlogram of the Pearson correlation coefficients for the different measured components of behaviour across hits (same data as A) revealing the independence or co-modulation of behaviours. Clustering distance = average, correlation, colour/cluster threshold = 1.5. (C) Subsets of clustered heatmap from (A), highlighting the similar phenotypes exhibited by (i) GABA receptor antagonists and (ii, iii) melatonin receptor agonists, oestrogen receptor agonists, progesterone receptor agonists, and peroxisome proliferator-activated receptor alpha (PPARα) agonists. Heatmap is cropped to the first three columns of (A), depicting the strictly standardized mean difference (SSMD) of response probability relative to vehicle controls.
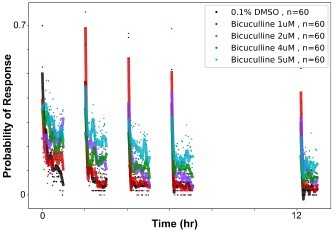
Figure 5 with 1 supplement
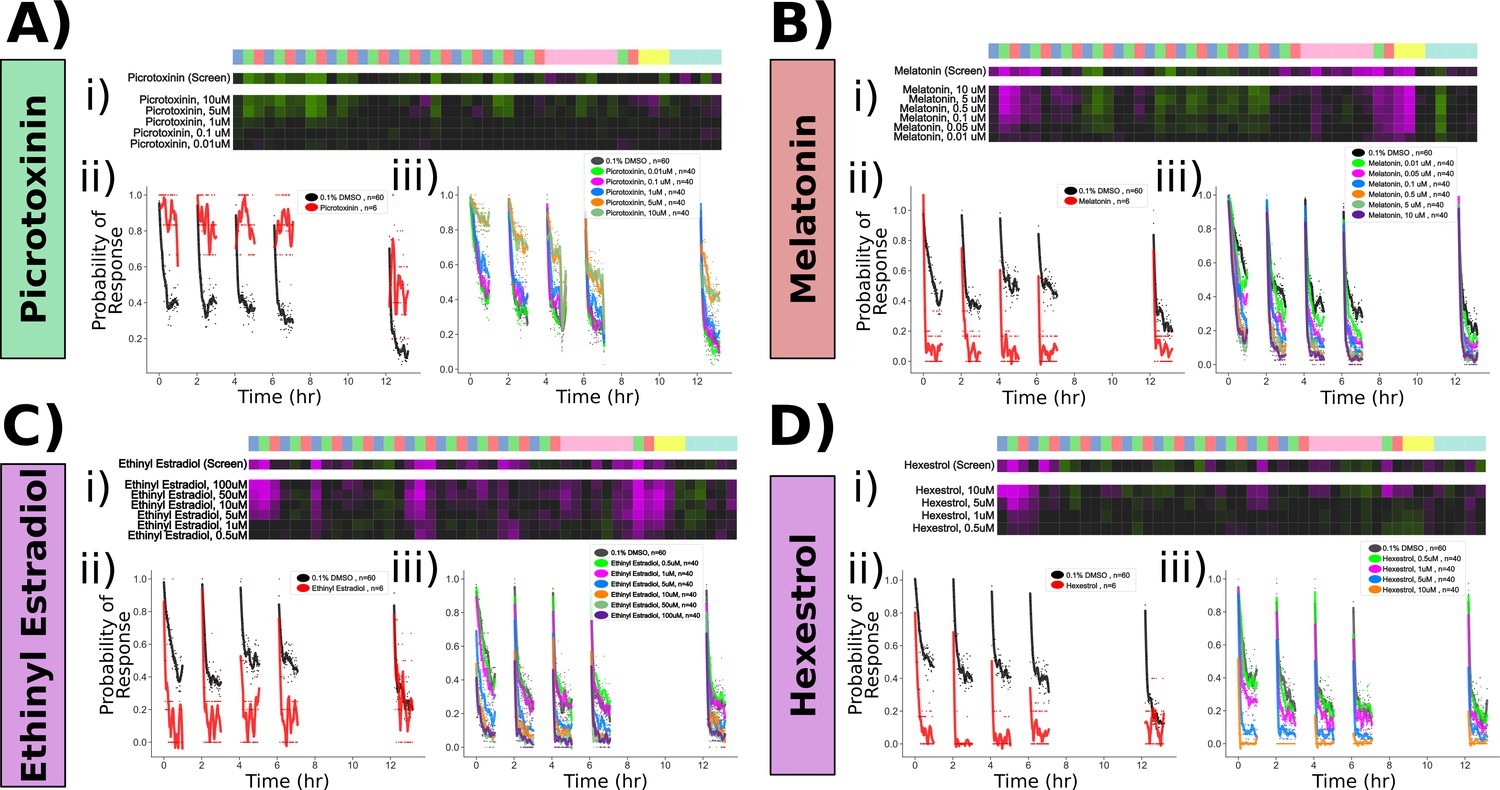
Confirmed pharmacological modulators of habituation.
Dose–response studies for (A) picrotoxinin, (B) melatonin, (C) ethinyl estradiol, and (D) hexestrol. Displayed for each treatment are (i) behavioural fingerprint for the original screen data (10 uM) and the dose–response data. (ii) Original screen data for the probability of response to dark flash (DF) stimuli. Each dot is the probability of response to one flash. Lines are smoothed in time with a Savitzky–Golay filter (window = 15 stimuli, order = 2). (iii) Dose–response data for the probability of response, plotted as in (ii).
Figure 5—figure supplement 1
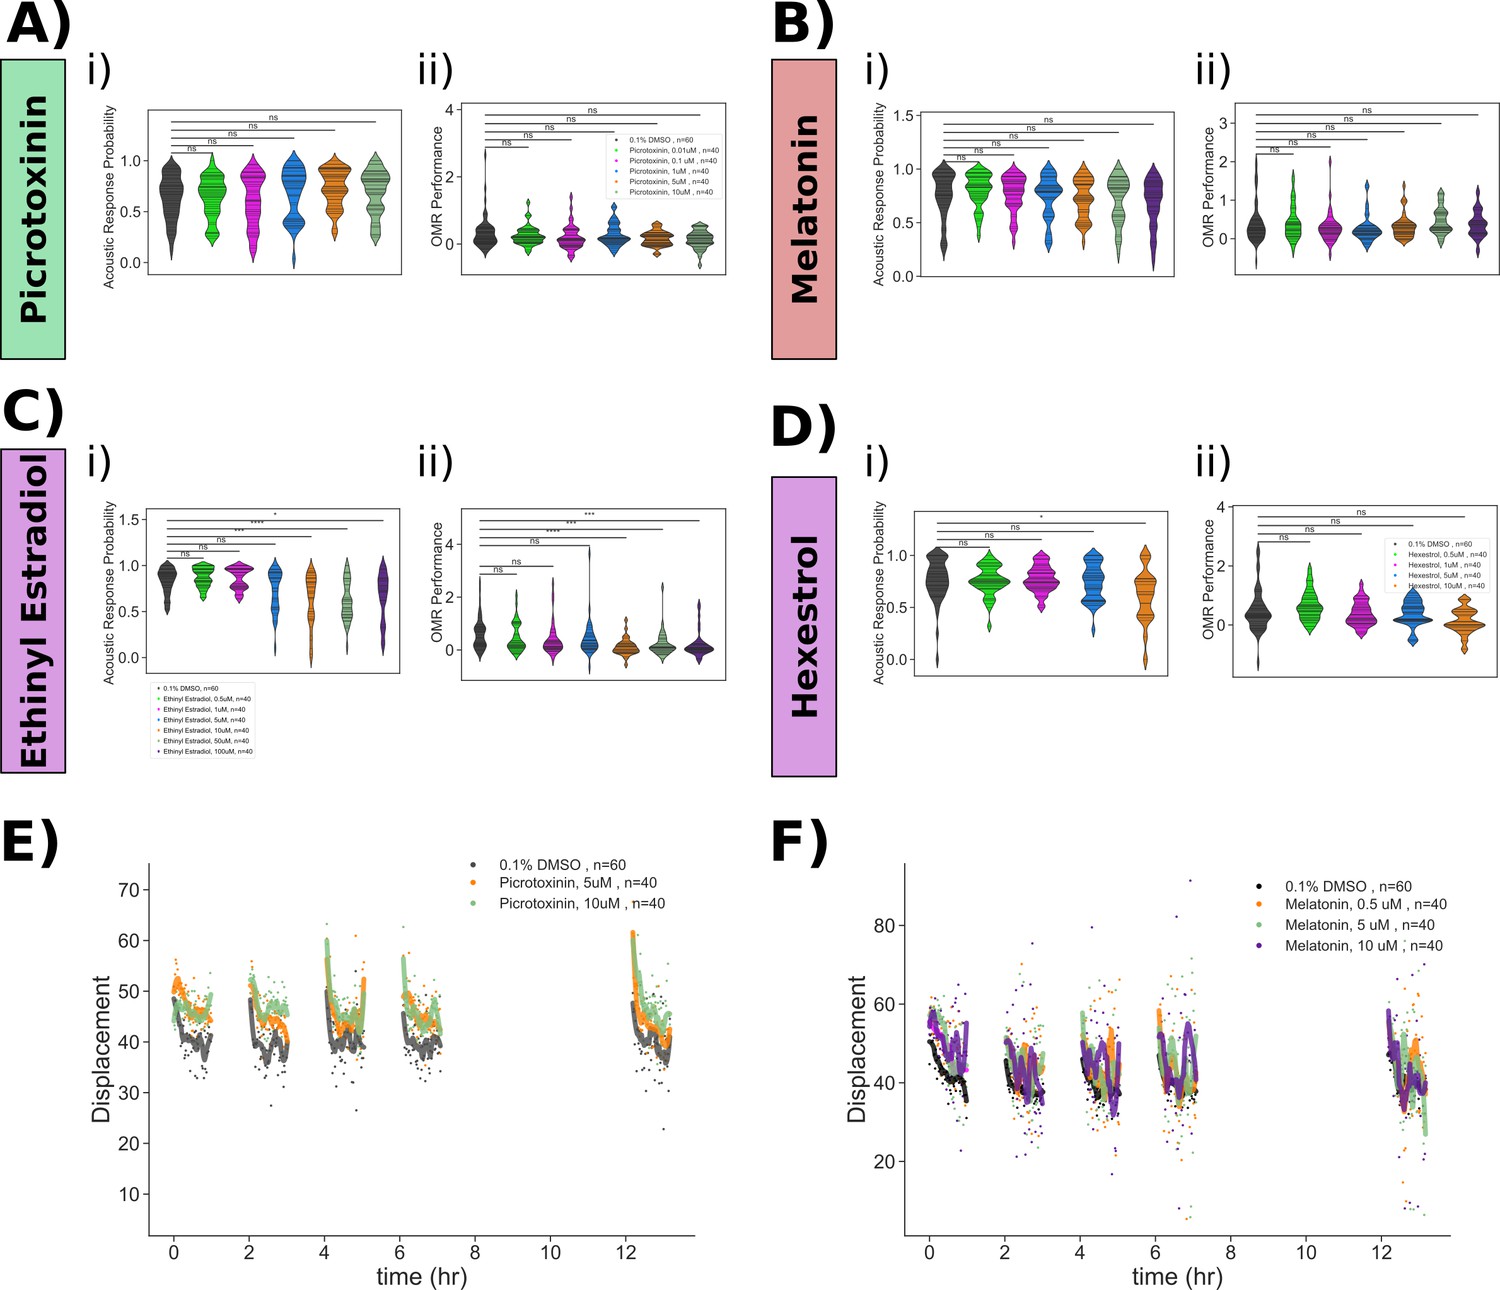
Pharmacological manipulation of control behaviours and response displacement during habituation.
Dose–response studies for (A) picrotoxinin, (B) melatonin, (C) ethinyl estradiol, and (D) hexestrol. Displayed for each treatment are (i) violin plots for the dose–response data, showing the probability of response to 30 acoustic tap stimuli. Horizontal lines = individual fish. (ii) Violin plots for the dose–response data OMR performance. Horizontal lines = individual fish. Statistical tests: Mann–Whitney with Bonferroni correction, ns, not significant; . (E) Treatment with picrotoxinin inhibits the decreases in movement displacement during habituation training. (F) Treatment with melatonin inhibits the decreases in movement displacement during habituation training. Each dot is the mean response of the population to one flash. Lines are smoothed in time with a Savitzky–Golay filter (window = 15 stimuli, order = 2).
Figure 6 with 1 supplement
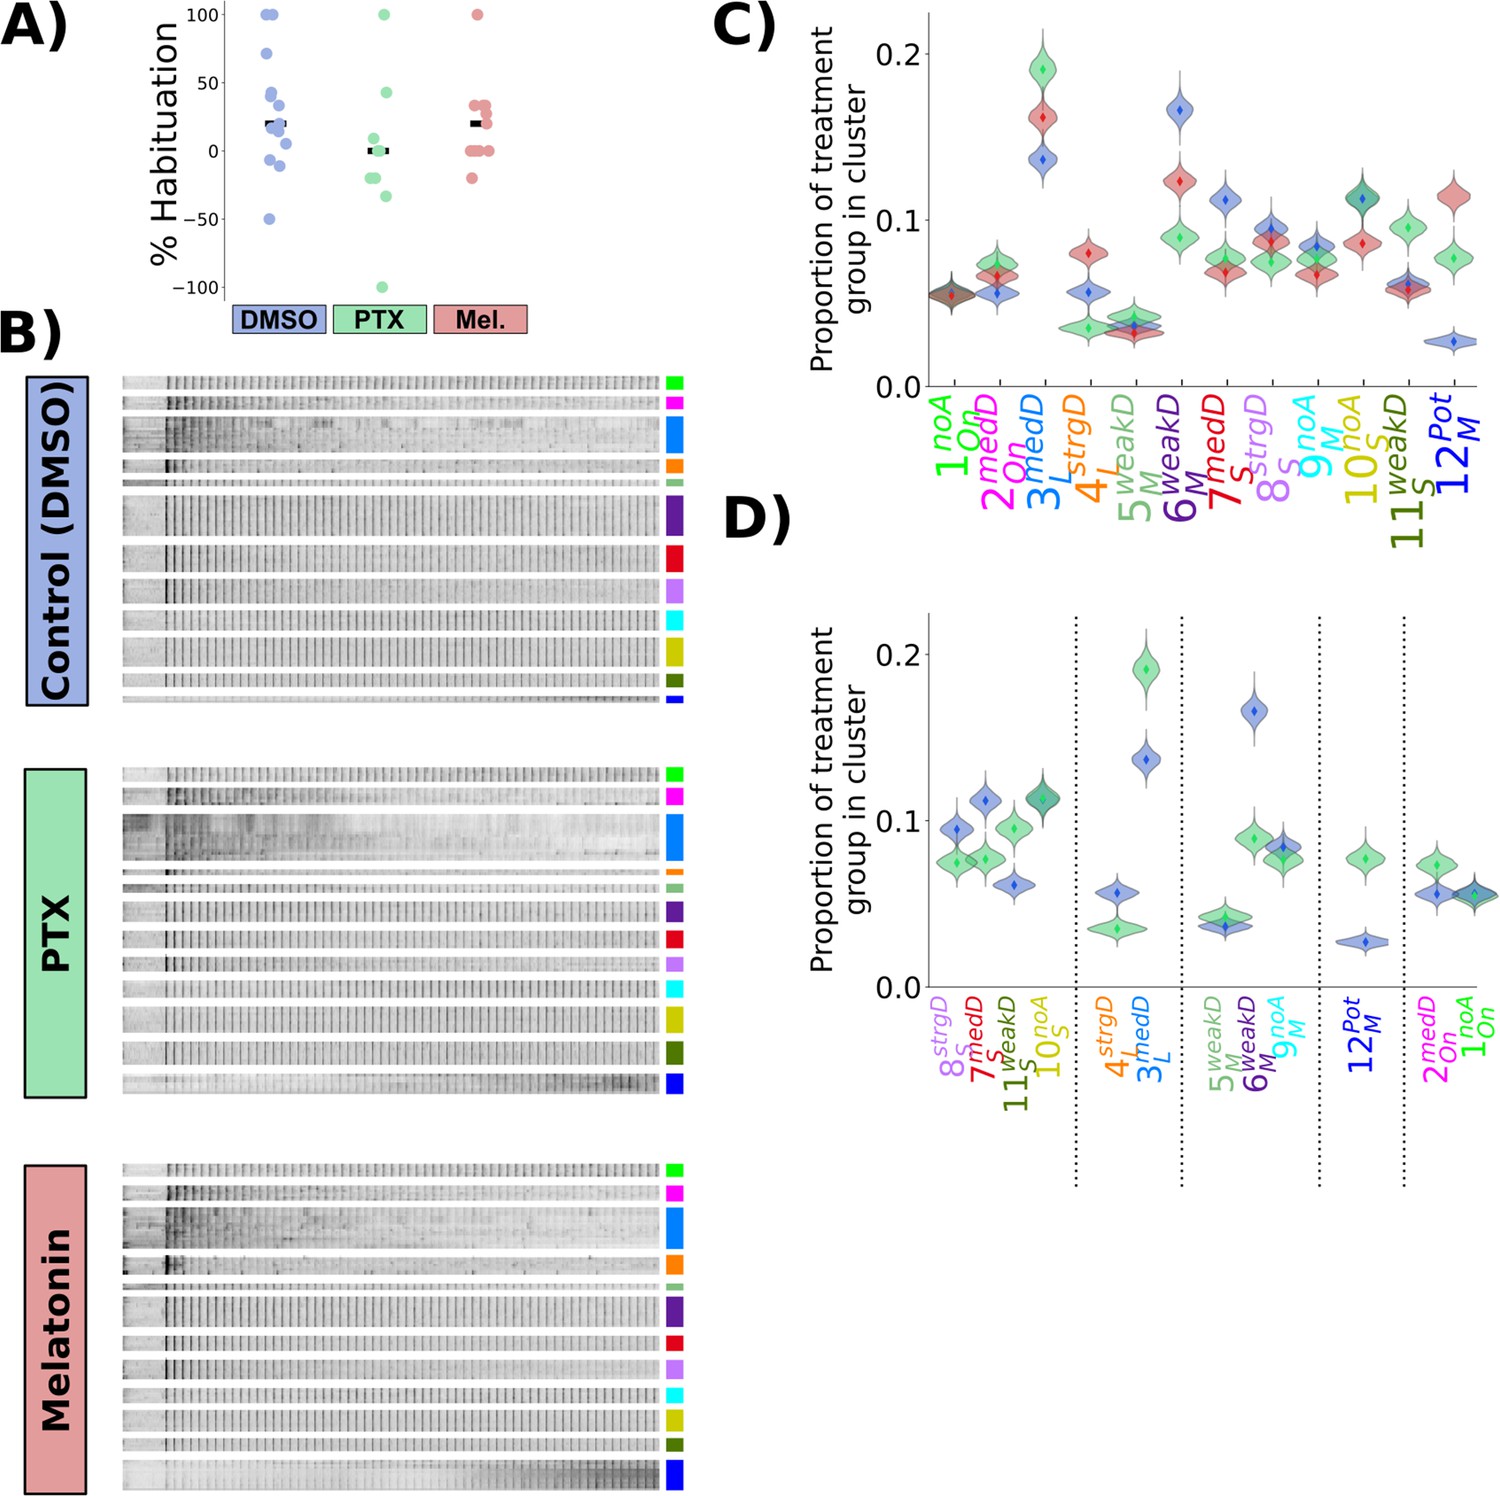
Picrotoxinin and melatonin alter the proportions of functionally identified neurons.
(A) Percent habituation for larvae during Ca2+ imaging, calculated as (B) Heatmap of response profiles of ROIs categorized into the 12 functional clusters from larvae treated with DMSO (vehicle control, n = 428,720 total ROIs in 14 larvae), Picrotoxinin (PTX, 10 uM, n = 271,037 total ROIs in 9 larvae), or melatonin (1 uM, n = 350,516 total ROIs in 11 larvae). (C) Proportion of neurons belonging to each functional cluster across treatment groups. Distributions for violin plots are bootstrapped from 5000 replicates. (D) Same data as (C), only showing the data for PTX vs DMSO vehicle control, reordered to reflect the cluster Adaptation Profiles grouped by cluster Response Shape.
Figure 6—figure supplement 1
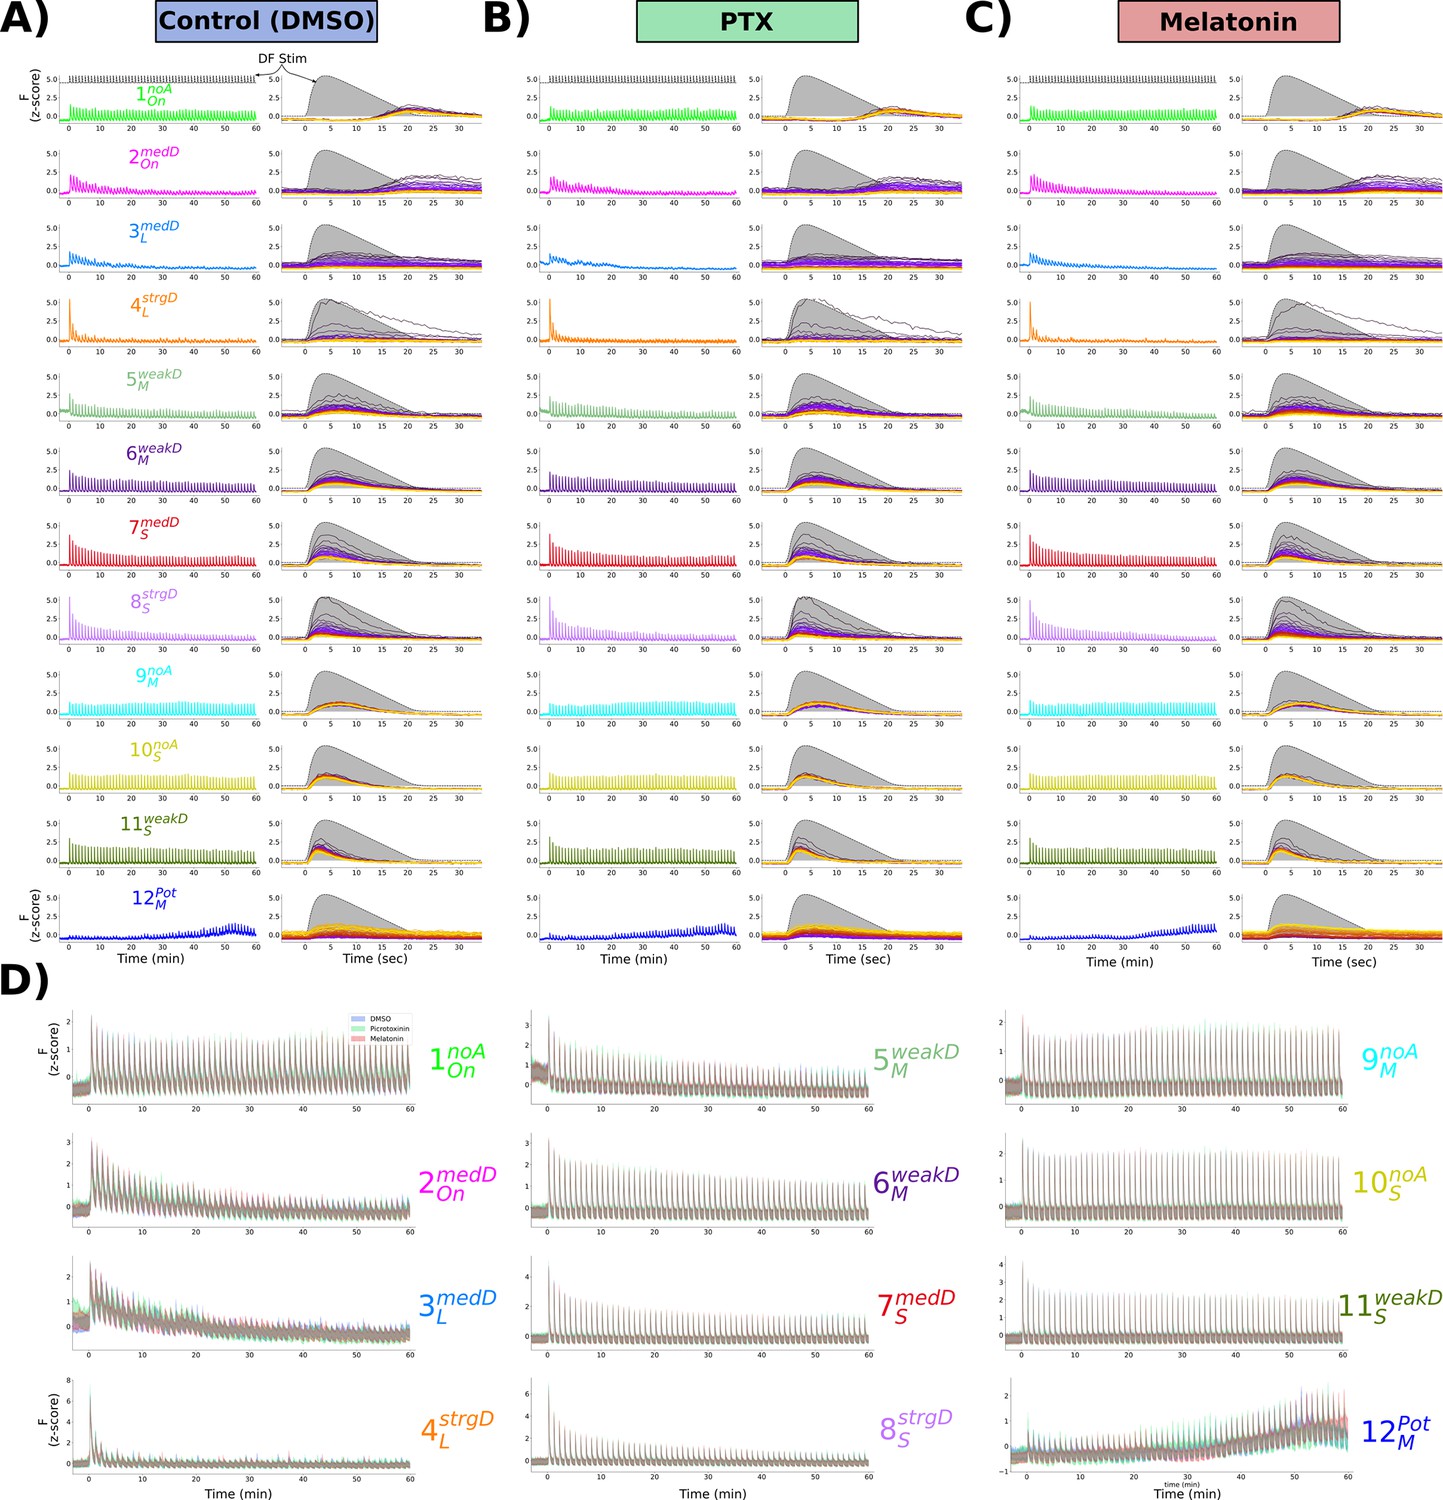
Mean response of functionally identified clusters after different pharmacological treatments.
(A–C) Average z-scored fluorescence each functional cluster plotted for the whole experiment (left column) and centred on each dark flash (DF) stimulus (right column), demonstrating the differences in both adaptation and Response Shape for each cluster after treatment with (A) 0.1% DMSO vehicle control, (B) picrotoxinin (10 uM), or (C) melatonin (1 uM). (D) Same data as (A–C), plotted together for each treatment group.
Figure 7
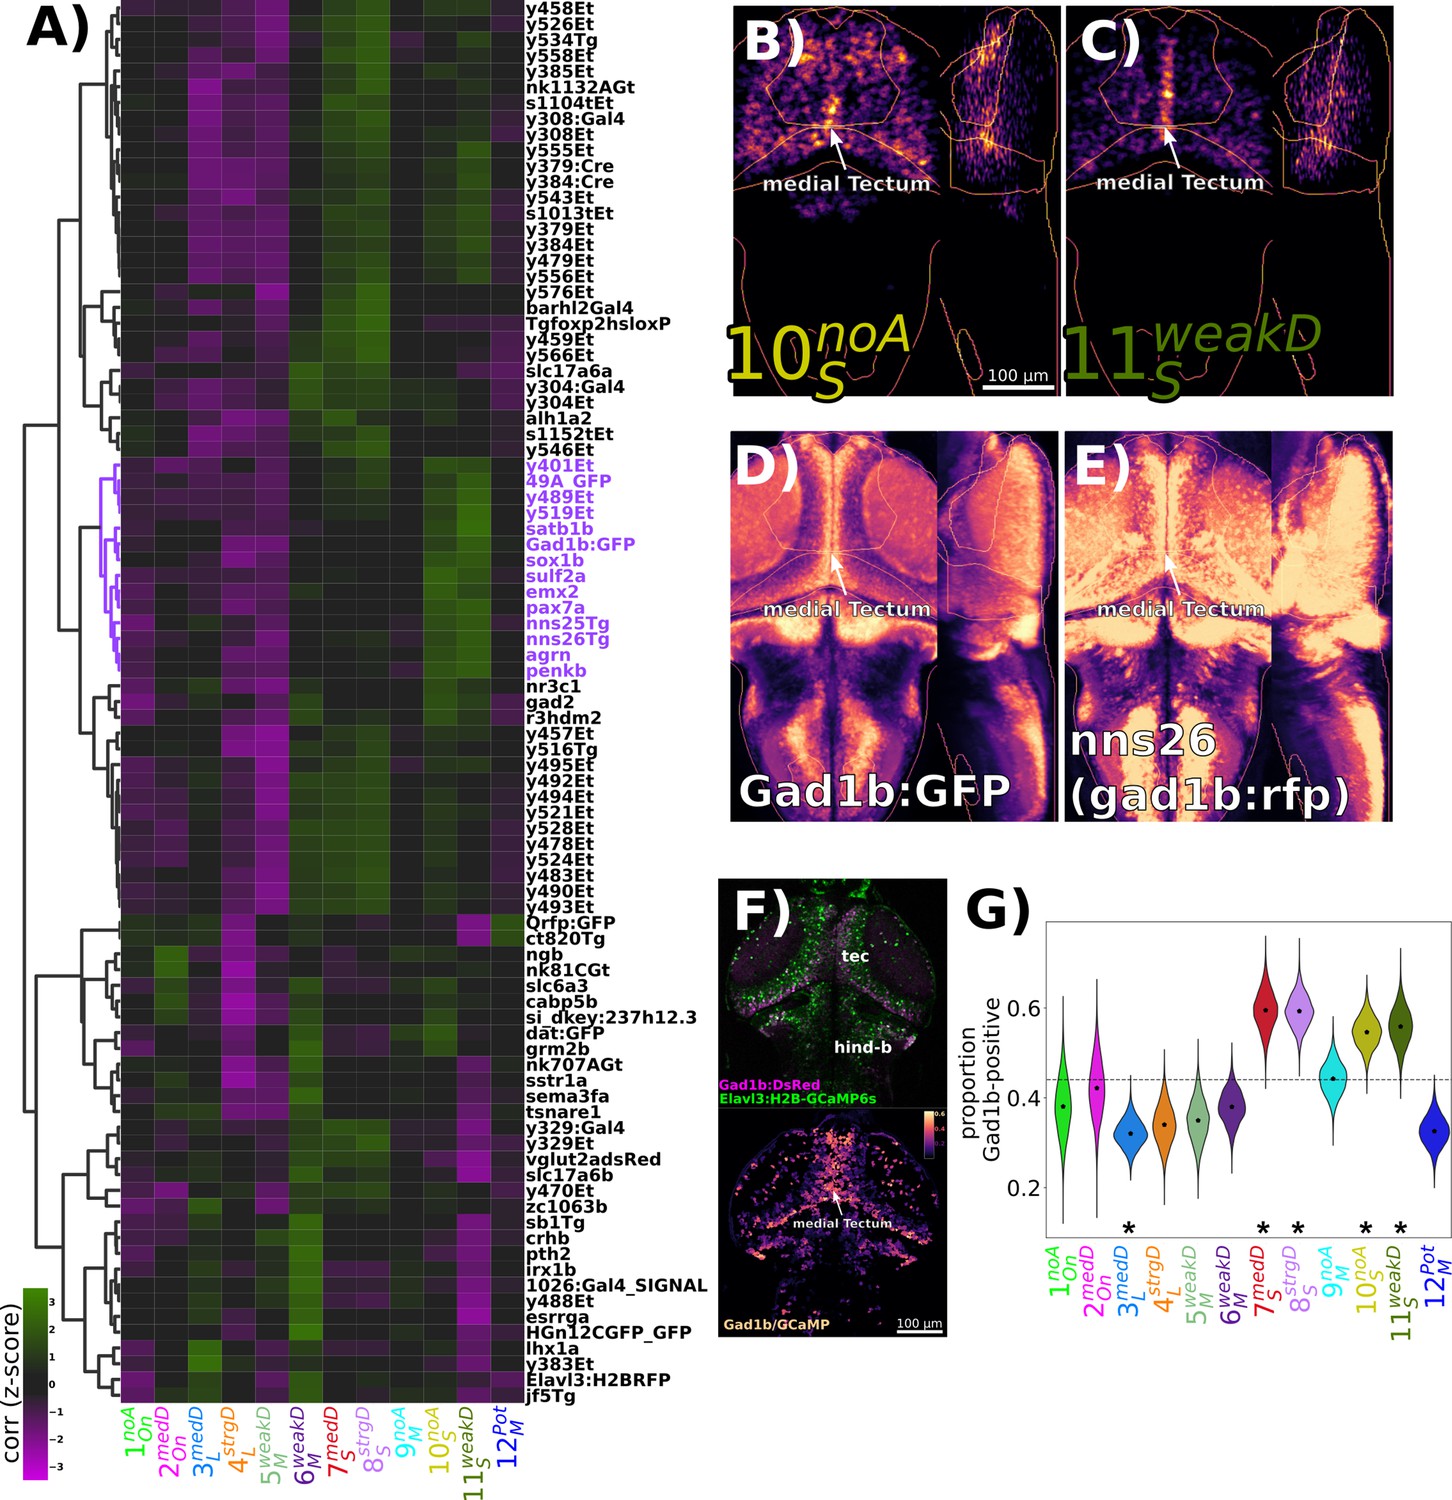
Identification of GABAergic neuronal classes.
(A) Hierarchically clustered heatmap depicting the correlation of markers aligned to the Z-Brain atlas with the spatial arrangement of the 12 functional clusters (distance = complete, correlation). Correlation values are z-scored by rows to highlight the cluster(s) most strongly correlated or anti-correlated with a given marker. The subset of the hierarchy containing the gad1b-reporters is coloured in purple. (B–D) Normalized summed intensity projections of (B) , (C) , (D) TgBAC(gad1b:GFP) (Satou et al., 2013), Z-Brain Atlas, and (E) nns26, aka TgBAC(gad1b:LOXP-RFP-LOXP-GFP) (Satou et al., 2013), mapZebrain Atlas. (F) Two-photon imaging of Tg(Gad1b:DsRed);Tg(elavl3:H2B-GCaMP6s) larvae depicting the raw data for each channel (top), and the ratio of Gad1b/GCaMP6s fluorescence in each ROI functionally identified using suite2p. (G) ROIs imaged in double transgenic larvae are assigned a cluster identity based on their correlation to the cluster mean trace and classified as Gad1b-positive based on a DsRed/GCaMP6s ratio of greater than 0.25. Dotted line = expected proportion based on total number of cells classified as Gad1b-positive. *p<0.05, Chi-square test with Bonferroni correction. Distributions for violin plots calculated by bootstrapping 5000 replicates. n = 1835 ROIs in six larvae.
Author response image 1
Additional files
Download links
A two-part list of links to download the article, or parts of the article, in various formats.
Downloads (link to download the article as PDF)
Open citations (links to open the citations from this article in various online reference manager services)
Cite this article (links to download the citations from this article in formats compatible with various reference manager tools)
Functional and pharmacological analyses of visual habituation learning in larval zebrafish
eLife 12:RP84926.
https://doi.org/10.7554/eLife.84926.3


