Understanding disruptions in cancer care to reduce increased cancer burden
- Department of Surgery, Public Health Sciences, School of Medicine, Washington University in St. Louis, United States
- Brown School, Washington University in St. Louis, United States
Figures
Figure 1
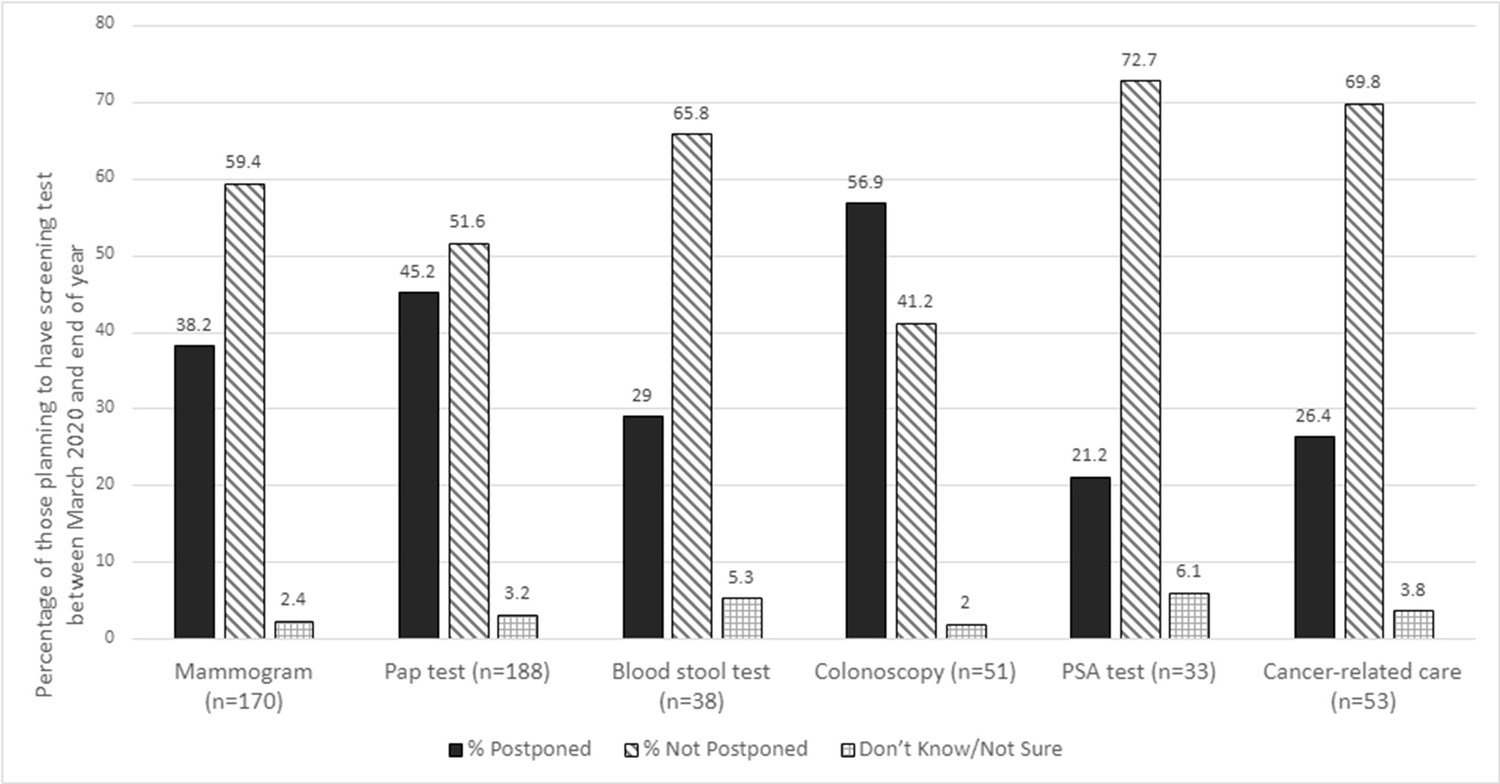
Care disruption by cancer screening/appointment type across Missouri and Southern Illinois (July-August 2020).
N shown is the number who were planning to have a screening test between March 2020 and the end of 2020; For Cancer-related care, we calculate the percentage out of those who self-reported ever being diagnosed as having cancer (n-53).
Tables
Table 1
Characteristics of residents across Missouri and Southern Illinois by care disruption status (July-August 2020).
| Variable | Category | Total sample (N=680)– N (%) | No care disruption (N=304)– N (%) | Care disruption (N=376)– N (%) |
|---|---|---|---|---|
| Race | White | 399 (58.7%) | 186 (61.2%) | 213 (56.7%) |
| Black or African American | 212 (31.2%) | 90 (29.6%) | 122 (32.5%) | |
| Asian/ Native Hawaiian or Other Pacific Islander | 21 (3.1%) | 12 (4.0%) | 9 (2.4%) | |
| Other, including multiple groups | 48 (7.1%) | 16 (5.3%) | 32 (8.5%) | |
| Hispanic, Latino/a, or Spanish origin | Yes | 15 (2.2%) | 5 (1.6%) | 10 (2.7%) |
| No | 664 (97.8%) | 299 (98.4%) | 365 (97.3%) | |
| Gender Identity* | Woman | 464 (68.2%) | 192 (63.2%) | 272 (72.3%) |
| Man | 206 (30.1%) | 110 (36.2%) | 96 (25.5%) | |
| Transgender / Gender Diverse | 5 (0.7%) | 1 (0.3%) | 4 (1.1%) | |
| Prefer not to answer | 5 (0.7%) | 1 (0.3%) | 4 (1.1%) | |
| Sex assigned at birth* | Female | 472 (69.4%) | 193 (63.5%) | 279 (74.2%) |
| Male | 204 (30.0%) | 110 (36.2%) | 94 (25.0%) | |
| Prefer not to answer | 4 (0.6%) | 1 (0.3%) | 3 (0.8%) | |
| Sexual Orientation | LGBTQIA+ | 76 (11.2%) | 25 (8.2%) | 51 (13.6%) |
| Straight or Heterosexual | 590 (86.8%) | 272 (89.5%) | 318 (84.6%) | |
| Prefer not to answer | 14 (2.1%) | 7 (2.3%) | 7 (1.9%) | |
| Education* | Less than High School or GED | 31 (4.6%) | 17 (5.6%) | 14 (3.7%) |
| Grade 12 or GED (High school graduate) | 120 (17.7%) | 64 (21.1%) | 56 (14.9%) | |
| Some college, but did not graduate | 159 (23.4%) | 78 (25.7%) | 81 (21.5%) | |
| Associates Degree or Technical School Certification | 111 (16.4%) | 42 (13.9%) | 69 (18.4%) | |
| College 4 years or more (College graduate) | 143 (21.1%) | 63 (20.8%) | 80 (21.3%) | |
| Graduate or professional school | 115 (16.9%) | 39 (12.9%) | 76 (20.2%) | |
| Annual Household Income | $0 to $9,999 | 57 (8.4%) | 32 (10.6%) | 25 (6.7%) |
| $10,000 to $14,999 | 53 (7.8%) | 19 (6.3%) | 34 (9.1%) | |
| $15,000 to $19,999 | 36 (5.3%) | 14 (4.6%) | 22 (5.9%) | |
| $20,000 to $34,999 | 105 (15.5%) | 43 (14.2%) | 62 (16.5%) | |
| $35,000 to $49,999 | 110 (16.2%) | 50 (16.5%) | 60 (16.0%) | |
| $50,000 to $74,999 | 121 (17.9%) | 60 (19.8%) | 61 (16.3%) | |
| $75,000 to $99,999 | 91 (13.4%) | 45 (14.9%) | 46 (12.3%) | |
| $100,000 or more | 105 (15.5%) | 40 (13.2%) | 65 (17.3%) | |
| Metro or Non-Metro Area (RUCC codes by ZIP Code) | Metro | 493 (72.5%) | 222 (73.0%) | 271 (72.1%) |
| Non-Metro | 187 (27.5%) | 82 (27.0%) | 105 (27.9%) | |
| Employment (pre-COVID) | Employed Full-time | 321 (47.4%) | 148 (49.2%) | 173 (46.0%) |
| Employed Part-time | 72 (10.6%) | 30 (10.0%) | 42 (11.2%) | |
| Unemployed | 61 (9.0%) | 29 (9.6%) | 32 (8.5%) | |
| Homemaker | 65 (9.6%) | 22 (7.3%) | 43 (11.4%) | |
| Student | 4 (0.6%) | 2 (0.7%) | 2 (0.5%) | |
| Retired | 84 (12.4%) | 42 (14.0%) | 42 (11.2%) | |
| Disabled | 62 (9.2%) | 23 (7.6%) | 39 (10.4%) | |
| Self-Employed/Other | 8 (1.2%) | 5 (1.7%) | 3 (0.8%) | |
| Insurance | Private | 314 (46.2%) | 135 (44.4%) | 179 (47.6%) |
| Medicare/Medicare + | 126 (18.5%) | 59 (19.4%) | 67 (17.8%) | |
| Medicaid | 120 (17.7%) | 47 (15.5%) | 73 (19.4%) | |
| Other/Unknown | 22 (3.2%) | 12 (4.0%) | 10 (2.7%) | |
| Currently do not have insurance | 98 (14.4%) | 51 (16.8%) | 47 (12.6%) | |
| Telehealth appointment* | Yes | 233 (34.3%) | 85 (28.0%) | 148 (39.4%) |
| No | 447 (65.7%) | 219 (72.0%) | 228 (60.6%) | |
| Telehealth appointment type | Cancer Care | 6 (2.6%) | 0 (0%) | 6 (4.1%) |
| General Health Care | 218 (94.0%) | 81 (96.4%) | 137 (92.6%) | |
| Both | 8 (3.5%) | 3 (3.6%) | 5 (3.4%) | |
| Access to Private Vehicle (own or others) | Yes | 611 (89.9%) | 275 (90.5%) | 336 (89.4%) |
| No | 69 (10.2%) | 29 (9.5%) | 40 (10.6%) | |
| Laid off Job or had to close own business* | Yes | 135 (19.9%) | 50 (16.5%) | 85 (22.6%) |
| No | 423 (62.2%) | 204 (67.1%) | 219 (58.2%) | |
| Don’t Know/Not Sure/Prefer Not to Answer | 15 (2.2%) | 2 (0.7%) | 13 (3.5%) | |
| Not Applicable | 107 (15.7%) | 48 (15.8%) | 59 (15.7%) | |
| Variable | Mean (SD) | |||
| Age | 46.2 (12.6) | 46.0 (13.3) | 46.5 (12.0) | |
| Discrimination † | 1.8 (0.8) | 1.7 (0.8) | 1.9 (0.9) | |
-
Missing values: 1 Hispanic/Latina(a)/Spanish origin; 1 Education; 2 Income; 3 Employment.
-
*
Statistically significant difference (P<0.05; Chi-square or Fischer’s test for categorical, t-test or Wilcoxon rank sum for continuous).
-
†
Average score of 7 items on a scale of (1) never, (2) once, (3) 2 or 3 times, and (4) 4 times or more; higher scores indicate more discrimination.
Table 2
Odds of any care disruption compared to no care disruption by social factors across Missouri and Southern Illinois (July-August 2020).
| Variable | Overall Sample (N=663) | Non-Hispanic Black or African American (N=205) | Non-Hispanic White (N=387) | |||
|---|---|---|---|---|---|---|
| Odds Ratio | 95% CI | Odds Ratio | 95% CI | Odds Ratio | 95% CI | |
| Race/Ethnicity | ||||||
| Non-Hispanic Black or African American | 1.15 | 0.77, 1.72 | -- | -- | -- | -- |
| Other Race/Ethnicity | 1.40 | 0.79, 2.45 | -- | -- | -- | -- |
| Non-Hispanic White (ref) | -- | -- | -- | -- | -- | -- |
| Sex Assigned at Birth* ‡ | ||||||
| Female | 1.60 | 1.12, 2.30 | 1.11 | 0.56, 2.19 | 1.90 | 1.17, 3.08 |
| Male (ref) | -- | -- | -- | -- | -- | -- |
| Sexual Orientation | ||||||
| LGBTQIA+ | 1.53 | 0.88, 2.65 | 0.68 | 0.27, 1.72 | 1.65 | 0.73, 3.73 |
| Straight or Heterosexual (ref) | -- | -- | -- | -- | -- | -- |
| Area designation (by ZIP code) | ||||||
| Non-Metro | 1.23 | 0.82, 1.84 | -- | -- | -- | -- |
| Metro (ref) | -- | -- | -- | -- | -- | -- |
| Telehealth Appointment* ‡ | ||||||
| Yes | 1.51 | 1.07, 2.15 | 1.06 | 0.57, 1.99 | 1.62 | 1.01, 2.59 |
| No (ref) | -- | -- | -- | -- | -- | -- |
| Access to Private Vehicle (own or others) | ||||||
| Yes | 0.74 | 0.41, 1.33 | 0.79 | 0.33, 1.90 | 0.74 | 0.27, 1.98 |
| No (ref) | -- | -- | -- | -- | -- | -- |
| Health Insurance | ||||||
| Medicare/Medicare + | 0.71 | 0.41, 1.24 | 0.88 | 0.31, 2.47 | 0.75 | 0.37, 1.52 |
| Medicaid | 1.02 | 0.59, 1.75 | 0.76 | 0.32, 1.77 | 1.43 | 0.65, 3.15 |
| Other/Unknown | 0.63 | 0.24, 1.66 | 0.75 | 0.15, 3.92 | 0.38 | 0.09, 1.65 |
| Currently do not have insurance | 0.66 | 0.38, 1.13 | 0.58 | 0.22, 1.52 | 0.87 | 0.42, 1.80 |
| Private (ref) | -- | -- | -- | -- | -- | -- |
| Laid off Job or had to close own business | ||||||
| Yes | 1.55 | 0.994, 2.41 | 1.55 | 0.75, 3.20 | 1.52 | 0.80, 2.89 |
| No (ref) | -- | -- | -- | -- | -- | -- |
| Don’t Know/Not Sure/Prefer Not to Answer/Not Applicable | 1.42 | 0.89, 2.25 | 2.12 | 0.87, 5.18 | 1.06 | 0.59, 1.93 |
| Education ‡†* | 1.26 | 1.11, 1.43 | 1.45 | 1.13, 1.85 | 1.39 | 1.17, 1.65 |
| Income | 0.99 | 0.89, 1.09 | 0.93 | 0.78, 1.13 | 0.99 | 0.87, 1.13 |
| Discrimination* | 1.40 | 1.13, 1.72 | 1.26 | 0.89, 1.78 | 1.29 | 0.96, 1.74 |
| Age† | 1.01 | 0.995, 1.03 | 0.99 | 0.96, 1.02 | 1.02 | 1.001, 1.04 |
-
*
Statistically significant (p<0.05) overall variable effect – overall model.
-
†
Statistically significant (p<0.05) overall variable effect – Non-Hispanic White model.
-
‡
Statistically significant (p<0.05) overall variable effect – Non-Hispanic Black or African American model.
Additional files
-
Supplementary file 1
Survey item information.
- https://cdn.elifesciences.org/articles/85024/elife-85024-supp1-v2.docx
-
Supplementary file 2
Characteristics of residents across Missouri and Southern Illinois by race (July-August 2020).
- https://cdn.elifesciences.org/articles/85024/elife-85024-supp2-v2.docx
-
MDAR checklist
- https://cdn.elifesciences.org/articles/85024/elife-85024-mdarchecklist1-v2.docx
-
Source code 1
Care disruption analysis SAS code file.
- https://cdn.elifesciences.org/articles/85024/elife-85024-code1-v2.zip
Download links
A two-part list of links to download the article, or parts of the article, in various formats.
Downloads (link to download the article as PDF)
Open citations (links to open the citations from this article in various online reference manager services)
Cite this article (links to download the citations from this article in formats compatible with various reference manager tools)
Understanding disruptions in cancer care to reduce increased cancer burden
eLife 12:e85024.
https://doi.org/10.7554/eLife.85024


