A twin UGUA motif directs the balance between gene isoforms through CFIm and the mTORC1 signaling pathway
- Department of Pathology, University of Pittsburgh, United States
- Department of Biological Sciences, University of Pittsburgh, United States
Figures
Figure 1 with 1 supplement

A shift toward Trim9-L/TRIM9-L expression in Tsc1-KO mouse cortical excitatory neurons and differentiated human TSC2-KO neural stem cells (NSCs).
(A) The experimental strategy to identify in vivo alternative polyadenylation (APA) shifts in Tsc1-KO cortical excitatory neurons in mouse. (B) GENCODE annotations and cTag-PAPERCLIP results (merged from two biological replicates) for Trim9. Arrowheads: poly(A) sites identified by cTag-PAPERCLIP. P, proximal; D, distal. (Because Trim9 is located on the minus strand, the orientation is horizontally flipped from the original.) (C) Illustrations comparing the exons and known protein domains (based on UniProt annotations) contained in mouse Trim9-L and Trim9-S. R, RING-type zinc finger. B, B box-type zinc finger; CC, coiled coil; FNIII, fibronectin type-III; SPRY, SPla/Ryanodine receptor. (D) Western blots showing a shift toward Trim9-L protein expression in a pAAV-Camk2a-iCre-injected Tsc1fl/fl; cTag-PABP mouse (KO) in the brain cortex when compared to an uninjected cTag-PABP mouse (WT). Tubulin: loading control. (E) Quantitation of Trim9 mRNA isoforms by RT-qPCR in the brain cortex of Tsc1fl/fl (‘Tsc1-floxed’) and Camk2a-Cre; Tsc1fl/fl (‘Tsc1-KO’) mice (the same pair of mice shown in Figure 1—figure supplement 1C). Individual Trim9 mRNA isoform expression was first normalized to Rplp0 expression and then normalized to the expression level in the Tsc1-floxed mouse. (F) Quantitation of individual TRIM9 mRNA isoforms (left) or TRIM9-L/TRIM9-S mRNA ratio (right) by RNA-seq (GSE78961) in TSC2-wildtype (WT) and TSC2-KO human NSCs after 6 wk of neural differentiation. cpm, counts per million. Error bars indicate SEM. Statistical significance is determined by two-tailed t-test (F, left panel) and one-tailed t-test (F, right panel). NS, not significant, *p<0.05.
-
Figure 1—source data 1
Figure 1D, uncropped western blot images.
- https://cdn.elifesciences.org/articles/85036/elife-85036-fig1-data1-v1.zip
Figure 1—figure supplement 1
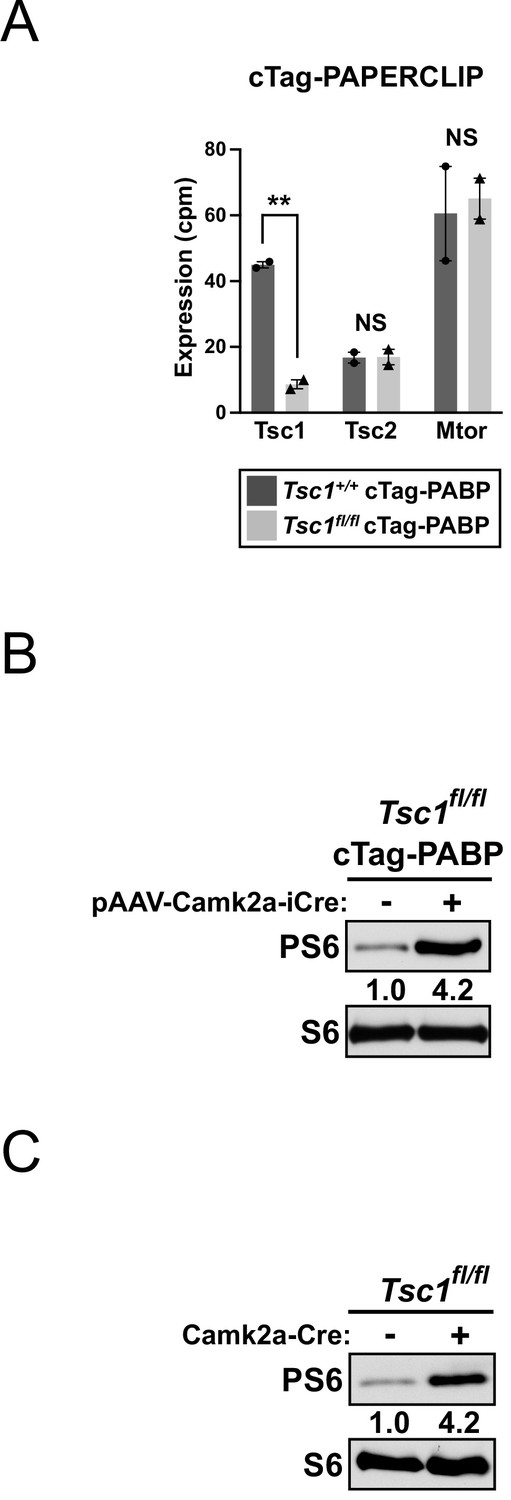
Systemic adeno-associated virus (AAV) delivery of Cre recombinase activates mTORC1 signaling with similar efficiency to genetic breeding.
(A) Bar graphs showing quantitation of Tsc1, Tsc2, and Mtor mRNA expression from two biological replicate cTag-PAPERCLIP experiments in pAAV-Camk2a-iCre-injected cTag-PABP mice (Tsc1-wildtype or Tsc1-floxed). Error bars indicate SEM. Statistical significance is determined by two-tailed t-test. NS, not significant, **p<0.01. (B) Western blots showing the expression of total and phosphorylated S6 (PS6) ribosomal protein in the brain cortices of adult Tsc1-floxed cTag-PABP mice (with or without pAAV-Camk2a-iCre injection). (C) Western blots showing the expression of total and phosphorylated S6 ribosomal protein in the brain cortices of a 4-week-old Camk2a-Cre; Tsc1-floxed mouse and a Tsc1-floxed littermate.
-
Figure 1—figure supplement 1—source data 1
Figure 1—figure supplement 1B, uncropped western blot images.
- https://cdn.elifesciences.org/articles/85036/elife-85036-fig1-figsupp1-data1-v1.zip
-
Figure 1—figure supplement 1—source data 2
Figure 1—figure supplement 1C, uncropped western blot images.
- https://cdn.elifesciences.org/articles/85036/elife-85036-fig1-figsupp1-data2-v1.zip
Figure 2 with 1 supplement

The mTORC1 signaling pathway regulates the balance between Trim9-L/TRIM9-L and Trim9-S/TRIM9-S in mouse and human cells.
(A) Western blots showing the expression of total and phosphorylated S6 (PS6) ribosomal protein in N2a cells with different treatments for 48 hr. (B) Bar graphs showing the expression of two Trim9 mRNA isoforms relative to the endogenous control (left panel) and the expression of Trim9-L mRNA relative to Trim9-S mRNA (right panel) measured by RT-qPCR in N2a cells receiving different treatments for 48 hr from four independent experiments (n = 4). In the left panel, individual Trim9 mRNA isoform expression was first normalized to Rplp0 expression and then normalized to the expression level in untreated cells (Un). In the right panel, Trim9-L expression was first normalized to Trim9-S expression and then normalized to the expression level in untreated cells. (C) Western blots showing the expression of Trim9 protein isoforms in untreated (Un) or Torin 1-treated (for 48 hr) N2a cells. Actin: loading control. (D) Bar graphs showing the relative expression of Trim9-L protein to Trim9-S protein measured by western blotting in untreated (Un) or Torin 1-treated (for 48 hr) N2a cells from 3 independent experiments (n = 3). Trim9-L protein expression was first normalized to Trim9-S protein expression and then normalized to the expression level in untreated cells. (E) Western blots showing the expression of total and phosphorylated S6 ribosomal protein in N2a cells transfected with different siRNAs for 72 hr. siCtrl: control siRNA. (F) Bar graphs showing the expression of two Trim9 mRNA isoforms relative to the endogenous control (left panel) and the expression of Trim9-L mRNA relative to Trim9-S mRNA (right panel) measured by RT-qPCR in N2a cells transfected with different siRNAs for 72 hr from four independent experiments (n = 4). (G) Bar graphs showing the expression of two TRIM9 mRNA isoforms relative to the endogenous control (left panel) and the expression of TRIM9-L mRNA relative to TRIM9-S mRNA (right panel) measured by RT-qPCR in BE2C cells receiving different treatments (siCtrl+Torin: 48 hr; siCtrl and siTSC2: 72 hr) from four independent experiments (n = 4). In the left panel, individual TRIM9 mRNA isoform expression was first normalized to ACTB expression and then normalized to the expression level in the siCtrl group. In the right panel, TRIM9-L expression was first normalized to TRIM9-S expression and then normalized to the expression level in the siCtrl group. Torin 1 was used at 250 nM in all experiments. Due to different exposure conditions, PS6 and S6 levels cannot be directly compared between (A) and (E). Error bars indicate SEM. Statistical significance is determined by two-tailed t-test. NS, not significant, *p<0.05; **p<0.01.
-
Figure 2—source data 1
Figure 2A, uncropped western blot images.
- https://cdn.elifesciences.org/articles/85036/elife-85036-fig2-data1-v1.zip
-
Figure 2—source data 2
Figure 2C, uncropped western blot images.
- https://cdn.elifesciences.org/articles/85036/elife-85036-fig2-data2-v1.zip
-
Figure 2—source data 3
Figure 2E, uncropped western blot images.
- https://cdn.elifesciences.org/articles/85036/elife-85036-fig2-data3-v1.zip
Figure 2—figure supplement 1
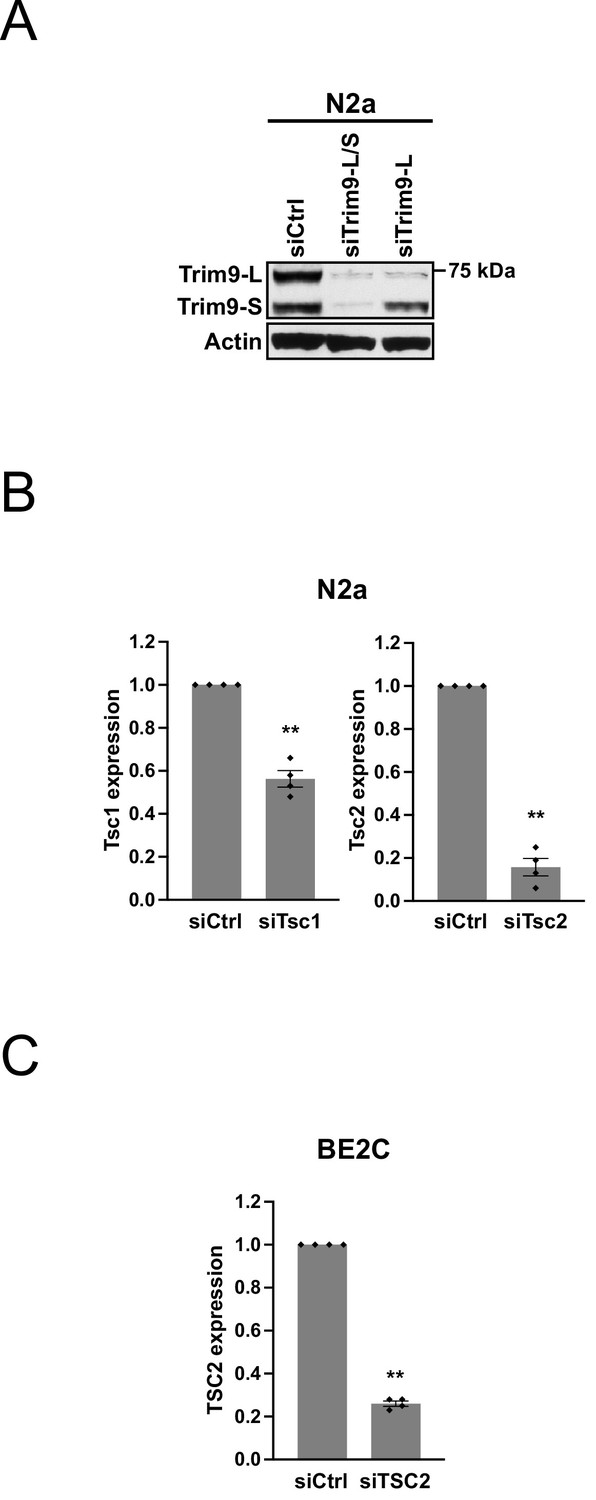
Characterization of a TRIM9 antibody and measurements of Tsc1/Tsc2 siRNA knockdown efficiency.
(A) Western blots showing the expression of Trim9-L and Trim9-S proteins in N2a cells transfected with different siRNAs for 72 hr. siCtrl: control siRNA. Actin: loading control. (B) Bar graphs showing the knockdown efficiency of Tsc1 and Tsc2 siRNAs measured 72 hr after transfection by RT-qPCR in N2a cells in the same experiments shown in Figure 2F (n = 4). Tsc1 and Tsc2 expression was first normalized to Rplp0 expression and then normalized to the expression level in the siCtrl group. (C) Bar graphs showing the knockdown efficiency of TSC2 siRNAs measured 72 hr after transfection by RT-qPCR in BE2C cells in the same experiments shown in Figure 2G (n = 4). TSC2 expression was first normalized to ACTB expression and then normalized to the expression level in the siCtrl group. Error bars indicate SEM. Statistical significance is determined by two-tailed t-test. **p<0.01.
-
Figure 2—figure supplement 1—source data 1
Figure 2—figure supplement 1A, uncropped western blot images.
- https://cdn.elifesciences.org/articles/85036/elife-85036-fig2-figsupp1-data1-v1.zip
Figure 3 with 1 supplement

CPSF6 and NUDT21 promote Trim9-S/TRIM9-S expression in mouse and human cells.
(A) Western blots showing Cpsf6 protein expression in control (Ctrl) and Cpsf6 knockdown (Cpsf6-KD) N2a cells. Actin: loading control. (B) Bar graphs showing the expression of Trim9 mRNA isoforms measured by RT-qPCR in Ctrl and Cpsf6-KD N2a cells from three independent experiments (n = 3). (C) Bar graphs showing the knockdown efficiency of Nudt21 siRNAs (siNudt21) measured 72 hr after transfection by RT-qPCR from three independent experiments (n = 3). siCtrl: control siRNA. (D) Bar graphs showing the expression of Trim9 mRNA isoforms measured 72 hr after transfection by RT-qPCR in N2a cells from the same experiments in (C) (n = 3). (E) Bar graphs showing the knockdown efficiency of CPSF6 (siCPSF6) and NUDT21 (siNUDT21) siRNAs measured 72 hr after transfection by RT-qPCR from three independent experiments (n = 3). (F) Bar graphs showing the expression of TRIM9 mRNA isoforms measured 72 hr after transfection by RT-qPCR in BE2C cells from the same experiments in (E) (n = 3). (G) Bar graphs showing the expression of Trim9-L mRNA relative to Trim9-S mRNA measured by RT-qPCR in Ctrl and Cpsf6-KD N2a cells from four independent experiments (n = 4). Ctrl and Cpsf6-KD N2a cells were either left untreated (Un) or treated with Torin for 48 hr (+Torin). (H) Bar graphs showing the expression of Trim9-L mRNA relative to Trim9-S mRNA measured by RT-qPCR in N2a cells receiving different treatments from four independent experiments (n = 4). See Figure 3—figure supplement 1B for the experiment design. Torin 1: 250 nM. Error bars indicate SEM. Statistical significance is determined by two-tailed t-test. NS, not significant, *p<0.05, **p<0.01.
-
Figure 3—source data 1
Figure 3A, uncropped western blot images.
- https://cdn.elifesciences.org/articles/85036/elife-85036-fig3-data1-v1.zip
Figure 3—figure supplement 1
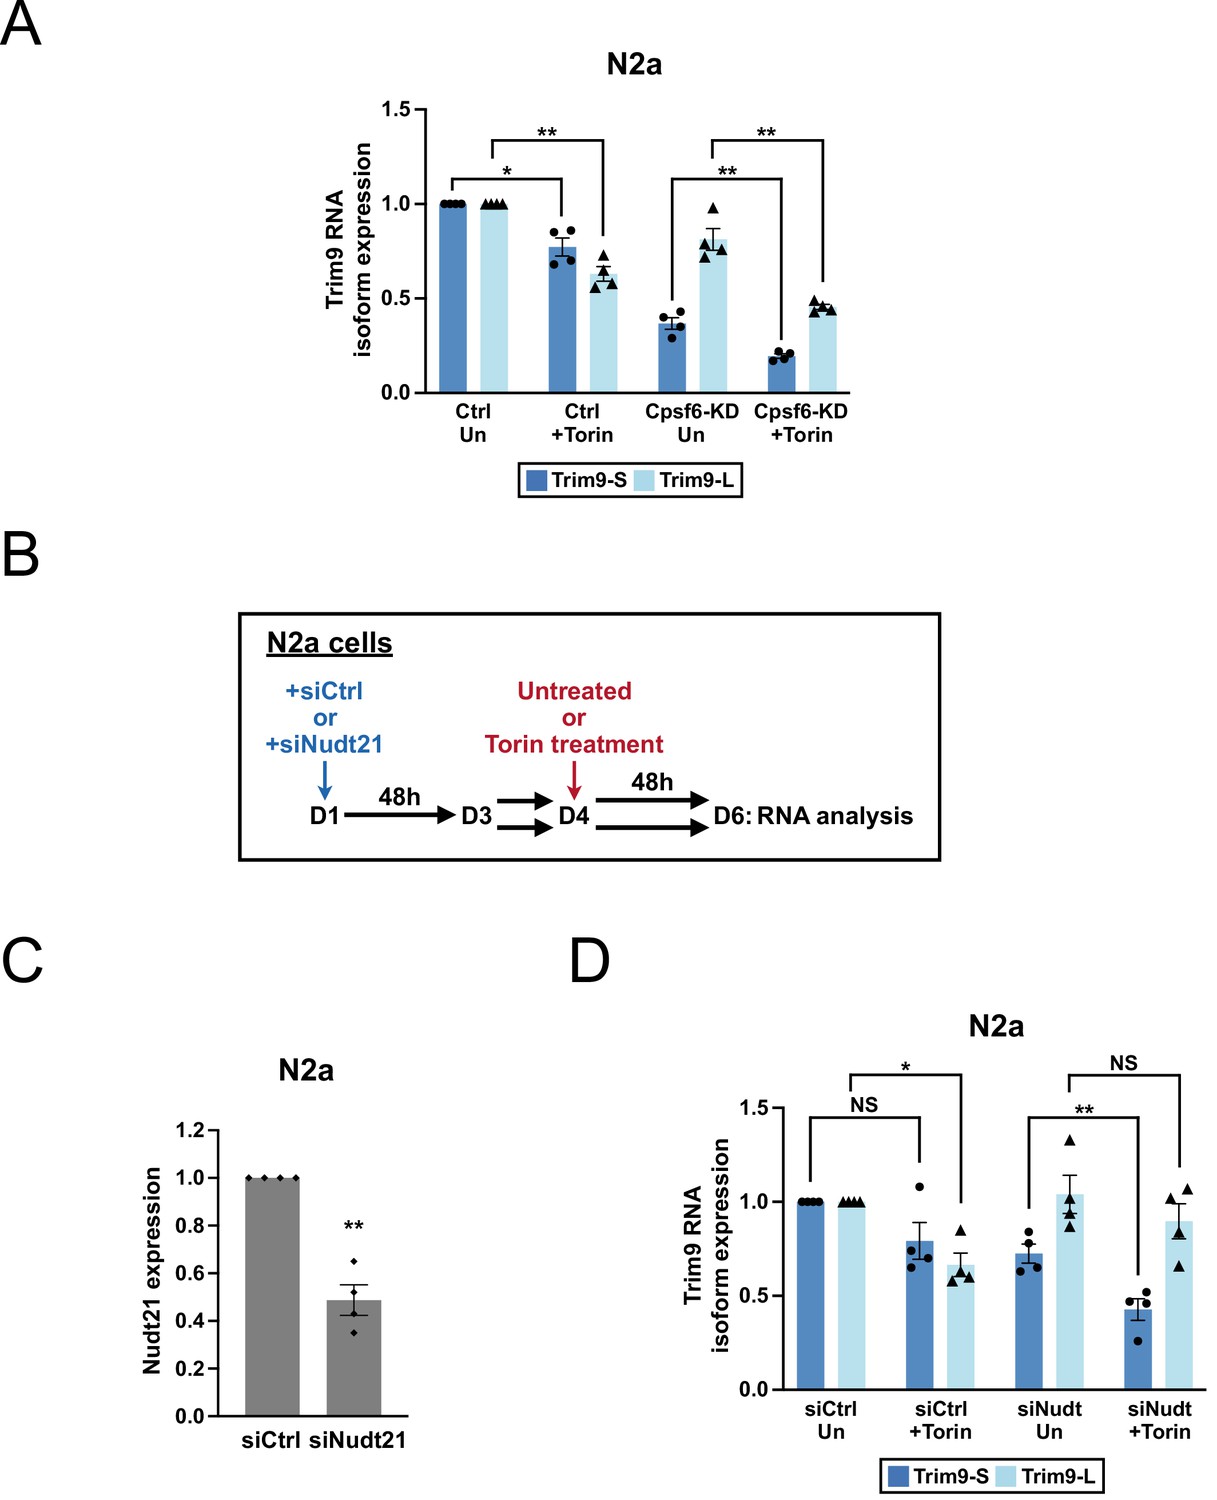
Assaying Cpsf6 and Nudt21 requirement in Trim9 regulation by mTORC1 activities in N2a cells.
(A) Bar graphs showing the expression of two Trim9 mRNA isoforms relative to the endogenous control measured by RT-qPCR in Ctrl and Cpsf6-KD N2a cells in the same experiments shown in Figure 3G (n = 4). Ctrl and Cpsf6-KD N2a cells were either left untreated (Un) or treated with Torin 1 for 48 hr (+Torin). (B) Illustrations showing the experimental design for investigating Nudt21 requirement in Trim9 regulation by mTORC1 activities in N2a cells. On day 1 (D1), N2a cells were transfected with either control or Nudt21 siRNAs. The transfected cells were split to two halves on day 3 (D3). On day 4 (D4), one half of the cells received Torin 1 treatment while the other half was left untreated. On day 6 (D6), after 48 hr of Torin 1 treatment, the cells were harvested for RNA analysis. See Figure 3H for the results. (C) Bar graphs showing the knockdown efficiency of Nudt21 siRNAs (siNudt21) measured on day 6 by RT-qPCR in the same experiments shown in Figure 3H (n = 4). siCtrl: control siRNA. (D) Bar graphs showing the expression of two Trim9 mRNA isoforms relative to the endogenous control measured by RT-qPCR in N2a cells receiving different treatments in the same experiments shown in Figure 3H (n = 4). Torin 1: 250 nM. Error bars indicate SEM. Statistical significance is determined by two-tailed t-test. NS, not significant, *p<0.05, **p<0.01.
Figure 4 with 1 supplement

CPSF6 regulates TRIM9-S expression through an evolutionarily conserved twin UGUA motif.
(A) Illustrations showing human TRIM9-S PAS and mouse Trim9-S PAS, including locations of the UGUA motifs (shown as yellow boxes numbered from 5′ to 3′). The twin UGUA motif is indicated by yellow boxes 1 and 2. The red outline indicates conservation between human and mouse. AAUAAA, the poly(A) signal. See Figure 4—figure supplement 1A for the alignment of human and mouse nucleotide sequences. (B) Illustrations showing the design of GFP alternative polyadenylation (APA) reporter to measure the strength of the inserted PAS (Test PAS) by RT-qPCR. See ‘Materials and methods’ for details. bGH, bovine growth hormone. (C) Bar graphs showing usage of L3 wildtype PAS in both wildtype (WT) and CPSF6-KO (CKO) 293T cells from three independent experiments (n = 3). (D) Bar graphs showing usage of both wildtype (L3-WT) and mutant (L3-MU) L3 PASs in 293T cells from three independent experiments (n = 3). (E) Illustrations showing the design of different TRIM9S PAS reporters. (F) Bar graphs showing usage of TRIM9-S wildtype PAS in both WT and CKO 293T cells from three independent experiments (n = 3). (G) Bar graphs showing usage of different TRIM9S PAS reporters in 293T or CKO cells from three independent experiments (n = 3). (H) Illustrations showing the design of additional TRIM9S PAS reporters. (I) Bar graphs showing usage of different TRIM9S PAS reporters in 293T cells from three independent experiments (n = 3). Different colors represent distinct PAS reporters. All measurements for the PAS reporter assays were performed 24 hr after transfection. Error bars indicate SEM. Statistical significance is determined by two-tailed t-test. NS, not significant, *p<0.05, **p<0.01.
Figure 4—figure supplement 1
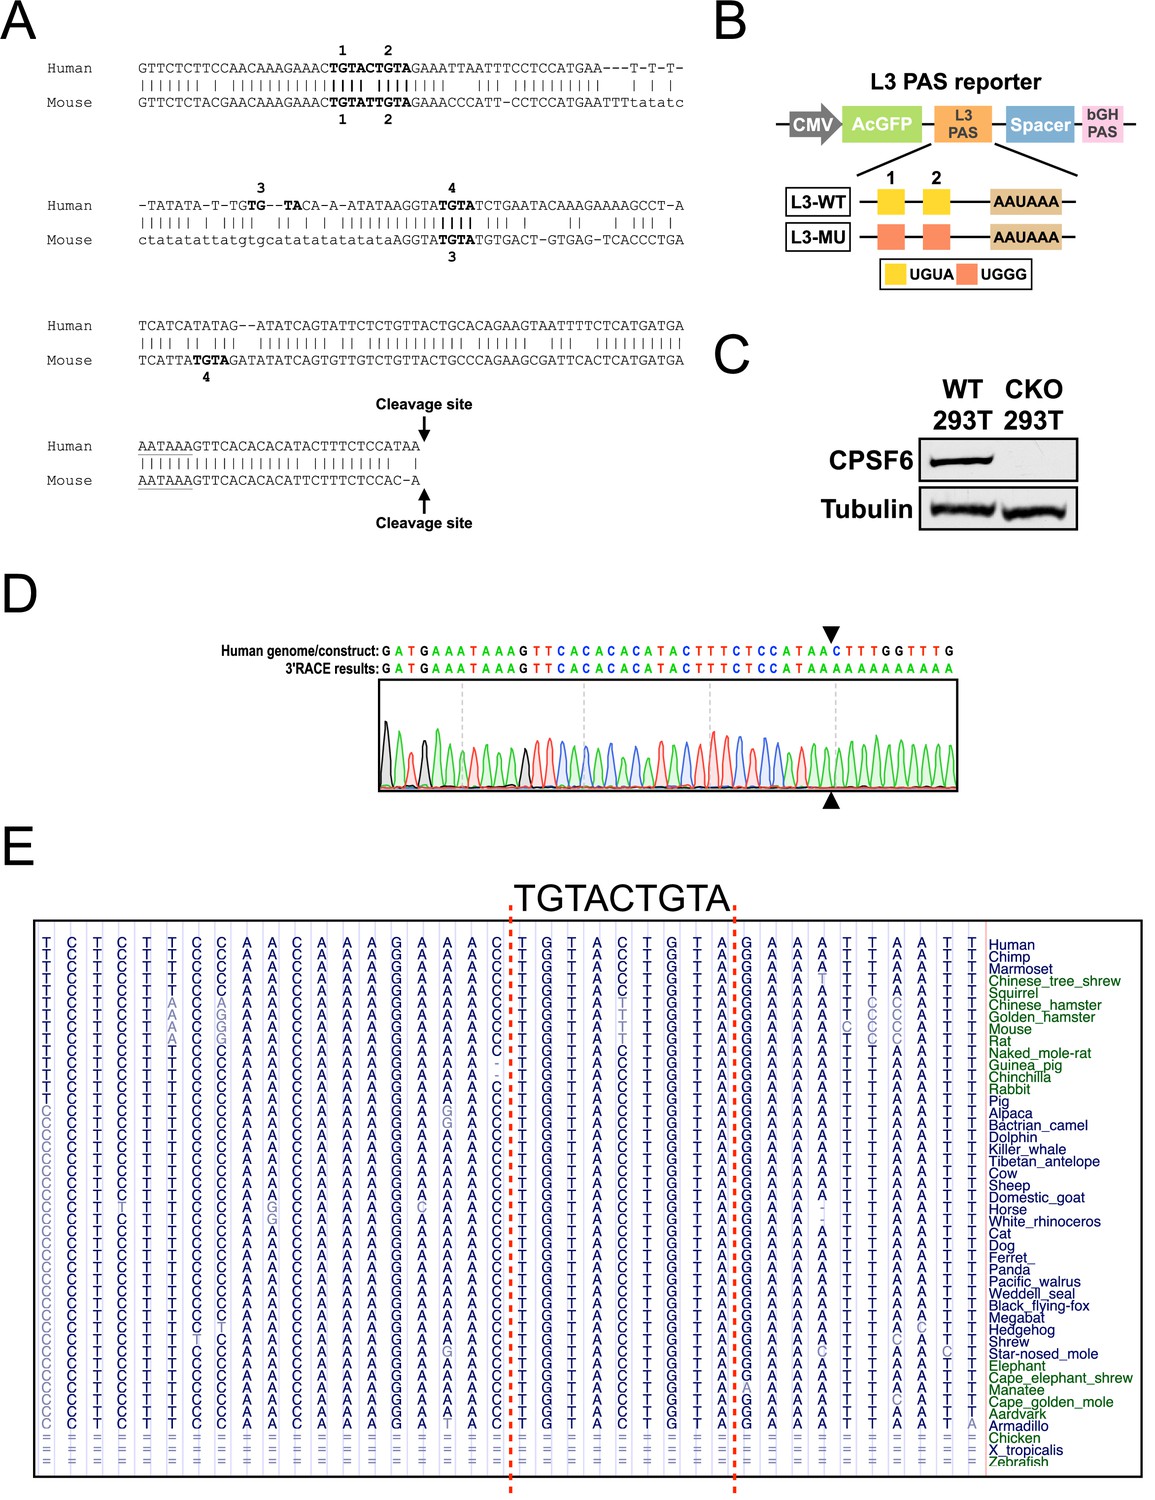
Characterization of reagents and tools for the PAS reporter assay.
(A) Pairwise genomic sequence alignment (0–200 bp; 0 = cleavage site) between human TRIM9-S PAS and mouse Trim9-S PAS. TGTA motifs are numbered from 5′ to 3′ and are shown in bold. The poly(A) signal, AATAAA, is underlined. See Figure 4A for the illustrated version. (B) Illustrations showing the design of wildtype (L3-WT) and mutant (L3-MU) L3 PAS reporters. (C) Western blots showing CPSF6 protein expression in wildtype (WT) and CPSF6-KO (CKO) 293T cells. Tubulin: loading control. (D) Sanger sequencing results from a 3′ RACE experiment in 293T cells showing the actual cleavage site (indicated by arrowheads) used in the TRIM9-S WT PAS reporter. Also see (A) for the endogenous cleavage site of TRIM9-S. (E) Genomic sequence alignment showing the evolutionary conservation of the Trim9-S/TRIM9-S twin UGUA motif. Alignment is generated using UCSC Genome Browser with human (hg38) as the base genome.
-
Figure 4—figure supplement 1—source data 1
Figure 4—figure supplement 1C, uncropped western blot images.
- https://cdn.elifesciences.org/articles/85036/elife-85036-fig4-figsupp1-data1-v1.zip
Figure 5 with 1 supplement
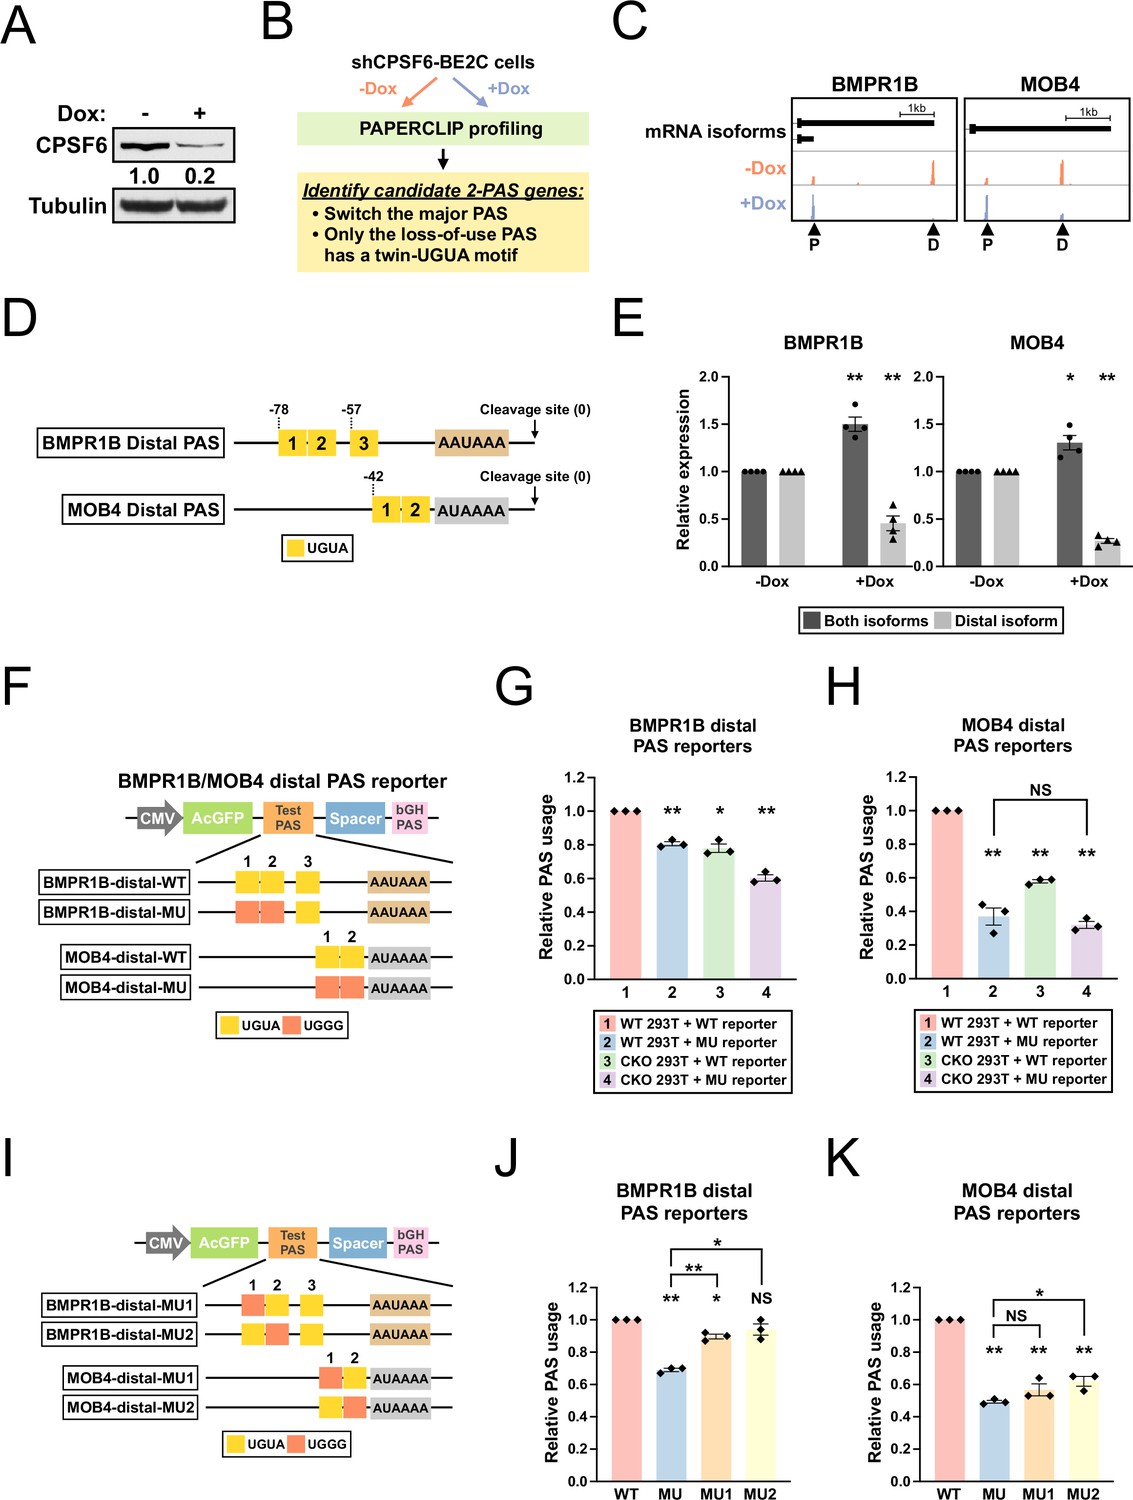
BMPR1B and MOB4 distal PASs are two CPSF6-dependent PASs with a functional twin UGUA motif.
(A) Western blots showing CPSF6 protein expression in shCPSF6-BE2C cells with and without doxycycline treatment for 72 hr. Tubulin: loading control. (B) Illustrations showing the experimental strategy to identify candidate genes harboring a functional twin UGUA motif. (C) GENCODE annotations and PAPERCLIP results (merged from two biological replicates) in shCPSF6-BE2C cells for BMPR1B and MOB4. Arrowheads: poly(A) sites identified by PAPERCLIP. P, proximal; D, distal. (D) Illustrations showing human BMPR1B and MOB4 distal PASs, including locations of the UGUA motifs (shown as yellow boxes numbered from 5′ to 3′). The twin UGUA motif is indicated by yellow boxes 1 and 2. AAUAAA, the poly(A) signal. AUAAAA, a putative non-canonical poly(A) signal. See Figure 5—figure supplement 1B for the nucleotide sequences. (E) Bar graphs showing the expression of BMPR1B and MOB4 mRNA isoforms measured by RT-qPCR in shCPSF6-BE2C cells with (+Dox) and without (-Dox) doxycycline treatment for 72 hr from four independent experiments (n = 4). (F) Illustrations showing the design of BMPR1B and MOB4 distal PAS reporters. (G, H) Bar graphs showing usage of BMPR1B distal PAS (G) or MOB4 distal PAS (H) in different combinations of 293T cells (WT and CKO) and reporters (WT and MU) from three independent experiments (n = 3). (I) Illustrations showing the design of additional BMPR1B and MOB4 distal PAS reporters. (J, K) Bar graphs showing usage of different BMPR1B distal PAS reporters (J) or MOB4 distal PAS reporters (K) in 293T cells from three independent experiments (n = 3). Different colors represent distinct PAS reporters. All measurements for the PAS reporter assays were performed 24 hr after transfection. Error bars indicate SEM. Statistical significance is determined by two-tailed t-test. NS, not significant, *p<0.05, **p<0.01.
-
Figure 5—source data 1
Figure 5A, uncropped western blot images.
- https://cdn.elifesciences.org/articles/85036/elife-85036-fig5-data1-v1.zip
Figure 5—figure supplement 1
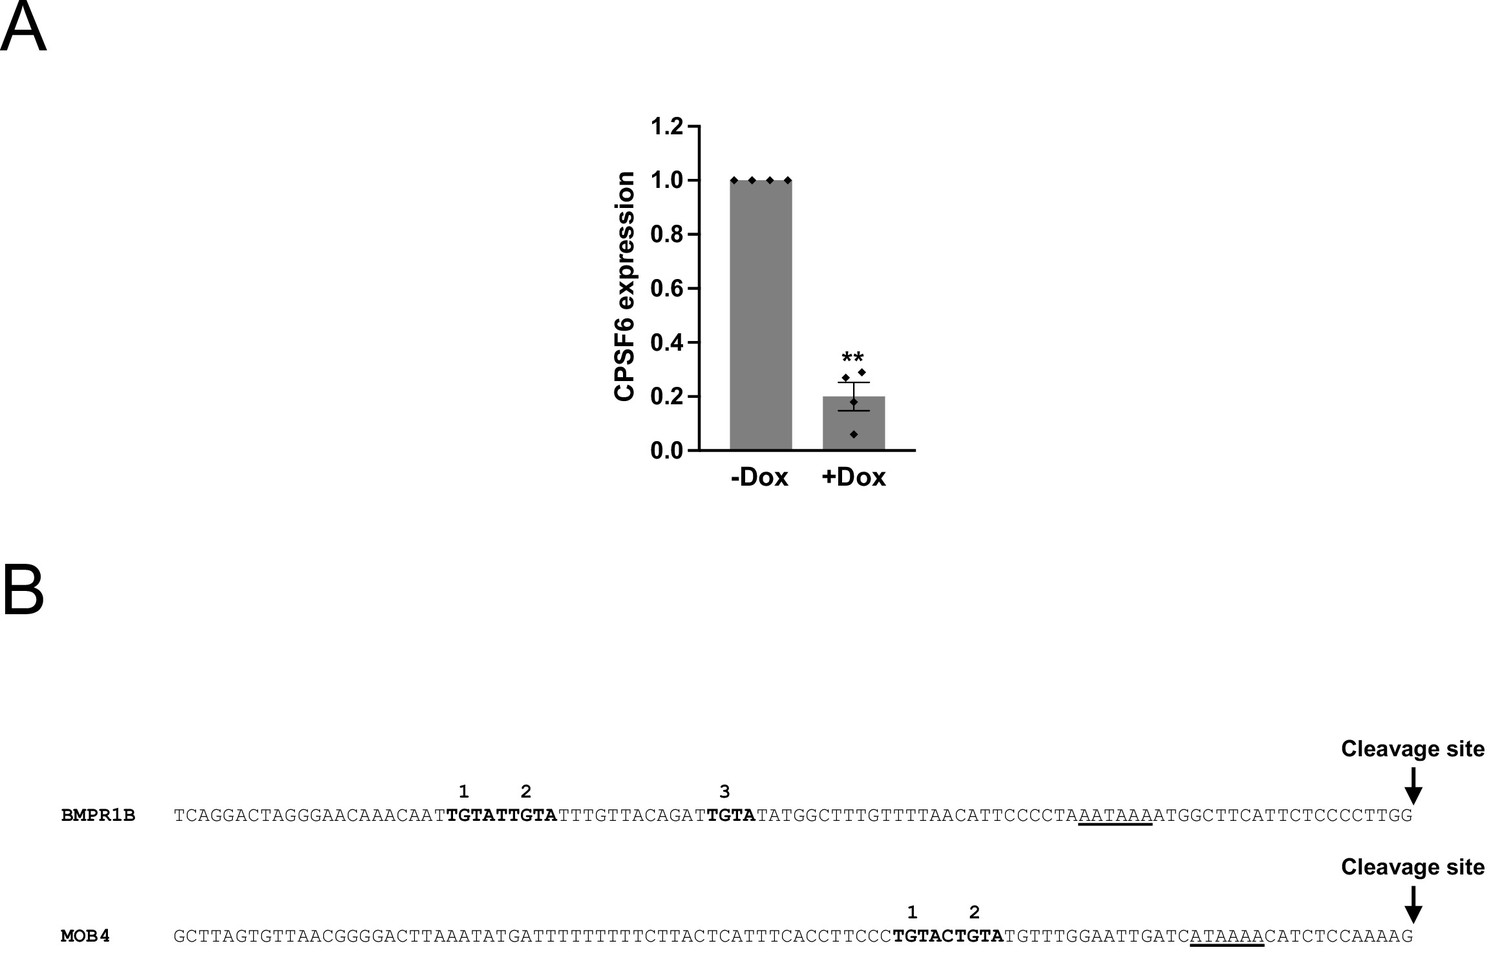
Characterization of shCPSF6-BE2C cells and the genomic sequence of BMPR1B and MOB4 distal PASs.
(A) Bar graphs showing CPSF6 mRNA expression measured by RT-qPCR in shCPSF6-BE2C cells with (+Dox) and without (-Dox) 1 μg/mL doxycycline treatment for 72 hr from three independent experiments (n = 3). Error bars indicate SEM. Statistical significance is determined by two-tailed t-test. **p<0.01. (B) Genomic sequence (0~100 bp; 0 = cleavage site) of human BMPR1B and MOB4 distal PASs. TGTA motifs are numbered from 5′ to 3′ and are shown in bold. The poly(A) signal, AATAAA, and a putative non-canonical poly(A) signal, ATAAAA, are underlined. See Figure 5D for the illustrated version.
Figure 6 with 1 supplement
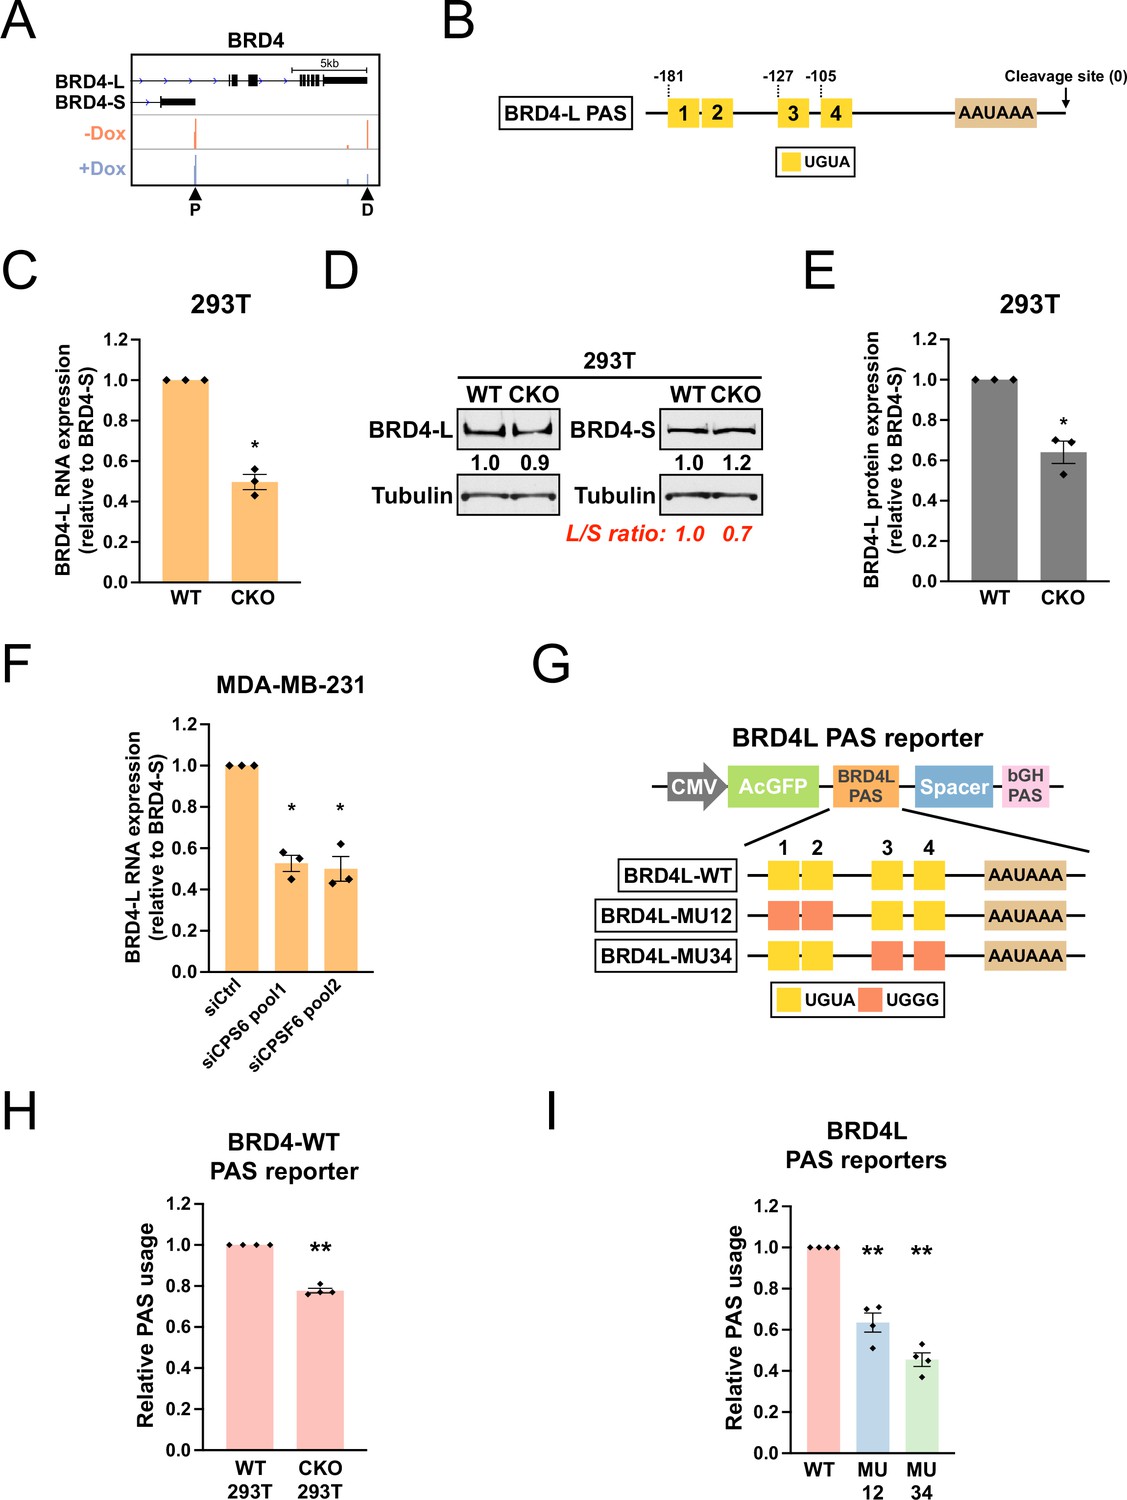
CPSF6 promotes expression of BRD4-L, which has a functional twin UGUA motif in the PAS.
(A) GENCODE annotations and PAPERCLIP results (merged from two biological replicates) in shCPSF6-BE2C cells for BRD4. Arrowheads: poly(A) sites identified by PAPERCLIP. P, proximal; D, distal. (B) Illustrations showing human BRD4-L PAS, including locations of the UGUA motifs (shown as yellow boxes numbered from 5′ to 3′). The twin UGUA motif is indicated by yellow boxes 1 and 2. AAUAAA, the poly(A) signal. See Figure 6—figure supplement 1A for the nucleotide sequence. (C) Bar graphs showing the expression of BRD4-L mRNA relative to BRD4-S mRNA measured by RT-qPCR in wildtype 293T (WT) and CKO cells from three independent experiments (n = 3). BRD4-L expression was first normalized to BRD4-S expression and then normalized to the expression level in WT. (D) Western blots showing the expression of BRD4 protein isoforms in 293T and CKO cells. Tubulin: loading control. (E) Bar graphs showing the relative expression of BRD4-L protein to BRD4-S protein measured by western blotting in 293T and CKO cells from three independent experiments (n = 3). BRD4-L protein expression was first normalized to BRD4-S protein expression and then normalized to the expression level in WT. (F) Bar graphs showing the expression of BRD4-L mRNA relative to BRD4-S mRNA measured by RT-qPCR in MDA-MB-231 cells transfected with different siRNAs for 72 hr from three independent experiments (n = 3). siCtrl: control siRNA. BRD4-L expression was first normalized to BRD4-S expression and then normalized to the expression level in the siCtrl group. (G) Illustrations showing the design of BRD4-L PAS reporters. (H) Bar graphs showing usage of BRD4-L wildtype PAS in both 293T and CKO cells from four independent experiments (n = 4). (I) Bar graphs showing usage of different BRD4-L PAS reporters in 293T cells from four independent experiments (n = 4). Different colors represent distinct PAS reporters. All measurements for the PAS reporter assays were performed 24 hr after transfection. Error bars indicate SEM. Statistical significance is determined by two-tailed t-test. *p<0.05, **p<0.01.
-
Figure 6—source data 1
Figure 6D, uncropped western blot images.
- https://cdn.elifesciences.org/articles/85036/elife-85036-fig6-data1-v1.zip
Figure 6—figure supplement 1
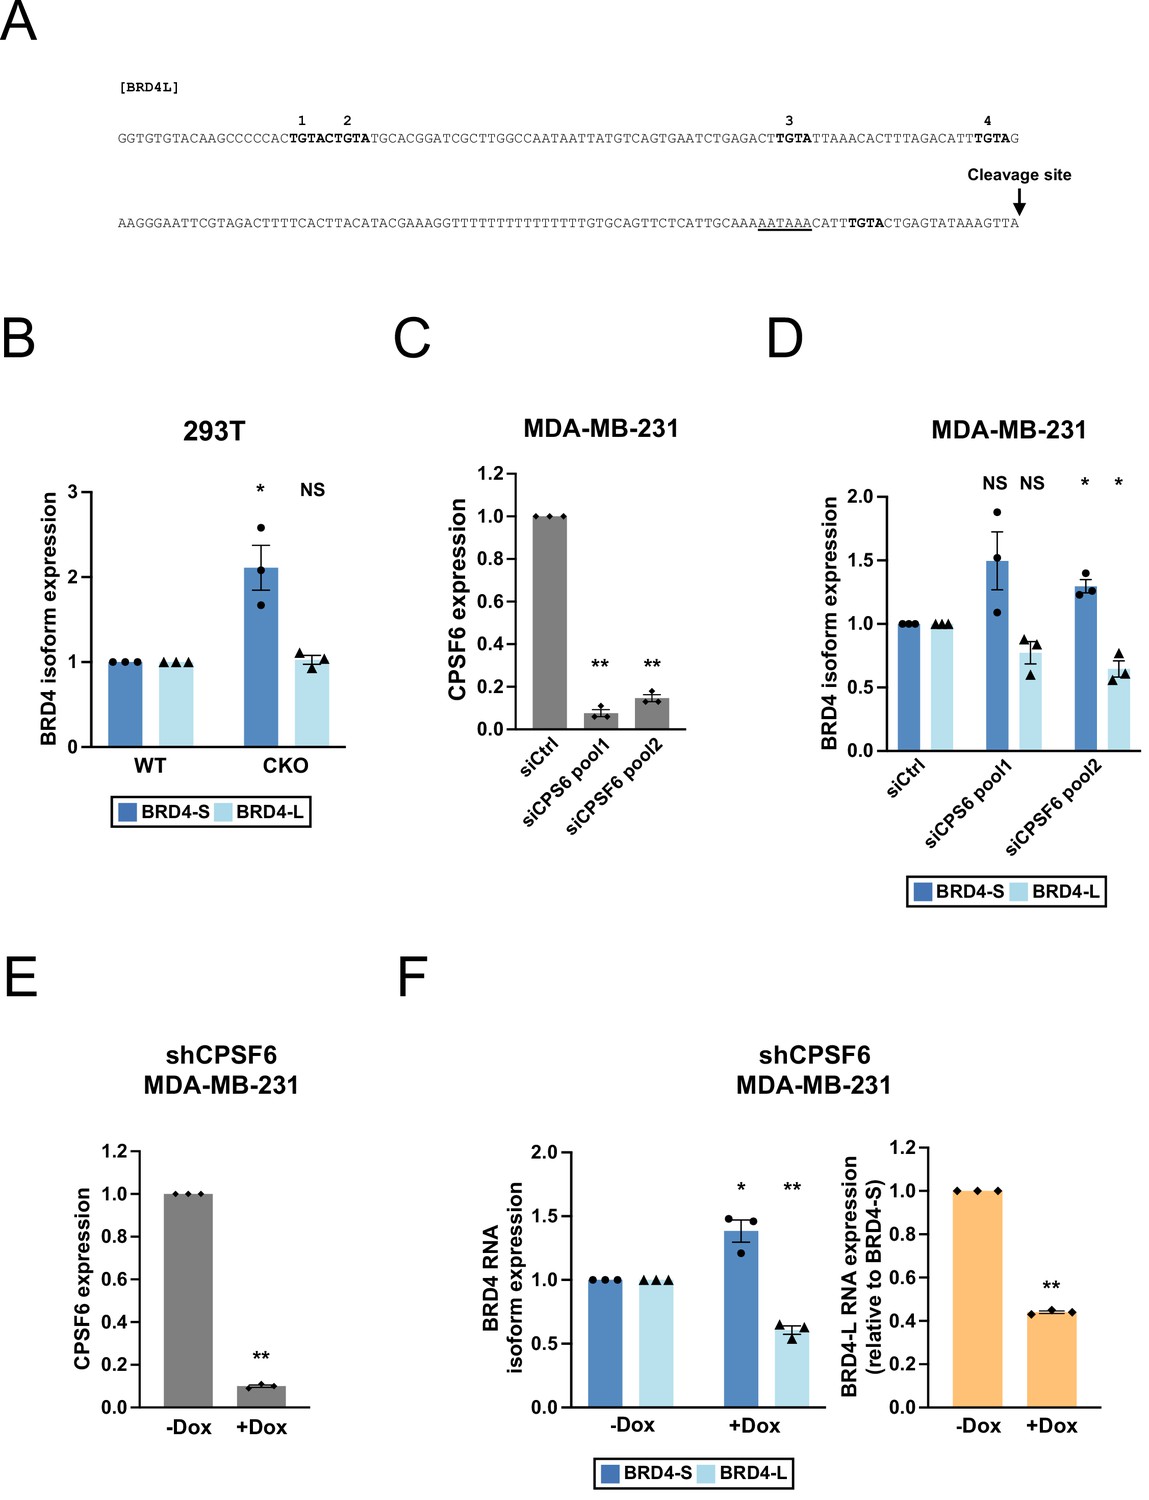
CPSF6 knockdown and BRD4 isoform expression in MDA-MB-231 cells.
(A) Genomic sequence (0–200 bp; 0 = cleavage site) of human BRD4-L PAS. TGTA motifs are shown in bold. The three TGTA motifs preceding the poly(A) signal are numbered from 5′ to 3′. The poly(A) signal, AATAAA, is underlined. See Figure 6B for the illustrated version. (B) Bar graphs showing the expression of two BRD4 mRNA isoforms relative to the endogenous control measured by RT-qPCR in wildtype 293T (WT) and CKO cells in the same experiments shown in Figure 6C (n = 3). BRD4 isoform expression was first normalized to ACTB expression and then normalized to the expression level in WT. (C) Bar graphs showing the knockdown efficiency of CPSF6 siRNAs measured by RT-qPCR 72 hr after transfection in MDA-MB-231 cells in the same experiments shown in Figure 6F (n = 3). (D) Bar graphs showing the expression of two BRD4 mRNA isoforms relative to the endogenous control measured by RT-qPCR in MDA-MB-231 cells transfected with different siRNAs for 72 hr in the same experiments shown in Figure 6F (n = 3). siCtrl: control siRNA. BRD4 isoform expression was first normalized to ACTB expression and then normalized to the expression level in the siCtrl group. (E) Bar graphs showing CPSF6 mRNA expression measured by RT-qPCR in shCPSF6-MDA-MB-231 cells with (+Dox) and without (-Dox) doxycycline treatment for 72 hr from three independent experiments (n = 3). Dox: 1 μg/mL doxycycline. (F) Bar graphs showing the expression of two BRD4 mRNA isoforms relative to the endogenous control (left panel) and the expression of BRD4-L mRNA relative to BRD4-S mRNA (right panel) measured by RT-qPCR in shCPSF6-MDA-MB-231 cells with (+Dox) and without (-Dox) doxycycline treatment for 72 hr in the same experiments shown in (E) (n = 3). In the left panel, individual BRD4 mRNA isoform expression was first normalized to ACTB expression and then normalized to the expression level in the -Dox group. In the right panel, BRD4-L expression was first normalized to BRD4-S expression and then normalized to the expression level in the -Dox group. Error bars indicate SEM. Statistical significance is determined by two-tailed t-test. NS, not significant, *p<0.05, **p<0.01.
Figure 7 with 1 supplement

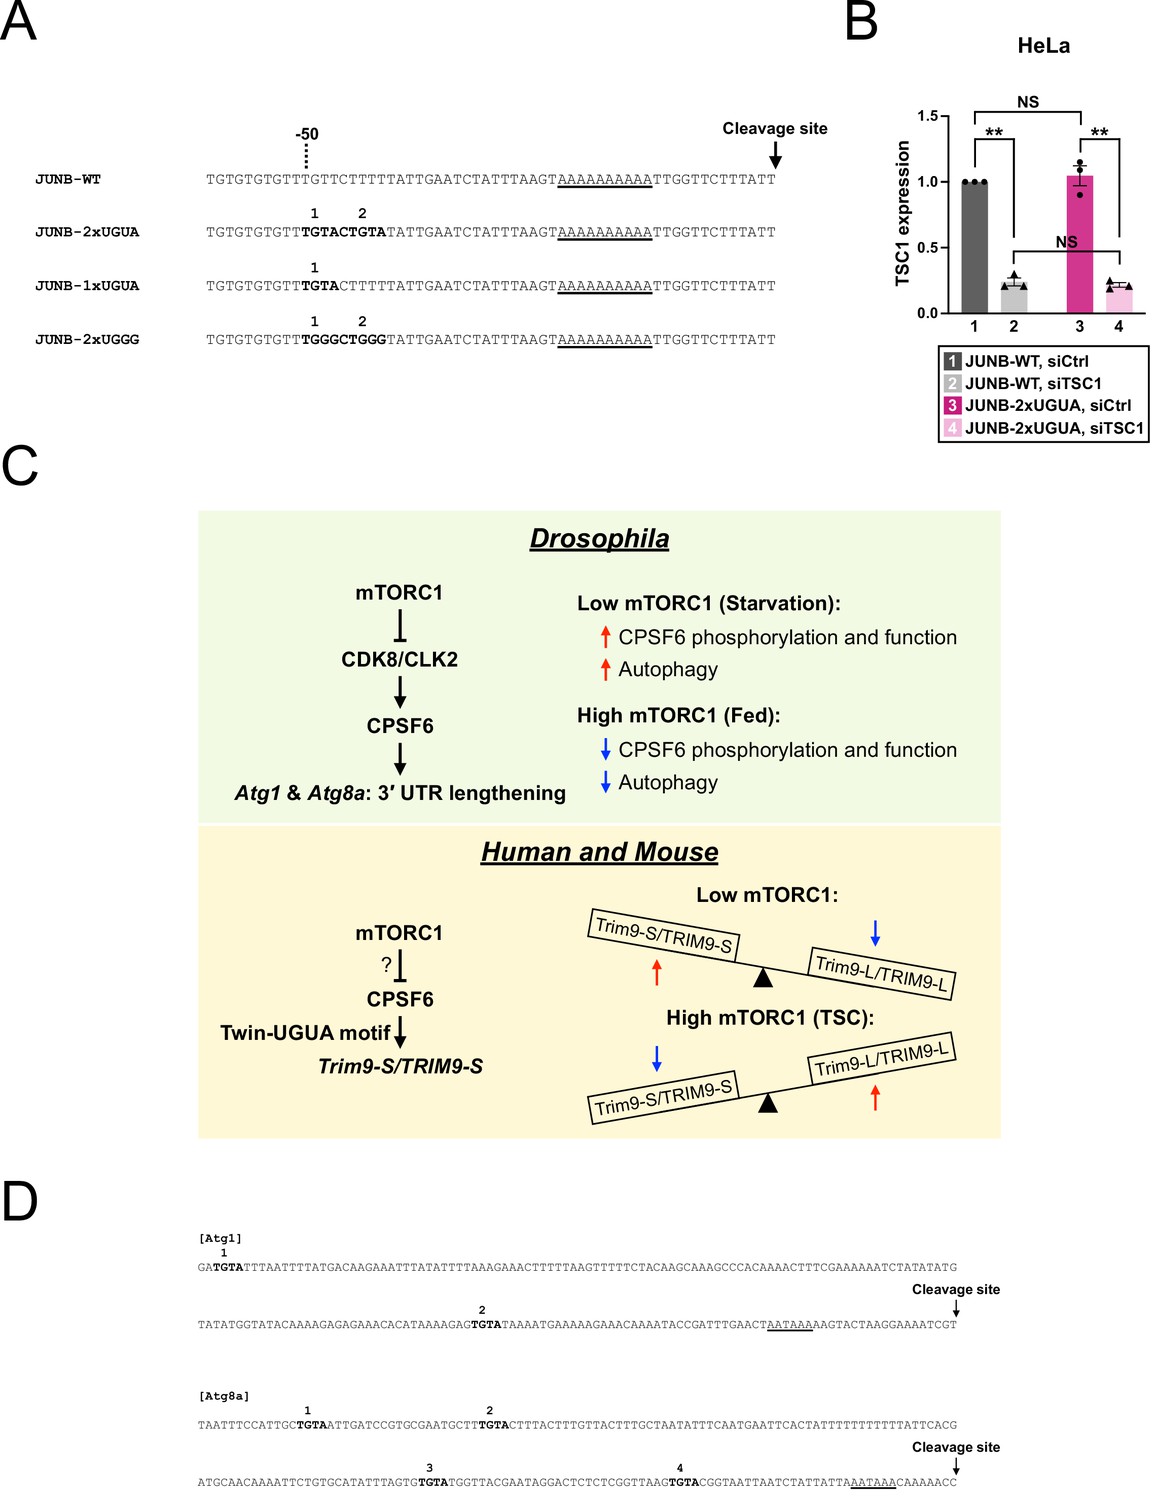
Insertion of a twin UGUA motif into the JUNB PAS is sufficient to confer regulation by CPSF6 and mTORC1.
(A) Illustrations showing the design of JUNB PAS reporters. See Figure 7—figure supplement 1A for the nucleotide sequence. (B) Bar graphs showing usage of different JUNB PAS reporters (WT, 2xUGUA, 1xUGUA, and 2xUGGG) in 293T or CKO cells 24 hr after transfection from three independent experiments (n = 3). (C) Illustrations showing the experimental design for the JUNB PAS reporter assay in HeLa cells. (D) Bar graphs showing usage of JUNB-WT and JUNB-2xUGUA PAS reporters in HeLa cells with normal (siCtrl) or hyperactive (siTSC1) mTORC1 from three independent experiments (n = 3). Error bars indicate SEM. Statistical significance is determined by two-tailed t-test. NS, not significant, *p<0.05, **p<0.01.
Figure 7—figure supplement 1
Nucleotide sequences of wildtype and modified JUNB PASs for the reporter assay.
(A) Nucleotide sequences of wildtype and modified human JUNB PAS. TGTA and TGGG motifs are numbered from 5′ to 3′ and are shown in bold. An adenine-rich element containing the putative non-canonical poly(A) signal is underlined. See Figure 7A for the illustrated version. (B) Bar graphs showing TSC1 knockdown efficiency measured by RT-qPCR in HeLa cells in the same experiments shown in Figure 7D (n = 3). All expression levels are relative to group 1 (JUNB-WT reporter, siCtrl transfection). Error bars indicate SEM. Statistical significance is determined by two-tailed t-test. NS, not significant, **p<0.01. (C) Illustrations summarizing (top) the mTORC1 regulation on APA of autophagy genes in Drosophila as reported in Tang et al., 2018 and (bottom) the mTORC1 regulation on Trim9/TRIM9 isoform expression in human and mouse. (D) Genomic sequence (0–200 bp; 0 = cleavage site) of Atg1 and Atg8a PAS in Drosophila melanogaster (Ensembl Release 109). TGTA motifs are shown in bold. The TGTA motifs preceding the poly(A) signal are numbered from 5′ to 3′. The poly(A) signal, AATAAA, is underlined.
Tables
Key resources table
| Reagent type (species) or resource | Designation | Source or reference | Identifiers | Additional information |
|---|---|---|---|---|
| Genetic reagent (Mus musculus) | C57BL/6J | Jackson Laboratory | Cat#000664; RRID:IMSR_JAX:000664 | |
| Genetic reagent (M. musculus) | Tsc1tm1Djk/J | Jackson Laboratory | Cat#005680; RRID:IMSR_JAX:005680 | |
| Genetic reagent (M. musculus) | Camk2a-Cre | Jackson Laboratory | Cat#005359; RRID:IMSR_JAX:005359 | |
| Genetic reagent (M. musculus) | cTag-PABP | PMID:28910620 | MGI:6116824 | MGI symbol: Pabpc1tm1.2Rbd |
| Cell line (M. musculus) | Neuro-2a | ATCC | Cat#CCL-131; RRID:CVCL_0470 | |
| Cell line (Homo sapiens) | HEK293T/17 | ATCC | Cat#CRL-11268; RRID:CVCL_1926 | |
| Cell line (H. sapiens) | MDA-MB-231 | ATCC | Cat#HTB-26; RRID:CVCL_0062 | |
| Cell line (H. sapiens) | BE2C | ATCC | Cat#CRL-2268 | |
| Cell line (H. sapiens) | CKO HEK293T | PMID:26858452 | ||
| Cell line (H. sapiens) | shCPSF6-BE2C | This paper | Figure 5A | |
| Cell line (H. sapiens) | shCPSF6-MDA-MB-231 | This paper | Figure 6—figure supplement 1F | |
| Antibody | Anti-beta actin (mouse monoclonal) | ProteinTech | Cat#66009-1-Ig; RRID:AB_2687938 | 1:10000 |
| Antibody | Anti-alpha tubulin (mouse monoclonal) | Millipore | Cat#CP06; RRID:AB_2617116 | 1:3000 |
| Antibody | Anti-TRIM9 (rabbit polyclonal) | ProteinTech | Cat#10786-1-AP; RRID:AB_2209130 | 1:2000 |
| Antibody | Anti-S6, clone 5G10 (rabbit monoclonal) | Cell Signaling Technology | Cat#2217; RRID:AB_331355 | 1:2000 |
| Antibody | Anti-Phospho-S6 (Ser240/244) (rabbit monoclonal) | Cell Signaling Technology | Cat#5364; RRID:AB_10694233 | 1:2000 |
| Antibody | Anti-CPSF6 (rabbit polyclonal) | Bethyl Laboratories | Cat#A301-356A; RRID:AB_937781 | 1:2000 |
| Antibody | Anti-BRD4 (rabbit polyclonal) | Bethyl Laboratories | Cat#A301-985A; RRID:AB_1576498 | 1:10000 |
| Antibody | Anti-BRD4 (rabbit monoclonal) | Abcam | Cat#ab128874; RRID:AB_11145462 | 1:3000 |
| Strain, strain background | NEB 5-alpha | New England Biolabs | Cat#C2987 | |
| Strain, strain background | NEB Stable | New England Biolabs | Cat#C3040 | |
| Commercial assay or kit | ProtoScript II First Strand cDNA Synthesis Kit | New England Biolabs | Cat#E6560 | |
| Commercial assay or kit | Q5 Site-Directed Mutagenesis Kit | New England Biolabs | Cat#E0554 | |
| Commercial assay or kit | NEB PCR Cloning Kit | New England Biolabs | Cat#E1202 | |
| Commercial assay or kit | 10% Bis-Tris NuPAGE gels | Invitrogen | Cat#NP0301BOX | |
| Commercial assay or kit | 3~8% Tris-Acetate NuPAGE gels | Invitrogen | Cat#EA0375BOX | |
| Commercial assay or kit | DNase I | Invitrogen | Cat#18068015 | |
| Commercial assay or kit | Trizol reagent | Invitrogen | Cat#15596018 | |
| Commercial assay or kit | PerfeCTa SYBR Green SuperMix | QuantaBio | Cat#95054–500 | |
| Chemical compound, drug | DMSO | Sigma | Cat#D2650 | |
| Chemical compound, drug | Torin-1 | Cayman Chemical | Cat#10997 | |
| Chemical compound, drug | DharmaFECT1 | Horizon Discovery | Cat#T-2001-02 | |
| Chemical compound, drug | DharmaFECT2 | Horizon Discovery | Cat#T-2002-02 | |
| Chemical compound, drug | X-tremeGENE 9 | Sigma | Cat#XTG9-RO | |
| Sequence-based reagent | Supplementary file 4 | This paper | Primers used | |
| Sequence-based reagent | Supplementary file 5 | This paper | siRNAs used | |
| Recombinant DNA reagent | Supplementary file 6 | Addgene or this paper | Plasmids used or generated | |
| Software, algorithm | CIMS package | PMID:24407355 | ||
| Software, algorithm | Kallisto | PMID:27043002 | ||
| Software, algorithm | Prism 9.5 | GraphPad Software | https://www.graphpad.com/; RRID:SCR_002798 |
Additional files
-
Supplementary file 1
Gene lists from cTag-PAPERCLIP profiling in Tsc1-WT/KO mice.
- https://cdn.elifesciences.org/articles/85036/elife-85036-supp1-v1.xlsx
-
Supplementary file 2
Gene lists from PAPERCLIP profiling in shCPSF6-BE2C cells.
- https://cdn.elifesciences.org/articles/85036/elife-85036-supp2-v1.xlsx
-
Supplementary file 3
Identified human genes with twin-UGUA motif-containing PAS.
- https://cdn.elifesciences.org/articles/85036/elife-85036-supp3-v1.xlsx
-
Supplementary file 4
List of oligonucleotides and primers.
- https://cdn.elifesciences.org/articles/85036/elife-85036-supp4-v1.xlsx
-
Supplementary file 5
List of siRNAs.
- https://cdn.elifesciences.org/articles/85036/elife-85036-supp5-v1.xlsx
-
Supplementary file 6
List of plasmids.
- https://cdn.elifesciences.org/articles/85036/elife-85036-supp6-v1.xlsx
-
MDAR checklist
- https://cdn.elifesciences.org/articles/85036/elife-85036-mdarchecklist1-v1.docx
Download links
A two-part list of links to download the article, or parts of the article, in various formats.
Downloads (link to download the article as PDF)
Open citations (links to open the citations from this article in various online reference manager services)
Cite this article (links to download the citations from this article in formats compatible with various reference manager tools)
A twin UGUA motif directs the balance between gene isoforms through CFIm and the mTORC1 signaling pathway
eLife 12:e85036.
https://doi.org/10.7554/eLife.85036


