Cell-cell interaction determines cell fate of mesoderm-derived cell in tongue development through Hh signaling
- Division of Oral Anatomy, Faculty of Dentistry & Graduate School of Medical and Dental Sciences, Niigata University, Japan
- Center for Advanced Oral Science, Faculty of Dentistry & Graduate School of Medical and Dental Sciences, Niigata University, Japan
- Division of Orthodontics, Faculty of Dentistry & Graduate School of Medical and Dental Sciences, Niigata University, Japan
- Division of Oral Pathology, Faculty of Dentistry & Graduate School of Medical and Dental Sciences, Niigata University, Japan
- Division of Dental Pharmacology, Faculty of Dentistry & Graduate School of Medical and Dental Sciences, Niigata University, Japan
- Centre for Craniofacial & Regenerative Biology, Faculty of Dentistry, Oral & Craniofacial Sciences, King’s College London, Guy’s Hospital, United Kingdom
- Service de Chirurgie Maxillofaciale et tomatology, Centre Hospitalier Universitaire de Nantes,1 place Alexis Ricordeau 44000, France
- Telethon Institute of Genetics and Medicine (TIGEM), Pozzuoli, Italy
- Medical Genetics, Department of Translational Medical Sciences, Federico II University of Naples, Italy, Italy
- Scuola Superiore Meridionale, School for Advanced Studies, Genomics and Experimental Medicine program,, Italy
Figures
Figure 1 with 3 supplements
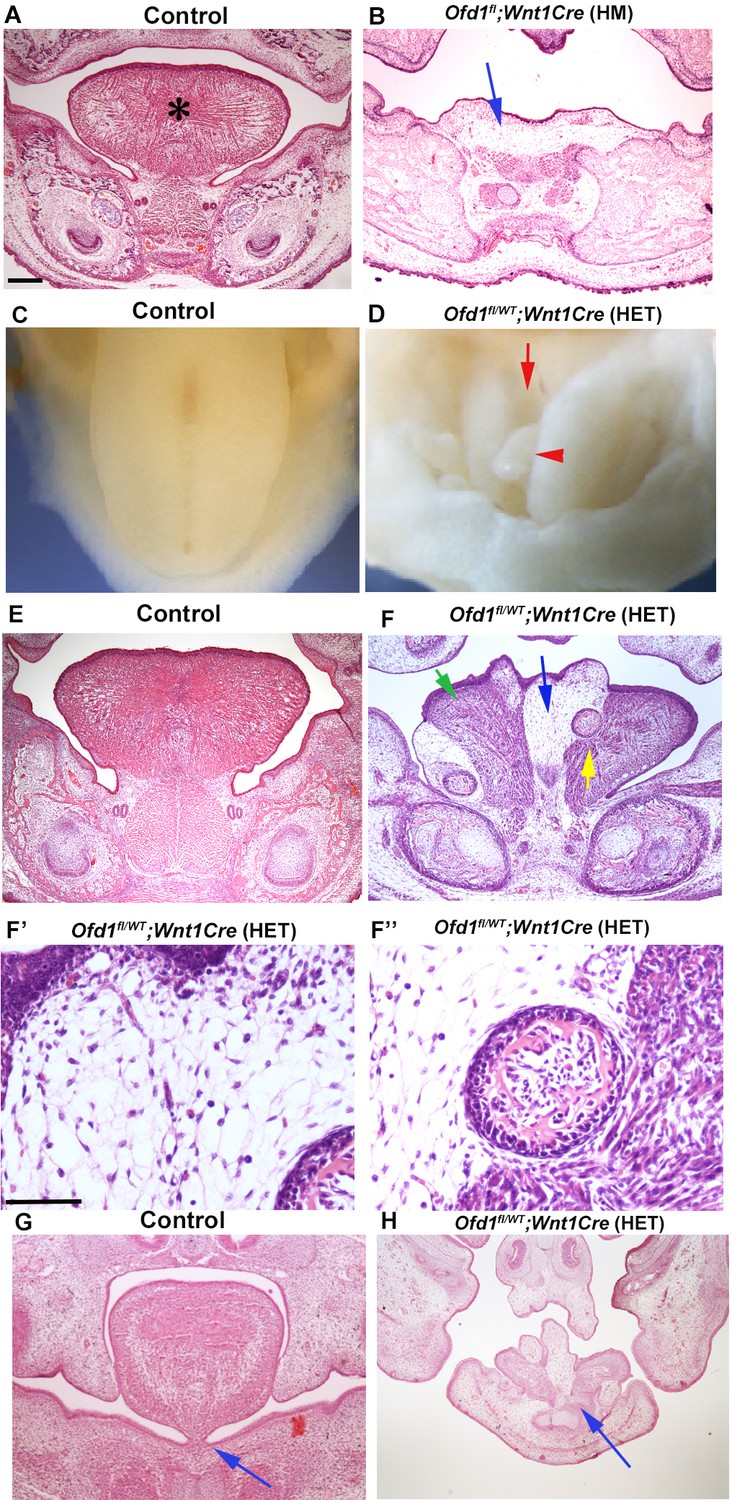
Tongue phenotypes in Ofd1 mutant mice.
(A, B, E–H) Frontal sections showing histological images in wild-type (A, E, G), Ofd1fl;Wnt1Cre(HM) (B) and Ofd1fl/WT;Wnt1Cre(HET) (F–F’’, H) at embryonic day (E) 18.5. Arrow indicating sparse tissue (B). *: tongue (A). Green, blue, and yellow arrows indicating normal muscle, ectopic sparse tissue, and ectopic bone, respectively (F). F’ and F’’ are high magnification of F indicated by blue and yellow arrow, respectively. Arrows indicating tongue frenum region (G, H). The presence of clefts and multiple protrusions; n=58/58. (C, D) Image showing oral view of tongue in wild-type (C) and Ofd1fl/WT;Wnt1Cre(HET) (D). Arrowhead and arrow indicating ectopic protrusion and cleft, respectively (D). Lack of tongue frenum in Ofd1fl/WT;Wnt1Cre(HET); n=30/58. Scale bars: 200 µm (A, B, E, F, G, H), 100 µm (F', F'').
Figure 1—figure supplement 1
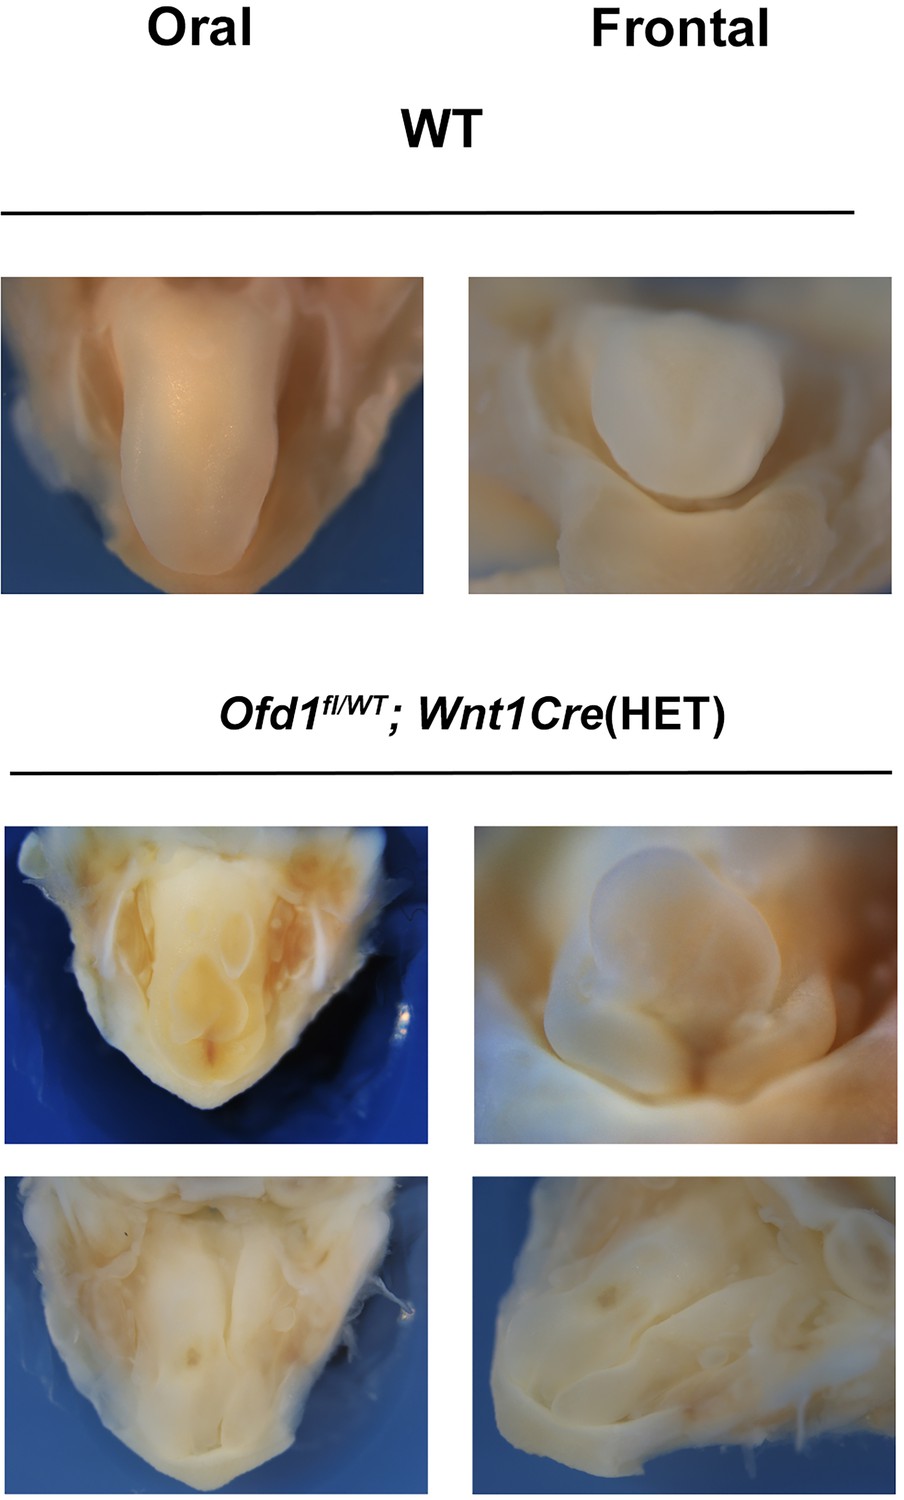
Abnormal shaped tongue in Ofd1fl/WT;Wnt1Cre(HET) mice.
Oral and frontal view of normal tongue in wild-type mice and abnormal shaped tongue in Ofd1fl/WT;Wnt1Cre(HET) mice.
Figure 1—figure supplement 2

Bone in tongue of Ofd1fl/WT;Wnt1Cre(HET) mice.
Frontal sections showing in situ hybridization of Runx2 (A, B) and histology (C, D) in wild-type (A, C) and Ofd1fl/WT;Wnt1Cre(HET) (B, D). Arrow and arrowhead indicating bone region and connection between bone in the tongue and mandibular bone, respectively (B). Arrowheads and arrow indicating Meckel’s cartilage and duplicated mandibular bone, respectively (D). Scale bars: 200 µm (A, B), 100 µm (C, D).
Figure 1—figure supplement 3

Tongue phenotypes in Ofd1fl/WT;Wnt1Cre(HET) mice.
Frontal section showing histological images of tongue in wild-type (A) and Ofd1fl/WT;Wnt1Cre(HET) mice (B) at embryonic day (E) 18.5. Scale bars: 200 µm (A, B).
Figure 2 with 4 supplements
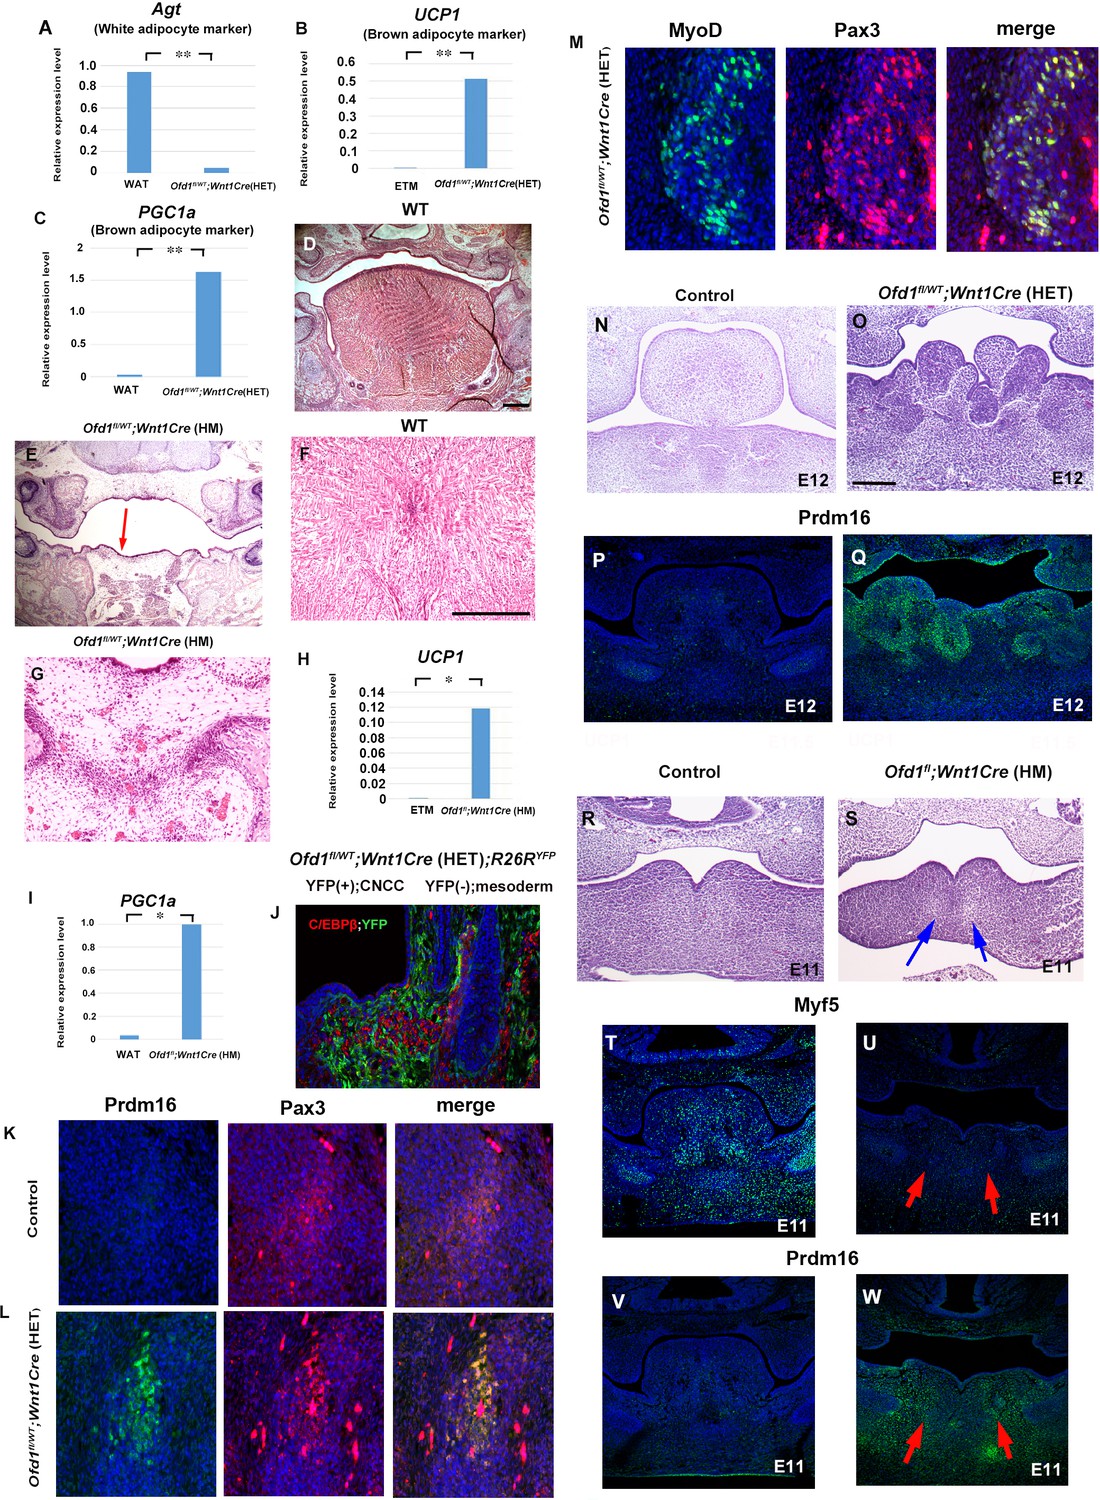
Sparse tissue in Ofd1 mutant tongue.
(A–C) Quantitative PCR (q-PCR) on mRNA isolated from ectopic sparse tissue, white adipose tissue (WAT), and embryonic tongue muscle (ETM). Expression of white adipose maker (Agt) was examined to understand whether the sparse tissue was white adipose maker. Only low-level expression of Agt in the sparse tissue compared with the WAT (A). Expression of brown adipose maker (UCP1 and PGC1a) were examined to understand whether the sparse tissue was brown adipose maker. UCP1 and PGC1a were expressed at high level in the sparse tissue, in comparison with those in the ETM (B) or adult WAT (C). **p<0.01. (D–G) Frontal sections showing histological images in wild-type (D, F) and Ofd1fl;Wnt1Cre(HM) (E, G). F and G are high magnification of D and E (indicated by blue arrow), respectively. (H, I) q-PCR on mRNA isolated from ectopic sparse tissue from Ofd1fl;Wnt1Cre(HM) mice, ETM and WAT. **p<0.01. (J–M) Frontal sections showing double immunohistochemistry of YFP and C/EBPβ in Ofd1fl/WT;Wnt1Cre(HET);R26RYFP (D), Prdm16 and Pax3 in wild-type (K) and Ofd1fl/WT;Wnt1Cre(HET) (L), MyoD and Pax3 in Ofd1fl/WT;Wnt1Cre(HET) (M) at embryonic day (E) 13.5. (N–Q) Frontal sections showing histological images (N, O) and immunohistochemistry of Prdm16 (P, Q) in wild-type (N, P) and Ofd1fl/WT;Wnt1Cre(HET) mice at E12. (R–W) Frontal sections showing histological images (R, S) and immunohistochemistry of MyoD (T, U) and Prdm16 (V, W) in wild-type (R, T, V) and Ofd1fl;Wnt1Cre(HM) (S, U, W) mice at E11. Arrows indicating region showing sparse-like tissues. Scale bars: 200 µm (D, E, N, O, R, S), 100 µm (F, G).
-
Figure 2—source data 1
qPCR; Agt, UCP1 and PGC1a.
- https://cdn.elifesciences.org/articles/85042/elife-85042-fig2-data1-v1.xlsx
Figure 2—figure supplement 1
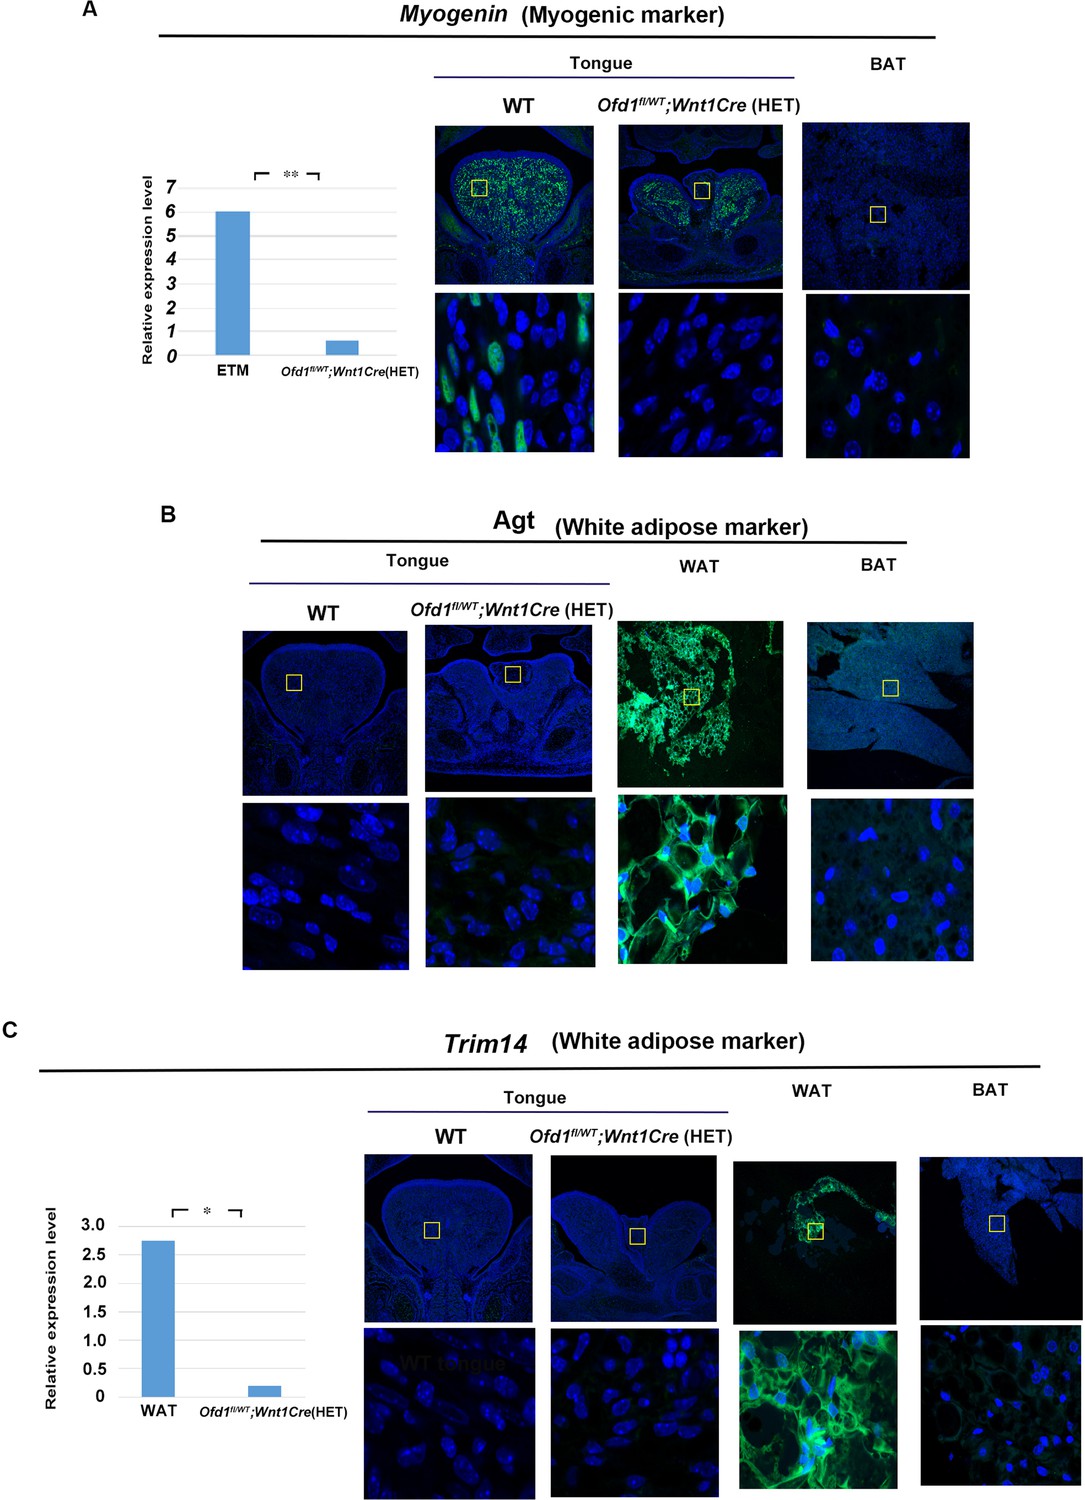
Quantitative PCR (q-PCR) and immunohistochemistry analysis (muscle and white adipose) on Ofd1fl/WT;Wnt1Cre(HET) mice.
(A) Myogenin (myogenic marker) was used to examine whether the sparse tissue was muscle. q-PCR of Myogenin on mRNA isolated from ectopic sparse tissue from Ofd1fl/WT;Wnt1Cre(HET) and embryonic tongue muscle (ETM), and frontal sections showing immunohistochemistry of Myogenin in tongue of wild-type and Ofd1fl/WT;Wnt1Cre(HET) mice, and matured brown adipose tissue (BAT; perirenal fat). Only low-level expression of Myogenin in the sparse tissue compared with the ETM. **p<0.01. Myogenin-positive cells could not be detected in the sparse tissue. (B) Agt (white adipose marker) was used to examine whether the sparse tissue was white adipose tissue (WAT). Frontal sections showing immunohistochemistry of Agt in tongue of wild-type and Ofd1fl/WT;Wnt1Cre(HET) mice, WAT and BAT. Agt-positive cells could not be observed in the sparse tissue. (C) Trim14 (white adipose marker) was used to confirm that the sparse tissue was not WAT. q-PCR of Trim14 on mRNA isolated from ectopic sparse tissue from Ofd1fl/WT;Wnt1Cre(HET) and WAT, and frontal sections showing immunohistochemistry of Trim14 in tongue of wild-type and Ofd1fl/WT;Wnt1Cre(HET) mice, BAT and WAT. Only low-level expression of Trim14 in the sparse tissue compared with the WAT. *p<0.05. Trim14-positive cells could not be observed in the sparse tissue. Lower panels in immunohistochemistry data; high magnification of regions outlined by boxes in upper panels.
-
Figure 2—figure supplement 1—source data 1
qPCR; Myogenin and Trim13.
- https://cdn.elifesciences.org/articles/85042/elife-85042-fig2-figsupp1-data1-v1.xlsx
Figure 2—figure supplement 2
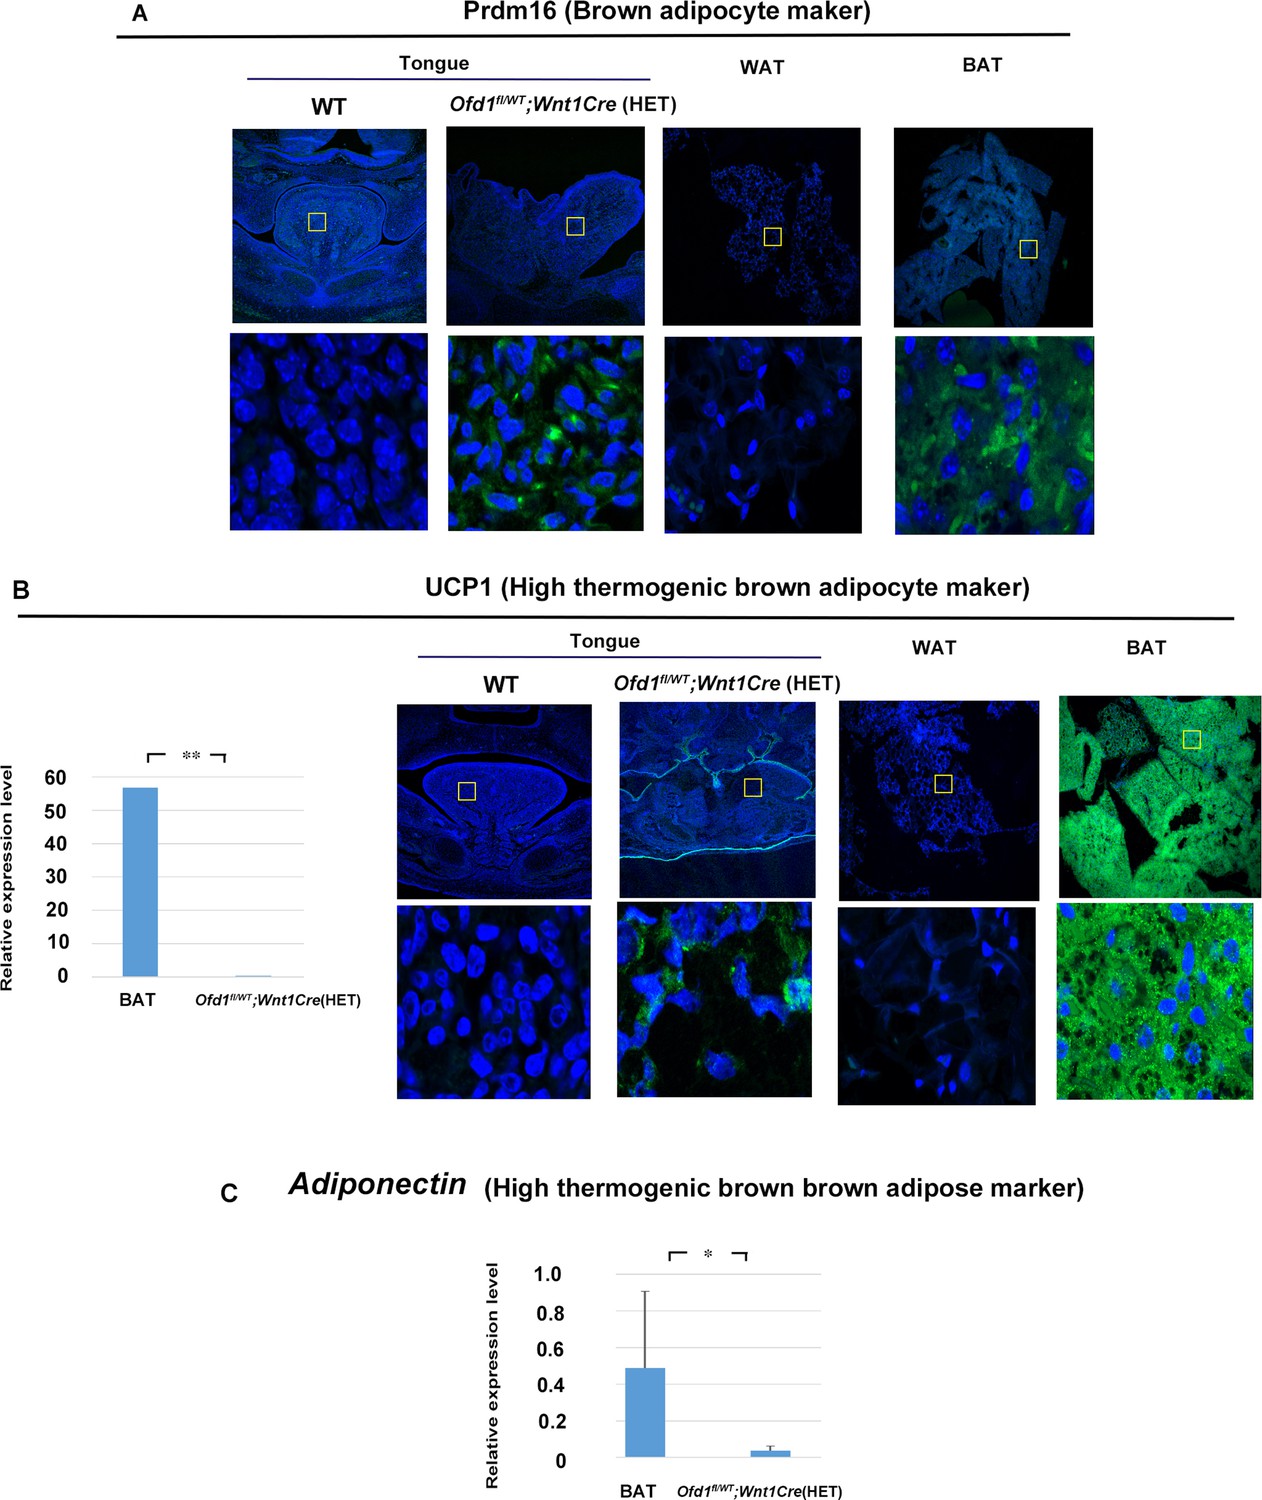
Quantitative PCR (q-PCR) and immunohistochemistry analysis (brown adipose) on Ofd1fl/WT;Wnt1Cre(HET) mice.
(A) Prdm16 (brown adipose marker) was used to examine whether the sparse tissue was brown adipose tissue. Frontal sections showing immunohistochemistry of Prdm16 in tongue of wild-type and Ofd1fl/WT;Wnt1Cre(HET) mice, BAT and WAT. Prdm16-positive cells could not be observed in the sparse tissue. (B) UCP1 (high thermogenic brown adipocyte marker) was used to examine whether the sparse tissue was brown adipose tissue consisting of high thermogenic brown adipocytes. q-PCR of UCP1 on mRNA isolated from ectopic sparse tissue from Ofd1fl/WT;Wnt1Cre(HET) and BAT, and frontal sections showing immunohistochemistry of UCP1 in tongue of wild-type and Ofd1fl/WT;Wnt1Cre(HET) mice, BAT and WAT. Only low-level expression of UCP1 in the sparse tissue compared with the BAT. **p<0.01. A few UCP1-positive cells could be detected in the sparse tissue. (C) Adiponectin (high thermogenic brown adipocyte marker) was used to examine whether the sparse tissue was brown adipose tissue consisting of high thermogenic brown adipocytes. q-PCR of Adiponectin on mRNA isolated from ectopic sparse tissue from Ofd1fl/WT;Wnt1Cre(HET) and BAT. Only low-level expression of UCP1 in the sparse tissue compared with the BAT. **p<0.01.
-
Figure 2—figure supplement 2—source data 1
qPCR; UCP1 and Adiponectin.
- https://cdn.elifesciences.org/articles/85042/elife-85042-fig2-figsupp2-data1-v1.xlsx
Figure 2—figure supplement 3
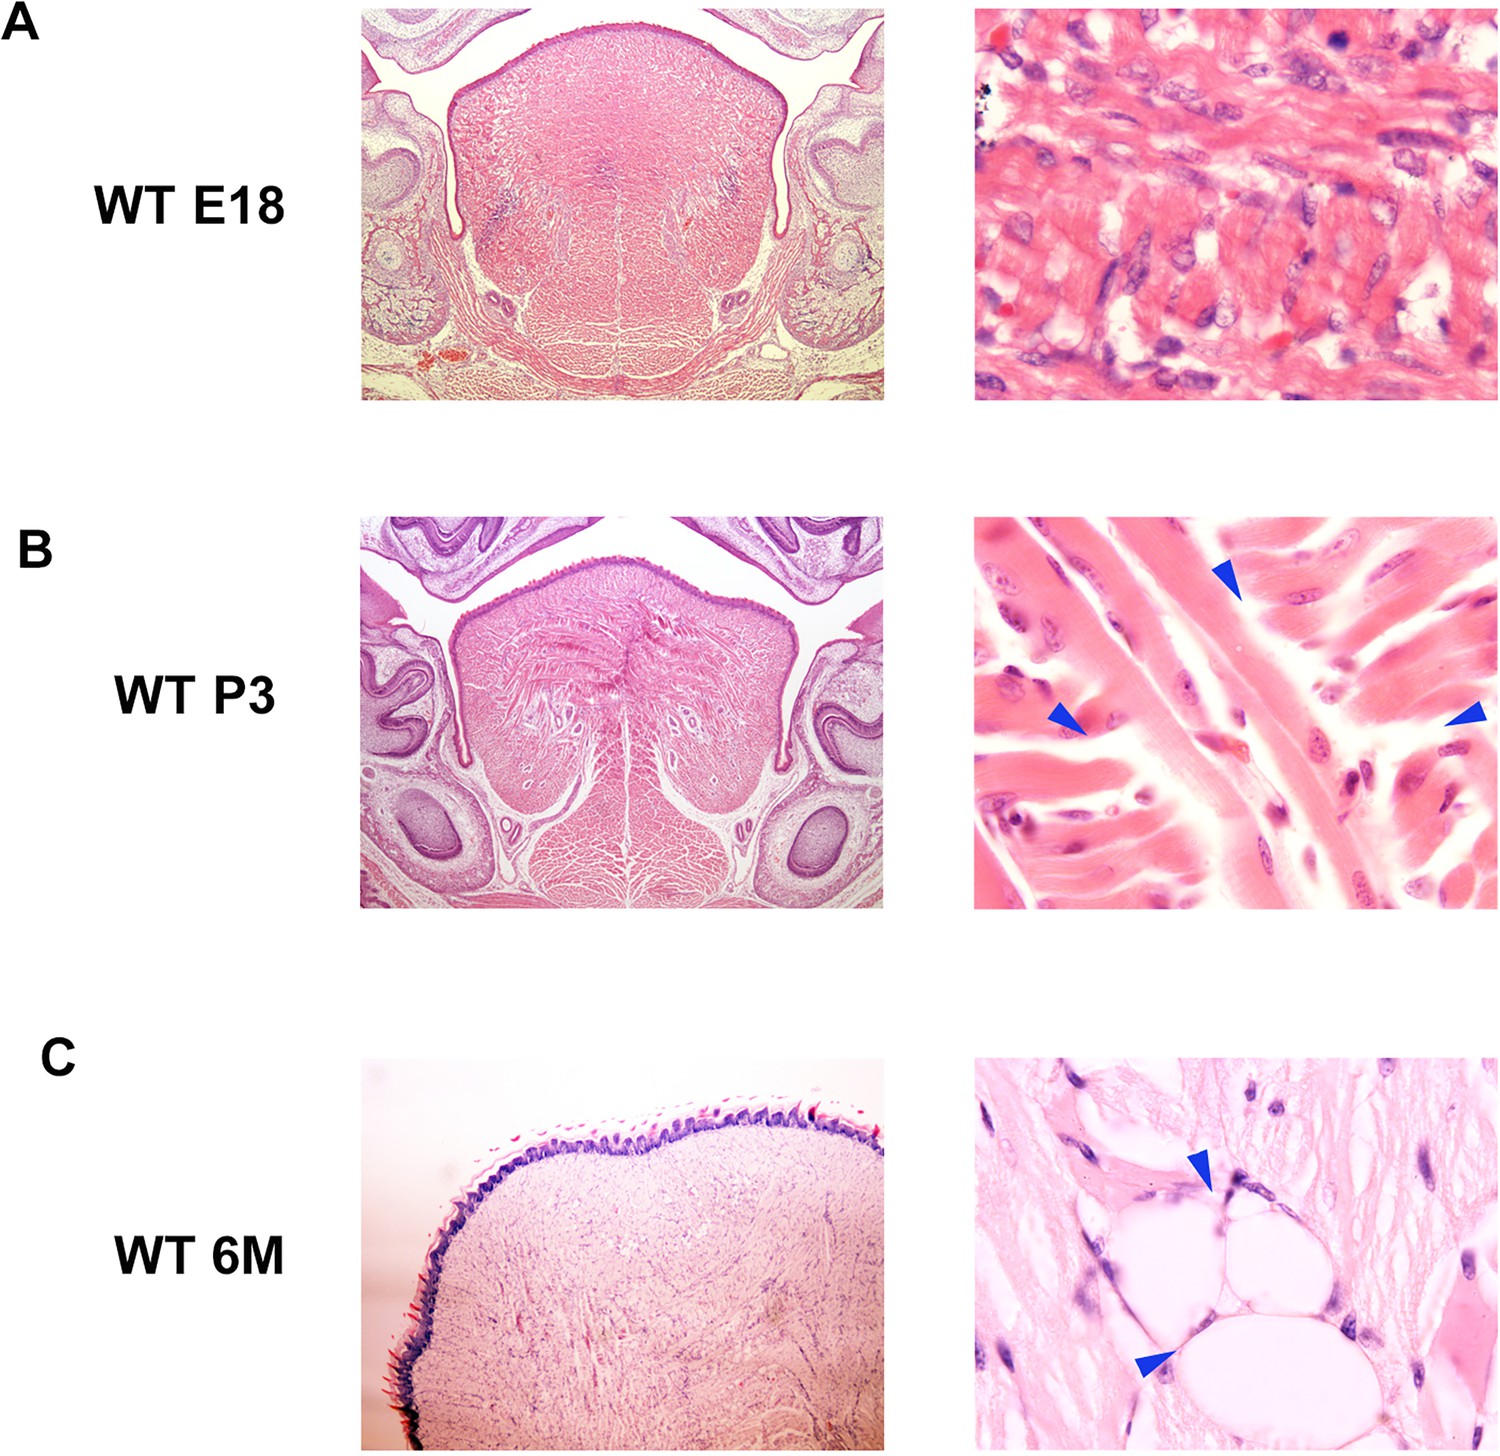
Artifact and adipose tissue in wild-type tongue.
(A, B) Frontal sections showing empty spaces without surrounding cells in the tongue of prenatal (A) and postnatal (B) wild-type mice. Right panels are high magnification of left panels. Arrowheads indicating empty spaces. (C) Frontal sections showing intermuscular adipose in the tongue of 6-month-old wild-type mice. Arrowheads indicating adipocytes. P3, postnatal day 3; 6M, 6-month-old. Mucous salivary glands and their associated-adipose are known to be present in wild-type tongue. However, we could not identify any epithelial cells including glandular bodies or excretory ducts through immunohistochemistry around the sparse tissue. Adipose is also known to be present in the tongue as intermuscular adipose, which is often pathologically enlarged (Colella et al., 2009). However, it is known that the intermuscular adipose in the tongue is related to aging (Vettor et al., 2009; Scarda et al., 2010). In prenatal or postnatal wild-type tongue, empty gaps were found between muscle bundles; however, adipocyte-like cells could not be observed around the gaps (A, B). However, empty gaps surrounded by cells with a thin rim of cytoplasm between muscle bundles were observed in older mice (C). Empty gaps between neighboring muscle fibers found in prenatal or postnatal wild-type tongue should be an artifact, as previously reported (Rother et al., 2002). Thus, the brown adipose tissue found in the Ofd1 mutant tongue was not related to mucous salivary glands associated-adipose or intermuscular adipose.
Figure 2—figure supplement 4
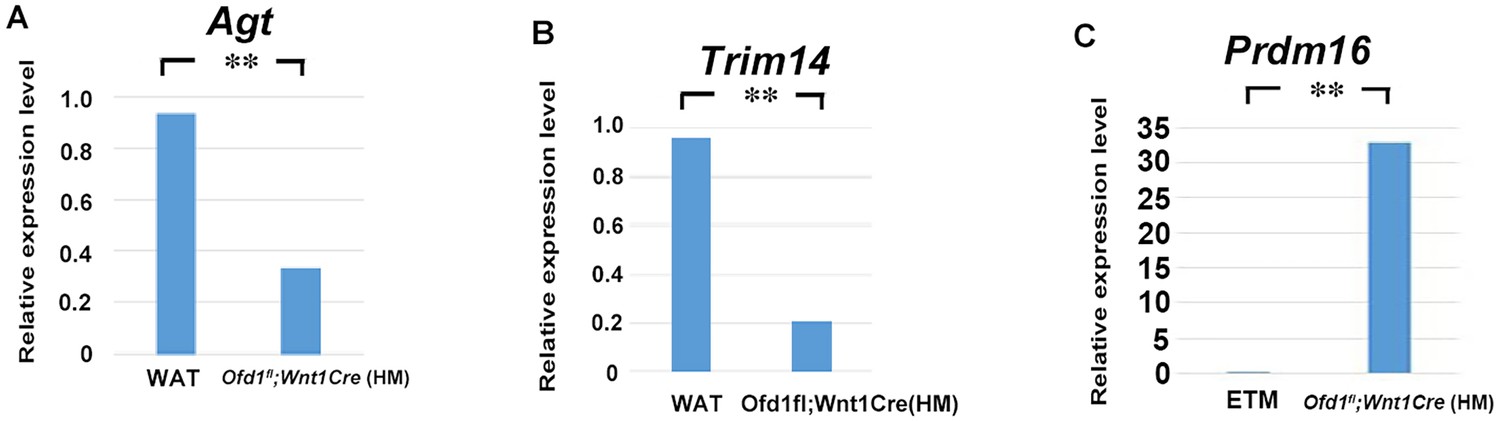
Quantitative PCR (q-PCR) analysis (adipose) on Ofd1fl;Wnt1Cre(HM) mice.
q-PCR on mRNA isolated from ectopic sparse tissue of Ofd1fl;Wnt1Cre(HM), embryonic tongue muscle (ETM), and white adipose tissue (WAT). **p<0.01.
-
Figure 2—figure supplement 4—source data 1
qPCR; Agt, Trim14 and Prdm16.
- https://cdn.elifesciences.org/articles/85042/elife-85042-fig2-figsupp4-data1-v1.xlsx
Figure 3 with 4 supplements
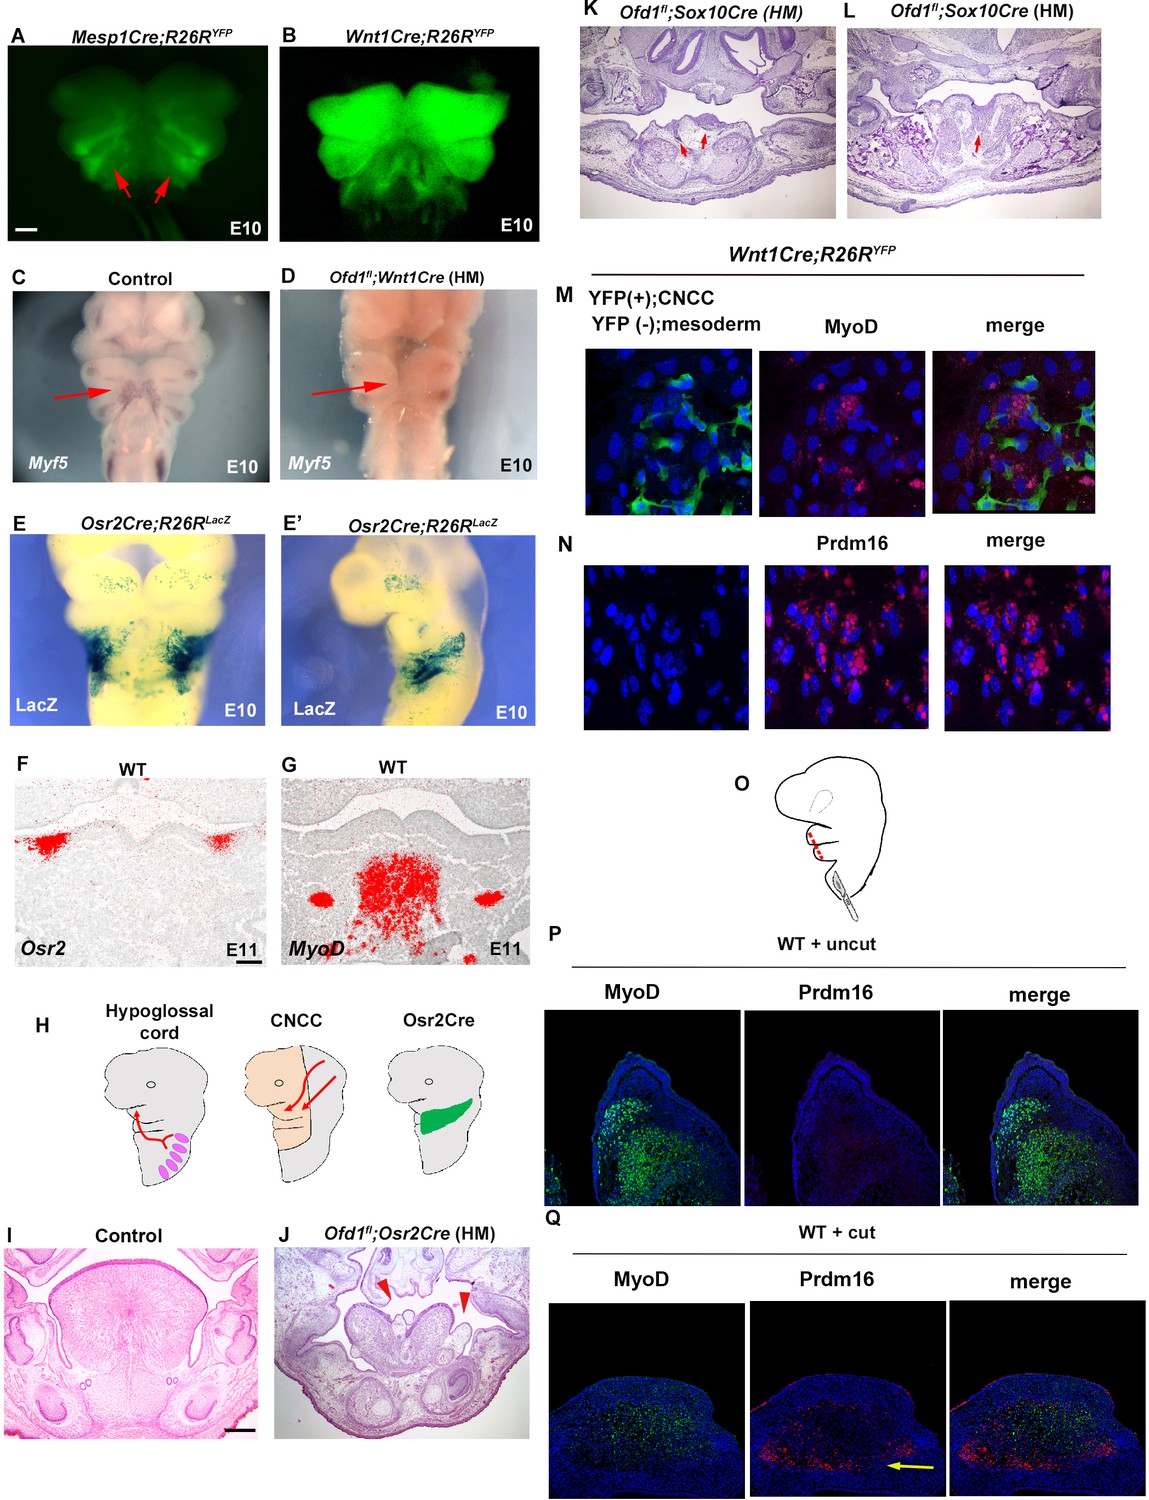
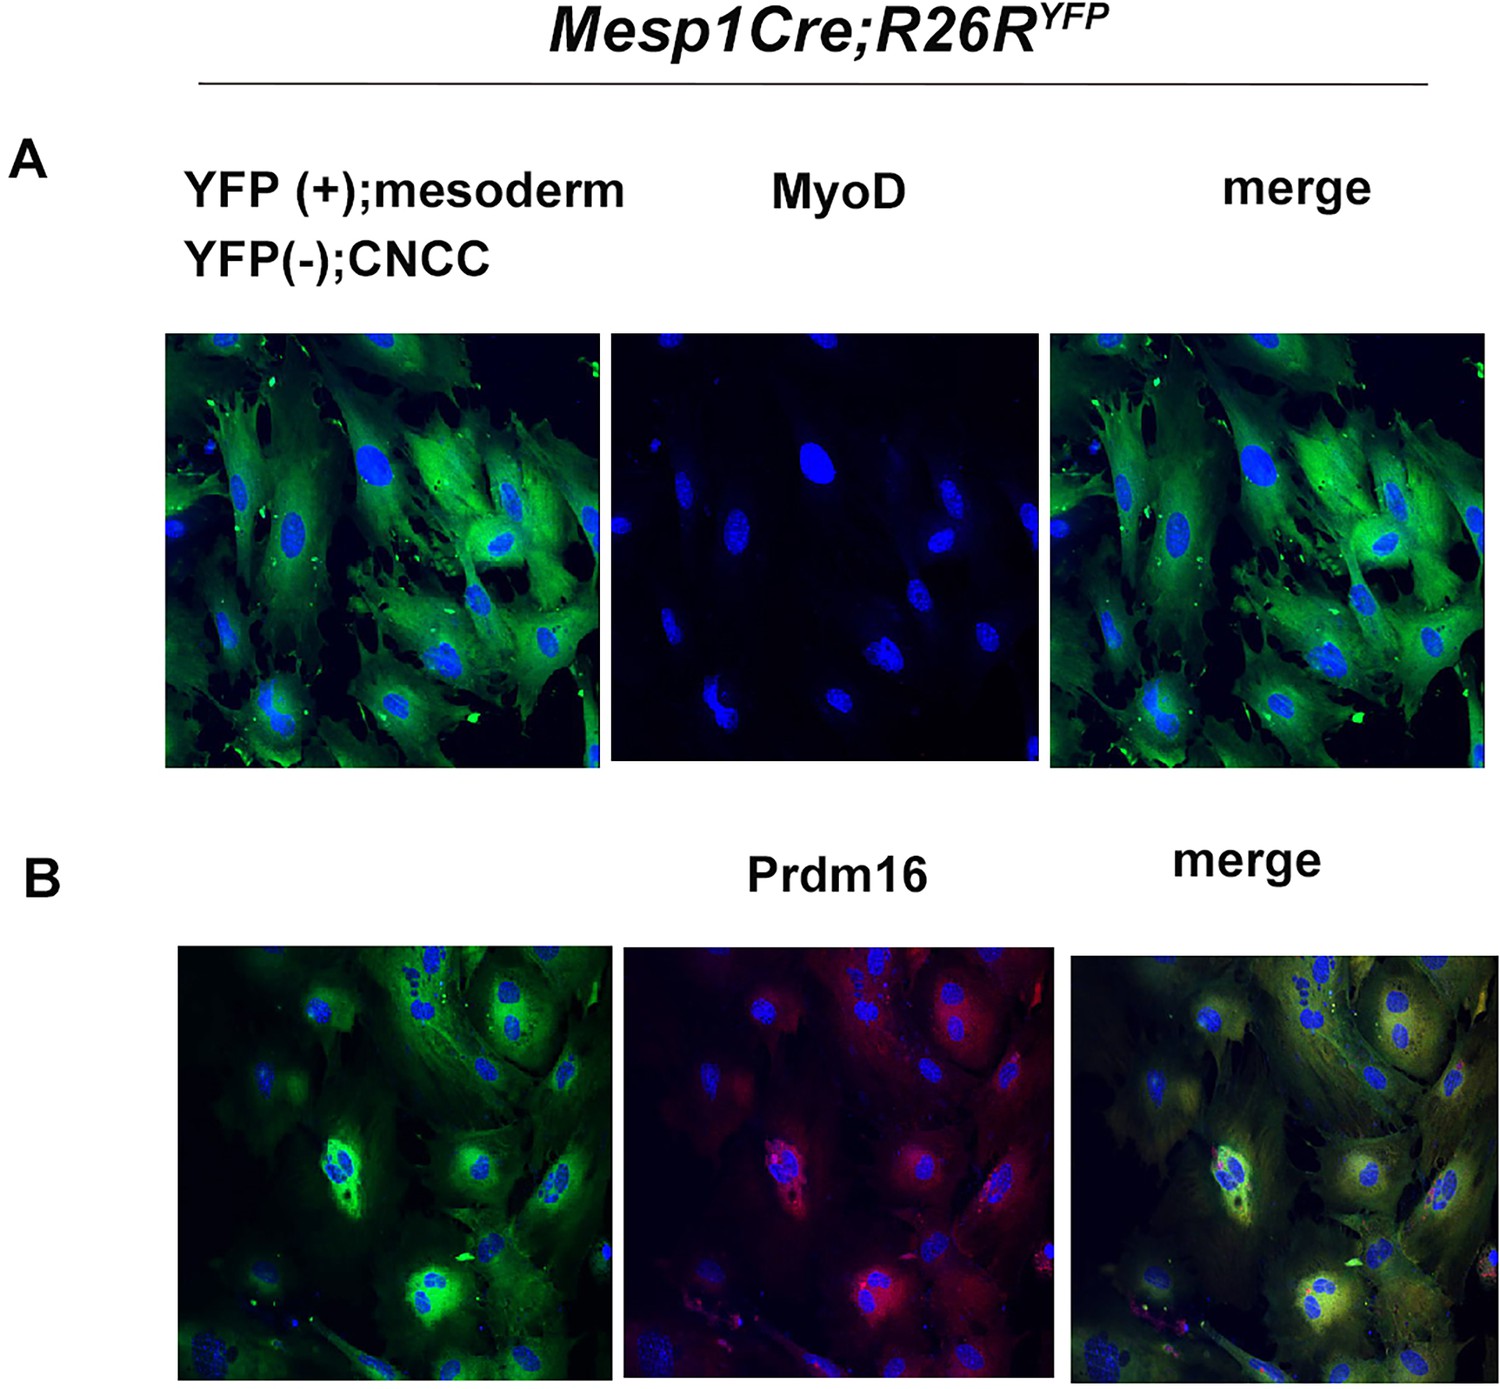
Interaction between cranial neural crest-derived cells (CNCC) and mesoderm-derived cells.
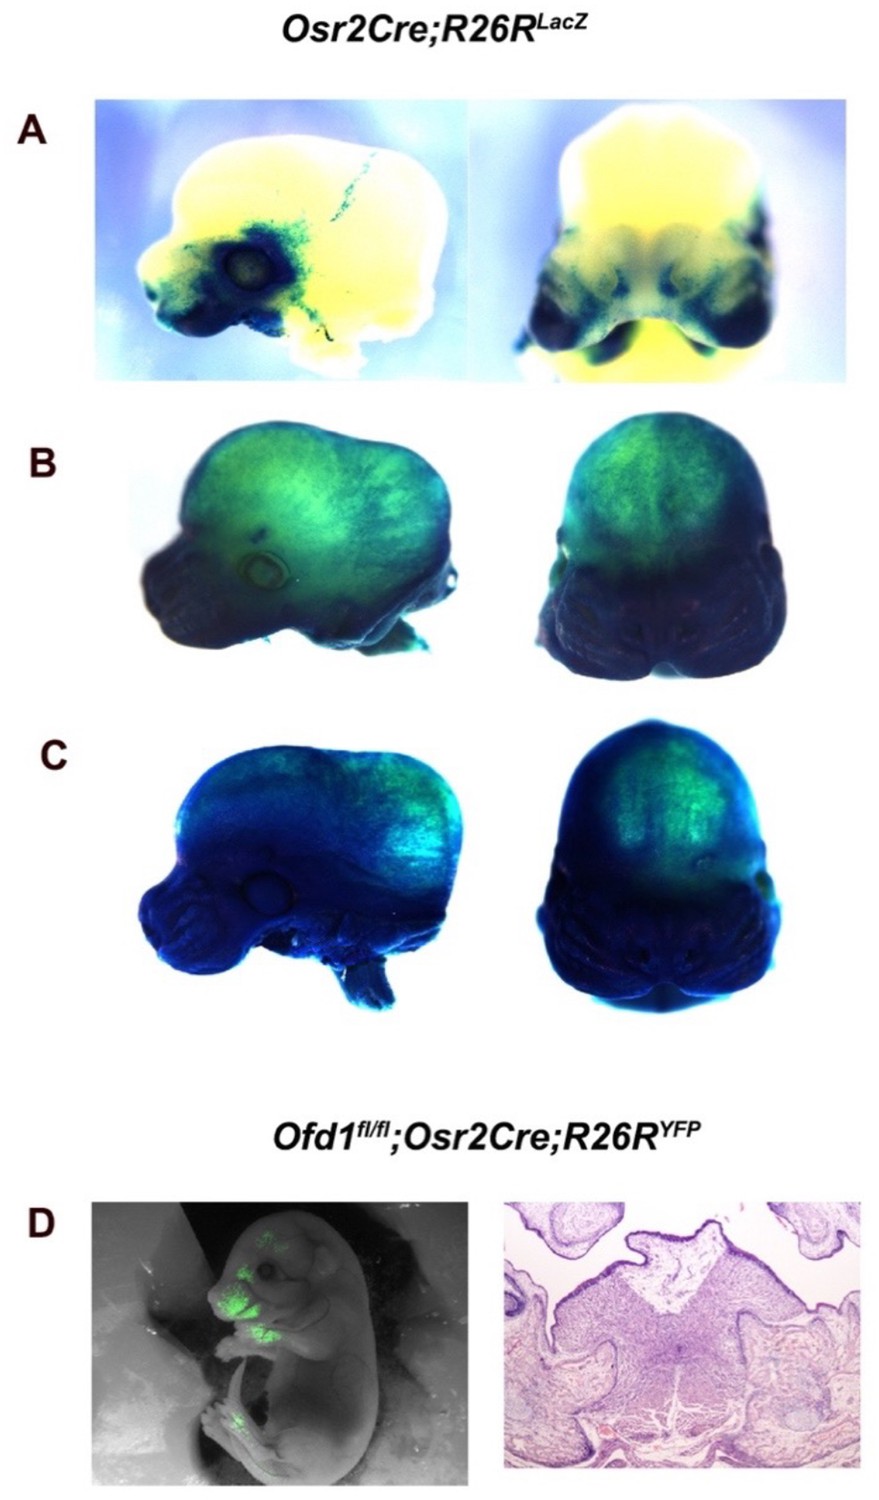
(A–D) Frontal images of YFP expression (A, B) and Myf5 expression of whole-mount in situ hybridization (C, D) in Mesp1Cre;R26RYFP (A), Wnt1Cre;R26RYFP (B), wild-type (C), and Ofd1fl;Wnt1Cre(HM) (D) at embryonic day (E) 10. (E, E’) Frontal (E) and sagittal (E) view of LacZ stained Osr2Cre;R26RLacZ mice at E10. (F, G) Frontal sections showing in situ hybridization of Osr2 (F) and MyoD (G) in wild-type at E11. (H) Schematic diagram showing hypoglossal cord (left), CNCC (middle), and Osr2-Cre expression domain (right). (I–L) Frontal sections showing histological images in wild-type (I), Ofd1fl;Osr2Cre(HM) (L), and Ofd1fl;Sox10Cre(HM) (K, anterior and L, middle) at E16.5 (K, L) and E18.5 (I, J). (M) Double immunohistochemistry of YFP and MyoD on cultured YFP-expressing CNCC accompanied by YFP-negative mesoderm-derived cells obtained from Wnt1Cre;R26RYFP mice. (N) Double immunohistochemistry of YFP and Prdm16 on cultured YFP-negative mesoderm-derived cells obtained from Wnt1Cre;R26RYFP mice. (Q) Schematic diagram showing lateral view of craniofacial region with incision (red line). (P, Q) Double immunohistochemistry of MyoD and Prdm16 in cultured wild-type tongue without incision (P) and with incision (Q). Arrowheads indicating Prdm16-positive cells (Q).The presence of adipose tissue in explants with incisions, n=4/8; and without incision, n=0/8. Scale bars: 500µm (A-E’), 200 µm (I, J, K, L), 100 µm (F, G).
Figure 3—figure supplement 1
Variation of Osr2-Cre activation.
Osr2-Cre activation (confirmed by LacZ staining in Osr2Cre;R26RLacZ) exhibited the three different patterns (Lan et al., 2007). Most embryos displayed tissue-specific pattern consistent with specific Cre expression from the Osr2 locus, as shown in A (tissue-specific pattern). Approximately 20% of Osr2-Cre displayed some ectopic activation, as shown in B (ectopic pattern). Approximately 10% of Osr2-Cre embryos displayed almost ubiquitous activation, as shown in C (ubiquitous pattern). Abnormal tongue was observed in Ofd1fl;Osr2Cre;R26RYFP mice with tissue-specific pattern (D). Ofd1fl;Osr2Cre;R26RYFP mice with ectopic pattern or ubiquitous pattern led to early lethal, as previous paper reported (Ferrante et al., 2006). Ofd1fl;Osr2Cre;R26RYFP mice we can used in this study were tissue-specific pattern.
Figure 3—figure supplement 2
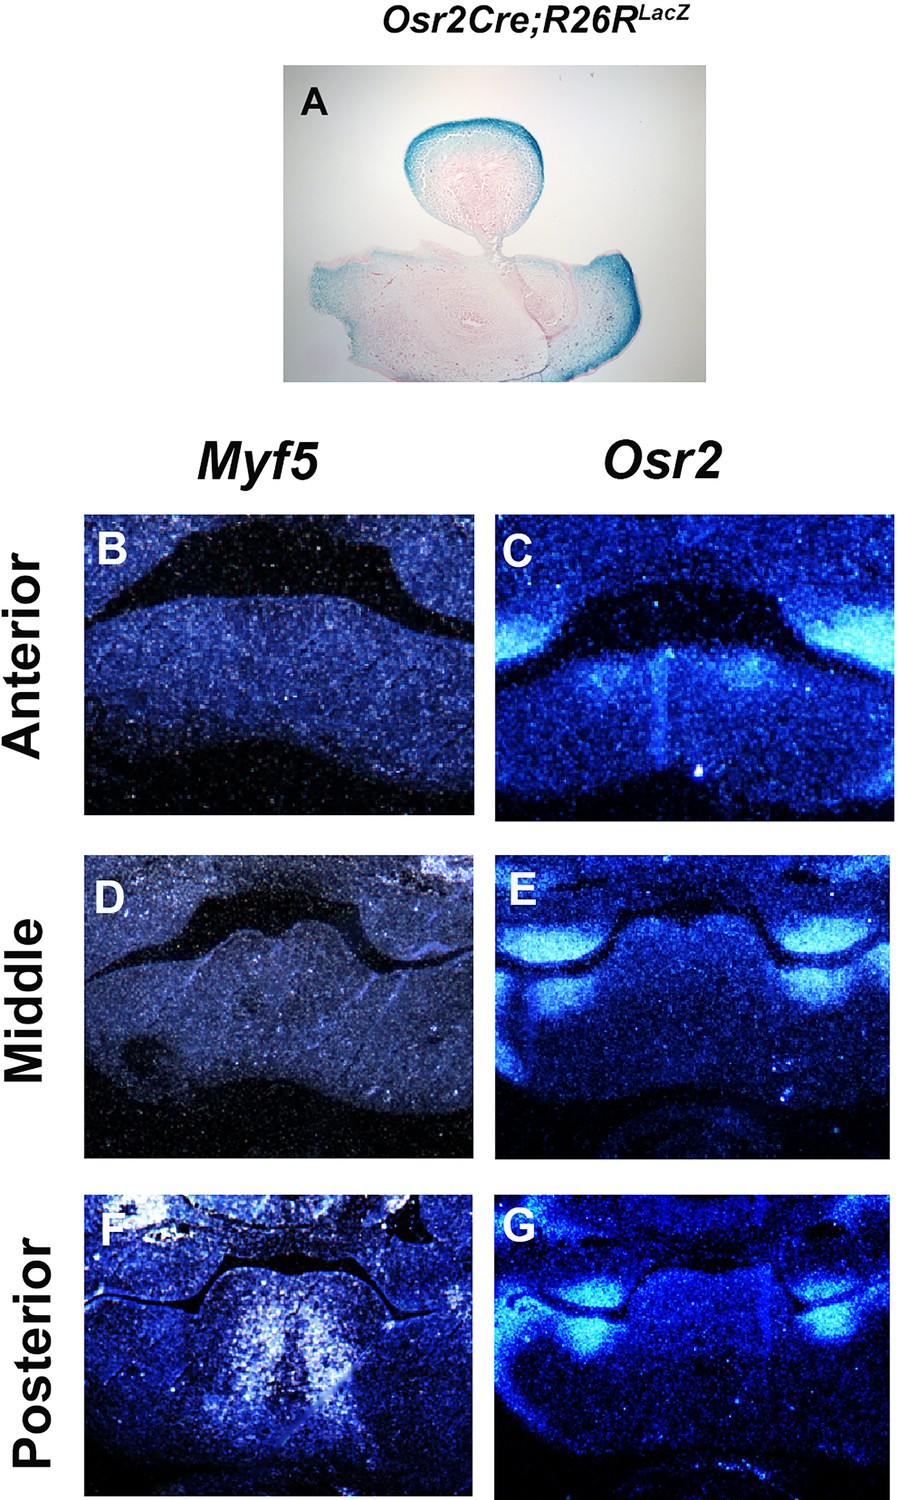
Osr2 expression in developing tongue.
(A) Frontal section showing LacZ stained Osr2Cre;R26RLacZ mice at embryonic day (E) 13.5. (B–G) Frontal sections showing in situ hybridization of Myf5 (A–C) and Osr2 (D–F) in anterior (A, D), middle (B, E), and posterior (C, F) part of wild-type tongue at E11.5.
Figure 3—figure supplement 3
Interaction between cranial neural crest-derived cells (CNCC) and mesoderm-derived cells.
Double immunohistochemistry of YFP and MyoD (A) and YFP and Prdm1 (B) on cultured YFP-expressing mesoderm-derived cells and YFP-negative CNCC obtained from Mesp1Cre;R26RYFP mice.
Figure 3—figure supplement 4
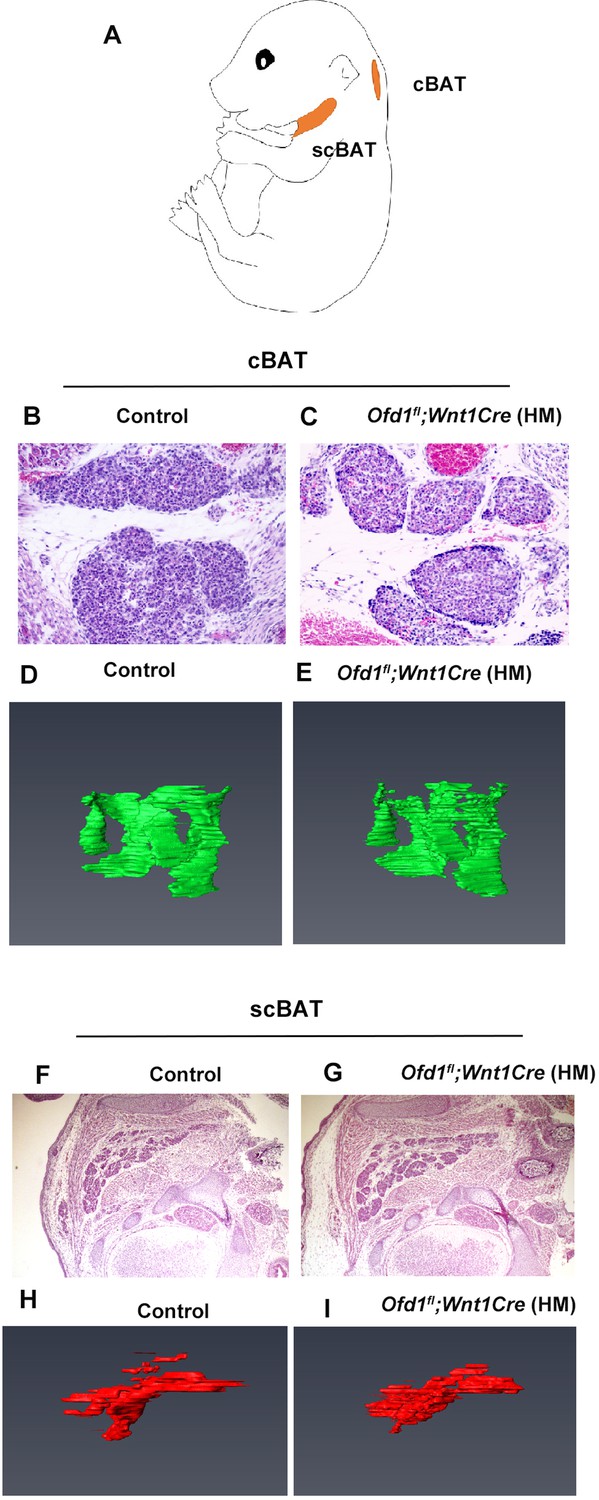
The cervical brown adipose tissue in Ofd1fl/WT;Wnt1Cre(HET) mice.
(A) Schematic diagram showing lateral view of supraclavicular (scBAT) and cervical (cBAT) brown adipose tissue. (B, C, F, G) Sagittal (B, C) and coronal (F, G) sections showing histology of scBAT and cBAT, respectively, in control (B, F) and Ofd1fl;Wnt1Cre(HM) (C, G) mice. (D, E, H, I) 3D reconstruction of scBAT and cBAT from serial sections of control (D, H) and Ofd1fl;Wnt1Cre(HM) (E, I) mice.
Figure 4 with 1 supplement
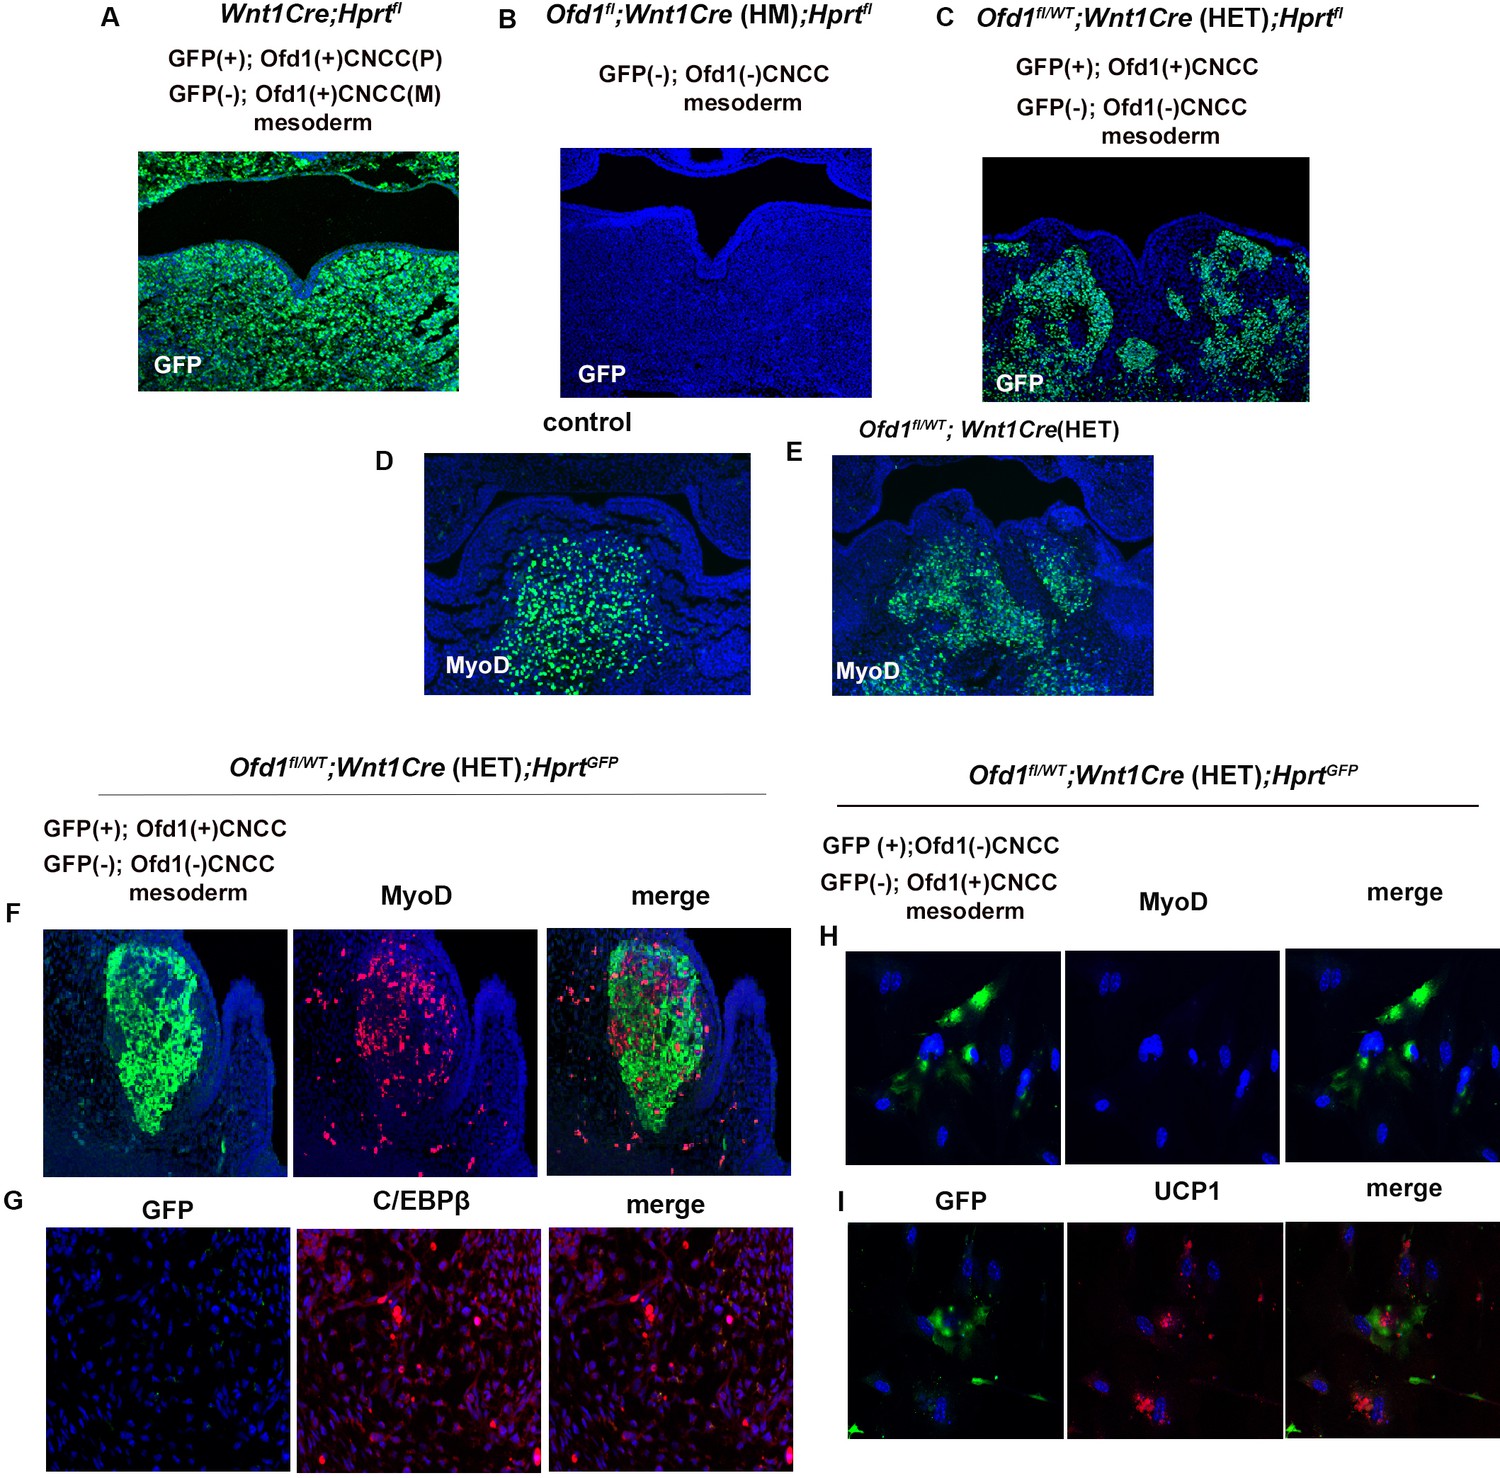
X-inactivation in Ofd1 mutant tongue.
(A–E) Frontal sections showing immunohistochemistry of GFP (A–C) and MyoD (D, E) in Wnt1Cre(HET);Hprtfl (A), Ofd1fl;Wnt1Cre(HM);Hprtfl (B), Ofd1fl/WT;Wnt1Cre(HET);Hprtfl (C), wild-type (D), and Ofd1fl/WT;Wnt1Cre(HET) (E) mice at embryonic day (E) 11. P, paternal; M, maternal. (F, G) Double immunohistochemistry of GFP and MyoD (F), and GFP and C/EBPβ (G) in Ofd1fl/WT;Wnt1Cre(HET);Hprtfl mice. (H, I) Double immunohistochemistry of GFP and MyoD (H), and GFP and UCP1 (I) on cultured YFP-expressing Ofd1 (-) cranial neural crest-derived cells (CNCC), GFP-negative mesoderm-derived cells, and GFP-negative Ofd1 (+) CNCC obtained from Ofd1fl/WT;Wnt1Cre(HET);Hprtfl mice.
Figure 4—figure supplement 1
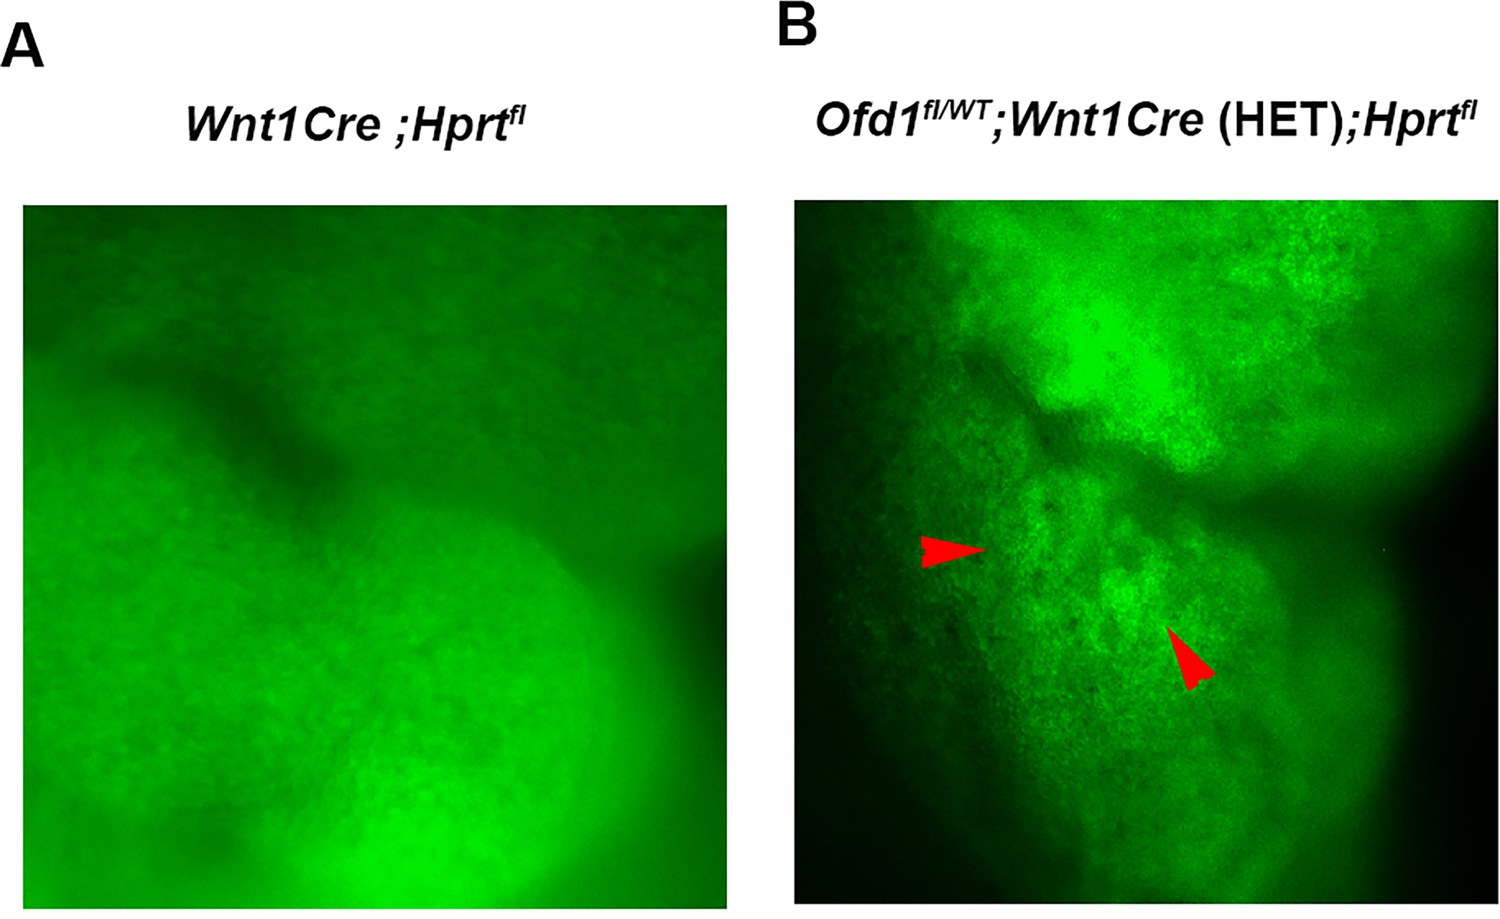
Cluster of Ofd1 mutant cells in Ofd1fl/WT;Wnt1Cre(HET) mice.
Sagittal view of pharyngeal region of Wnt1Cre;Hprtfl (A) and Ofd1fl;Wnt1Cre(HET);Hprtfl (B). Arrowheads indicating cluster of GFP (-) cells.
Figure 5 with 2 supplements
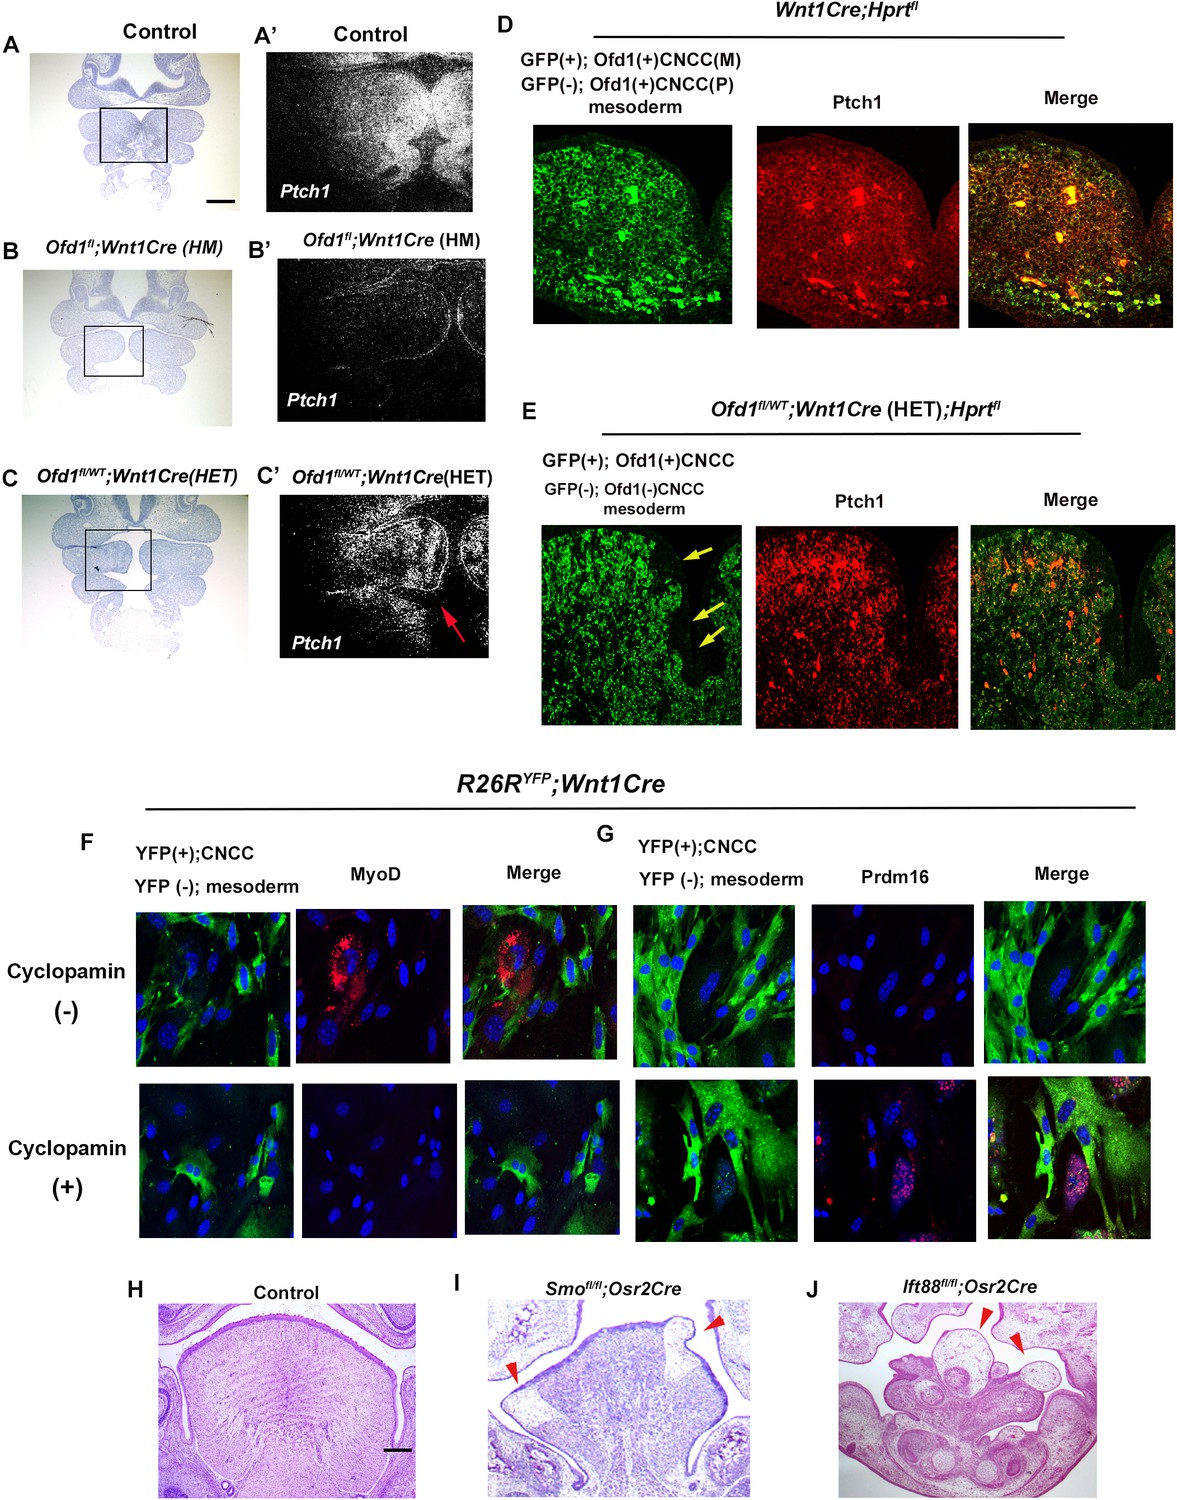
Hh signal in Ofd1 mutant tongue.
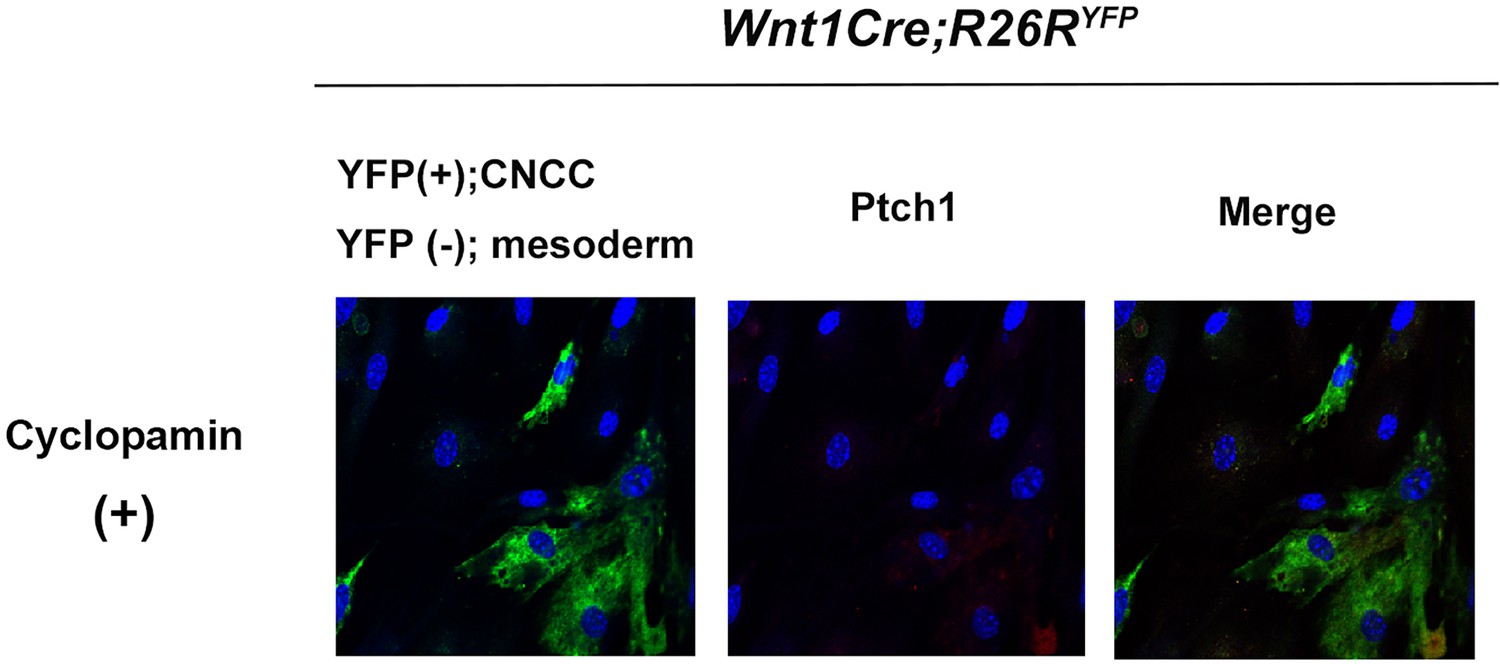
(A–C’) Frontal sections showing in situ hybridization of Ptch1 in wild-type (A’), Ofd1fl;Wnt1Cre(HM) (B’), and Ofd1fl/WT;Wnt1Cre(HET) (C’) at embryonic day (E) 10. A, B, C, bright field (counterstained section by hematoxylin) of A’, B’, C’, respectively. A’, B’, C’, high magnification of regions outlined by boxes in A, B, C, respectively. Arrow indicating mosaic Ptch1 expression (C’). (D, E) Frontal sections showing double immunohistochemistry of GFP and Ptch1 in Wnt1Cre;Hprtfl (D) and Ofd1fl/WT;Wnt1Cre(HET);Hprtfl (E) mice. Arrow indicating GFP-negative region (E). (F, G) Double immunohistochemistry of YFP and MyoD (F), and YFP and Prdm16 (G) on cultured YFP-expressing cranial neural crest-derived cells (CNCC) accompanied by YFP-negative mesoderm-derived cells obtained from Wnt1Cre;R26RYFP mice with (lower panels) or without (upper panels) cyclopamine. (H–J) Frontal sections showing histology of wild-type (F), Smofl/fl;Osr2Cre (G), and Ift88fl/fl;Osr2Cre (H) at E18.5. Arrowheads indicating ectopic sparse tissue. Scale bars: 100 µm (A-C’), 200 µm (H-J).
Figure 5—figure supplement 1
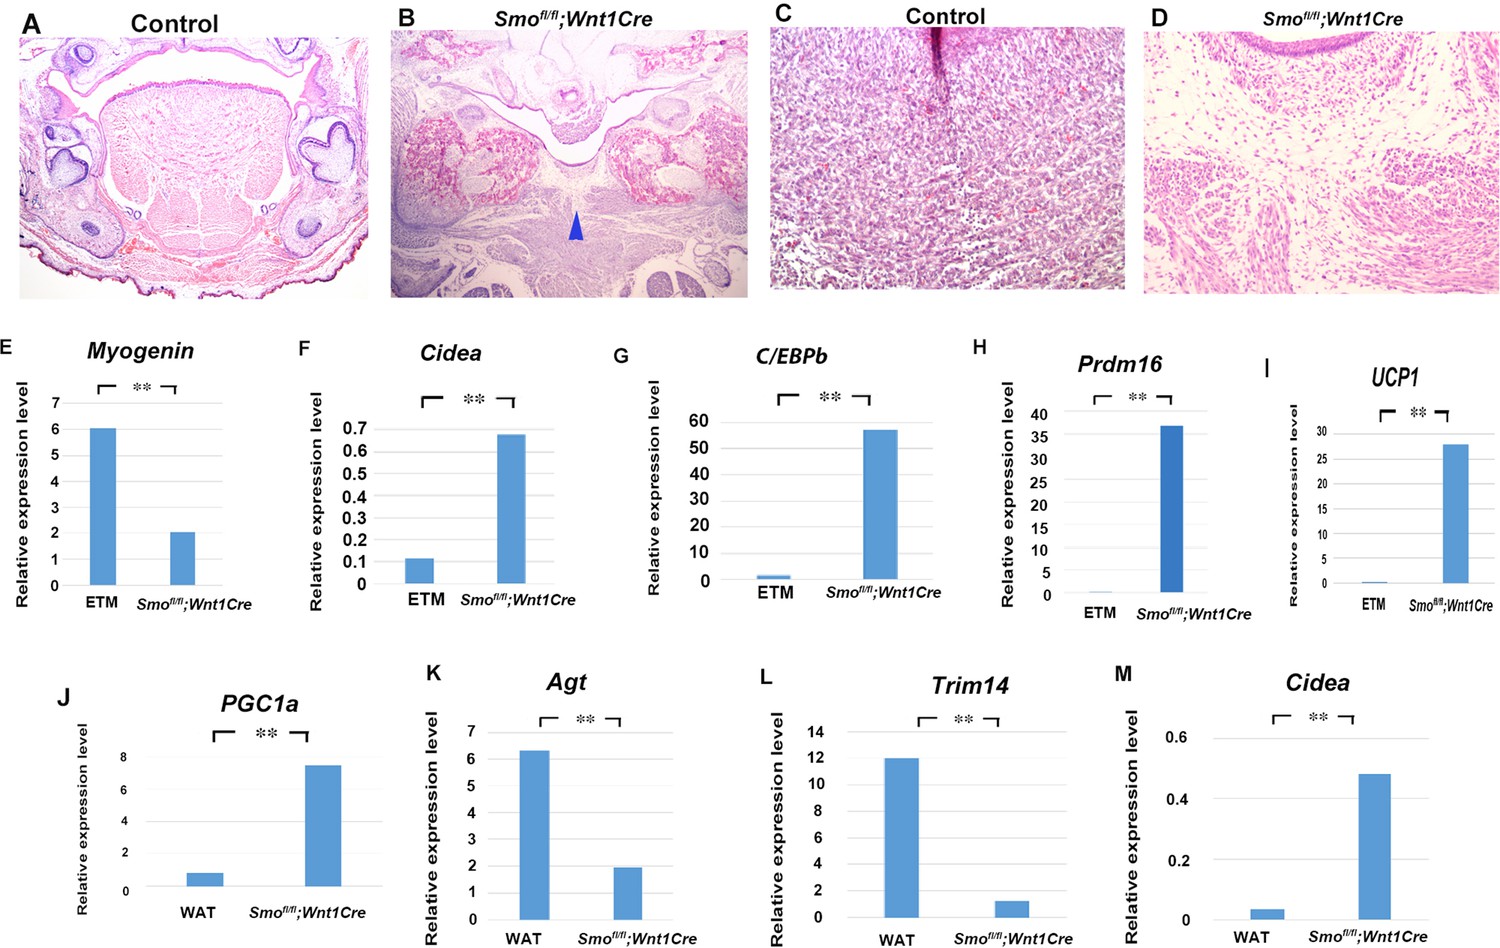
Adipose in Smo mutant mice.
(A–D) Frontal section showing histological images of wild-type (A, C) and Smofl/fl;Osr2Cre(HM) (B, D) mice. B and D were high magnifications of A and C, respectively. (E–M) Quantitative PCR (q-PCR) on mRNA isolated from ectopic sparse tissue from Smofl/fl;Wnt1Cre, embryonic tongue muscle (ETM), and white adipose tissue (WAT). **p<0.01.
-
Figure 5—figure supplement 1—source data 1
qPCR; Myogenin, Cidea, C/EBPb, Prdm16, UCP1, PGC1a, Agt, Trim14 and Cidea.
- https://cdn.elifesciences.org/articles/85042/elife-85042-fig5-figsupp1-data1-v1.xlsx
Figure 5—figure supplement 2
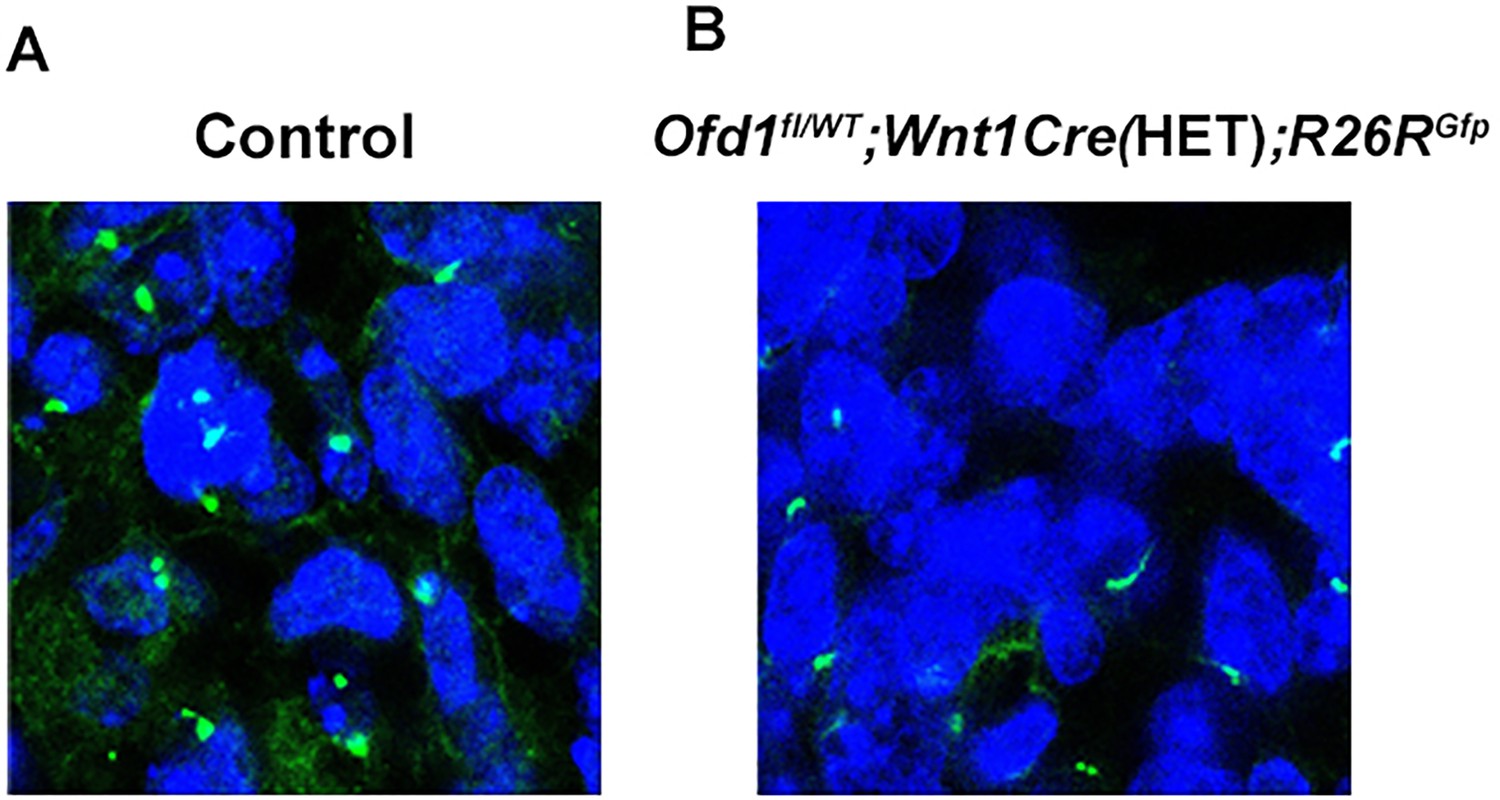
Acetylated α-tubulin in cranial neural crest-derived cells (CNCC) during tongue development.
Frontal section showing immunohistochemistry of acetylated α-tubulin in YFP-expressing cells of Wnt1Cre(HET);R26RYfp (A) and Ofd1fl/WT;Wnt1Cre(HET);R26RYfp mice (B). CNCC were confirmed by YFP expression.
Figure 6 with 2 supplements
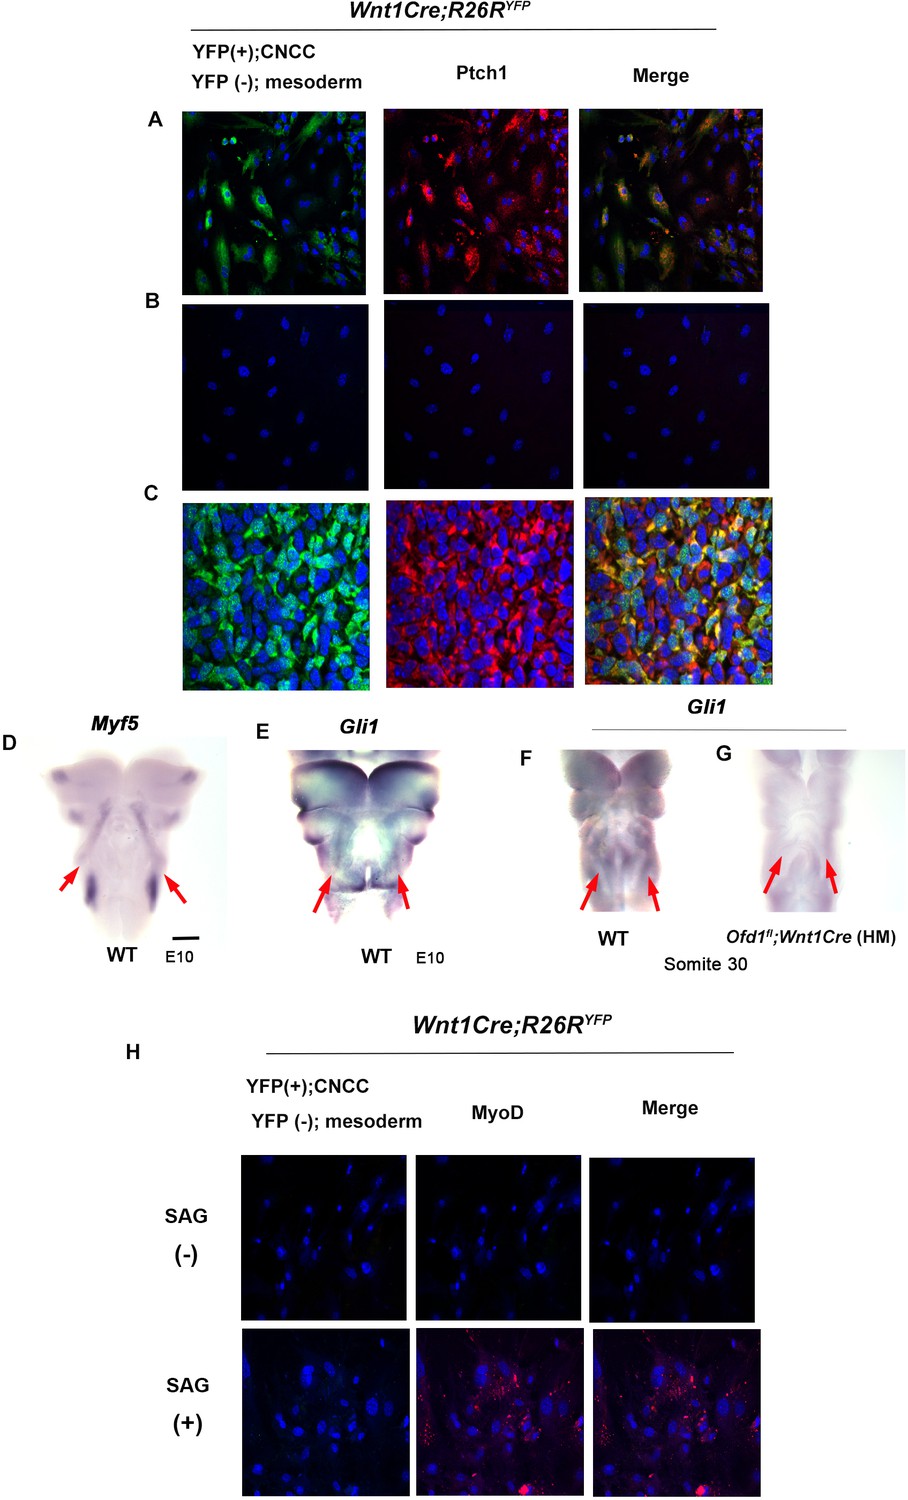
Hh signal in mesoderm-derived cells.
(A, B) Double immunohistochemistry of YFP and Ptch1 on cultured YFP-expressing cranial neural crest-derived cells (CNCC) accompanied by YFP-negative mesoderm-derived cells (A) and only YFP-negative mesoderm-derived cells (B) obtained from Wnt1Cre;R26RYFP mice. (C) Double immunohistochemistry of YFP and Ptch1 in Wnt1Cre;R26RYFP mice. (D–G) Frontal images of whole-mount in situ hybridization of Myf5 (D) and Gli1 (E–G) in wild-type (D–F) and Ofd1fl;Wnt1Cre(HM) (G) at embryonic day (E) 10. (H) Double immunohistochemistry of YFP and MyoD on cultured YFP-negative mesoderm-derived cells obtained from Wnt1Cre;R26RYFP mice with (lower panels) or without (upper panels) SAG. Scale bars: 500 µm (D-G).
Figure 6—figure supplement 1
Cyclopamine treated cranial neural crest-derived cells (CNCC) and mesoderm-derived cells.
Double immunohistochemistry of YFP and Ptch1 on cultured YFP-expressing CNCC accompanied by YFP-negative mesoderm-derived cells obtained from Wnt1Cre;R26RYFP mice with cyclopamine.
Figure 6—figure supplement 2
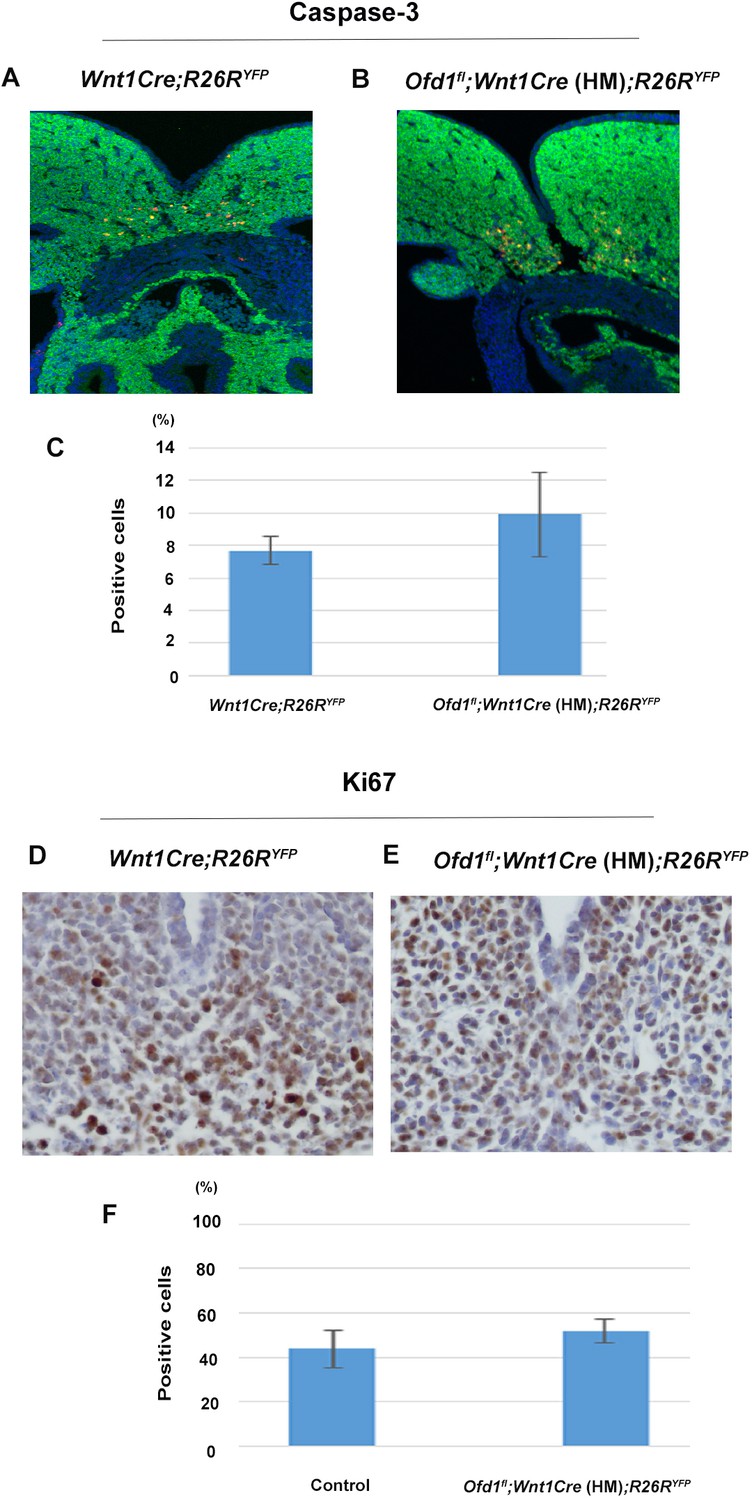
Apoptosis and cell proliferation in Ofd1 mutant tongue.
(A, B) Frontal sections showing Caspase-3 immunohistochemistry. (C) Comparison of the number of Caspase-3-positive cells between Wnt1Cre;R26RYFP mice and Ofd1fl;Wnt1Cre(HM);R26RYFP mice. (D, E) Frontal sections showing Ki67-positive cells. (F) Comparison of the number of Ki67-positive cells between Wnt1Cre;R26RYFP mice and Ofd1fl;Wnt1Cre(HM);R26RYFP mice.
-
Figure 6—figure supplement 2—source data 1
Percentage of Positive cells: Caspase-3 and Ki67.
- https://cdn.elifesciences.org/articles/85042/elife-85042-fig6-figsupp2-data1-v1.xlsx
Figure 7
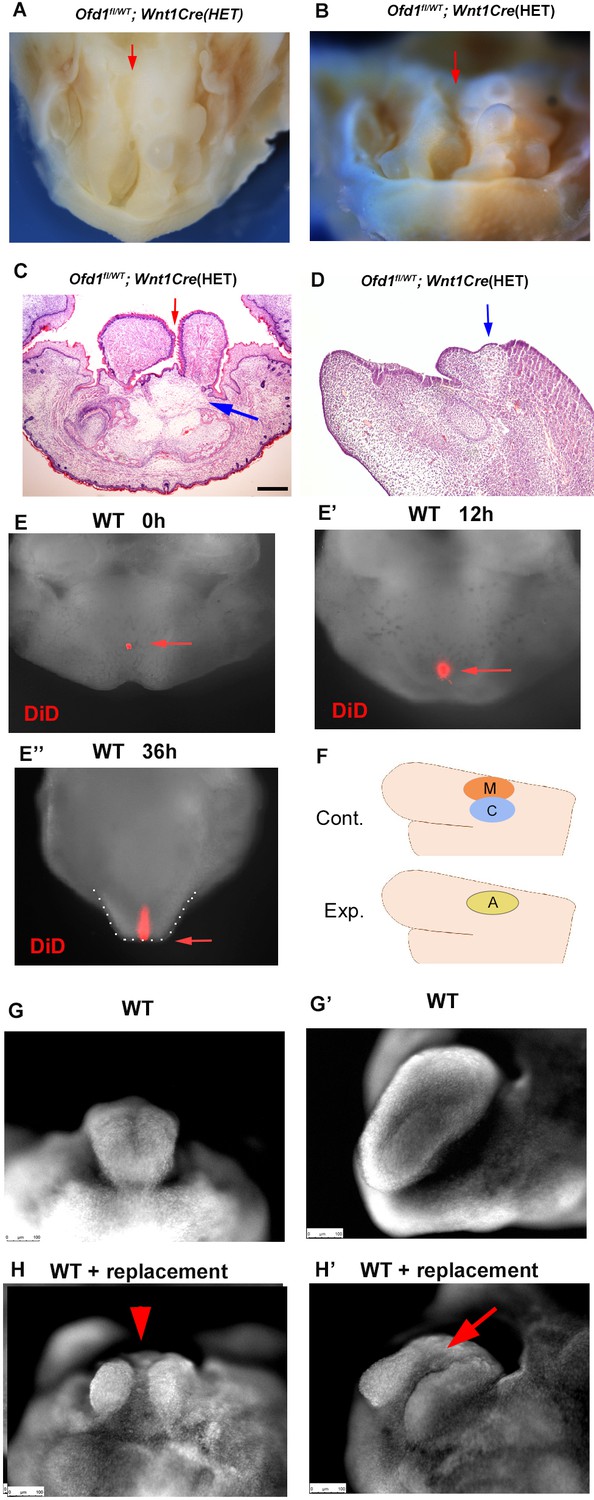
Clefts in Ofd1 mutants.
(A, B) Oral (M) and frontal (N) view of Ofd1fl/WT;Wnt1Cre(HET) mice. Arrows indicating cleft. (C, D) Frontal (C) and sagittal (D) sections showing histological images. Blue and red arrows indicating sparse tissue and cleft, respectively. (E–E’’) Nuclear fluorescent image showing oral view of wild-type mandible with DiD at embryonic day (E) 11.5 before culture (E), 12 hr (E’), and 36 hr (E’’) after culture. Arrow indicating DiD labeled cells. Tongue-like structure is outlined by white dots (E’’). (F) Schematic diagram showing sagittal view of mandible exhibiting replacement of cranial neural crest-derived cells (CNCC) (C, blue circle) and myoblasts (M, red circle) into adipose tissue (A, yellow circle). (G–H’) Nuclear fluorescent image showing frontal (G, H) and oral (G’, H’) view of wild-type mandible without (G, G’) and with (H, H’) replacement. Scale bars: 200 µm (C, D).
Figure 8
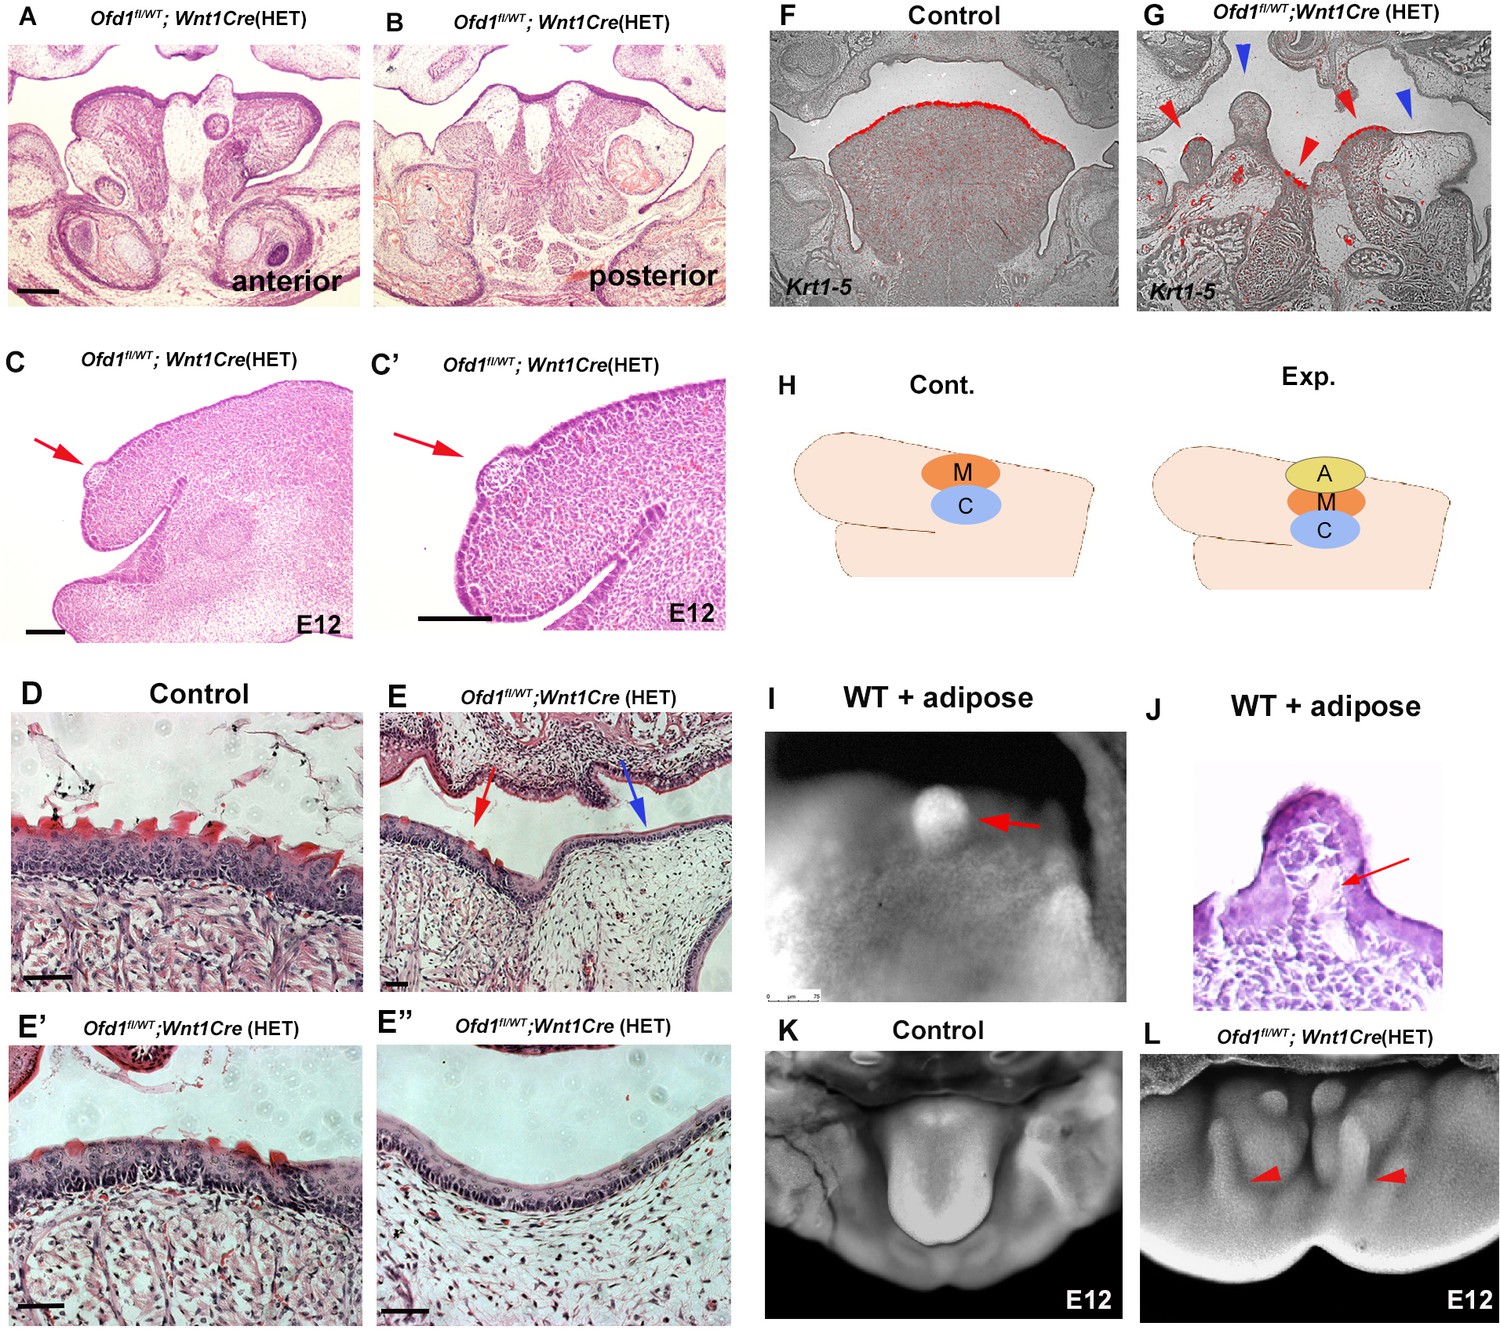
Adipose tissue in Ofd1 mutant tongue.
(A, B, C–E’’) Frontal (A, B, D–E’’) and sagittal (C, C’) sections showing histological images in wild-type (D), and Ofd1fl/WT;Wnt1Cre(HET) (A–C’, E–E’’). E’ and E’’ are high magnification of E. (F, G) Frontal sections showing in situ hybridization of Krt1-5 in wild-type (F) and Ofd1fl/WT;Wnt1Cre(HET) (G). (H) Schematic diagram showing sagittal view of mandible exhibiting graft of adipose tissue (A, yellow circle), cranial neural crest-derived cells (CNCC) (C, blue circle) and myoblasts (M, red circle). (I) Nuclear fluorescent image showing dorsum of tongue in cultured mandible with grafting. (J) Histological images of dorsum of tongue in cultured mandible with grafting. (K, L) Nuclear fluorescent image showing oral view of developing mandibles in wild-type (K) and Ofd1fl/WT;Wnt1Cre(HET) (L). Arrowheads indicating protrusion into the floor of mandible from the dorsum surface of tongue swelling (L). Scale bars: 200 µm (A, B, F, G), 100 µm (C-E’’).
Figure 9 with 1 supplement
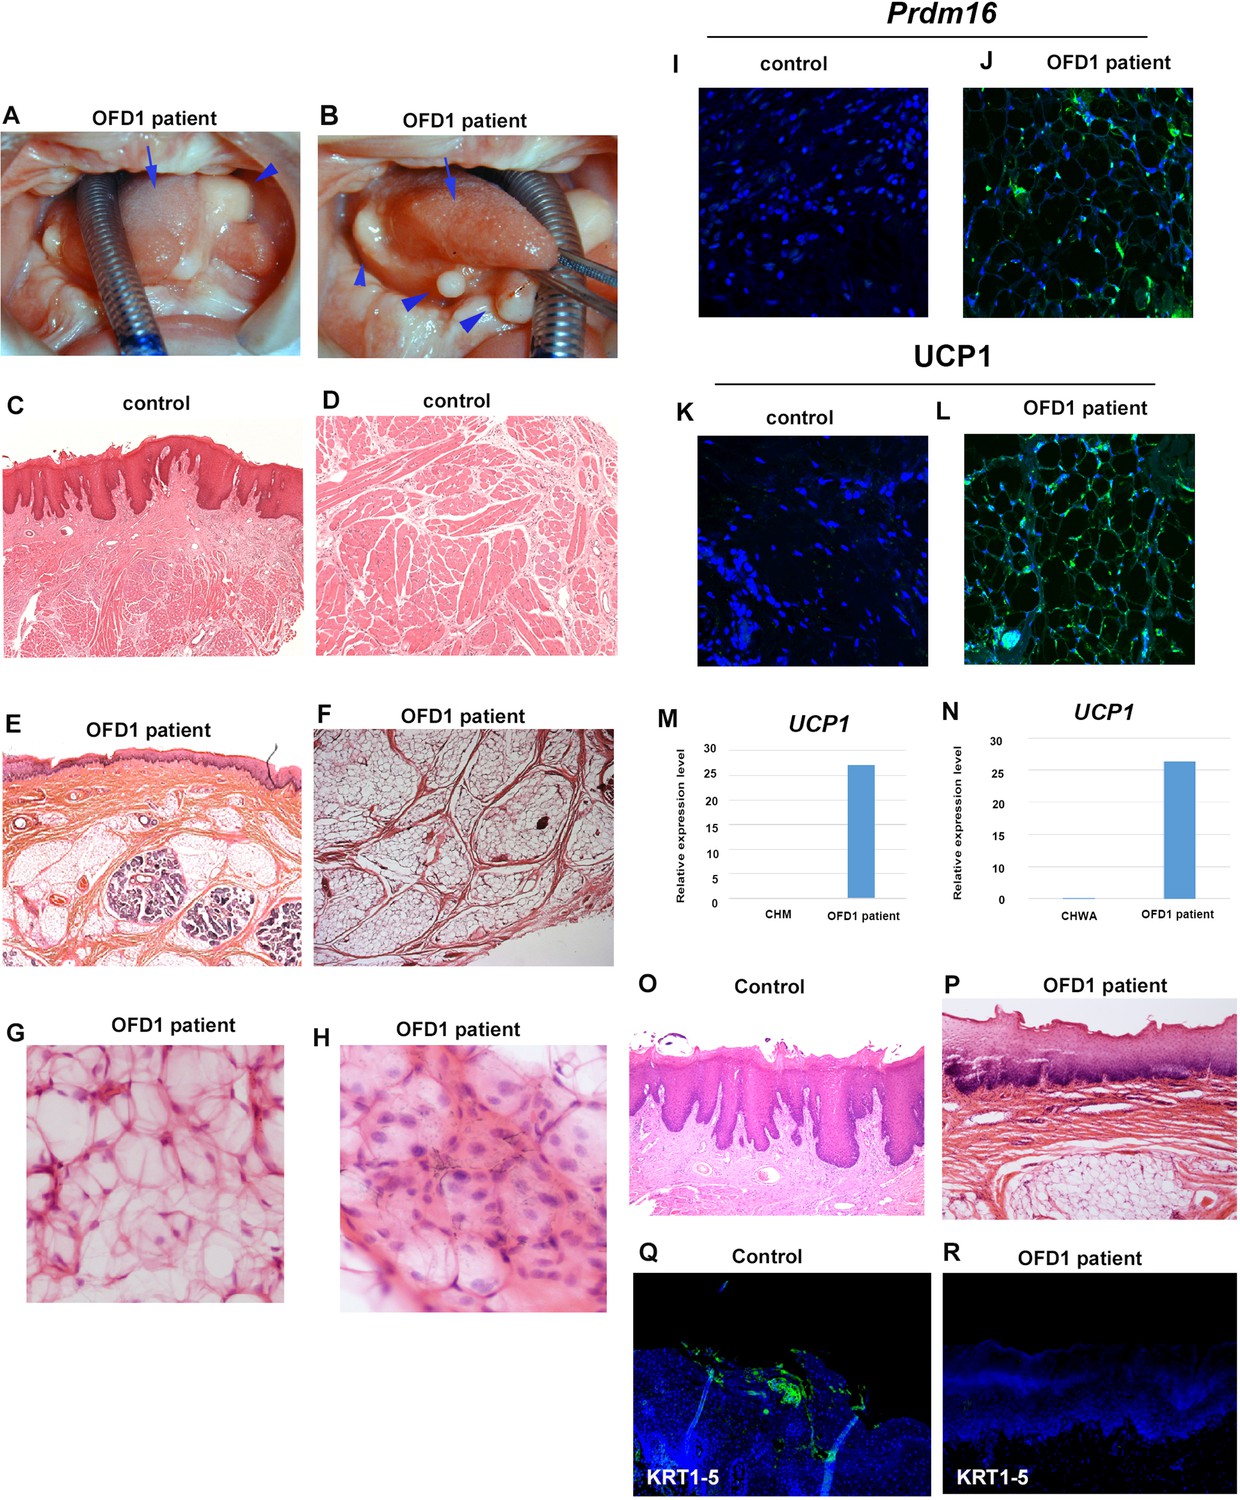
Tongue in OFD1 patient.
(A, B) Tongue in OFD1 patient (G138S missense mutation). Arrowheads and arrows indicating protruded tissue and normal tongue, respectively. (C–L, O–R) Sections showing histological images (C–H, O, P) and immunohistochemistry of Prdm16 (I, J), UCP1 (K, L), and KRT1-5 (Q, R) on control human tongue (C, D, O, Q) and OFD1 patient tongue (E–H, J, L, P, R). (M, N) Quantitative PCR (q-PCR) on mRNA isolated from ectopic sparse tissue from OFD1 patient tongue, cultured human skeletal muscle myoblasts (CHM), and cultured human white adipocyte (CHWA).
-
Figure 9—source data 1
qPCR; UCP1.
- https://cdn.elifesciences.org/articles/85042/elife-85042-fig9-data1-v1.xlsx
Figure 9—figure supplement 1
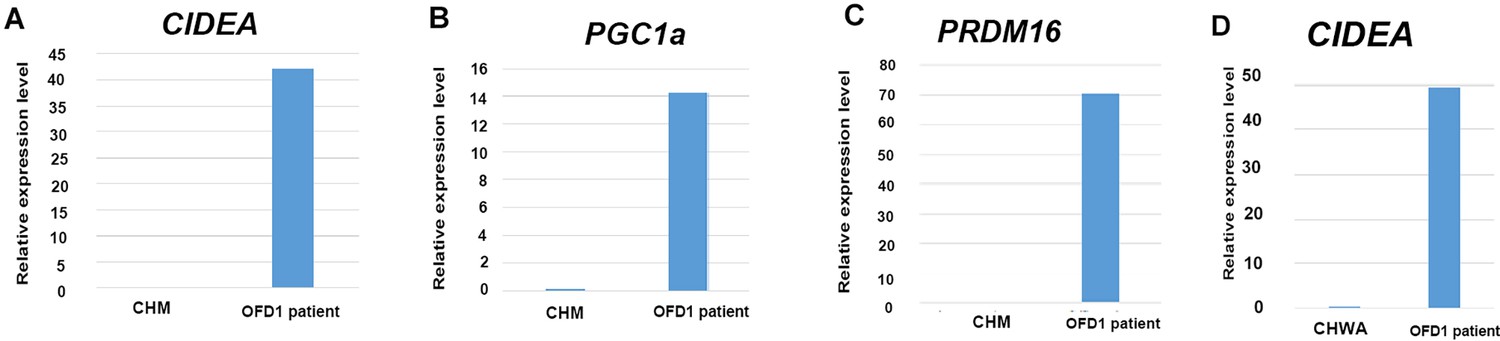
Quantitative PCR (q-PCR) analysis on OFD1 patient tongue.
q-PCR of CIDEA (A), PGC1a (B), PRDM16 (C) and CIDEA (D) on mRNA isolated from ectopic sparse tissue from OFD1 patient tongue, cultured human myoblasts (CHM), and cultured human white adipocytes (CHWA).
-
Figure 9—figure supplement 1—source data 1
qPCR; CIDEA, PGC1a, PRDM16 and CIDEA.
- https://cdn.elifesciences.org/articles/85042/elife-85042-fig9-figsupp1-data1-v1.xlsx
Figure 10 with 1 supplement
Tongue frenum in Ofd1 mutant mice.
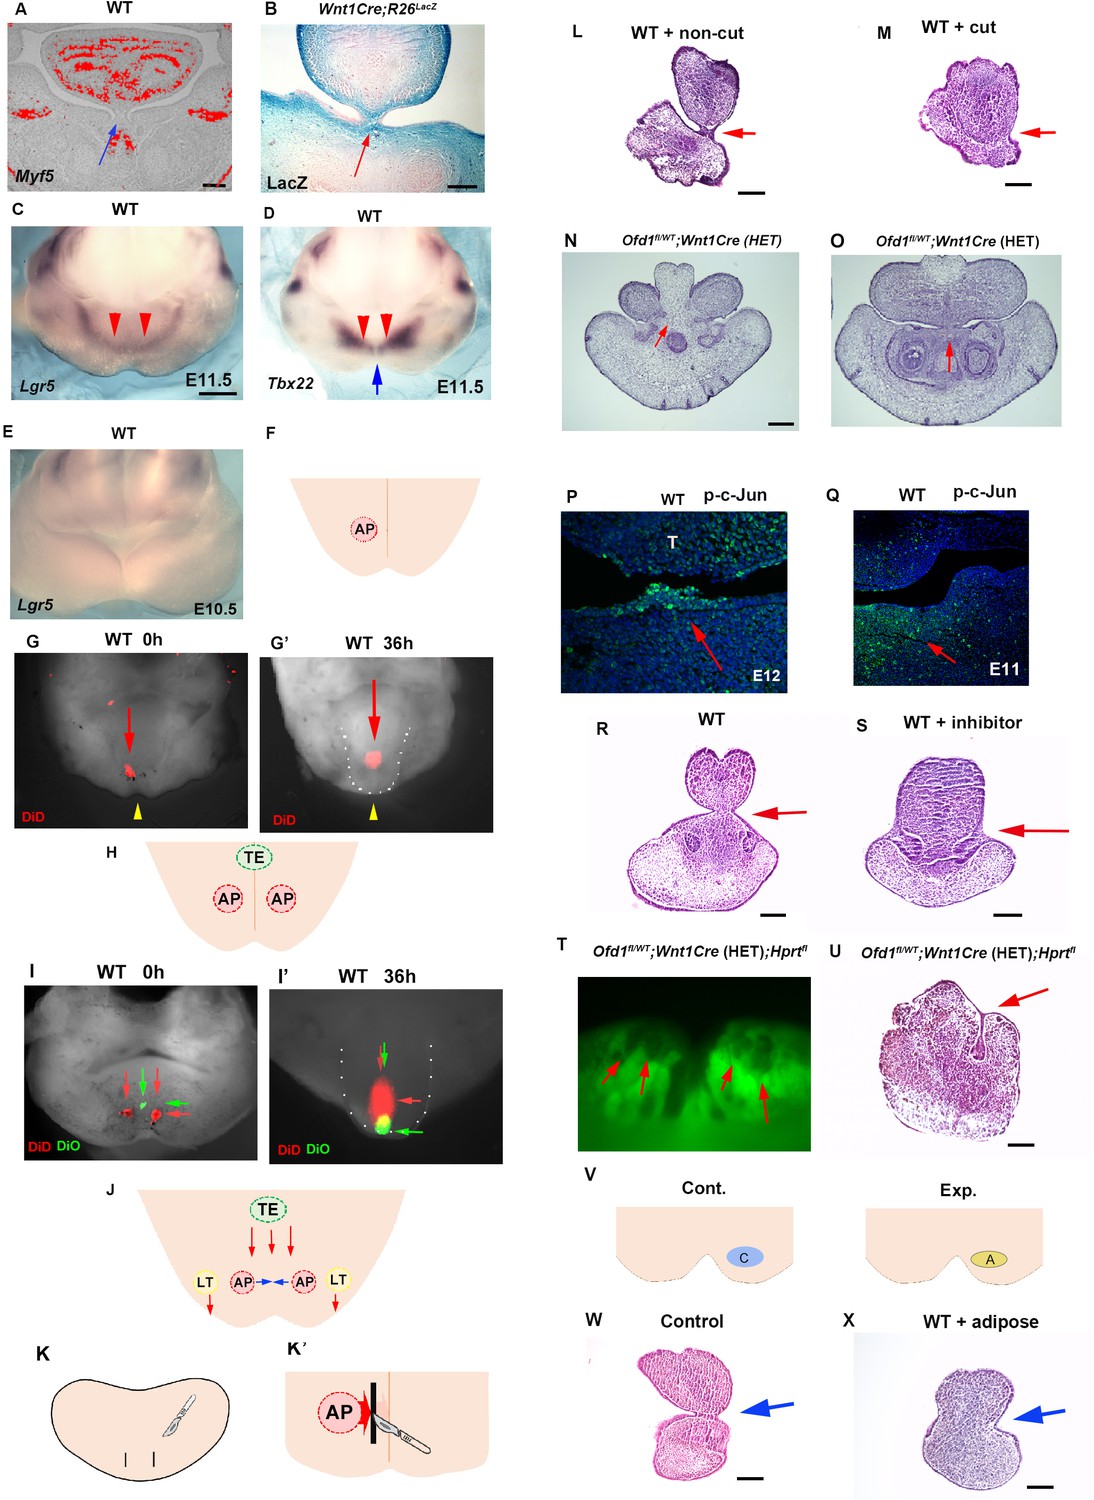
(A, B) Frontal sections showing in situ hybridization of Myf5 (A) and LacZ staining (B) in wild-type (A) and WntCre;R26RLacZ (B). Arrows indicating tongue frenum region. (C–E) Oral view of whole-mount in situ hybridization of Lgr5 (C, E) and Tbx22 (D) in wild-type at embryonic day (E) 11.5 (C, D) and E10.5 (E). Red and blue arrows indicating anterior expression domain and midline region, respectively. (F, H) Schematic diagram showing oral view of mandible with AP (light red) and TE region (light green), and midline (orange line). (G, G’, I, I’) Nuclear fluorescent image showing oral view of wild-type mandible before (G, I) and after (G’, I’) culture. Red and green arrows indicating DiD and DiO, respectively. Yellow arrowheads indicating midline. (G’, I’) Tongue-like structure was partially removed and presumptive tongue-like structure are outlined by white dots. (J) Schematic diagram showing oral view of mandible with movement of cells in AP (light red), LT (light yellow), and TE region (light green line). (K, K’) Schematic diagram showing oral view of mandible with incision (black line) and midline (orange line). (L, M) Frontal sections showing histological images of cultured jaw without incision (L) and with incision (M). Arrows indicating the tongue frenum region. Tongue frenum formation with, n=1/6 and without incision, n=8/10. (N, O) Frontal sections showing histological images in Ofd1fl/WT;Wnt1Cre(HET) mice obtained from same mouse (O; more posterior site than N). (P, Q) Frontal sections showing immunohistochemistry of p-c-Jun in wild-type at E12 (P) and E11 (Q). Arrows indicating positive cells in the tongue frenum (P) and AP region (Q). (R, S) Frontal sections showing histological images of cultured jaw with (S) and without U73122 (R). Arrows indicating the tongue frenum region. Tongue frenum formation with U73122, n=0/4. (T) Oral view of mandible in Ofd1fl/WT;Wnt1Cre(HET);Hprtfl mice. Arrows indicating Gfp-negative domains around AP region before culture. (U) Frontal sections showing histological images of T after culture. Arrow indicating tongue frenum region. (V) Schematic diagram showing oral view of mandible with replacement (A, yellow circle=adipose, blue circle=cranial neural crest-derived cell [CNCC]). (W, X) Frontal sections showing histological images of cultured jaw without replacement (W) and with replacement (X). Arrows indicating tongue frenum region. Tongue frenum formation with replacement, n=1/5. Scale bars: 200 µm (A, B, L, M, N, O, R, S, U, W, X), 500 µm (C-E).
Figure 10—figure supplement 1
Tongue frenum formation in wild-type mice.
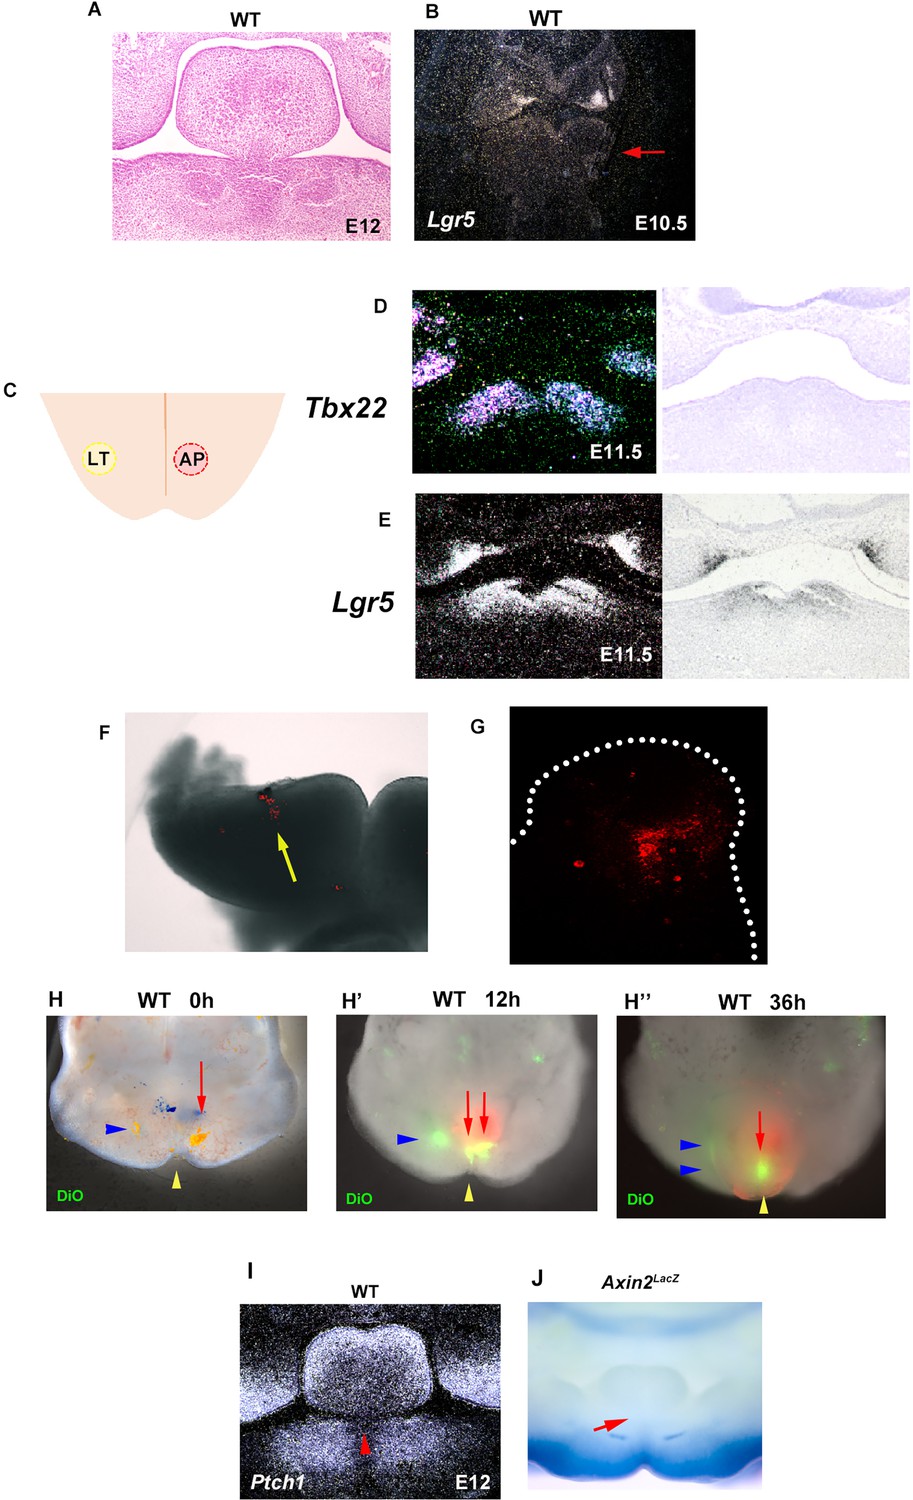
(A, B) Frontal section showing histological image (A) and in situ hybridization of Lgr5 (B) of tongue frenum (A) and mandible (B) in wild-type mice at embryonic day (E) 10.5 (B) and E12.5 (A). Arrow indicating mandible region. (C) Schematic diagram showing oral view of mandible with LT (yellow ceircle) and AP (right red circle) region, and midline (orange line). (D, E) Frontal sections showing in situ hybridization of Tbx22 (D) and Lgr5 (E) at E11.5. Left panels, dark field; right panels, bright fields. (F) Frontal image showing mandibular process with DID injection before culture. Arrow indicating DID. (G) Sagittal section showing mandible with DID after culture. Tongue was outlined by white dots. (H–H’’) Oral view of wild-type mandible with DiO injection (H, 0 hr, H’, 12 hr, H’’, 36 hr after injection). Blue arrowheads and red arrows indicating DiO at LT and AP region, respectively. Yellow arrowhead indicating midline. (I) Frontal sections showing in situ hybridization of Ptch1 at E12.5. (J) Frontal view of mandible in LacZ stained Axin2LacZ mice at E12.5. Arrows and arrowhead indicating tongue frenum region (E, F).
Additional files
Download links
A two-part list of links to download the article, or parts of the article, in various formats.
Downloads (link to download the article as PDF)
Open citations (links to open the citations from this article in various online reference manager services)
Cite this article (links to download the citations from this article in formats compatible with various reference manager tools)
Cell-cell interaction determines cell fate of mesoderm-derived cell in tongue development through Hh signaling
eLife 13:e85042.
https://doi.org/10.7554/eLife.85042


