Neurexins in serotonergic neurons regulate neuronal survival, serotonin transmission, and complex mouse behaviors
- Department of Neurobiology, University of Massachusetts Chan Medical School, United States
- Brudnick Neuropsychiatric Research Institute, University of Massachusetts, United States
- Medical Scientist Training Program, University of Massachusetts, United States
- Department of Anatomy, Faculty of Medicine, Hokkaido University, Japan
- Departments of Pharmacology and Biochemistry & Molecular Biology, Institute for Personalized Medicine, Pennsylvania State University College of Medicine, 500 University Drive, United States
- Vollum Institute, Oregon Health & Science University, United States
- Department of Animal Model Development, Brain Research Institute, Niigata University, Japan
- Department of Comparative and Experimental Medicine, Brain Research Institute, Niigata University, Japan
- Division of Gene Research, Research Center for Advanced Science, Shinshu University, Japan
- Institute for Biomedical Sciences, Interdisciplinary Cluster for Cutting Edge Research, Shinshu University, Japan
Figures
Figure 1 with 1 supplement
Nrxn expression in the raphe nuclei and confirmation of Nrxn deletion in Fev/RFP/NrxnTKO mice.
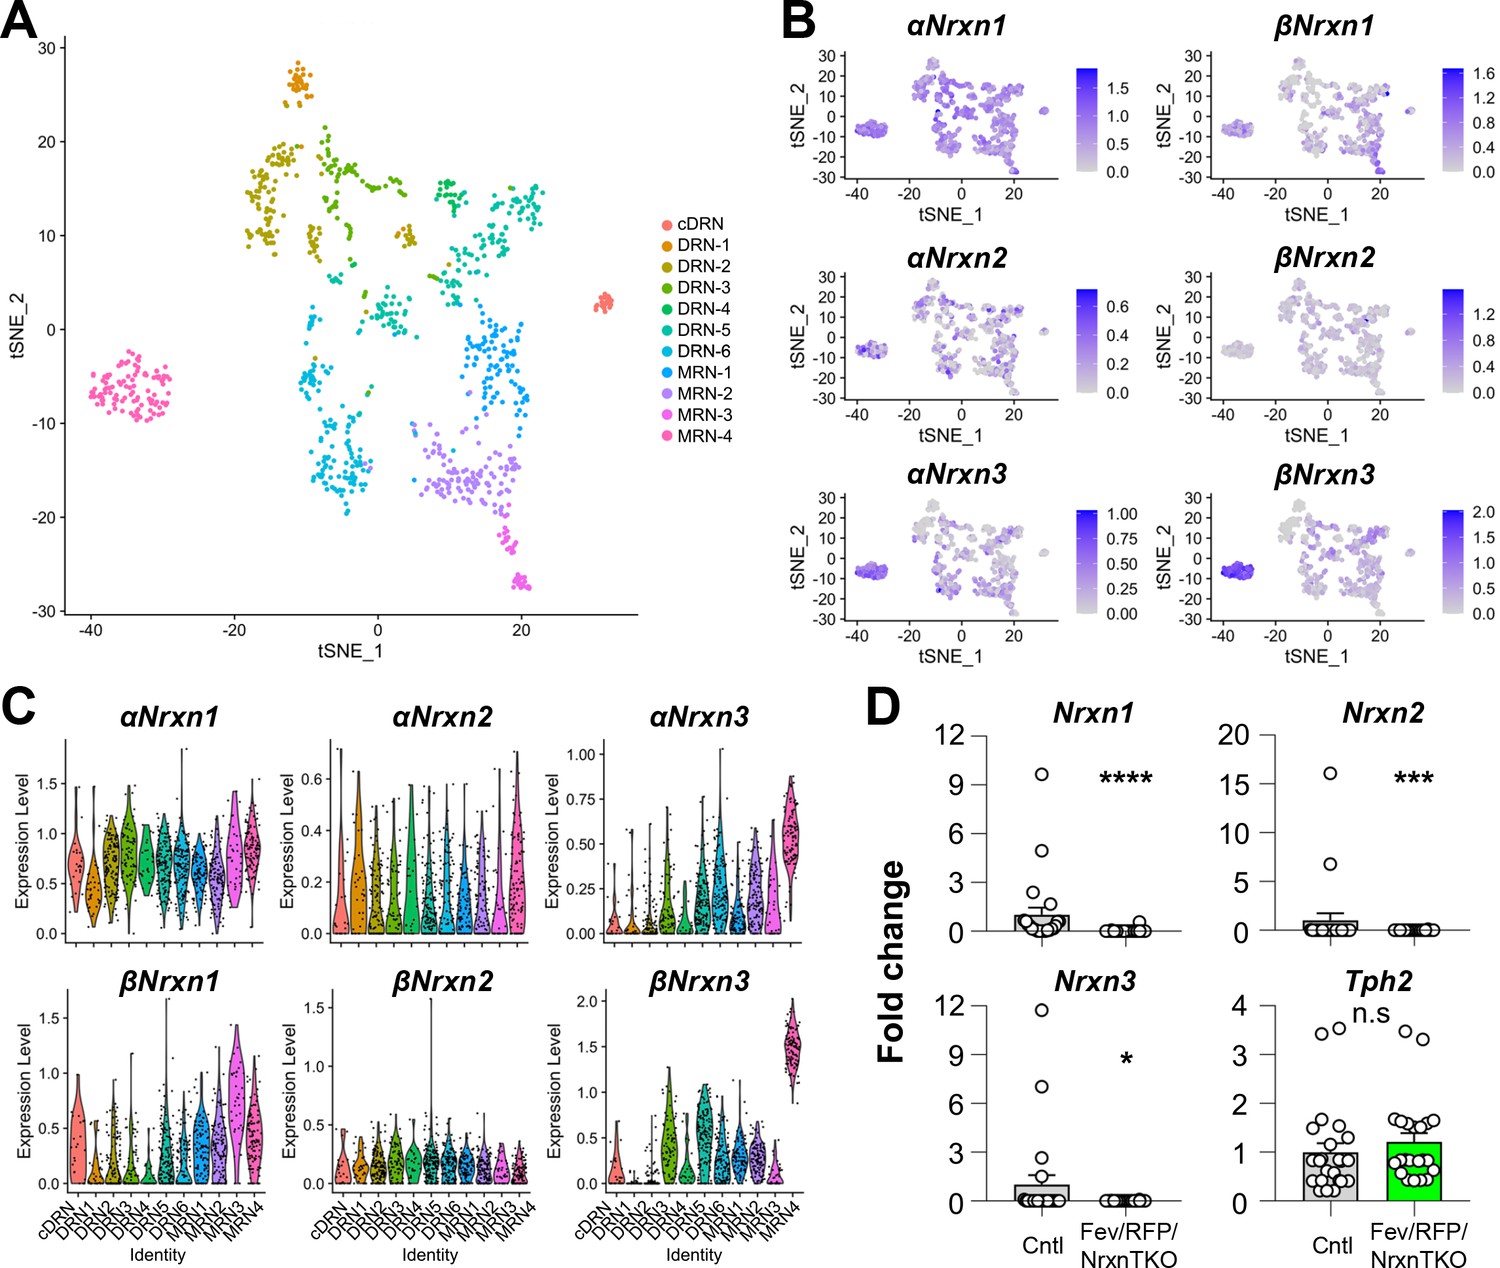
Single-cell transcriptomic analysis of Nrxn expression in dorsal raphe nucleus (DRN), caudal DRN (cDRN), and median raphe nucleus (MRN) 5-hydroxytryptamine (5-HT) neurons. (A) Single-cell t-SNE plot of 999 Tph2-positive neurons representing 5-HT neurons analyzed from a recent publication (Ren et al., 2019). Eleven transcriptomic clusters were correlated with anatomical location. DRN, cDRN, and MRN 5-HT neurons have six, one, and four different subclusters, respectively. (B) Single-cell t-SNE plots for the expression of six Nrxn isoforms in distinct 5-HT neuron populations. Cells are colored by log-normalized expression of each transcript, and the color legend reflects the expression values of ln(CPM + 1). (C) Violin plots of six Nrxn splice isoforms in 11 clusters. Although there are cluster-dependent Nrxn expression patterns (e.g., α and βNrxn3 expression in MRN4), each Nrxn isoform is expressed in cells across all clusters. (D) Validation of the Fev/RFP/NrxnTKO mouse line. Expression of Nrxn genes in tdTomato-positive 5-HT neurons were compared between Fev/RFP (Cntl) and Fev/RFP/NrxnTKO mice. qPCRs against Nrxn 1, 2, 3, Tph2, and Gapdh (internal control) were performed for single-cell cDNA libraries prepared from tdTomato-positive neurons. Number of neurons: Fev/RFP (n = 23 neurons, 4 mice) and Fev/RFP/NrxnTKO (22, 4). Data are reported as mean ± standard error of the mean (SEM). n.s., not significant, *p < 0.05, ***p < 0.001, ****p < 0.0001; Mann–Whitney U-test.
-
Figure 1—source code 1
Source code R file for t-distributed Stochastic Neighbor Embedding (tSNE) plots.
- https://cdn.elifesciences.org/articles/85058/elife-85058-fig1-code1-v1.zip
-
Figure 1—source data 1
Source meta data for Figure 1.
- https://cdn.elifesciences.org/articles/85058/elife-85058-fig1-data1-v1.zip
Figure 1—figure supplement 1

Validation of the Fev/RFP/NrxnTKO mouse line.
The expression of Nrxn2 and Nrxn3 genes in tdTomato-positive 5-hydroxytryptamine (5-HT) neurons were compared between Fev/RFP (Cntl) and Fev/RFP/NrxnTKO mice by dPCRs. Endpoint multiplex PCR was performed for each sample-targeted gene and the absolute copy numbers of Nrxn 2 and Nrxn3 (recorded by FAMTM signal) were normalized to that of TBP (recorded by HEX (VIC) signal). Number of neurons: Fev/RFP (n = 3, 3 mice) and Fev/RFP/NrxnTKO (3, 3). Data are reported as mean ± standard error of the mean (SEM). Mann–Whitney U-test.
Figure 2
The lack of Nrxns in 5-hydroxytryptamine (5-HT) neurons reduces evoked 5-HT release in the dorsal raphe nucleus (DRN) and hippocampus.
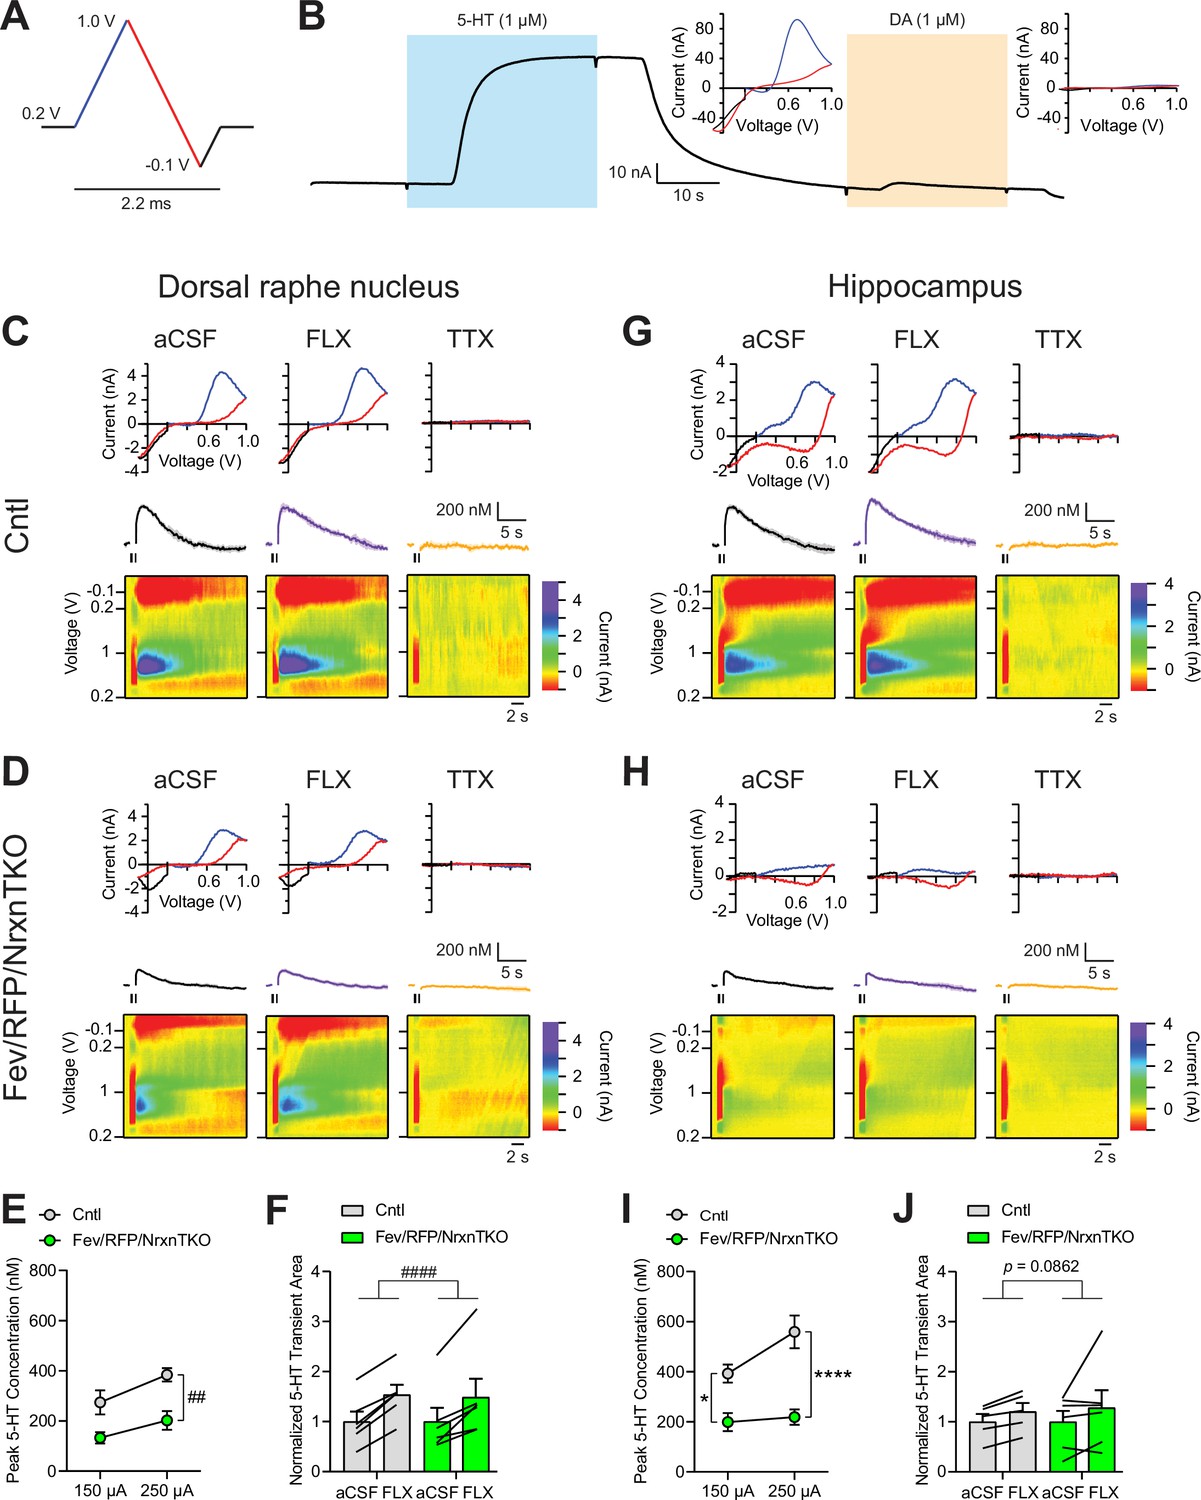
(A) Voltage ramp protocol for detecting 5-HT with fast-scan cyclic voltammetry (FSCV). Rapid cycling (2.2 ms) of the voltage ramp produced a current based on voltage-dependent oxidation (blue, oxi) and reduction (red) representing real-time 5-HT release. (B) Representative current traces when measuring 5-HT (1 µM, blue) or dopamine (DA; 1 µM, orange) using carbon-fiber microelectrodes calibrated on a 5-HT voltage ramp. Insets: Background-subtracted current–voltage (CV) plots of the electrochemical current when 5-HT (left) or DA (right) was applied. Electrically evoked 5-HT transients detected in the DRN of littermate control (Cntl) (n = 6 slices, 3 mice) (C) and Fev/RFP/NrxnTKO (6, 3) (D) mice during perfusion with artificial cerebrospinal fluid (aCSF) (left), serotonin transporter (SERT) blocker fluoxetine (FLX, 10 µM, middle), and action potential-blocking tetrodotoxin (TTX; 1 µM, right). Top: representative CV plots of the electrochemical current in aCSF, FLX, and TTX. Middle: average 5-HT transients under each condition. Bottom: background-subtracted 3D voltammograms (false color scale) as a function of time (x-axis, 20 s) and voltage applied (y-axis). Note that TTX completely abolished peak transients indicating that FSCV measurements were mediated by action potential-induced 5-HT release. The expected oxidation peaks for 5-HT in the CV plots acquired from Cntl and Fev/RFP/NrxnTKO mice were similar. FLX application prolonged 5-HT transient area which verified that the FSCV transients detected 5-HT signals. Cntl and Fev/RFP/NrxnTKO mice showed similar responses to FLX. (E) Peak amplitude of 5-HT transients evoked using a 150- or 250-µA stimulation train (30 pulses, 30 Hz, 1 ms) in the DRN of Cntl (gray) and Fev/RFP/NrxnTKO (green) mice. 5-HT release was significantly different between genotypes (two-way repeated measures analysis of variance [ANOVA]: genotype main effect, F1,10 = 12.02, ##p = 0.006; stimulation strength main effect, F1,10 = 26.89, p = 0.0004; stimulus strength × genotype interaction, F1,10 = 1.936, p = 0.2648). (F) Normalized area of 5-HT transients recorded in the DRN before and after FLX application. 5-HT transient area before and after FLX was significantly different (two-way repeated measures ANOVA: drug main effect, F1,10 = 63.88, ####p < 0.0001; genotype main effect, F1,10 = 0.004378, p = 0.9486; drug × genotype interaction, F1,10 = 0.1492, p = 0.7074). Electrically evoked 5-HT transients detected in the hippocampus of Cntl (n = 3) (G) and Fev/RFP/NrxnTKO (n = 3) (H) mice during perfusion with aCSF (left), SERT blocker FLX (10 µM, middle), and action potential-blocking TTX (1 µM, right). Top: representative CV plots of the electrochemical current in aCSF, FLX, and TTX. Middle: average 5-HT transients under each condition. Bottom: background-subtracted 3D voltammograms (false color scale) as a function of time (x-axis, 20 s) and voltage applied (y-axis). (I) Peak amplitude of 5-HT transients evoked using a 150- or 250-µA stimulation train in the hippocampus of Cntl and Fev/RFP/NrxnTKO mice. 5-HT release at each stimulation strength was significantly different between groups (two-way repeated measures ANOVA with Šidák’s post hoc test following significant stimulation strength × genotype interaction, F1,9 = 6.982, p = 0.0268; stimulation strength main effect, F1,9 = 11.24, p = 0.0085; genotype main effect, F1,9 = 24.56, p = 0.0008). (J) Normalized area of 5-HT transients recorded in the hippocampus before and after FLX application. 5-HT transient area before and after FLX differed in Cntl mice (two-way repeated measures ANOVA: drug main effect, F1,9 = 3.711, p = 0.0862 genotype main effect, F1,9 = 0.01351, p = 0.91; drug × genotype interaction, F1,9 = 0.09308, p = 0.7672). n.s., not significant, *p < 0.05, ****p < 0.0001; Cntl vs. Fev/RFP/NrxnTKO: ##p < 0.01; aCSF vs. FLX: ####p < 0.0001.
-
Figure 2—source data 1
Source data for fast-scan cyclic voltammetry (FSCV) plots in Figure 2E, F, I, J.
- https://cdn.elifesciences.org/articles/85058/elife-85058-fig2-data1-v1.xlsx
Figure 3 with 2 supplements
The absence of Nrxns in 5-hydroxytryptamine (5-HT) neurons decreases 5-HT fiber density, neuron number, and release sites.
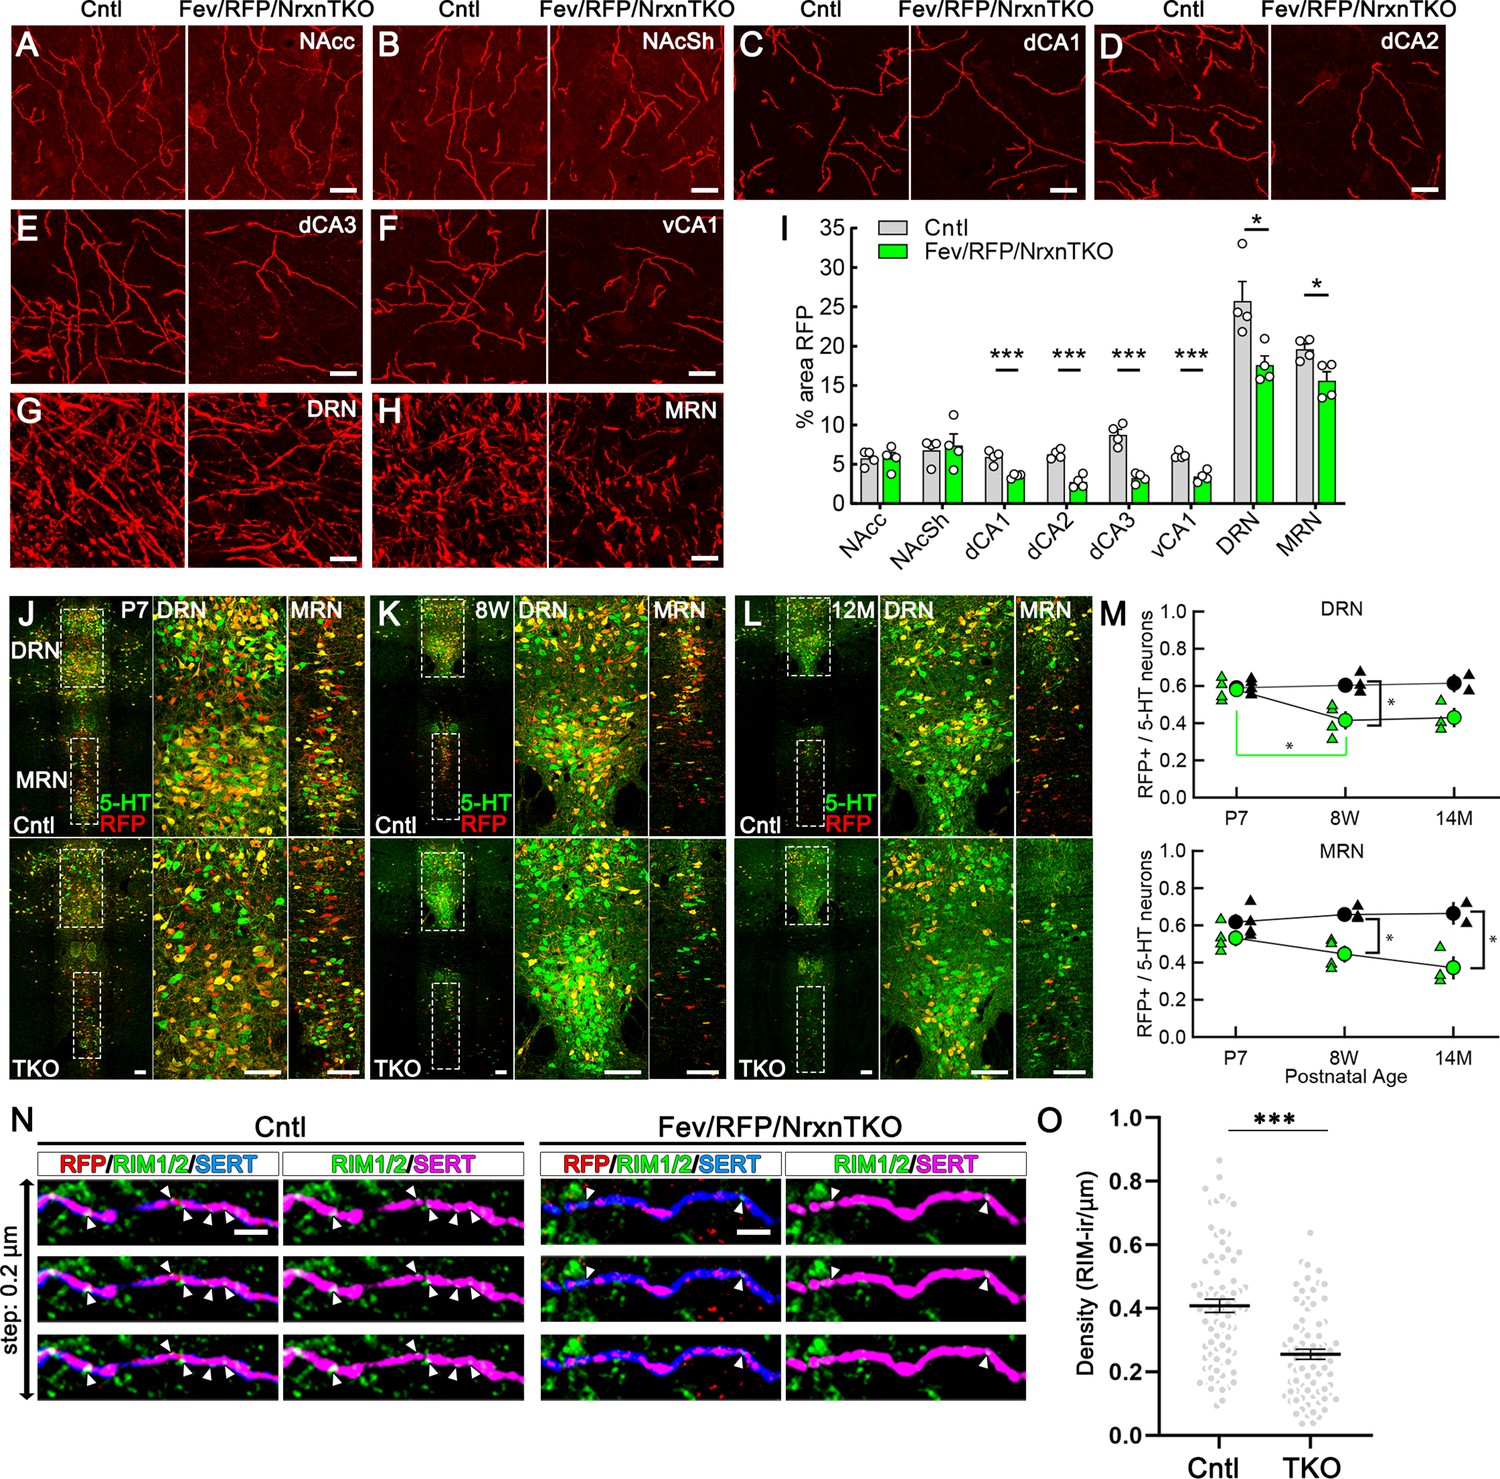
Representative ×100 images of RFP-positive fibers in the nucleus accumbens core (NAcc) (A), nucleus accumbens shell (NAcSh) (B), dorsal hippocampal CA1–3 subregions (dCA1, 2, 3) (C–E), ventral hippocampal CA1 (vCA1) (F), dorsal raphe nucleus (DRN) (G), and median raphe nucleus (MRN) (H). (I) Quantification of the area of RFP-positive fibers revealed that 5-HT innervation was altered in specific brain regions in mice lacking Nrxns (n = 4 mice/genotype; for each mouse, 6 fields of view were averaged for each region). *p < 0.05, ***p < 0.001; unpaired two-tailed Student’s t-test. Scale bars, 10 µm. (J–M) Relative proportion of RFP-expressing 5-HT neurons in the DRN and MRN between Fev/RFP (Cntl, top row) and Fev/RFP/NrxnTKO (triple knockout, TKO, bottom row) mice at different ages: postnatal day 7 (P7) (J), 8 weeks (K), and >14 months old (L). (M) Quantification of RFP+ neurons as a fraction of 5-HT+ (green) neurons at three different postnatal ages. Note that the RFP+/5-HT ratio in TKO mice decreased with aging, suggesting that TKO in 5-HT neurons causes postnatal cell death. The numbers of Cntl and TKO mice were (postnatal age, number of mice): Cntl: P7 and 8 w, 4 and 12–13 M, 2; TKO: P7 and 8 w, 4 and 12–13 M, 3. *p < 0.05, two-way analysis of variance (ANOVA) (N, O). (N) Three consecutive triple immunofluorescence images with 200 nm step for RFP, RIM1/2, and serotonin transporter (SERT) obtained from Fev/RFP (Cntl, left) and TKO (right) brains. (O) Summary of RIM1/2 signal density between Cntl and TKO hippocampal CA3 region. ***p < 0.0001; unpaired two-tailed Student’s t-test. Scale bars, 10 µm (A–H), 100 µm (J–L), and 2 µm (N).
-
Figure 3—source data 1
Source data for plots in Figure 3I and M, and Figure 3—figure supplement 1.
- https://cdn.elifesciences.org/articles/85058/elife-85058-fig3-data1-v1.zip
Figure 3—figure supplement 1

The absence of Nrxns in 5-hydroxytryptamine (5-HT) neurons reduces serotonin transporter (SERT) expression.
Two brain regions brainstem and hippocampus were dissected from Fev/RFP/NrxnTKO (triple knockout, TKO) and littermate control (Cntl) brains (n = 6/genotype) and immunoblotted with anti-SERT and β-actin (βAct) antibodies. The graph shows SERT immunoblot intensity divided by βAct. Data are reported as mean ± standard error of the mean (SEM). **p < 0.01; unpaired two-tailed Student’s t-test.
-
Figure 3—figure supplement 1—source data 1
Source data blots.
- https://cdn.elifesciences.org/articles/85058/elife-85058-fig3-figsupp1-data1-v1.pdf
-
Figure 3—figure supplement 1—source data 2
Unedited blotting images for brainstem and hippocampal (Hip) P2 proteins.
- https://cdn.elifesciences.org/articles/85058/elife-85058-fig3-figsupp1-data2-v1.pdf
Figure 3—figure supplement 2
The expression of RIM1/2 in 5-hydroxytryptamine (5-HT) fibers in 100 nm ultra-thin sections.
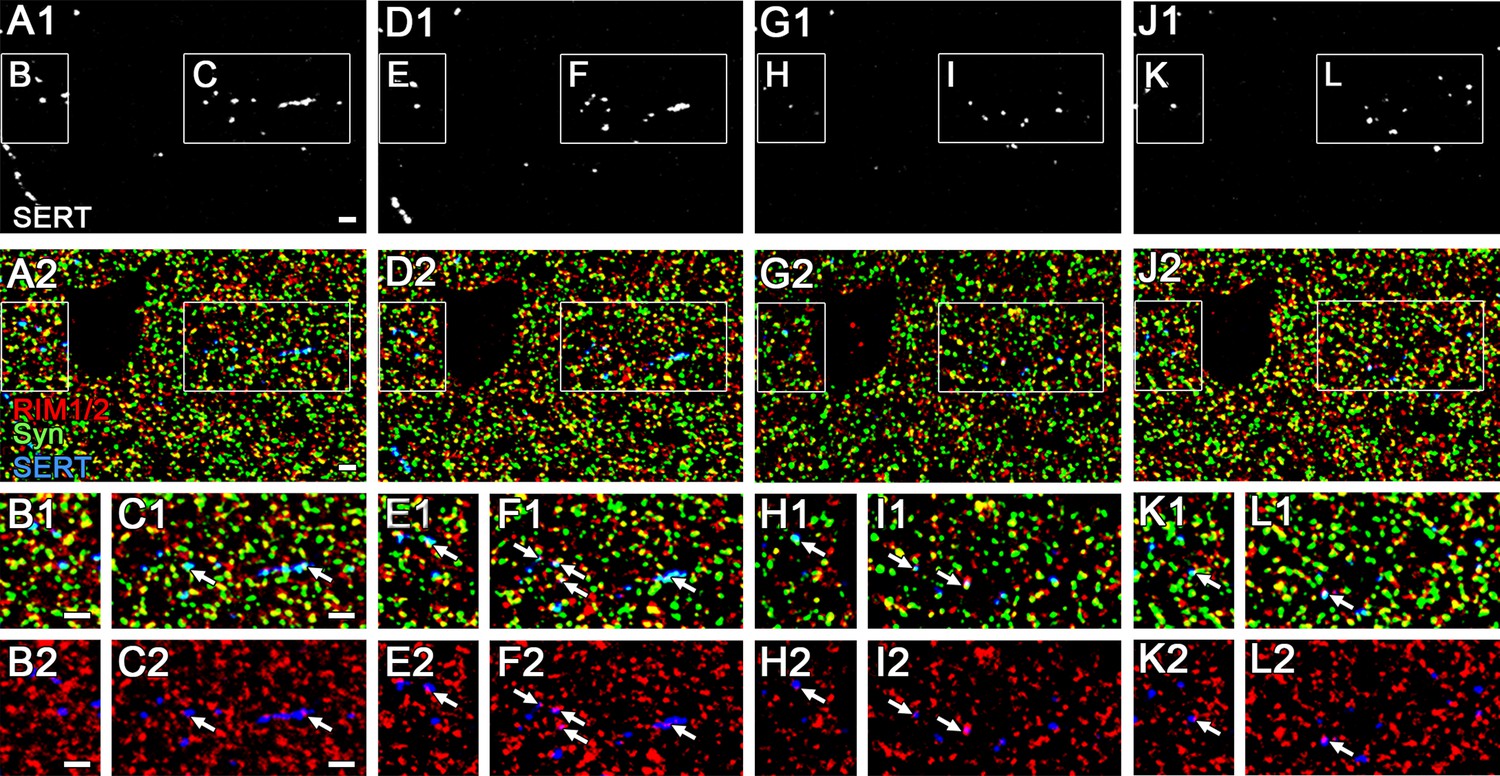
Triple immunofluorescence images for RIM1/2, synaptophysin (Syn), and serotonin transporter (SERT) obtained from four consecutive 100 nm ultra-thin sections (first slice: A–C, second: D–F, third: G–I, fourth: J–L) in Cntl dorsal hippocampal CA3 region. The boxed area in low magnification images (A, D, G, J) is enlarged in the lower panels (B, C, E, F, H, I, K, L). Arrows indicate RIM1/2 immunofluorescent puncta associated with Syn and SERT. Scale bars, 2 µm.
Figure 4 with 3 supplements
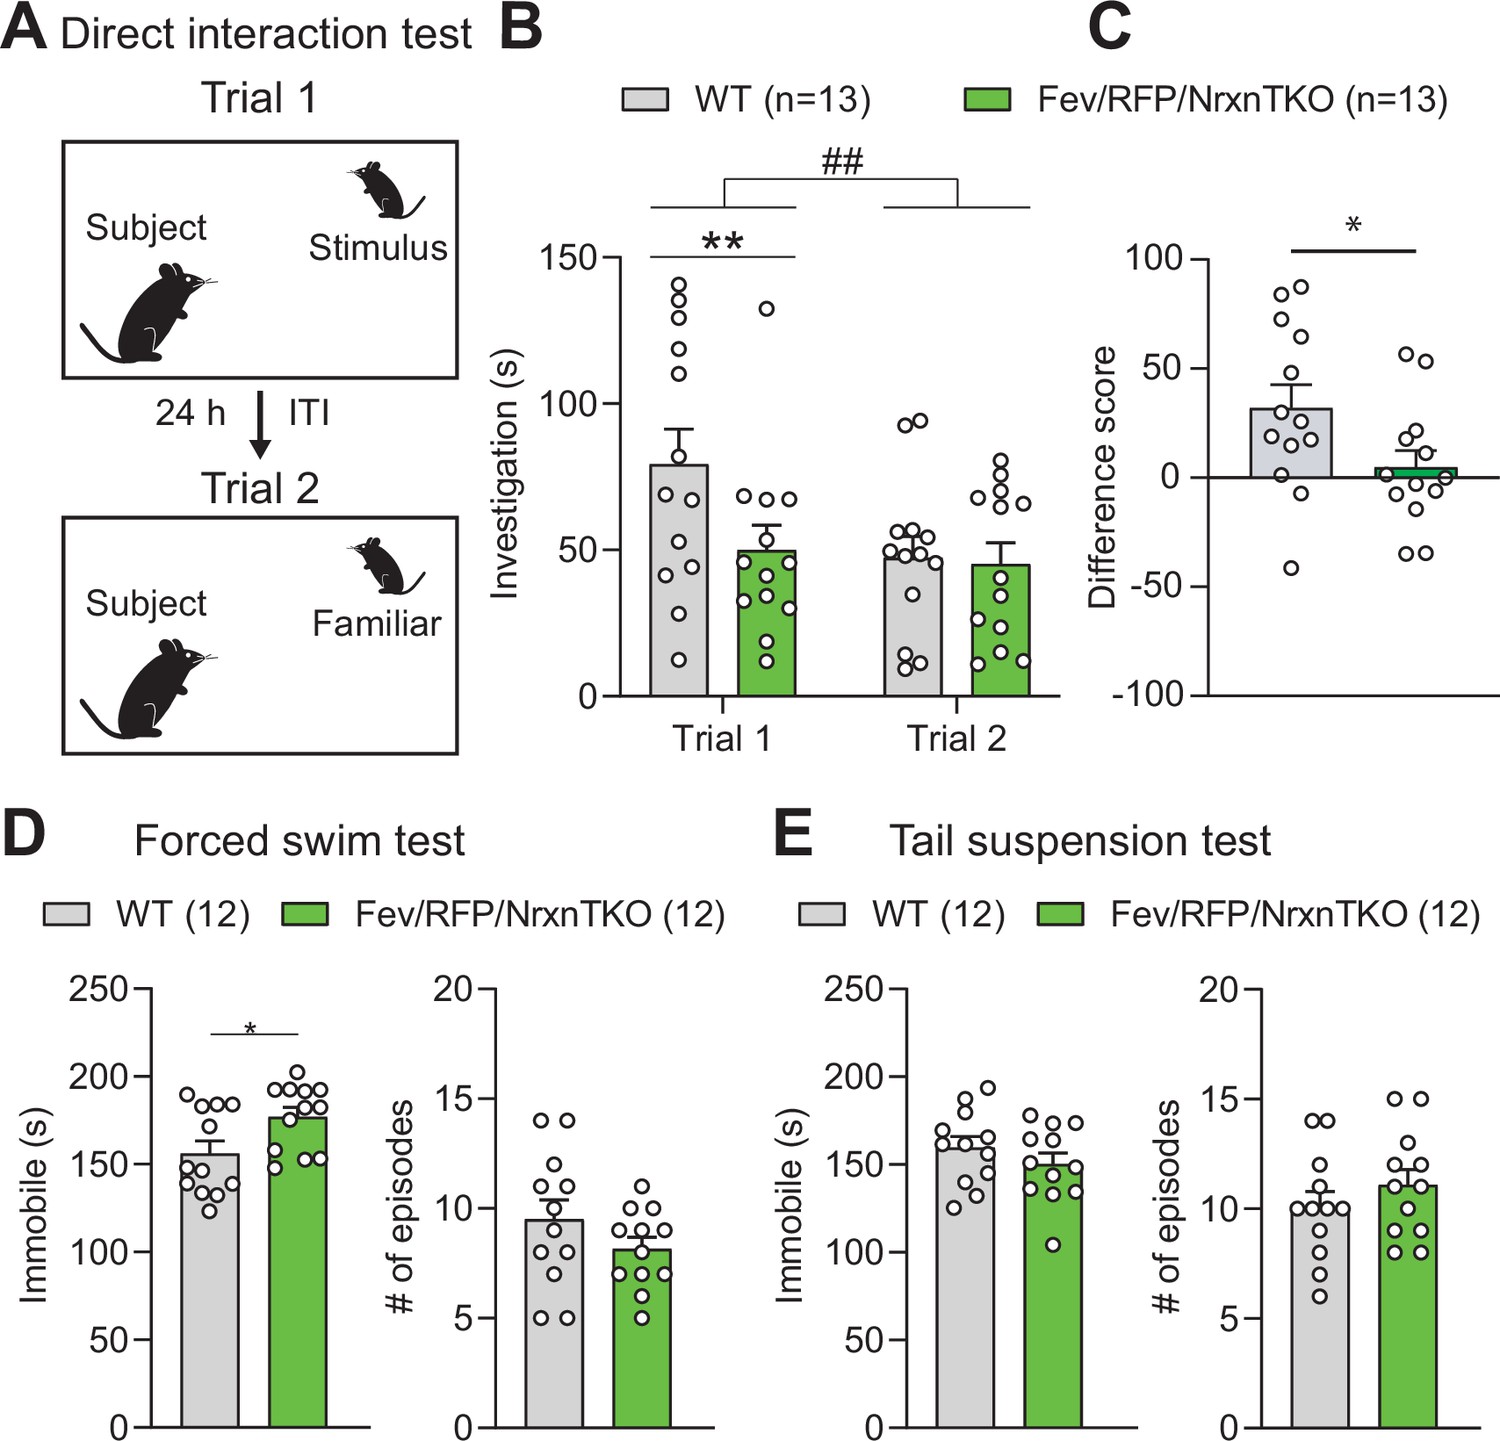
The absence of Nrxns in 5-hydroxytryptamine (5-HT) neurons impairs social behavior.
(A) Direct social interaction test using the same juvenile stimulus across two trials. (B) Littermate control (Cntl) (gray, n = 13) and Fev/RFP/NrxnTKO (green, n = 13) mice differed in their investigation of the juvenile stimulus across the two trials. Both groups spent less time exploring the juvenile stimulus during trial 2 than in trial 1 (two-way repeated measures analysis of variance [ANOVA]: trial main effect, F1,24 = 7.855, ##p = 0.0099; genotype main effect, F1,24 = 2.086, p = 0.1616; significant trial × genotype interaction, F1,24 = 4.344, p = 0.0479). Šidák’s post hoc test identified a significant genotype difference in investigation time in trial 1 (**p = 0.0041). (C) The difference score of the interaction time across trials was reduced in Fev/RFPNrxnTKO mice (unpaired two-tailed Student’s t-test: t24 = 2.084, *p = 0.0479). (D) Left, Fev/RFP/NrxnTKO mice displayed increased immobile time compared with Cntl in the forced swim test (unpaired two-tailed Student’s t-test: t22 = 2.317, *p = 0.0302). Right, no difference in the number of immobile episodes was observed (unpaired two-tailed Student’s t-test: t22 = 1.301, p = 0.2068). (E) Left, Cntl (n = 12) and Fev/RFP/NrxnTKO (n = 12) mice showed no difference in time immobile in the tail suspension test (unpaired two-tailed Student’s t-test: t22 = 1.070, p = 0.2964). Right, there was no difference between genotypes in the number of immobile episodes (unpaired two-tailed Student’s t-test: t22 = 1.001, p = 0.3279).
-
Figure 4—source data 1
Source data for Figure 4.
- https://cdn.elifesciences.org/articles/85058/elife-85058-fig4-data1-v1.xlsx
Figure 4—figure supplement 1
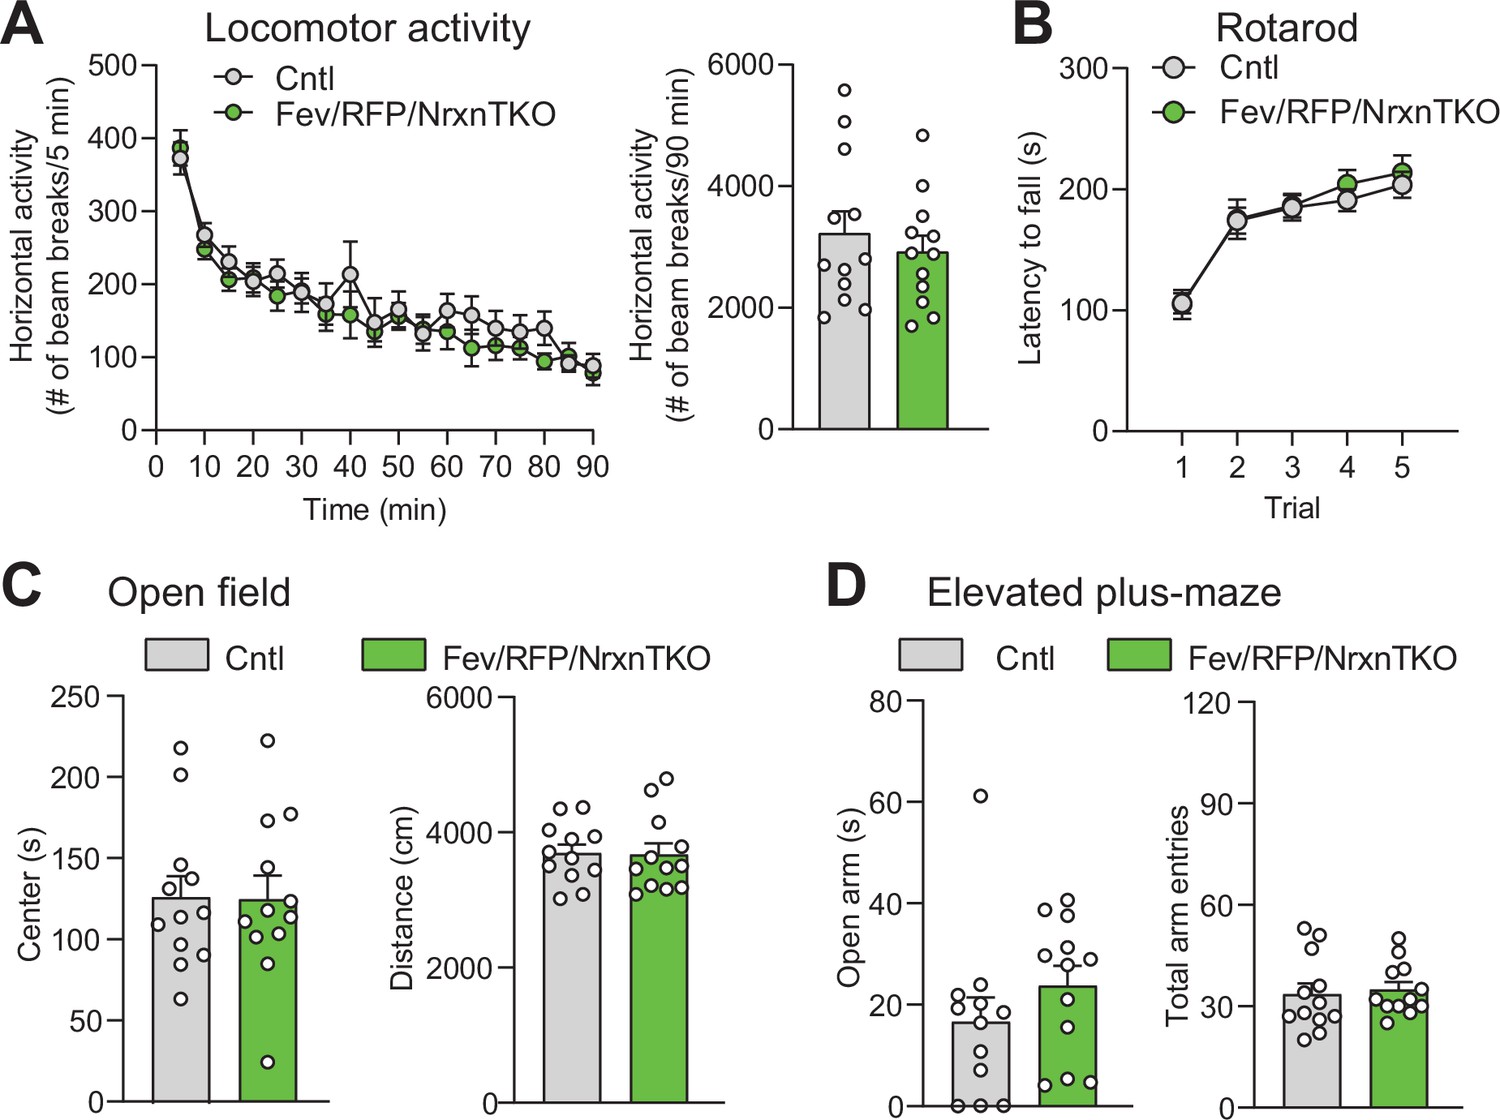
5-Hydroxytryptamine (5-HT) neuron-specific Nrxn TKO does not alter basic behavioral activities.
(A) Left, Cntl (n = 12) and Fev/RFP/NrxnTKO (n = 12) mice showed no differences in horizontal locomotor activity (two-way repeated measures analysis of variance [ANOVA]: genotype main effect, F1,22 = 0.4666, p = 0.5017; time × genotype interaction, F17,374 = 0.9467, p = 0.5188). Right, cumulative locomotor activity did not differ between Cntl and Fev/RFP/NrxnTKO mice over the 90-min period (unpaired two-tailed Student’s t-test: t22 = 0.6831, p = 0.5017). (B) Cntl (n = 16) and Fev/RFP/NrxnTKO (n = 13) mice showed no differences in latency to fall over five trials of accelerating rotarod (two-way repeated measures ANOVA: genotype main effect, F1,27 = 0.2204, p = 0.6425; trial × genotype interaction, F4,108 = 0.2161, p = 0.929; trial main effect: F(2.943,79.47) = 37.52, p < 0.0001). (C) Left, Cntl (n = 12) and Fev/RFP/NrxnTKO (n = 12) mice showed no differences in time spent in the center of the open field arena (unpaired two-tailed Student’s t-test: t22 = 0.04652, p = 0.9633). Right, there were no differences for the distance traveled during open field (unpaired two-tailed Student’s t-test: t22 = 0.1053, p = 0.9171). (D) Left, the time Cntl (n = 12) and Fev/RFP/NrxnTKO (n = 12) mice spent in the open arms during the elevated-plus maze was similar between genotypes (unpaired two-tailed Student’s t-test: t22 = 1.158, p = 0.2592). Right, Cntl (n = 12) and Fev/RFP/NrxnTKO (n = 12) mice both demonstrated similar total arm entries (unpaired two-tailed Student’s t-test: t22 = 0.3625, p = 0.7204). n.s.: not significant.
Figure 4—figure supplement 2
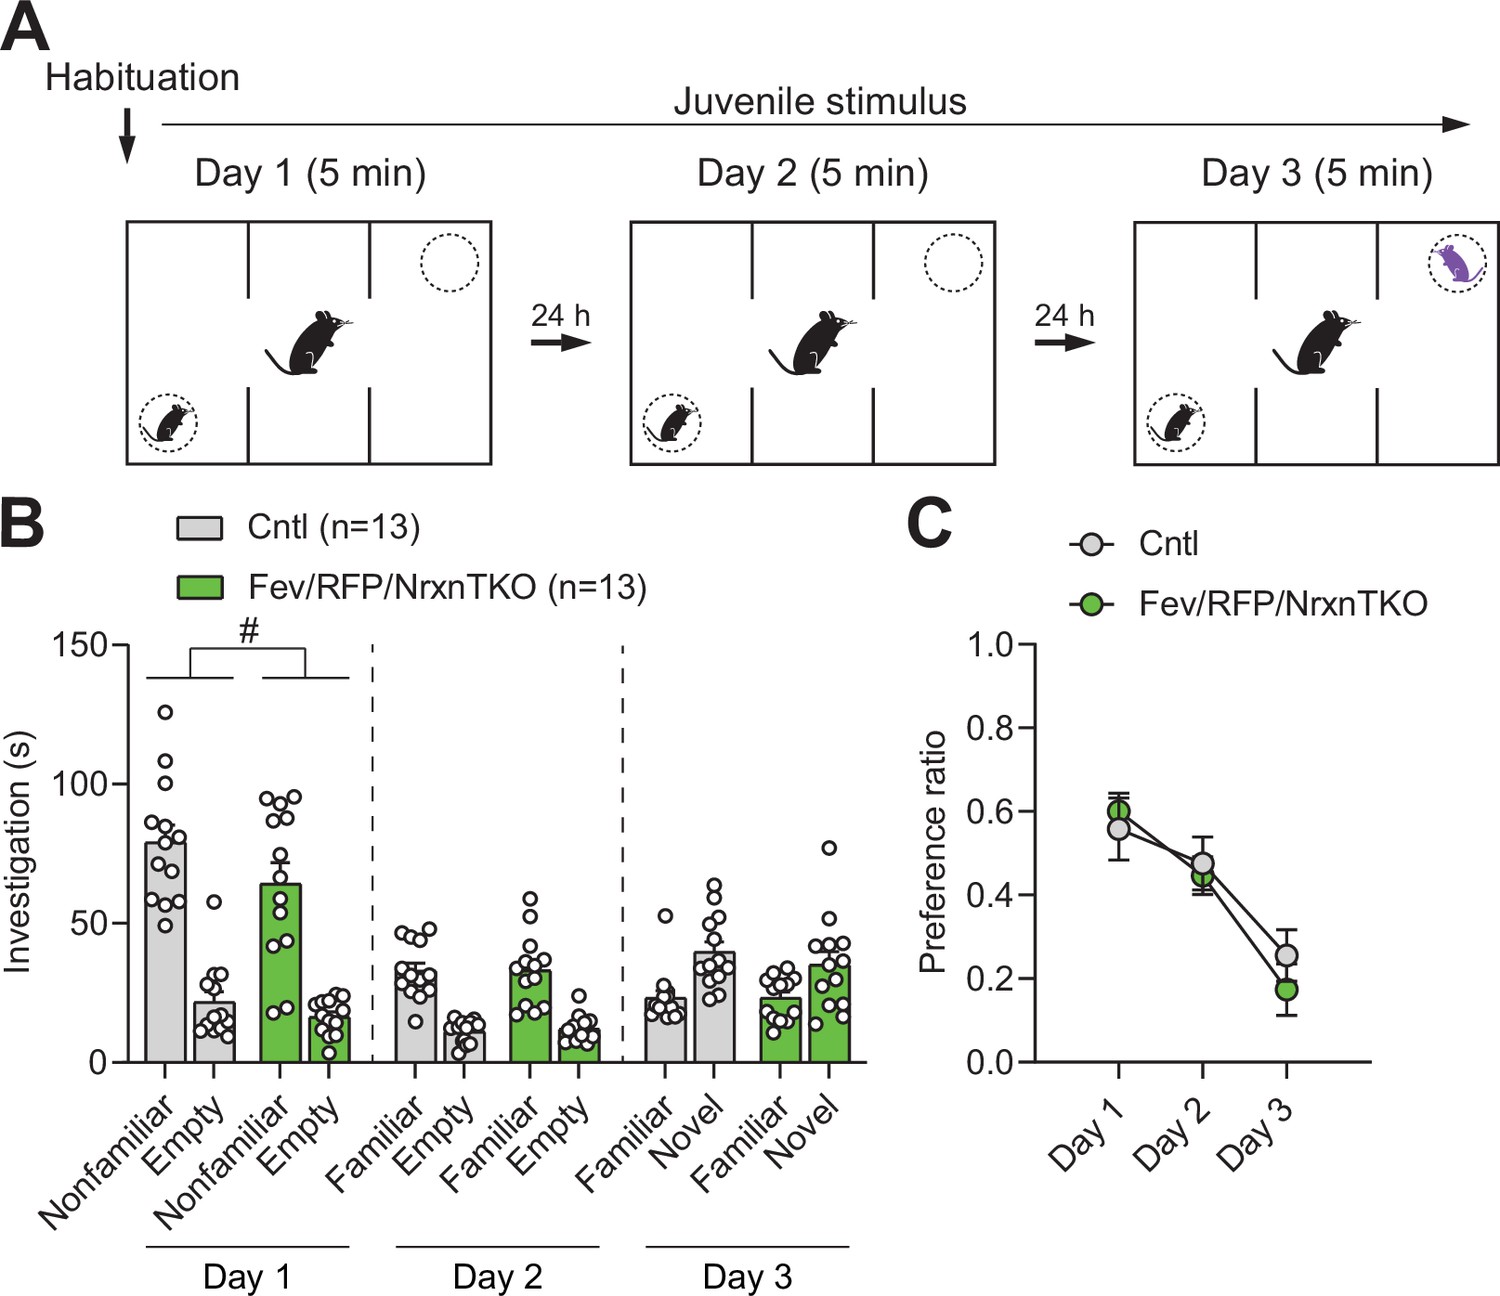
Social behavior in the three-chamber social interaction test is preserved in Fev/RFP/NrxnTKO mice.
(A) Protocol for three-chamber social interaction test. (B) Littermate Cntl (n = 13) and Fev/RFP/NrxnTKO (n = 13) preferred the social stimulus over the nonsocial stimulus on day 1 (two-way repeated measures analysis of variance [ANOVA]: stimulus main effect, F1,24 = 77.08, p < 0.0001; stimulus × genotype interaction, F1,24 = 0.6324, p = 0.4243) and day 2 (two-way repeated measures ANOVA: stimulus main effect, F1,24 = 83.16, p < 0.0001; stimulus × genotype interaction, F1,24 = 0.03609, p = 0.8509). Both groups preferred the novel stimulus over the familiar stimulus on day 3 (two-way repeated measures ANOVA: stimulus main effect, F1,24 = 18.3, p = 0.0003; stimulus × genotype interaction, F1,24 = 0.4758, p = 0.4969). Genotype differences were observed only on day 1 (two-way repeated measures ANOVA on day 1: genotype main effect, F1,24 = 4.798, #p = 0.0384; day 2: genotype main effect, F1,24 = 0.05209, p = 0.8214; day 3: genotype main effect, F1,24 = 0.4063, p = 0.5299). (C) The preference ratio for a social stimulus differed across days (two-way repeated measures ANOVA: day main effect, F1.951,46.82 = 20.67, p < 0.0001), but no differences were seen between groups (two-way repeated measures ANOVA: genotype main effect, F1,24 = 0.1992, p = 0.6594; day × genotype interaction, F2,48 = 0.5837, p = 0.5617).
Figure 4—figure supplement 3
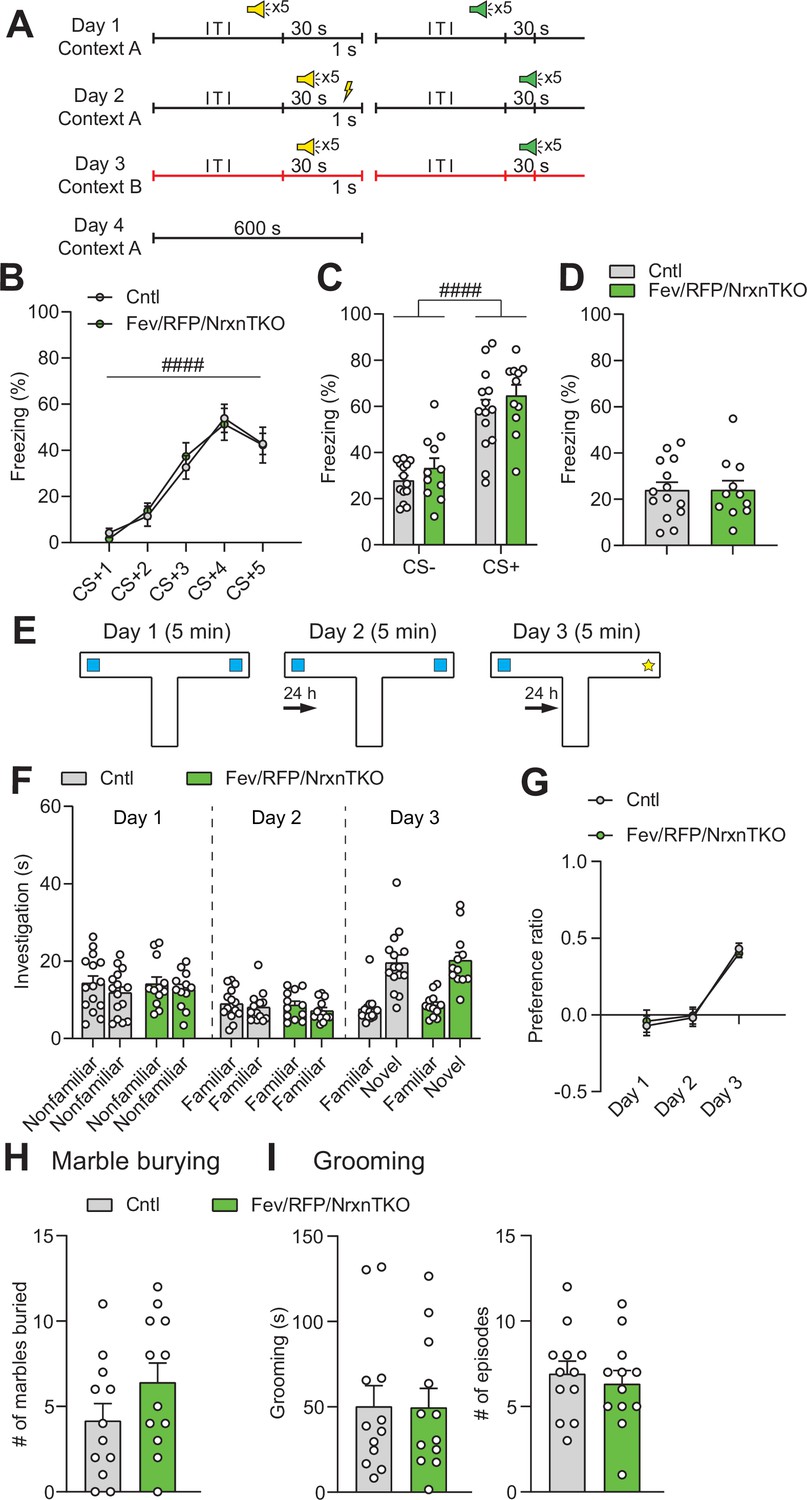
5-Hydroxytryptamine (5-HT) neuron-specific Nrxn TKO mice display normal learning and memory and repetitive behaviors.
(A) Protocol for fear conditioning. Fear conditioning was p×erformed over 4 days. Mice were presented with two different auditory cues, one paired (yellow speaker) with a foot shock (yellow thunderbolt) and one unpaired (green speaker). ITI: intertrial interval. (B) Cntl (n = 14) and Fev/RFP/NrxnTKO (n = 11) mice both showed differences in freezing behavior across the presentations associated with the foot shock (CS+) (two-way repeated measures analysis of variance [ANOVA]: stimulus main effect, F2.607,59.97 = 45.06, ####p < 0.0001). No differences were seen between groups (two-way repeated measures ANOVA: genotype main effect, F1,23 = 0.00339, p = 0.9541; stimulus × genotype interaction, F4,92 = 0.2652, p = 0.8996). (C) Among Cntl and Fev/RFP/NrxnTKO, freezing to the CS+ was increased relative to the CS− (stimulus with no association between auditory cue and foot shock) (two-way repeated measures ANOVA: stimulus main effect, F1,23 = 85.22, ####p < 0.0001), but no differences were detected between groups (two-way repeated measures ANOVA: genotype main effect, F1,23 = 1.67, p = 0.2091; stimulus × genotype interaction, F1,23 = 0.03121, p = 0.8613). (D) Fev/RFP/NrxnTKO mice showed no altered freezing behavior during contextual recall (unpaired two-tailed Student’s t-test: t23 = 0.01457, p = 0.9885). (E) Protocol for object interaction test. (F) Cntl (n = 15) and Fev/RFP/NrxnTKO (n = 12) showed no preference for identical objects on day 1 (two-way repeated measures ANOVA: stimulus main effect, F1,25 = 2.606, p = 0.119; genotype main effect, F1,25 = 0.02422, p = 0.8776; stimulus × genotype interaction, F1,25 = 0.1923, p = 0.6648) and day 2 (two-way repeated measures ANOVA: stimulus main effect, F1,25 = 3.18, p = 0.0867; genotype main effect, F1,25 = 0.27, p = 0.6079; stimulus × genotype interaction, F1,25 = 0.1825, p = 0.6729) and preferred the novel object over the familiar object on day 3 (two-way repeated measures ANOVA: stimulus main effect, F1,25 = 129.6, p < 0.0001; genotype main effect, F1,25 = 0.1452, p = 0.7064; stimulus × genotype interaction, F1,25 = 0.03164, p = 0.8603). (G) The preference ratio for the objects differed across days (two-way repeated measures ANOVA: day main effect, F1.932,48.3 = 47.7, p < 0.0001), but no differences were seen between groups (two-way repeated measures ANOVA: genotype main effect, F2,50 = 0.008519, p = 0.9272; day × genotype interaction, F2,50 = 0.1781, p = 0.8374). (H) Cntl (n = 12) and Fev/RFP/NrxnTKO (n = 12) mice showed no differences in the number of marbles buried (unpaired two-tailed Student’s t-test: t22 = 1.491, p = 0.1502). (I) Left, no differences in grooming time were observed between groups (unpaired two-tailed Student’s t-test: t22 = 0.04104, p = 0.9676). Right, the number of grooming episodes was similar between groups (unpaired two-tailed Student’s t-test: t22 = 0.5443, p = 0.5917).
Tables
Table 1
Nrxn transcript IDs used for quantification.
| ENSMUST00000072671.13 | αNrxn1 |
|---|---|
| ENSMUST00000160844.9 | αNrxn1 |
| ENSMUST00000174331.7 | αNrxn1 |
| ENSMUST00000159778.7 | βNrxn1 |
| ENSMUST00000174337.7 | βNrxn1 |
| ENSMUST00000161402.9 | αNrxn1 |
| ENSMUST00000054059.14 | αNrxn1 |
| ENSMUST00000172466.7 | βNrxn1 |
| ENSMUST00000160800.8 | αNrxn1 |
| ENSMUST00000113462.7 | αNrxn2 |
| ENSMUST00000236635.1 | αNrxn2 |
| ENSMUST00000113461.7 | αNrxn2 |
| ENSMUST00000235714.1 | αNrxn2 |
| ENSMUST00000137166.7 | αNrxn2 |
| ENSMUST00000167734.7 | αNrxn3 |
| ENSMUST00000190626.6 | αNrxn3 |
| ENSMUST00000167103.7 | αNrxn3 |
| ENSMUST00000057634.13 | αNrxn3 |
| ENSMUST00000238943.1 | βNrxn3 |
| ENSMUST00000110133.8 | βNrxn3 |
| ENSMUST00000110130.3 | βNrxn3 |
| ENSMUST00000167887.7 | αNrxn3 |
Additional files
Download links
A two-part list of links to download the article, or parts of the article, in various formats.
Downloads (link to download the article as PDF)
Open citations (links to open the citations from this article in various online reference manager services)
Cite this article (links to download the citations from this article in formats compatible with various reference manager tools)
Neurexins in serotonergic neurons regulate neuronal survival, serotonin transmission, and complex mouse behaviors
eLife 12:e85058.
https://doi.org/10.7554/eLife.85058


