Evidence for embracing normative modeling
- Department of Cognitive Neuroscience, Radboud University Nijmegen Medical Centre, Netherlands
- Donders Institute, Radboud University Nijmegen, Netherlands
- Department of Psychiatry, University of Michigan-Ann Arbor, United States
- Department of Psychology, University of Michigan-Ann Arbor, United States
- Department of Philosophy, University of Michigan-Ann Arbor, United States
- Center for Functional MRI of the Brain (FMRIB), Nuffield Department for Clinical Neuroscience, Welcome Centre for Integrative Neuroimaging, Oxford University, United Kingdom
- Department of Psychiatry, Radboud University Nijmegen Medical Centre, Netherlands
Figures
Figure 1

Overview of workflow.
(A) Datasets included the Human Connectome Project (young adult) study, the University of Michigan schizophrenia study, and the Center for Biomedical Research Excellence (COBRE) schizophrenia study. (B) Openly shared, pre-trained on big data, normative models were estimated for large-scale resting-state functional brain networks and cortical thickness. (C) Deviation (Z) scores and raw data, for both functional and structural data, were input into three benchmarking tasks: 1. group difference testing, 2. support vector machine (SVM) classification, and 3. regression (predicting cognition). (D) Evaluation metrics were calculated for each benchmarking task. These metrics were calculated for the raw data models and the deviation score models. The difference between each models’ performance was calculated for both functional and structural modalities.
Figure 2
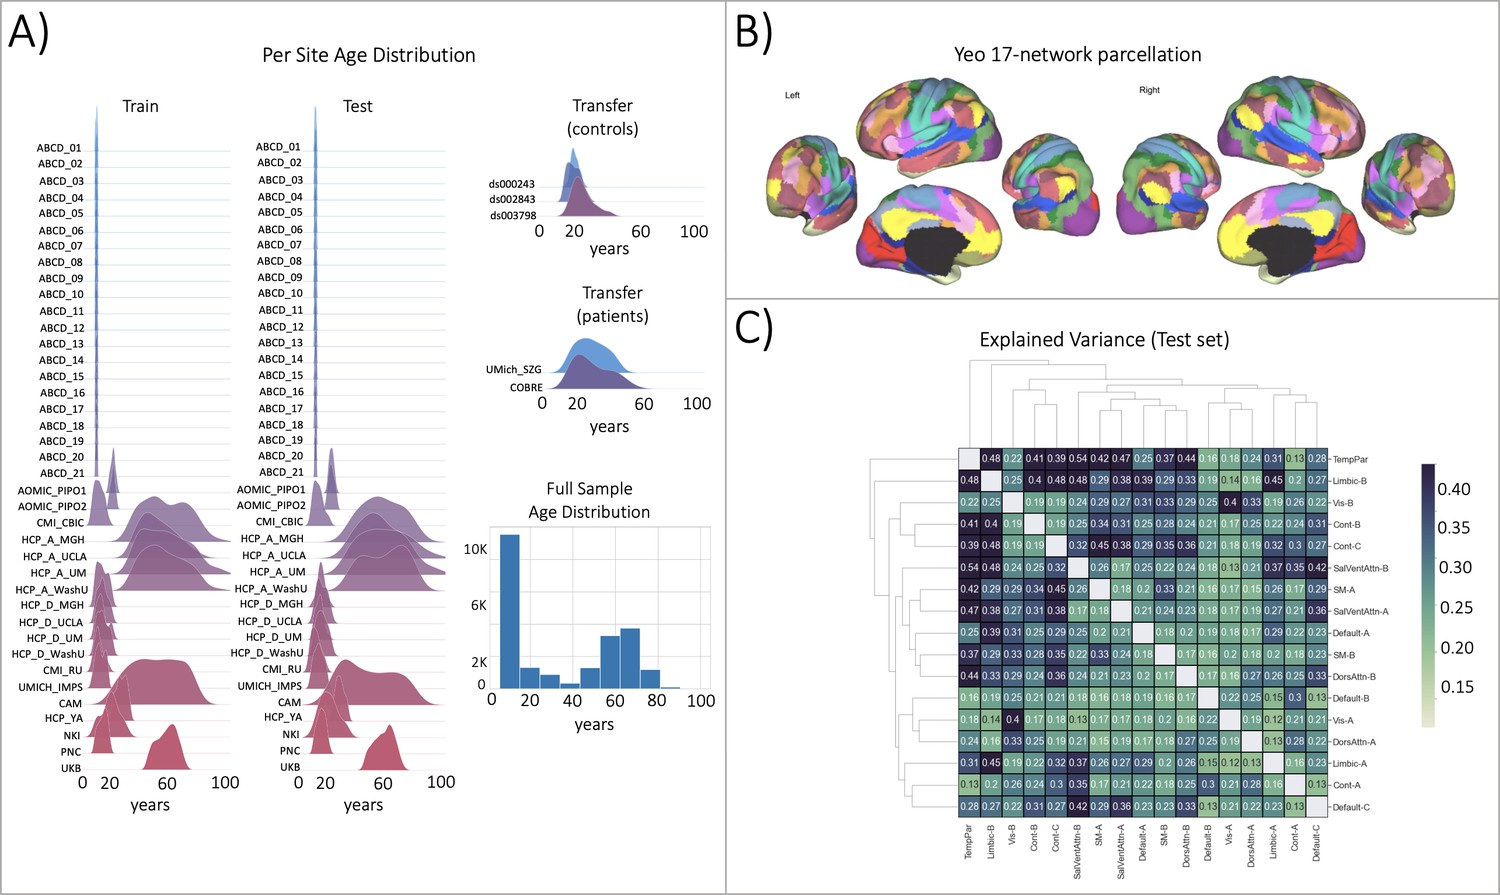
Functional brain network normative modeling.
(A) Age distribution per scanning site in the train, test, and transfer data partitions and across the full sample (train +test). (B) The Yeo-17 brain network atlas is used to generate connectomes. Between network connectivity was calculated for all 17 networks, resulting in 136 unique network pairs that were each individually input into a functional normative model. (C) The explained variance in the controls test set (N=7244) of each of the unique 136 network pairs of the Yeo-17 atlas. Networks were clustered for visualization to show similar variance patterns.
Figure 3
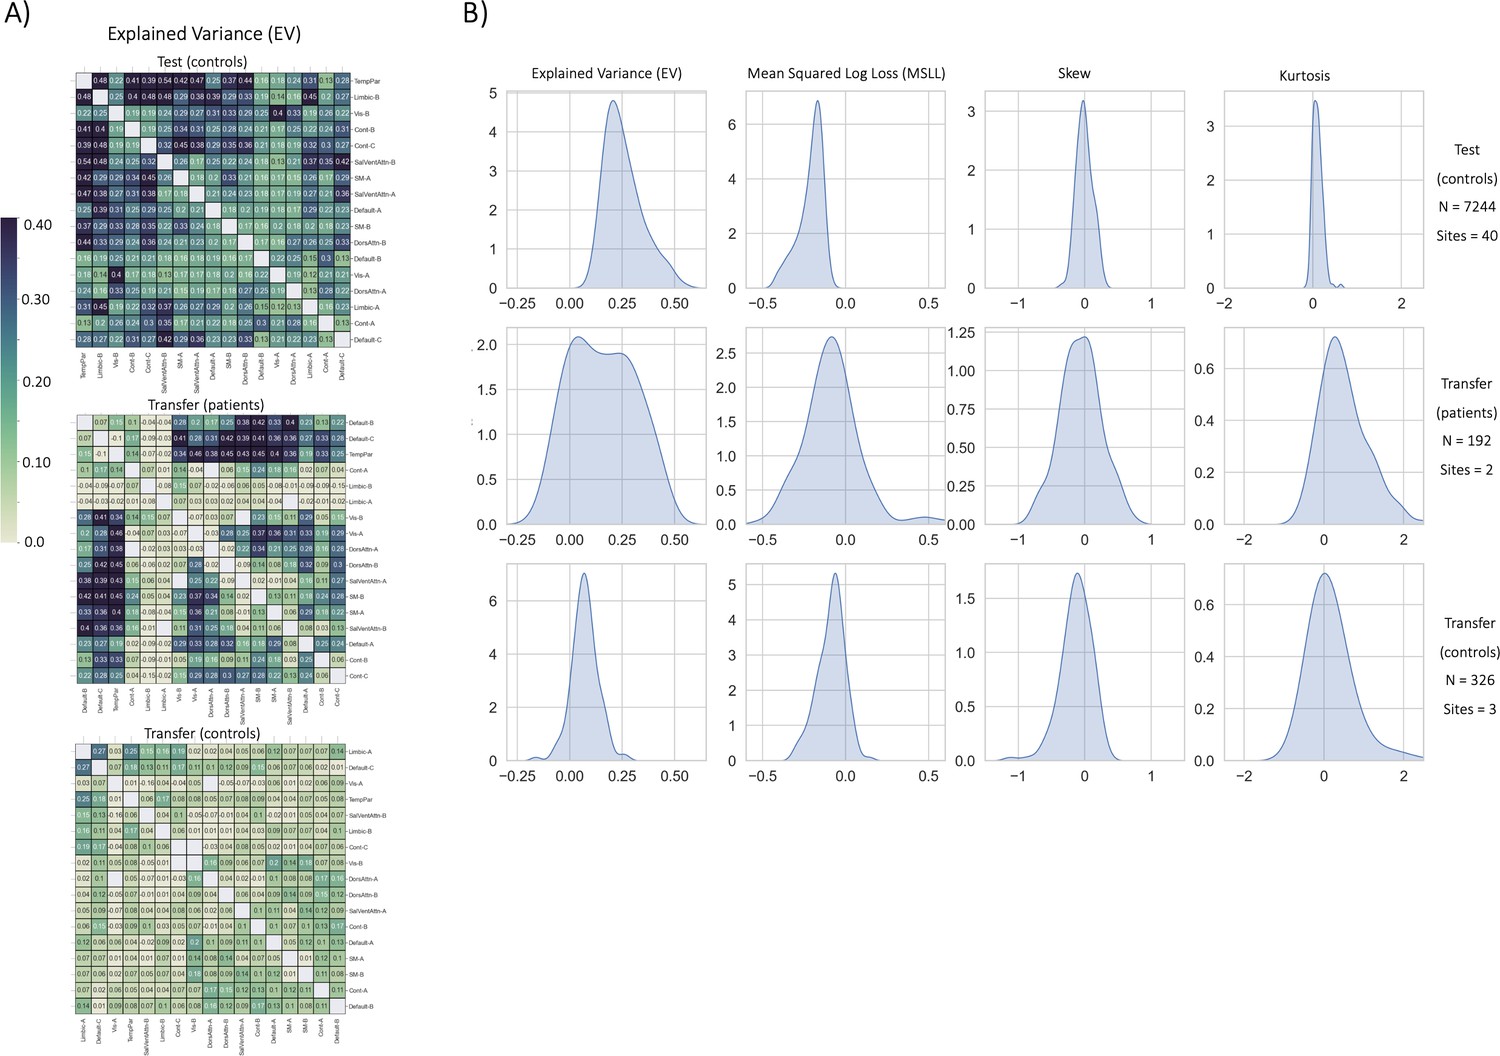
Functional normative model evaluation metrics.
(A) Explained variance per network pair across the test set (top), and both transfer sets (patients – middle, controls – bottom). Networks were clustered for visualization to show similar variance patterns. (B) The distribution across all models of the evaluation metrics (columns) in the test set (top row) and both transfer sets (middle and bottom rows). Higher explained variance (closer to one), more negative MSLL, and normally distributed skew and kurtosis correspond to better model fit.
Figure 4
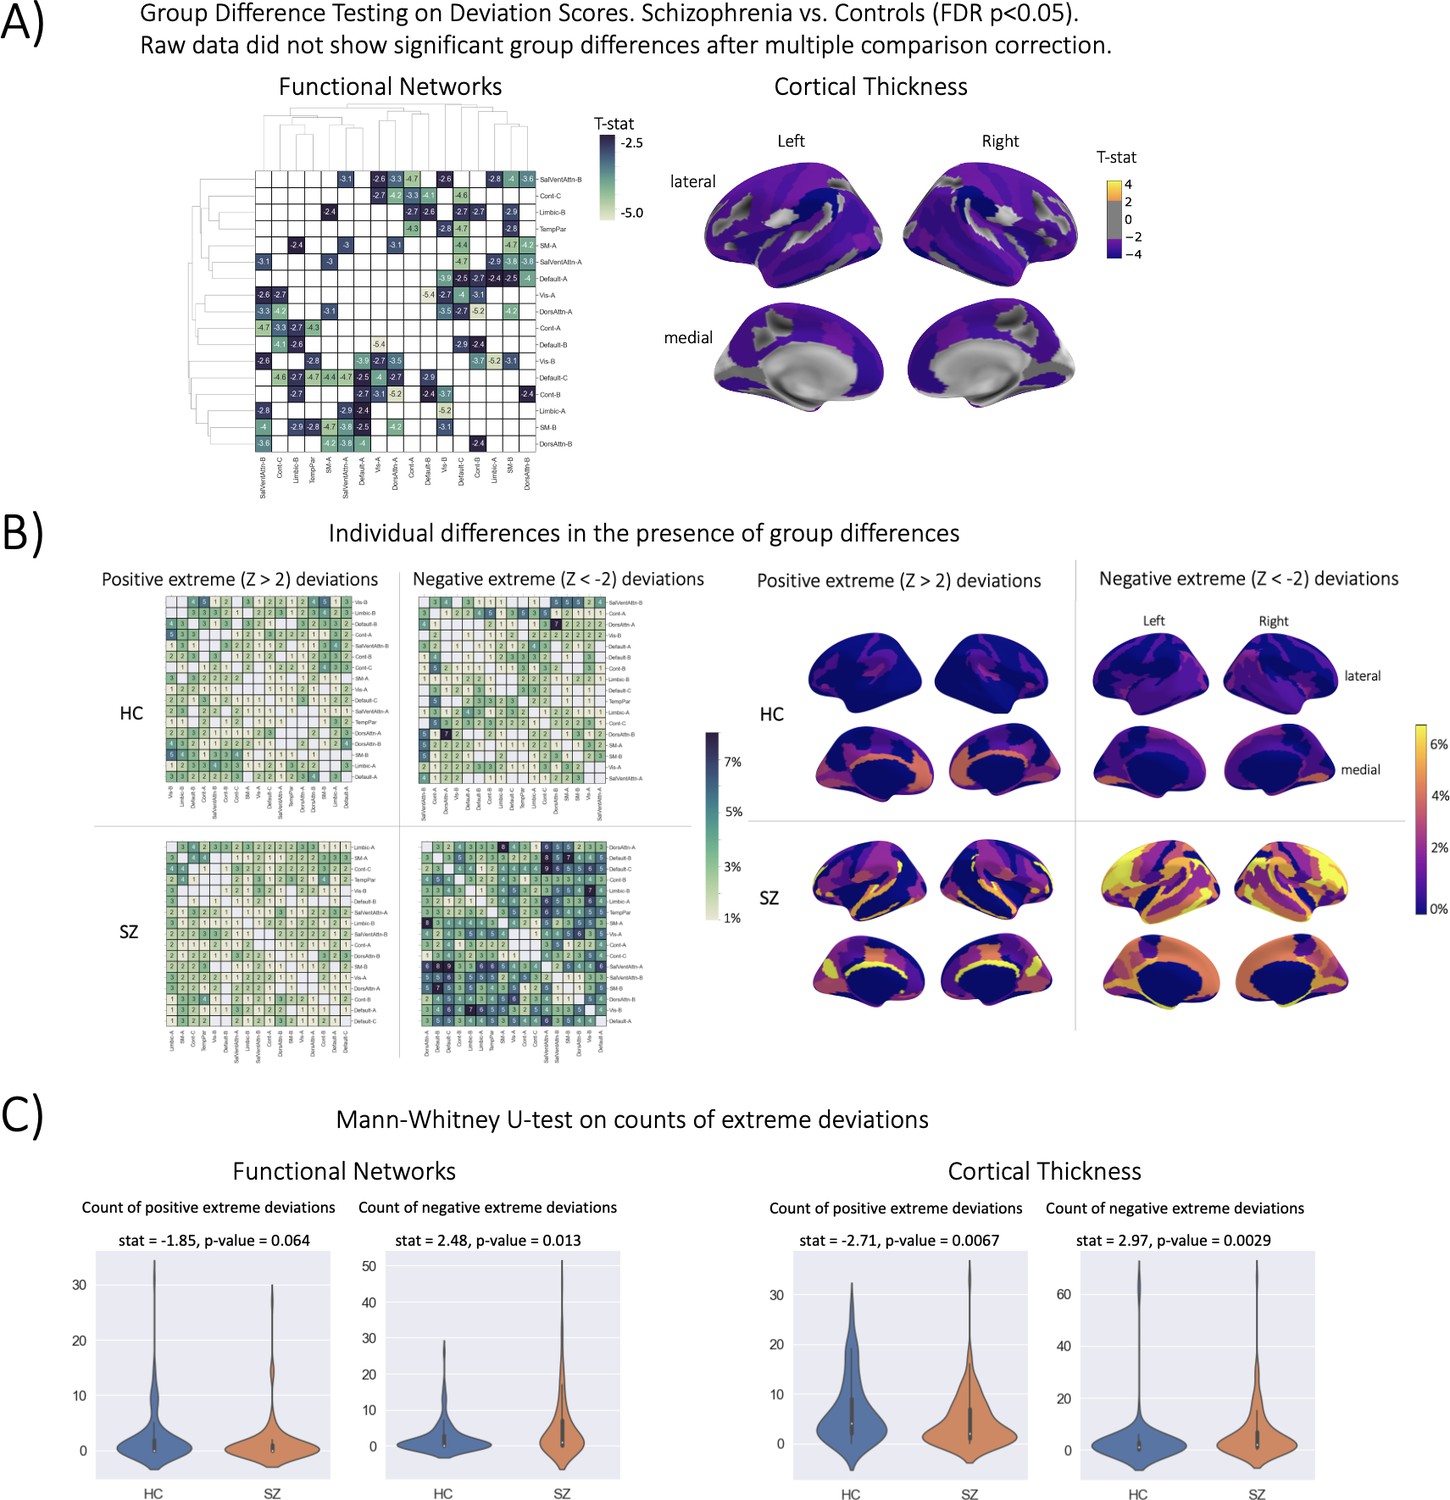
Group difference testing evaluation.
(A) Significant group differences in the deviation score models, (top left) functional brain network deviation, and (top right) cortical thickness deviation scores. The raw data, either cortical thickness or functional brain networks (residualized of sex and linear/ quadratic effects of age and motion (mean framewise displacement)) resulted in no significant group differences after multiple comparison corrections. Functional networks were clustered for visualization to show similar variance patterns. (B) There are still individual differences observed that do not overlap with the group difference map, showing the benefit of normative modeling, which can detect both group and individual differences through proper modeling of variation. Functional networks were clustered for visualization to show similar variance patterns. (C) There are significant group differences in the summaries (count) of the individual difference maps (panel B).
Figure 5
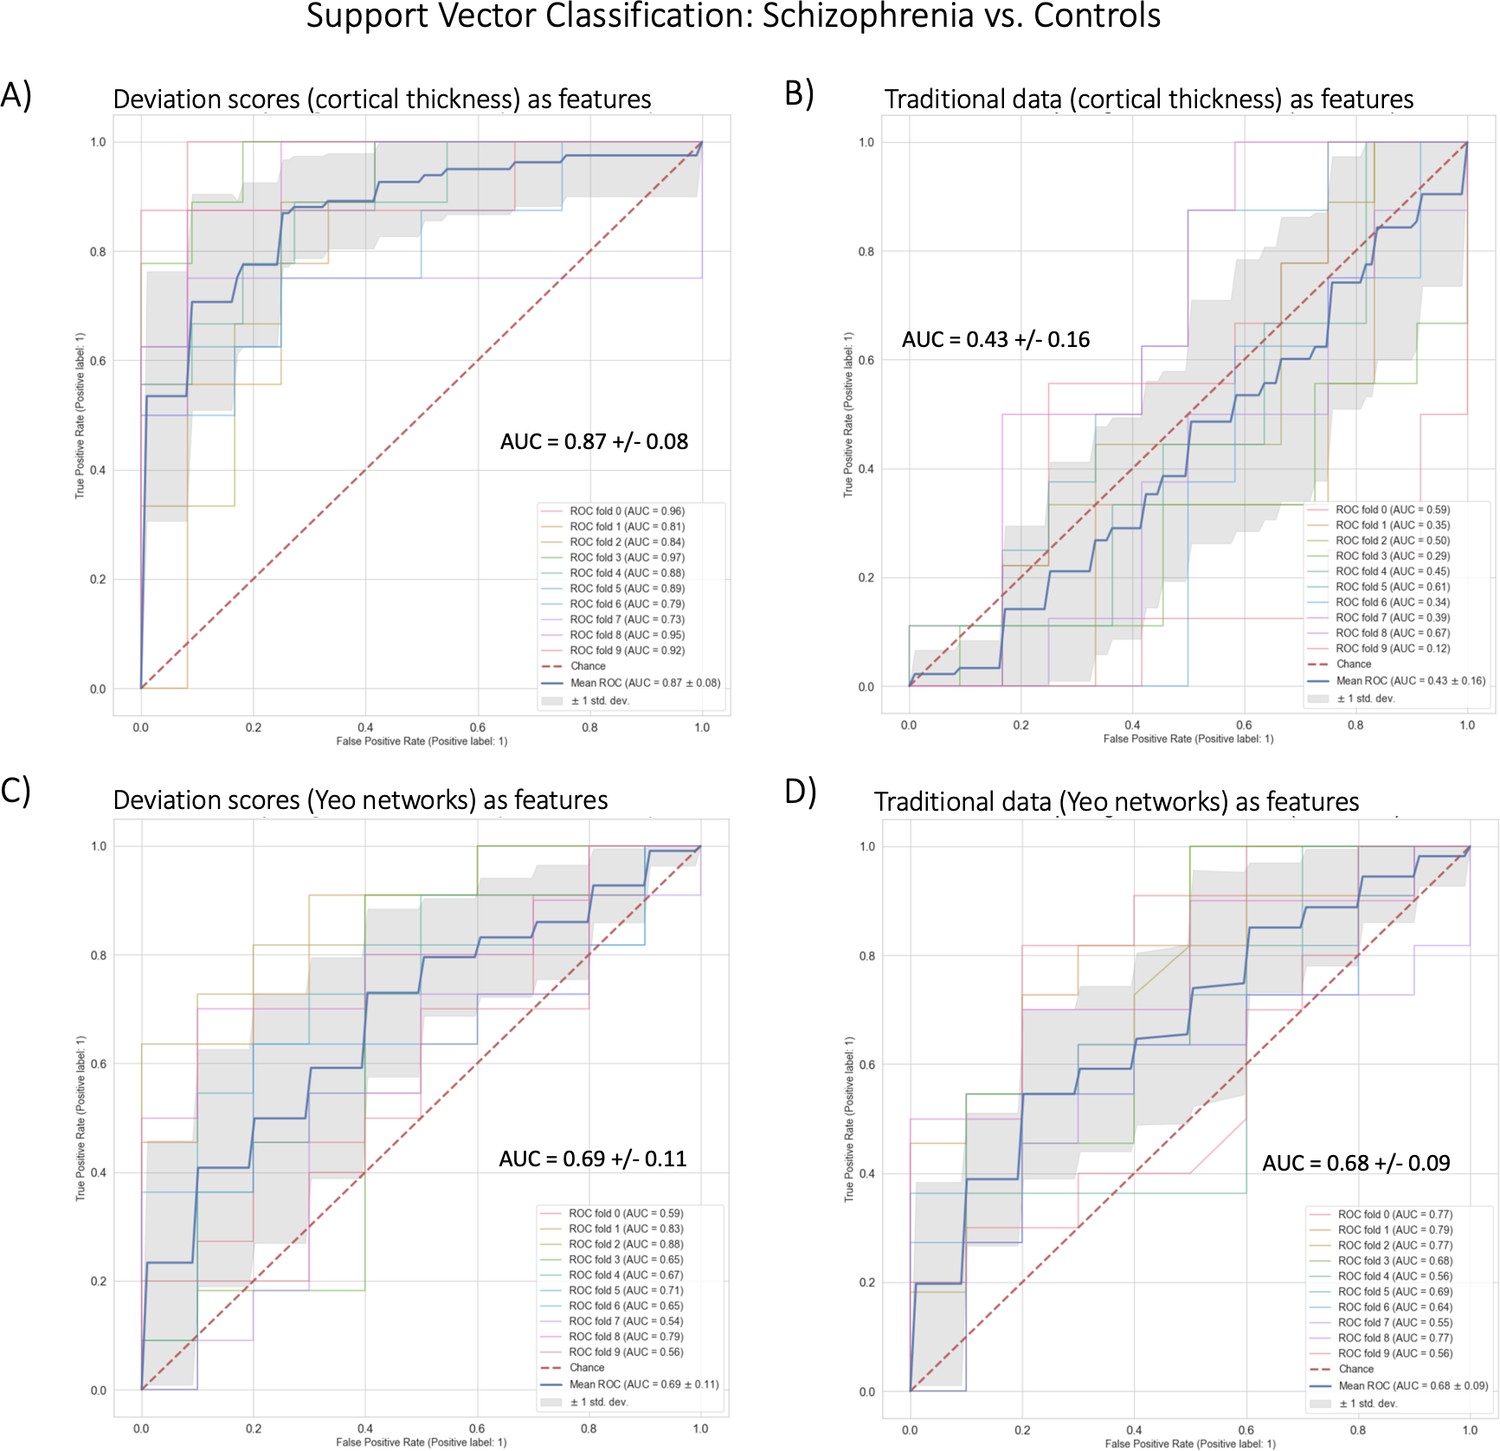
Benchmark task two multivariate prediction – Classification evaluation.
(A) Support vector classification (SVC) using cortical thickness deviation scores as input features (most accurate model). (B) SVC using cortical thickness (residualized of sex and linear/quadratic effects of age) as input features. (C) SVC using functional brain network deviation scores as input features. (D) SVC using functional brain networks (residualized of sex and linear/ quadratic effects of age and motion (mean framewise displacement)) as input features.
Tables
Table 1
Dataset inclusion and sample overview.
| Cortical Thickness | Functional Networks | ||||||
|---|---|---|---|---|---|---|---|
| Study | Benchmark Task | N | Age (m, s.d.) | F, M (%) | N | Age (m, s.d.) | F, M (%) |
| HCP | Regression – predicting cognition | 529 | 28.8, 3.6 | 53.4, 46.6 | 499 | 28.9, 3.6 | 54.3, 45.6 |
| COBRE | Classification & Group Difference | 124 | 37.0, 12.7 | 24.2, 75.8 | 121 | 35.4, 12.4 | 23.1, 76.9 |
| UMich | Classification & Group Difference | 89 | 32.6, 9.6 | 50.6, 49.3 | 87 | 33.0, 10.1 | 50.6, 49.3 |
Table 2
Benchmarking results.
Deviation (Z) score column shows the performance using deviation scores (AUC for classification, the total number of regions with significant group differences FDR-corrected p<0.05 for case versus control, mean squared error for regression), Raw column represents the performance when using the raw data, and Difference column shows the difference between the deviation scores and raw data (Deviation - Raw). Higher AUC, higher count, and lower MSE represent better performance. Positive values in the Difference column show that there is better performance when using deviation scores as input features for classification and group difference tasks, and negative performance difference values for the regression task show there is a better performance using the deviation scores. *=statistically significant difference between Z and Raw established using permutation testing (10 k perms).
| Benchmark | Modality | Normative ModelingDeviation Score Data | Raw Data | PerformanceDifference |
|---|---|---|---|---|
| Group Difference | Cortical thickness | 117/187 | 0/187 | 117* |
| Group Difference | Functional Networks | 50/136 | 0/136 | 50* |
| Classification | Cortical thickness | 0.87 | 0.43 | 0.44* |
| Classification | Functional Networks | 0.69 | 0.68 | 0.01 |
| Regression | Cortical thickness | 0.699 | 0.708 | –0.008 |
| Regression | Functional Networks | 0.877 | 0.890 | –0.013 |
Additional files
-
Supplementary file 1
Functional Normative Model Demographics.
Description: For each included site, we show the sample size (N), age (mean, standard deviation), and sex distribution (Female/Male percent) in the training set (shown in blue) and testing set (shown in green) of the normative models of functional connectivity between large scale resting-state brain networks from the Yeo 17 network atlas.
- https://cdn.elifesciences.org/articles/85082/elife-85082-supp1-v2.xlsx
-
Supplementary file 2
Surface Area Normative Model Demographics.
Description: For each included site, we show the sample size (N), age (mean, standard deviation), and sex distribution (Female/Male percent) of the normative models of surface area extracted for all regions of interest in the Destrieux Freesurfer atlas.
- https://cdn.elifesciences.org/articles/85082/elife-85082-supp2-v2.xlsx
-
Supplementary file 3
Structural Group Difference Testing Statistics.
Description: We show for all cortical thickness and subcortical volume from the Destrieux and aseg Freesurfer atlases regions of interest (ROIs from a two-sample t-test between Schizophrenia versus Healthy Controls) the t-statistic (T-stat), False Discovery Rate corrected p-value (FDRcorr_pvalue), and uncorrected p-value (uncorr_pvalue) for both the raw data (shown in green) and the deviation scores (shown in blue).
- https://cdn.elifesciences.org/articles/85082/elife-85082-supp3-v2.xlsx
-
Supplementary file 4
Functional Connectivity Group Difference Testing Statistics.
Description: We show for all Yeo-17 between network connectivity regions of interest (ROIs) from a two-sample t-test between Schizophrenia versus Healthy Controls the t-statistic (T-stat), False Discovery Rate corrected p-value (FDRcorr_pvalue), and uncorrected p-value (uncorr_pvalue) for both the raw data (shown in green) and the deviation scores (shown in blue).
- https://cdn.elifesciences.org/articles/85082/elife-85082-supp4-v2.xlsx
-
MDAR checklist
- https://cdn.elifesciences.org/articles/85082/elife-85082-mdarchecklist1-v2.pdf
Download links
A two-part list of links to download the article, or parts of the article, in various formats.
Downloads (link to download the article as PDF)
Open citations (links to open the citations from this article in various online reference manager services)
Cite this article (links to download the citations from this article in formats compatible with various reference manager tools)
Evidence for embracing normative modeling
eLife 12:e85082.
https://doi.org/10.7554/eLife.85082


