On the normative advantages of dopamine and striatal opponency for learning and choice
- Department of Cognitive, Linguistic and Psychological Sciences, Carney Institute for Brain Science, Brown University, United States
Figures
Figure 1 with 1 supplement
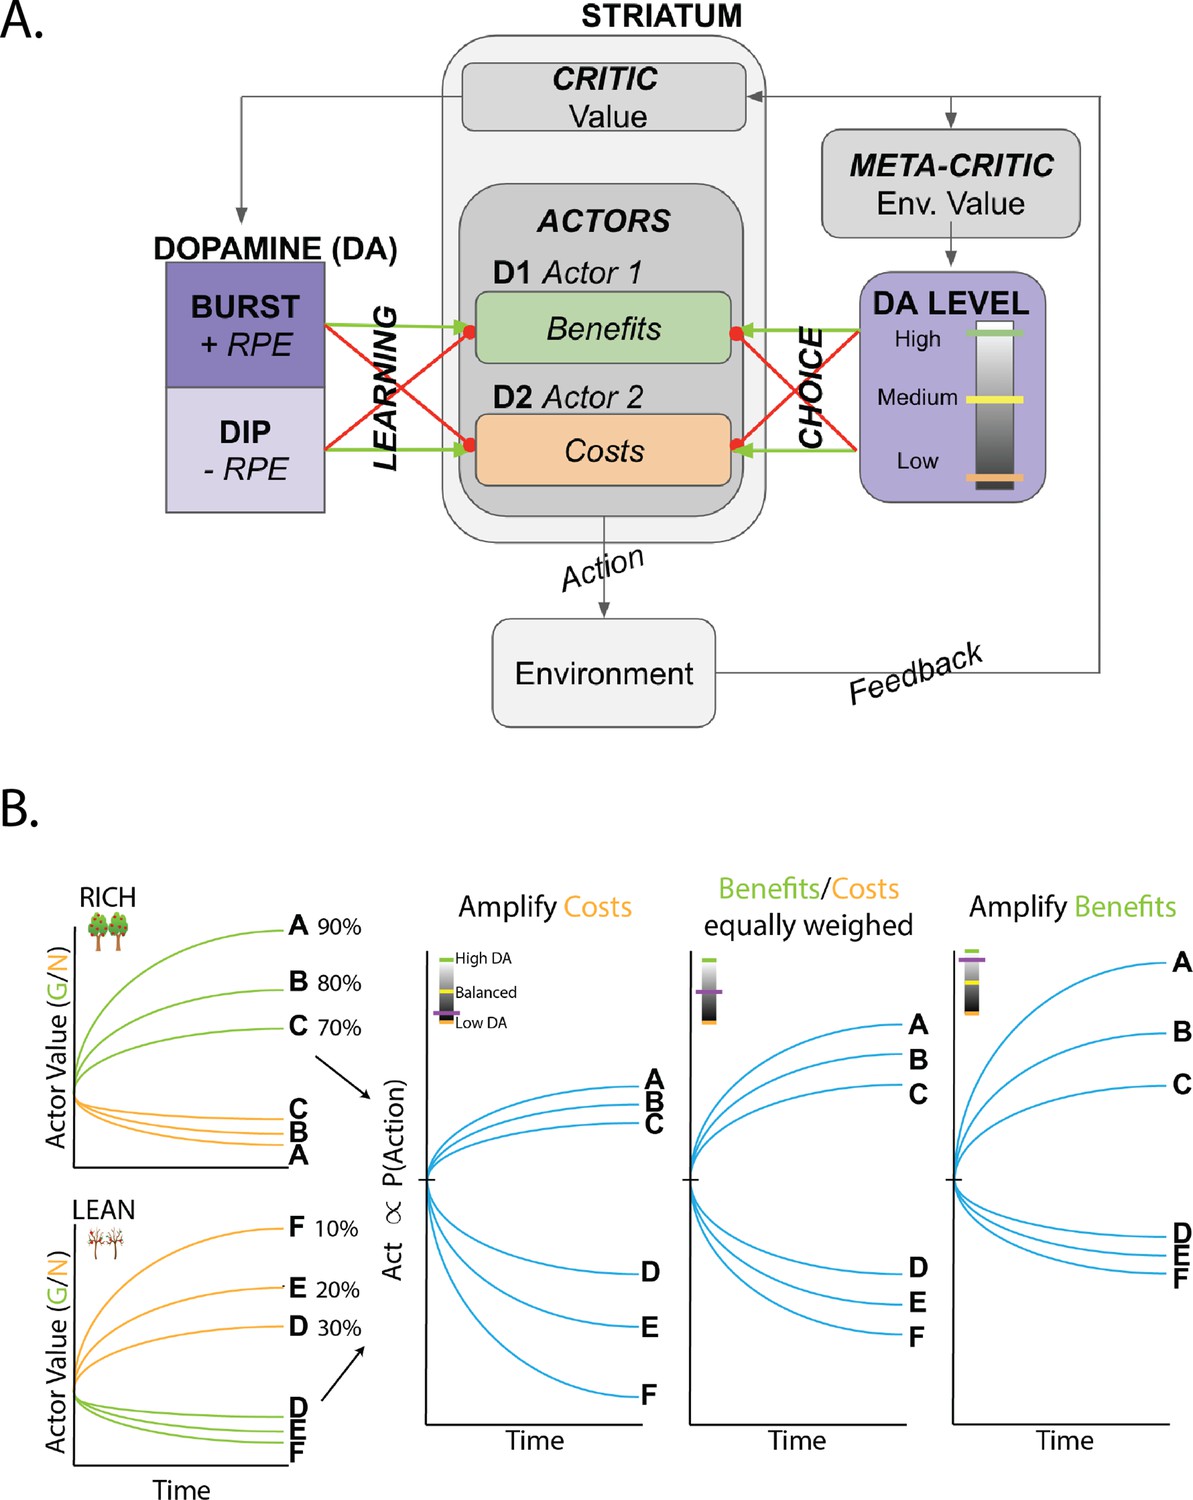
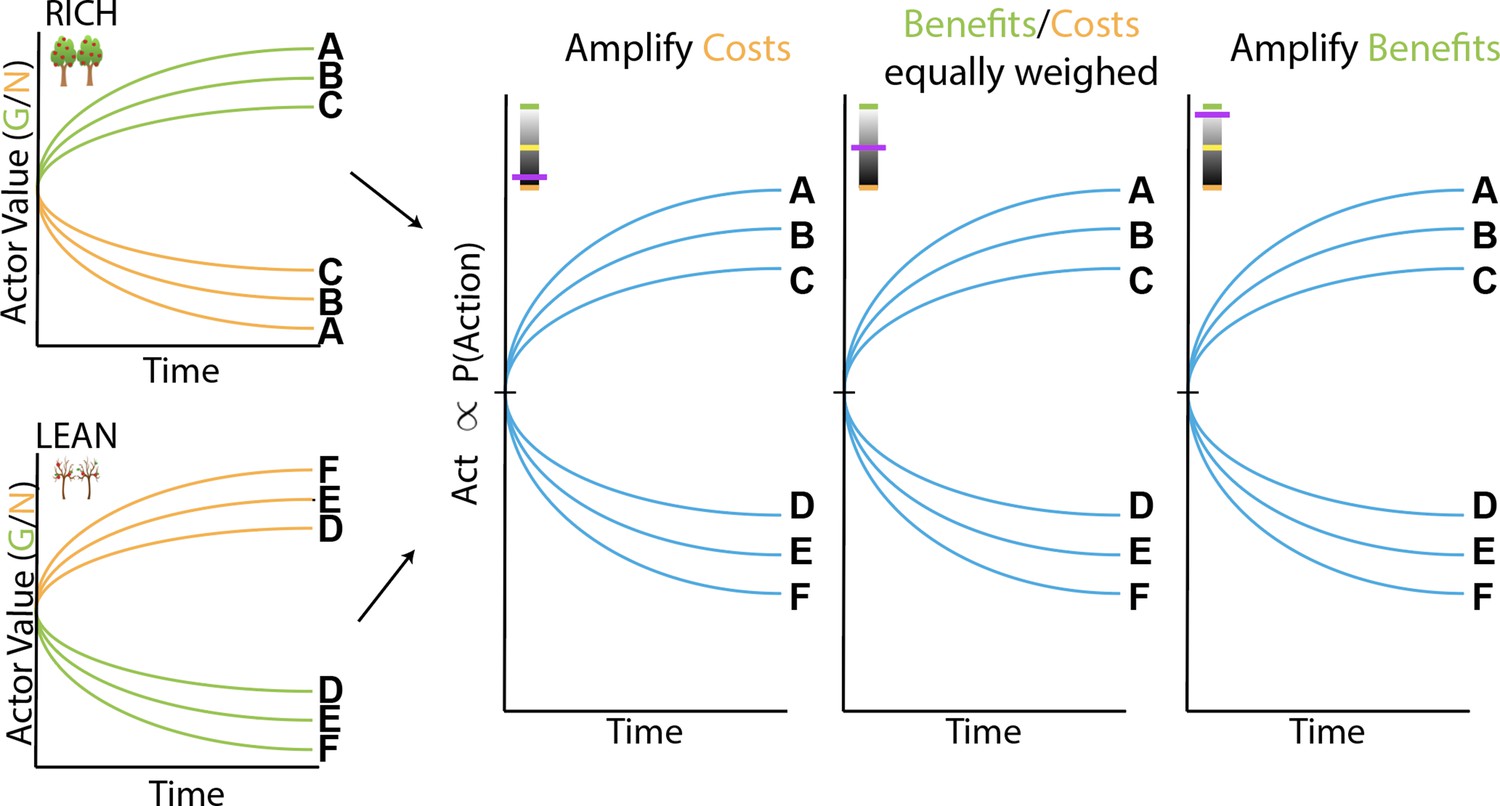
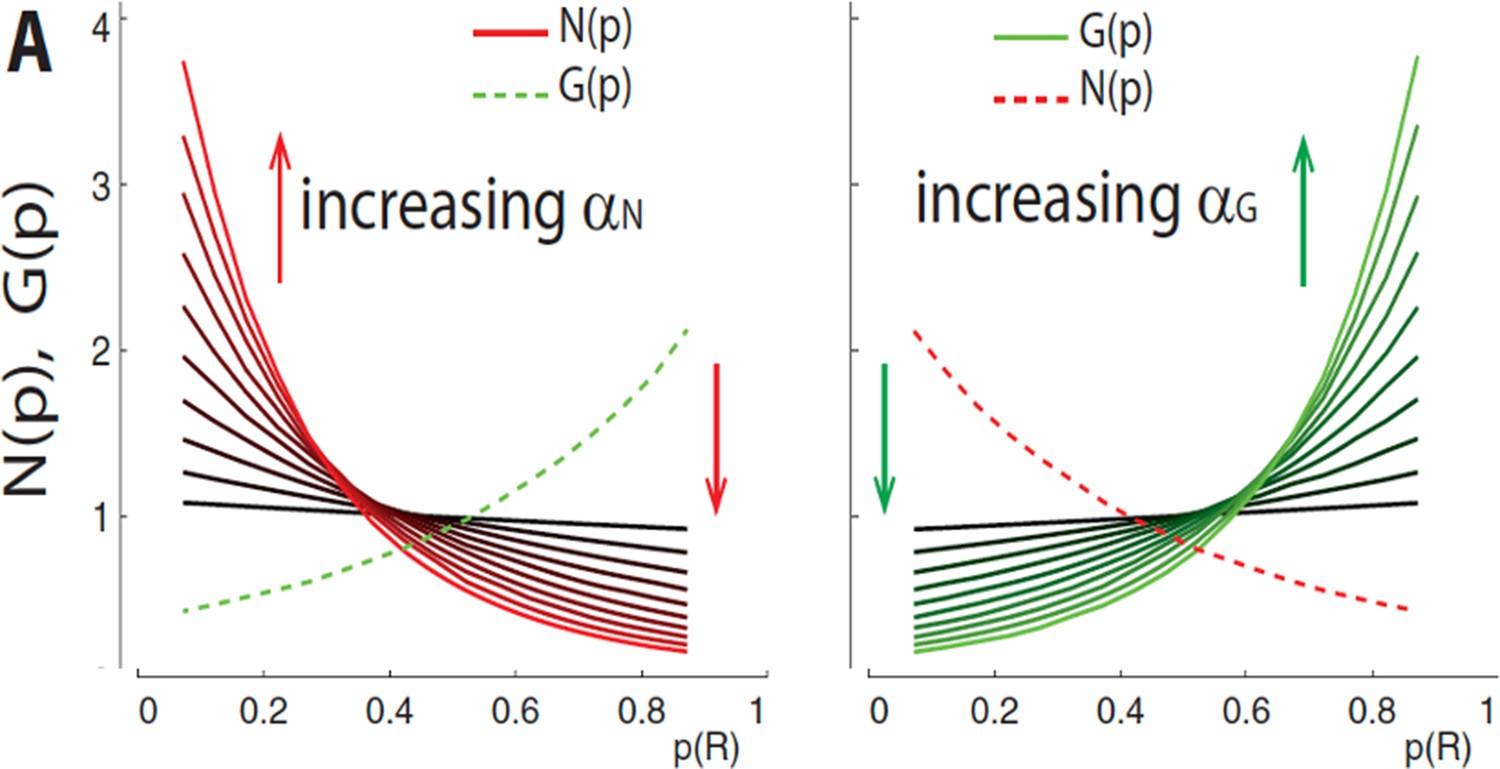
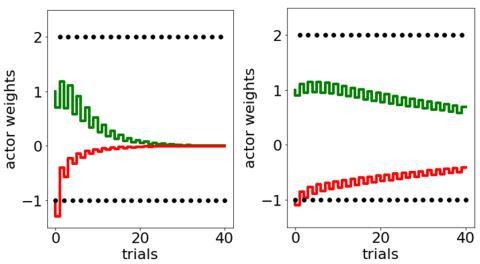
Overview of OpAL* and dynamics of three-factor Hebbian term.
(A) OpAL* architecture. Akin to the original OpAL model (Collins and Frank, 2014), OpAL* is a modified dual actor-critic model where the critic learns action values and generates reward prediction errors (RPEs); the actors use these RPEs to directly learn a policy (i.e., how to behave). For each action, the representation according to one actor (representing the D1 pathway) is strengthened by positive RPEs and weakened by negative RPEs (encoded by dopamine burst and dips, respectively). In contrast, positive RPEs weaken and negative RPEs strengthen the second actor’s action representations (representing the D2 pathway). Uniquely, OpAL* modulates dopamine levels at the time of choice according to a ‘meta-critic,’ which tracks the value or ‘richness’ of the overall environment according to the agent’s reward history agnostic to action history. OpAL* also introduces additional features, such as annealing and normalization, that provide OpAL* with robustness and flexibility but preserve key properties of the OpAL model necessary for capturing empirical data. (B) Schematic of OpAL dynamics with three-factor Hebbian term. Nonlinear weight updates due to Hebbian factor lead to increasing discrimination between high reward probability options in the actor and between low reward probability options in the actor. For intermediate dopamine states ( and actors are balanced), there is equal sensitivity to differences in reward probability across the range of rich and lean environments. For high dopamine states (), the action policy emphasizes differences in benefits (as represented in the D1/"G" weights), whereas in low dopamine states (), the action policy emphasizes differences in costs (as represented in the D2/"N" weights). Changes in dopaminergic state (represented by the purple indicators) affect the policy of OpAL due to its nonlinear and opponent dynamics. OpAL* hypothesizes that modulating dopaminergic state by environmental richness is a normative mechanism for flexible weighting of these representations.
Figure 1—figure supplement 1
Dynamics of G/N/Act without three-factor Hebbian dynamics.
Schematic of OpAL dynamics without three-factor Hebbian term. Removing nonlinear term in OpAL confers redundancy in G/N weights, which are perfectly anticorrelated and thus do not confer an efficient coding advantage and cannot be differentially leveraged to promote specialization.
Figure 2
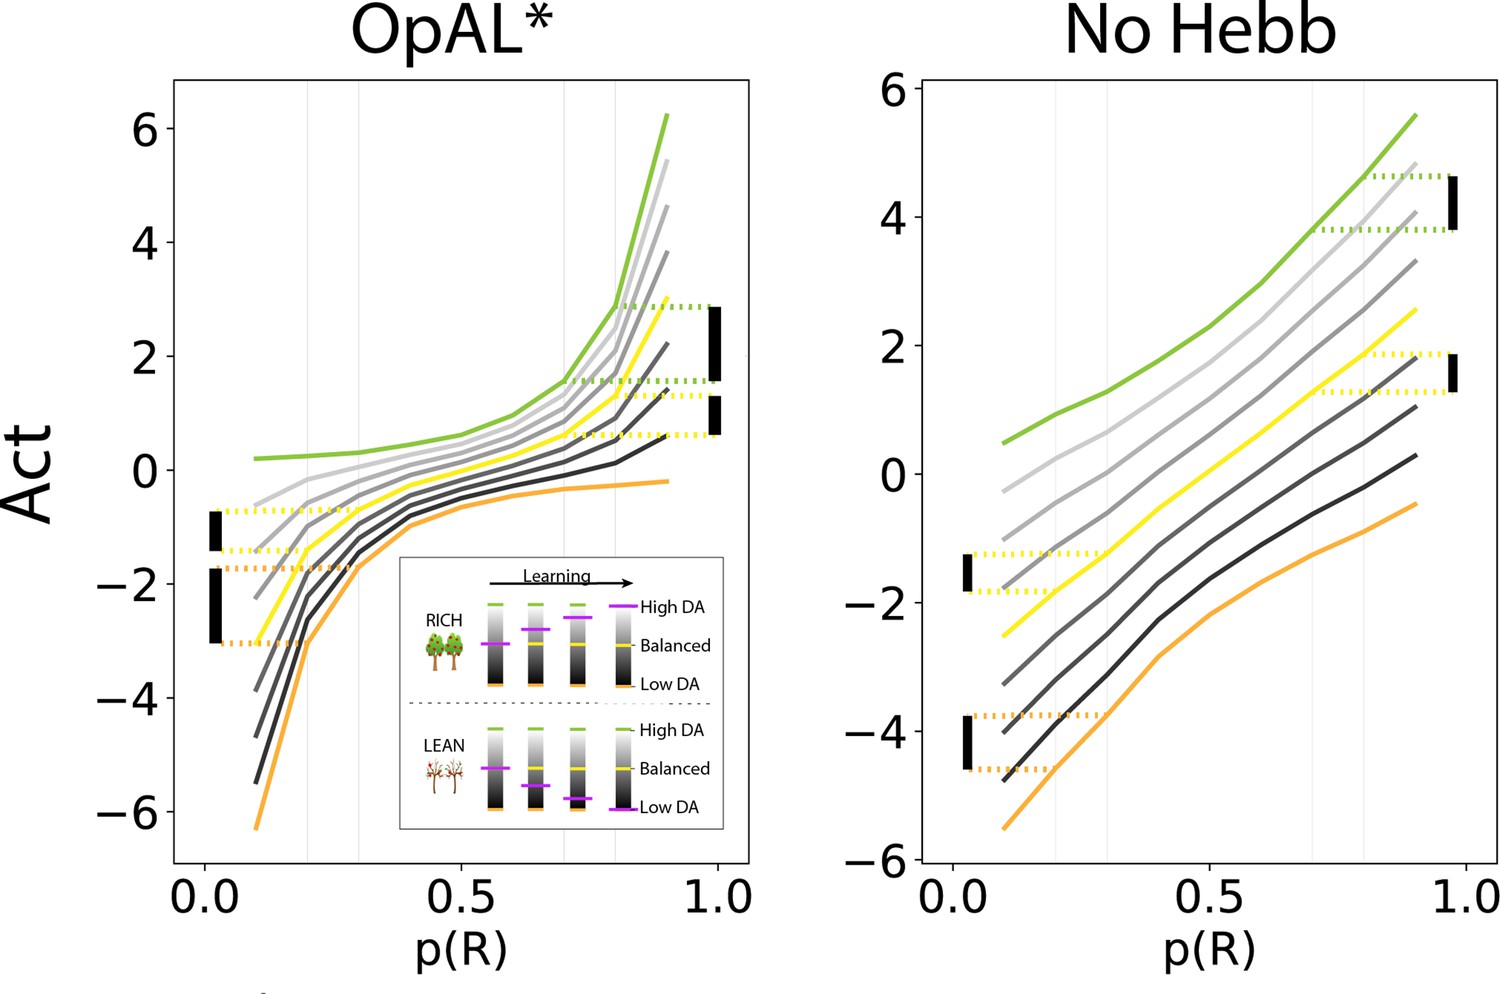
OpAL* capitalizes on convexity of actor weights induced by nonlinearity, allowing adaptation to different environments.
values are generated by presenting each model with a bandit using a fixed reward probability for 100 trials; curves are averaged over 5000 simulations. Left: nonlinearity in OpAL* update rule induces convexity in values as a function of reward probability (due to stronger contributions of weights with higher rewards, and stronger contributions of weights with sparse reward). OpAL* dynamically adjusts its dopaminergic state over the course of learning as a function of its estimate of environmental richness (indicated by elongated, purple bars), allowing it to traverse different Act curves (high dopamine [DA] in green emphasizes the actor, low DA in orange emphasizes the actor). (Note that the agent’s meta-critic first needs to be confident in its estimate of reward richness of the environment during in initial exploration for it to adjust DA to appropriately exploit convexity.) Thereafter, OpAL* can differentially leverage convexity in or weights, outperforming a ‘balanced’ OpAL+ model (in yellow), which equally weighs the two actors (due to static DA). Vertical bars show discrimination (i.e., action gap) between 80% and 70% actions is enhanced with high DA state, whereas discrimination between 20% and 30% actions is amplified for low DA. Right: due to redundancy in the No Hebb representations, policies are largely invariant to dopaminergic modulation during the course of learning.
Figure 3 with 1 supplement
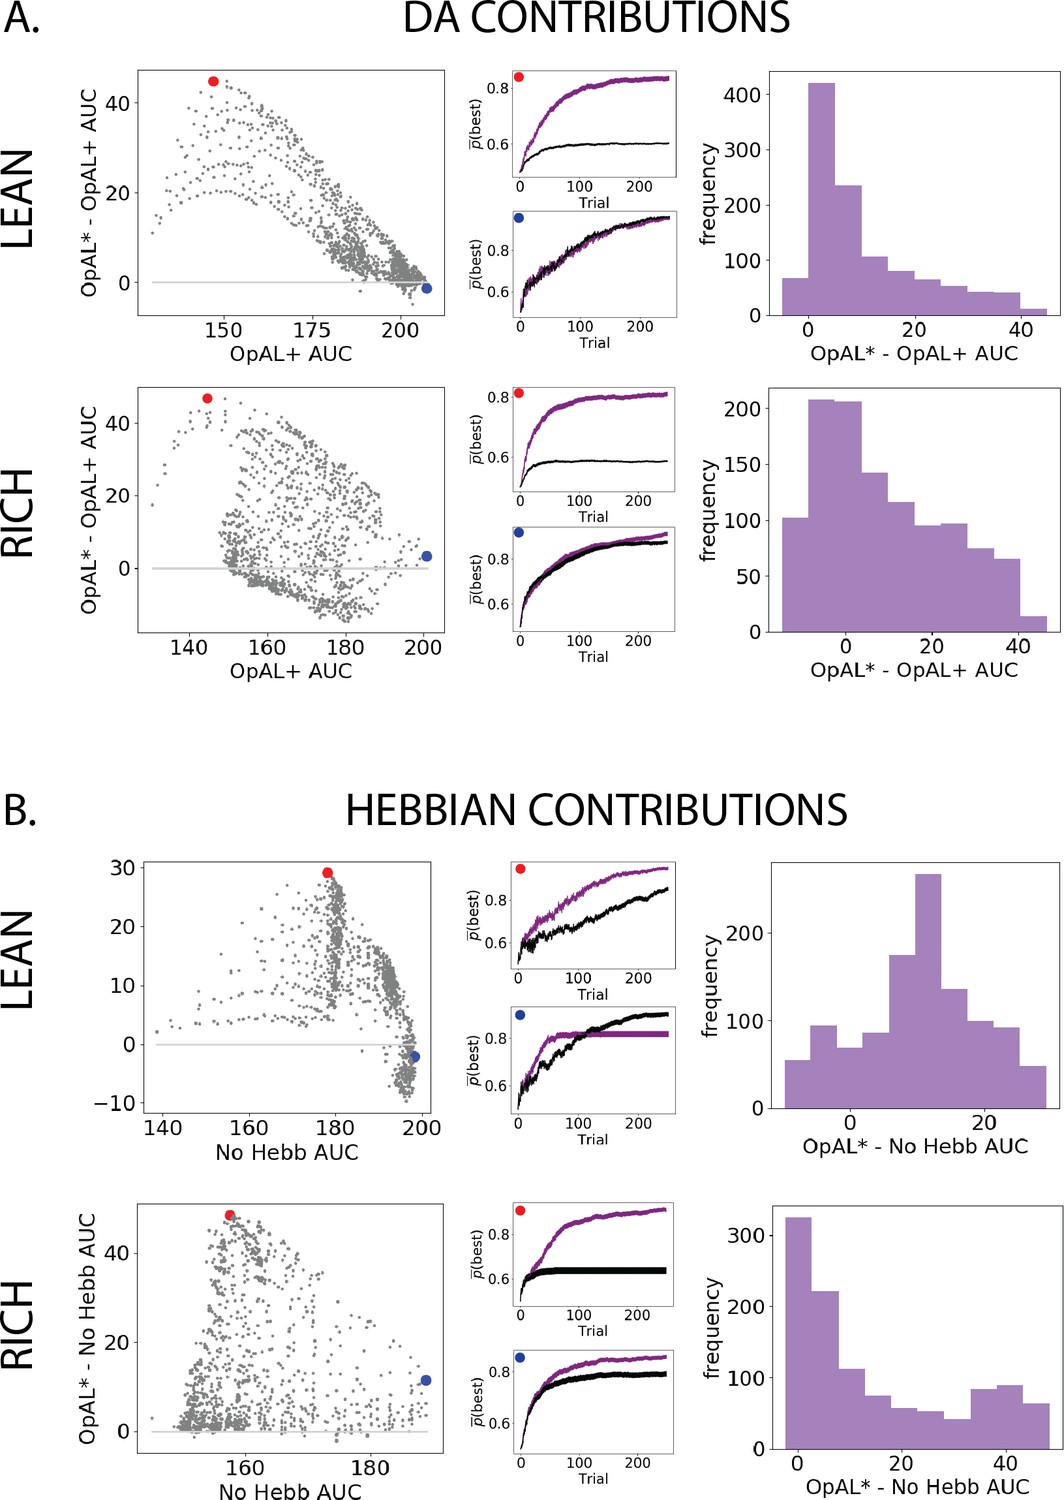
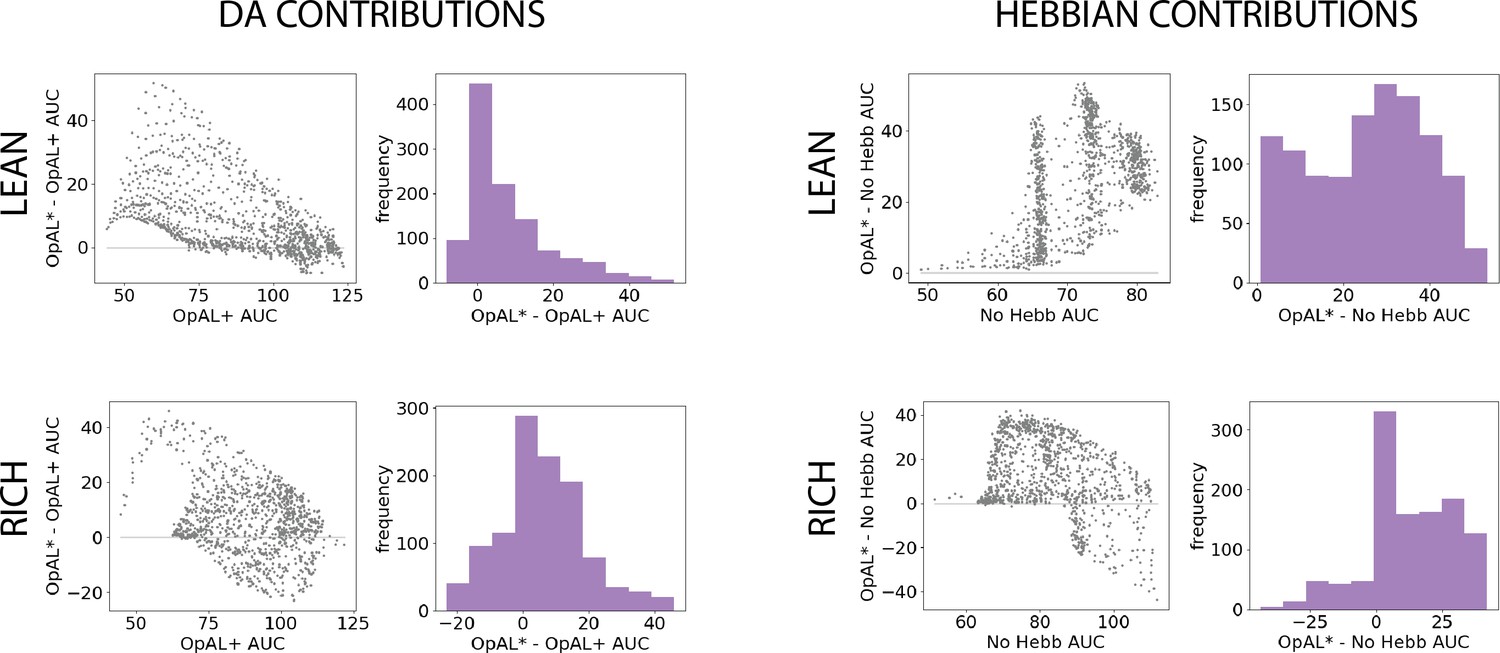
Parameter-level comparison of OpAL* to OpAL+ and OpAL* to the No Hebb model across a range of plausible parameters.
Results of two-armed bandit environments – rich (80% vs. 70%) or lean (30% vs. 20%) – for 250 trials. Advantages over the OpAL+ model indicate the need for dynamic dopamine (DA) modulation. Advantages over the No Hebb model indicate the need for the nonlinear three-factor Hebbian rule (found in Equations 18 and 19). Together, advantages over both control models also indicate the need for opponency, particularly given redundancy in G and N weights in the No Hebb model. See ‘Parameter grid search’ for more details. (A) OpAL* improves upon a control model which lacks dynamic modulation (OpAL+, ), with largest improvement for moderately performing parameters. Left: each point represents a single-parameter combination and its difference in learning curve areas under the curve (AUCs) in OpAL* compared to the OpAL+ model. Center: average learning curves of the parameter setting which demonstrates the best improvement of OpAL* over the OpAL+ model (indicated by the red dot) and the parameter setting with the best OpAL+ model performance (indicated by the blue dot). Error bars reflect standard error of the mean over 1000 simulations. Right: histogram of the difference in average learning curve AUCs of the two models with equated parameters. (B) Dynamic A modulation is insufficient to induce performance advantage without three-factor Hebbian learning (No Hebb). Comparison descriptions analogous to the above.
Figure 3—figure supplement 1
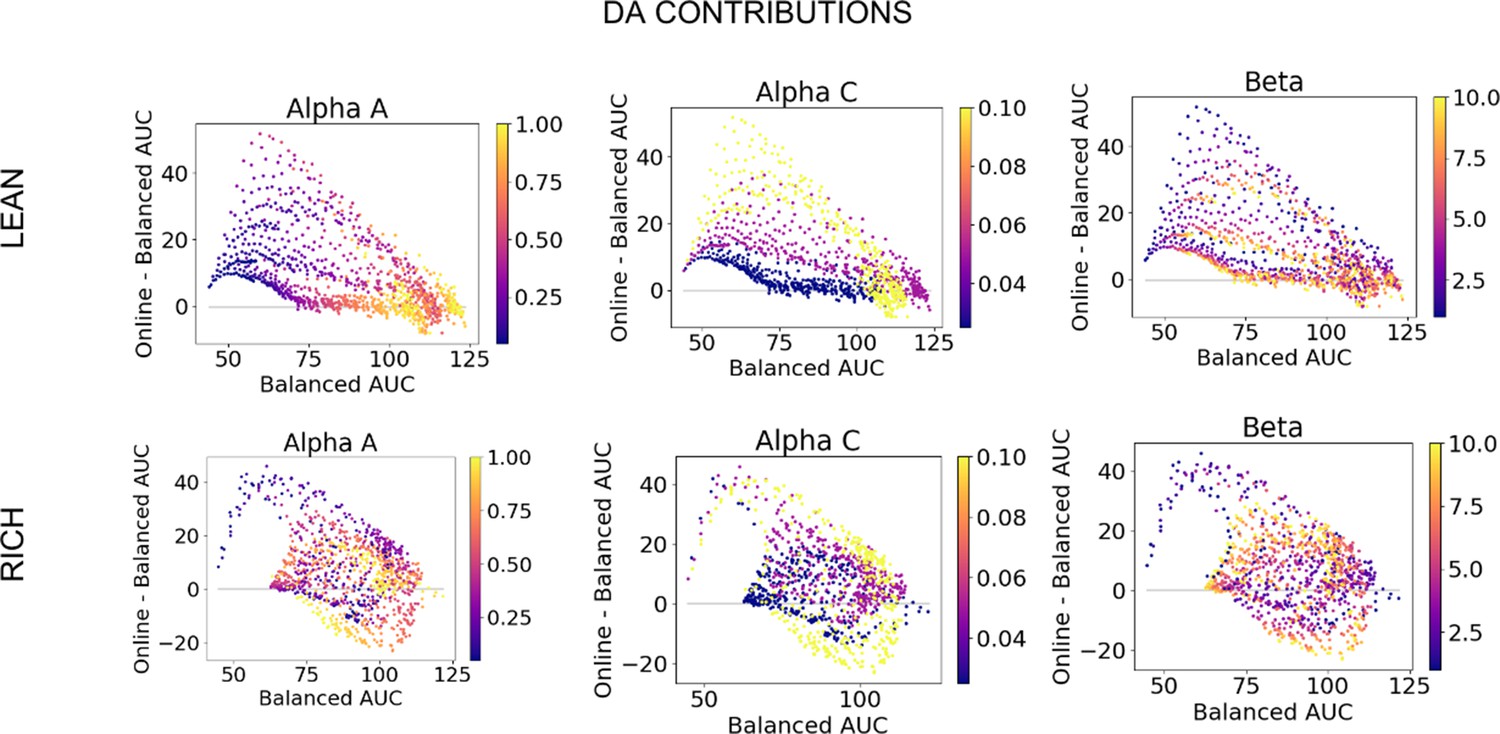
Dopamine (DA) contribution colored by parameter values, low complexity.
DA contributions (OpAL*) relative to absence of dynamic dopamine modulation (OpAL+) in a low complexity (two options), colored by parameter values.
Figure 4 with 1 supplement
Parameter-level comparison of OpAL* to control models in high complexity.
OpAL* robustly outperforms control models in high-complexity environments, with lean environments showing the greatest advantage. Models completed a six-armed bandit task (with only one optimal action) for 250 trials. See ‘Parameter grid search’ for detailed analysis methods.
Figure 4—figure supplement 1
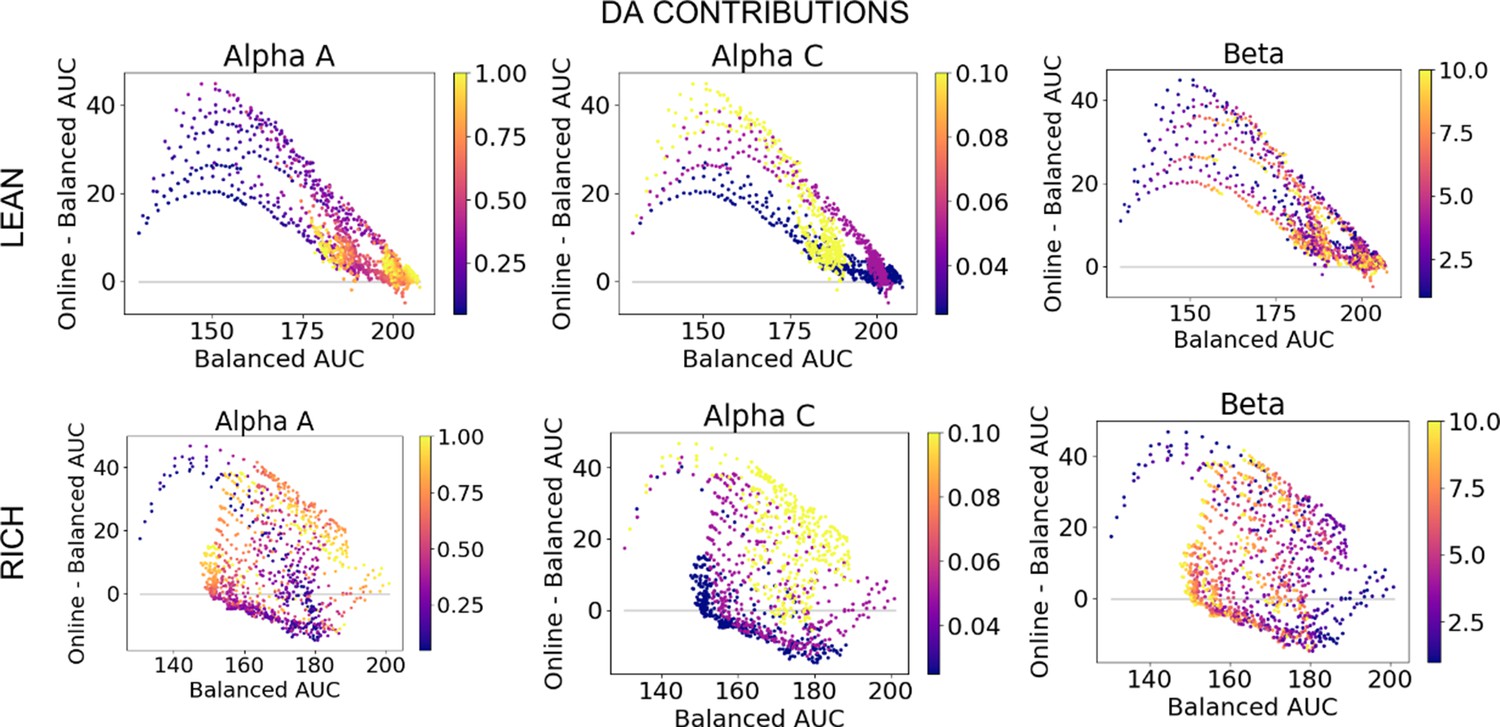
Dopamine (DA) contribution colored by parameter values, high complexity.
DA contributions (OpAL*) relative to absence of dynamic dopamine modulation (OpAL+) in a high complexity (six options), colored by parameter values.
Figure 5
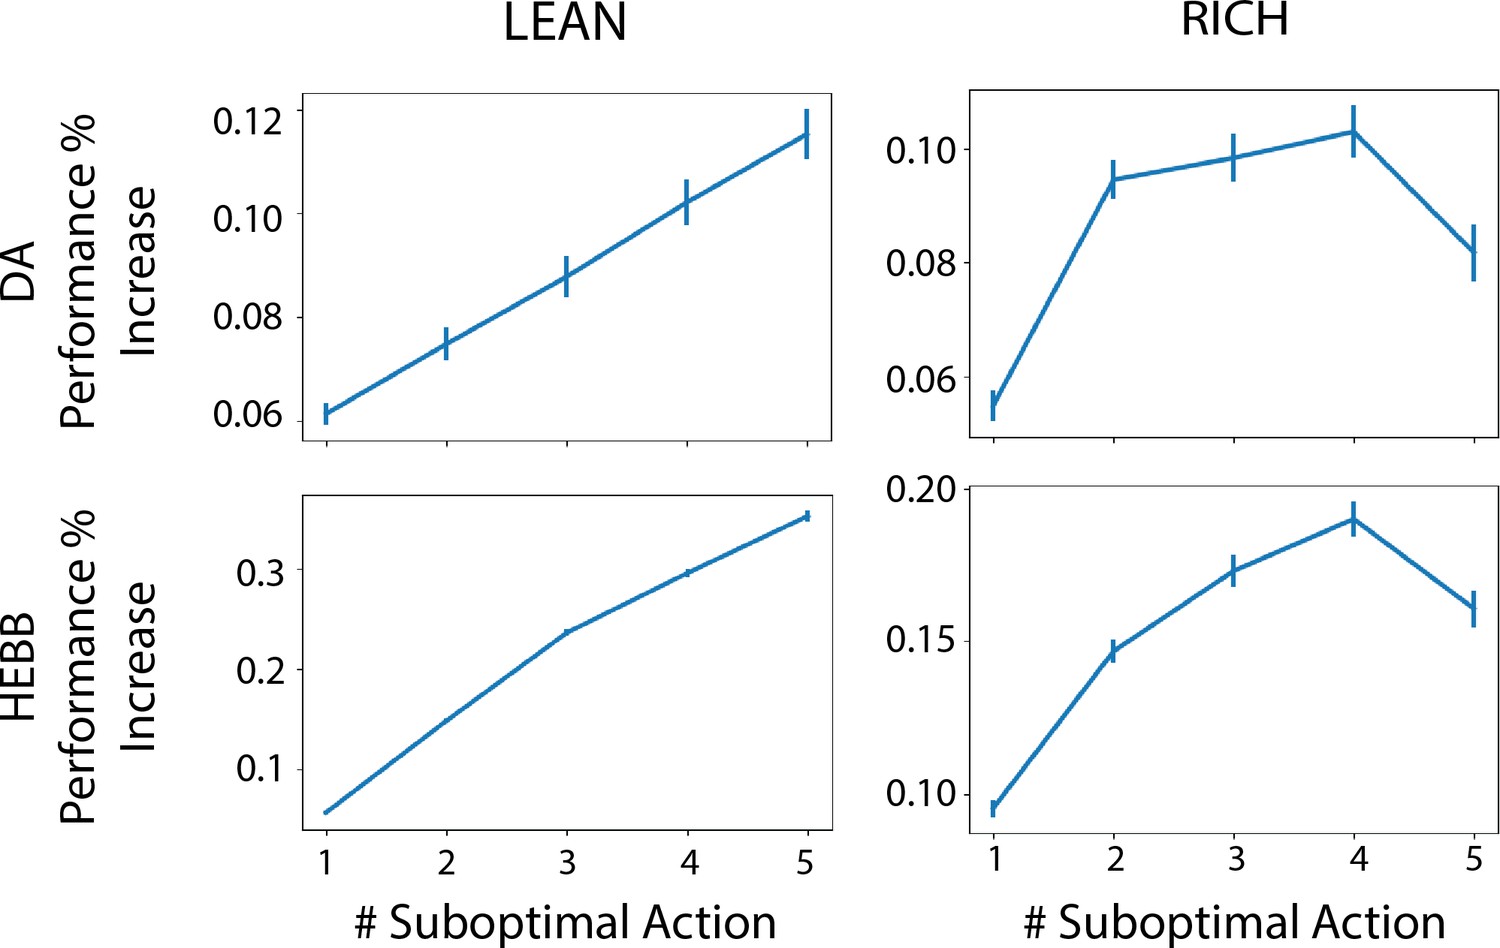
Advantage of dynamic dopaminergic modulation of OpAL* grows with complexity.
Complexity corresponds to the number of bandits available in the environment (e.g., a two-armed bandit, which data point corresponds to Figure 3, or a six-armed bandit, which data point corresponds to Figure 4). Values reported are the average percentage increase of OpAL* learning curve area under the curve (AUC) compared to a OpAL+ model (top row) or No Hebb model (bottom tow) with equated parameters. That is, we computed the difference in AUC of OpAL* and OpAL+/No Hebb model learning curves for a fixed parameter normalized by the AUC of the balanced OpAL model. We then averaged this percentage increase over all parameters in the grid search. Results are shown for 250 trials of learning. Error bars reflect standard error of the mean.
Figure 6 with 1 supplement
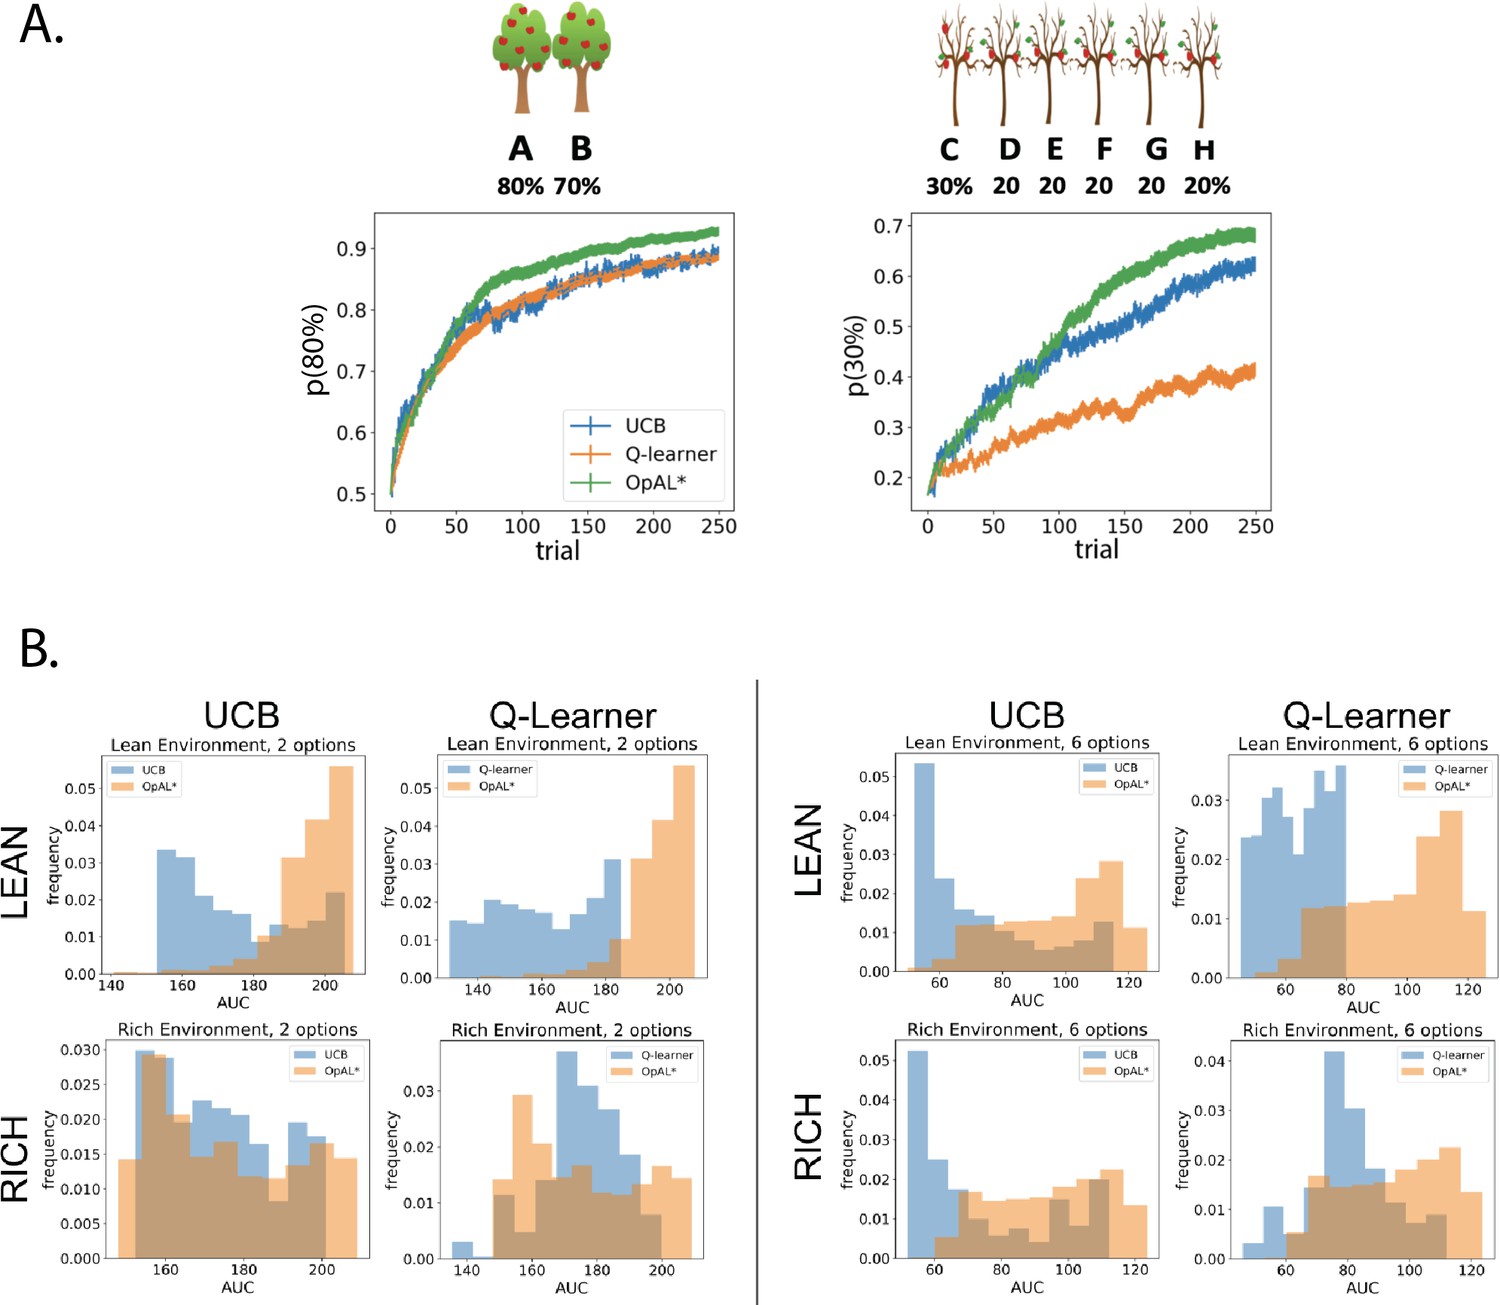
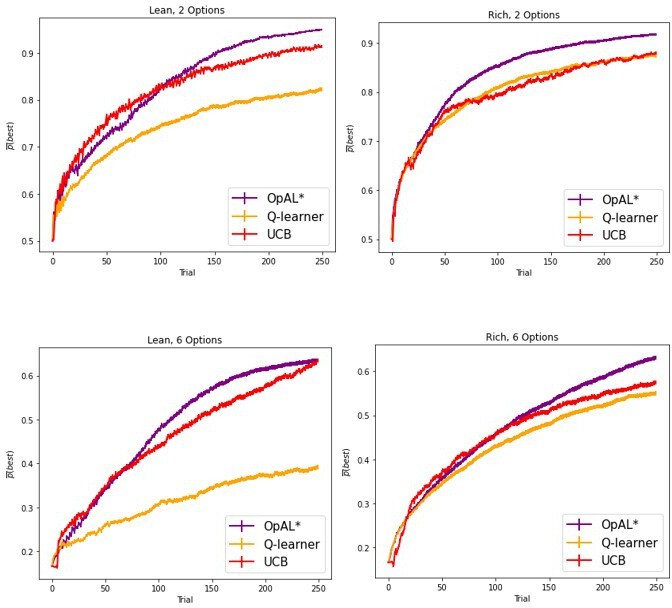
OpAL* demonstrates flexible performance across environments and complexities compared to standard-RL models, Q-learning and Upper Confidence Bound (UCB).
UCB is specifically designed for improving explore–exploit tradeoffs like those prevalent in reward lean environments (see ‘Mechanism’ section below). While UCB demonstrates improved performance relative to Q-learning in lean environments, OpAL* outperforms both models robustly over all parameters, included the optimized set for each agent. (A) Biological OpAL* mechanisms outperform optimized control models across environments and complexity levels, shown here in a reward rich environment (80% vs. 70% two-armed bandit) and a lean, sparse reward environment (30% vs. 20% six-armed bandit). OpAL* outperforms a standard Q-learning and UCB in the computationally easiest scenario – reward rich environment with only two options – and, more prominently, in the computationally most difficult scenario – reward lean environment with six total options. Notably, OpAL* sustains its advantages in the difficult scenario which requires more exploration, even after extended learning (Figure 6—figure supplement 1). Curves averaged over 1000 simulations, error bars are SEM. Parameters correspond to the optimal performance for each environment according to a grid search, corresponding to the right tail of the histograms in (B). (B) Biological mechanisms incorporated in OpAL* support robust advantages over standard reinforcement learning models across parameter settings in a reward rich environment (80% vs. 70% two-armed bandit left, six-armed bandit right) and a lean, sparse reward environment (30% vs. 20% two-armed bandit left, six-armed bandit right). Average learning curves were produced for each parameter setting in a grid search over 1000 simulations for 250 trials, and the area under the curve (AUC) was calculated for each parameter. The AUCs of all parameters for a model are shown normalized to account for different sized parameter spaces across models.
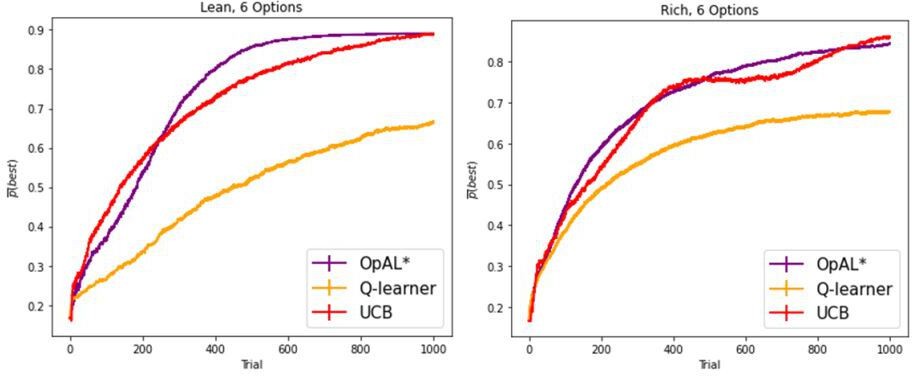
Figure 6—figure supplement 1
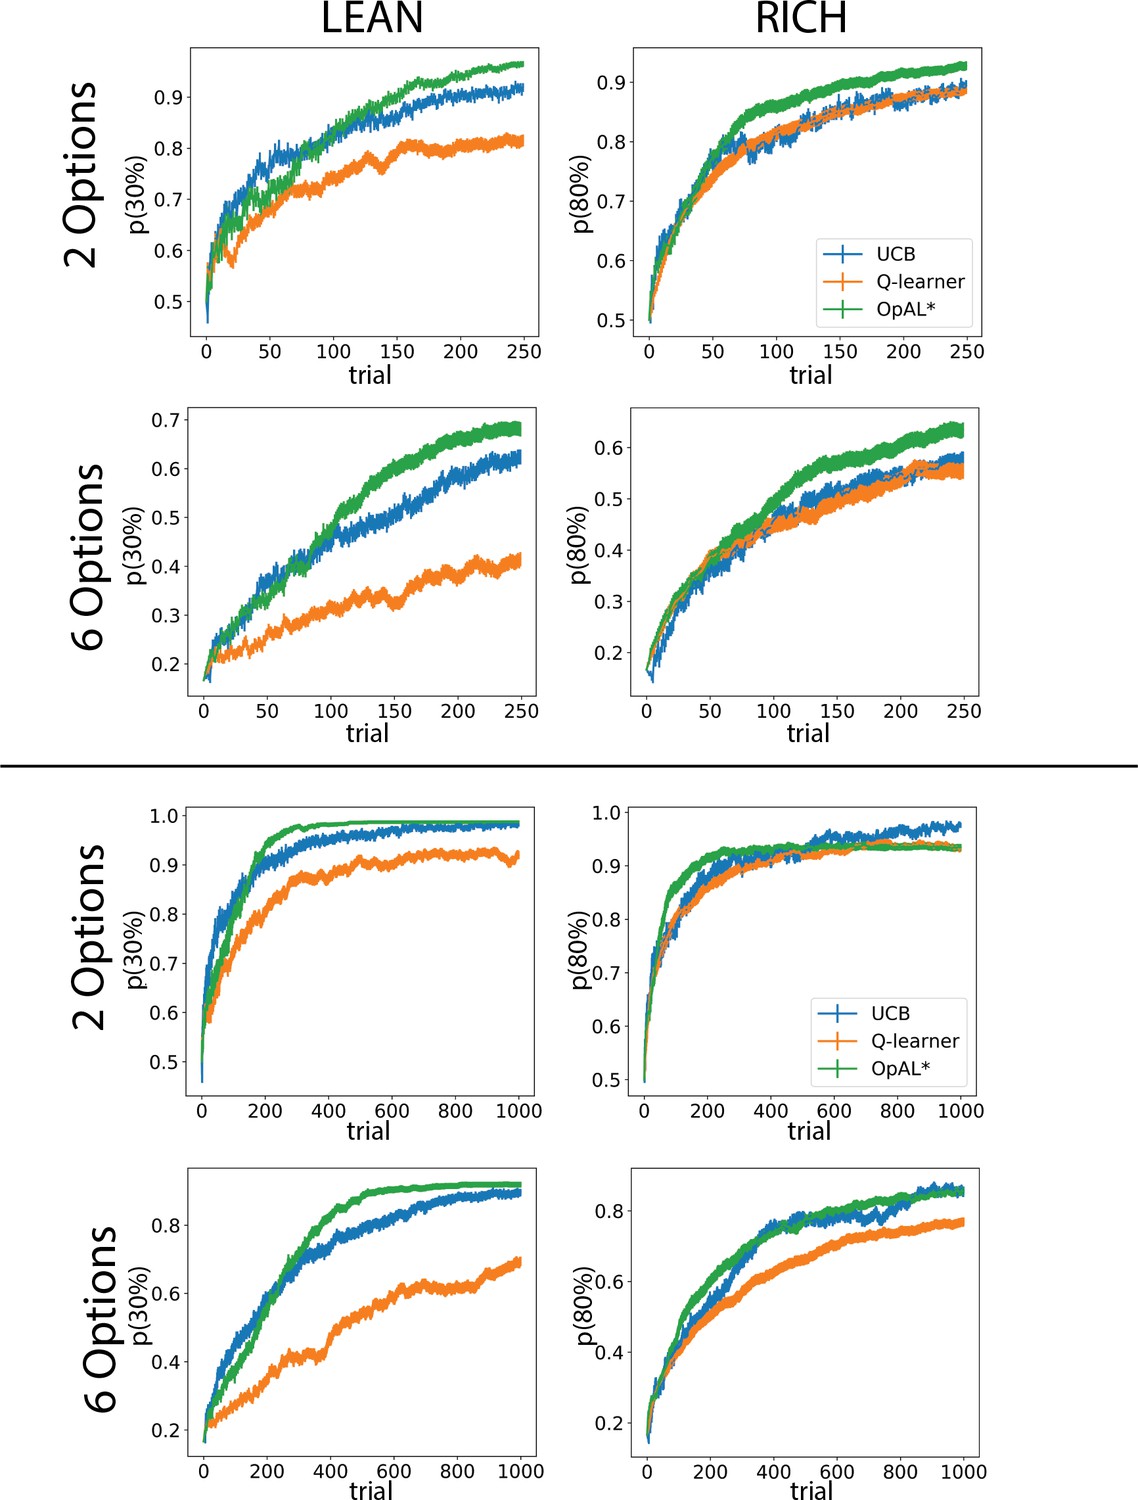
Optimal learning curves for other complexities and time horizons.
Learning curves represent parameters which optimize the area under the curve (AUC) for each model in the specified environment. Parameters were found according the grid search outlined in ‘Materials and methods,’ ‘Parameter grid search.’ Curves for 250 trials correspond to the AUC values at the right tail of the histogram in Figure 6B. Error bars reflect standard error of the mean over 1000 simulations.
Figure 7
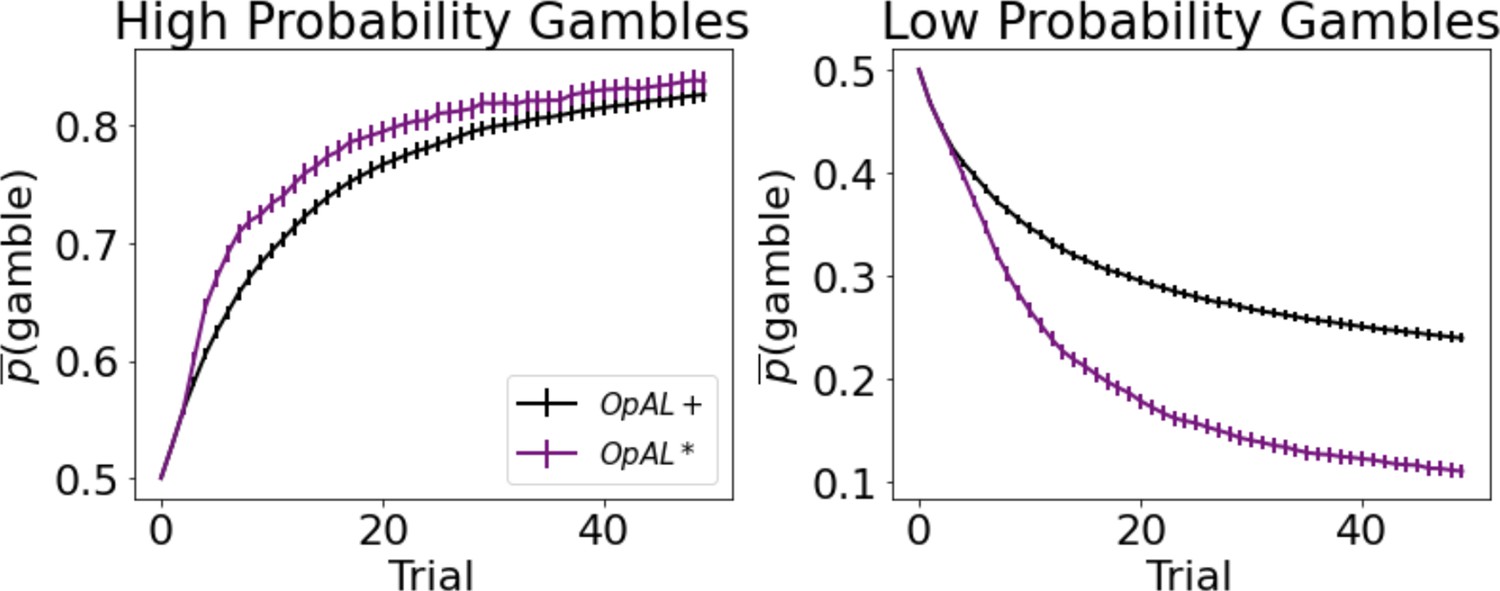
Dynamic dopamine modulation by estimated reward probability helps OpAL* decide when it is beneficial to gamble or to accept a sure reward.
, annealing parameter , and modulation parameters and . Results were averaged over 1000 simulated states. Error bars are standard error of the mean. To limit variance, paired OpAL* and OpAL models were again given the same initial random seed.
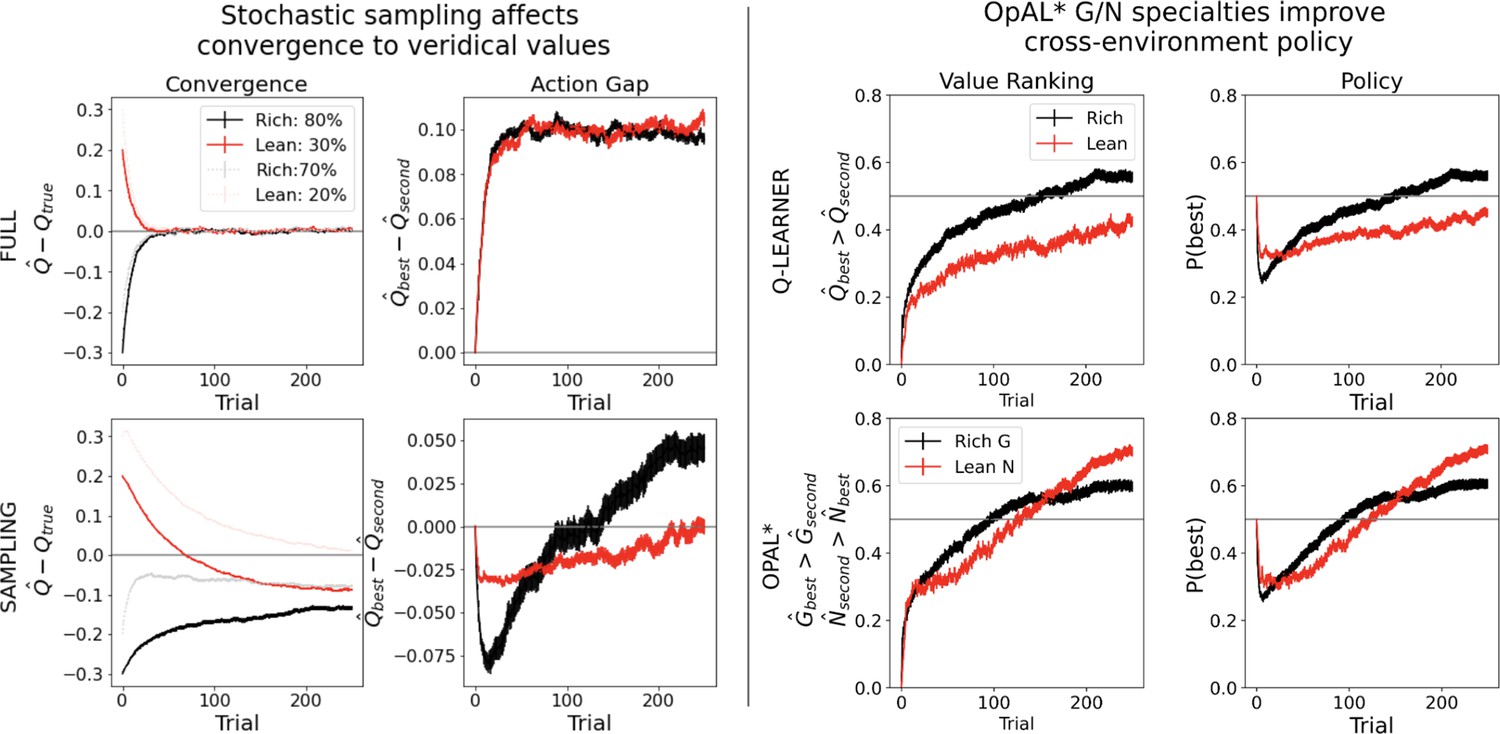
Figure 8 with 4 supplements
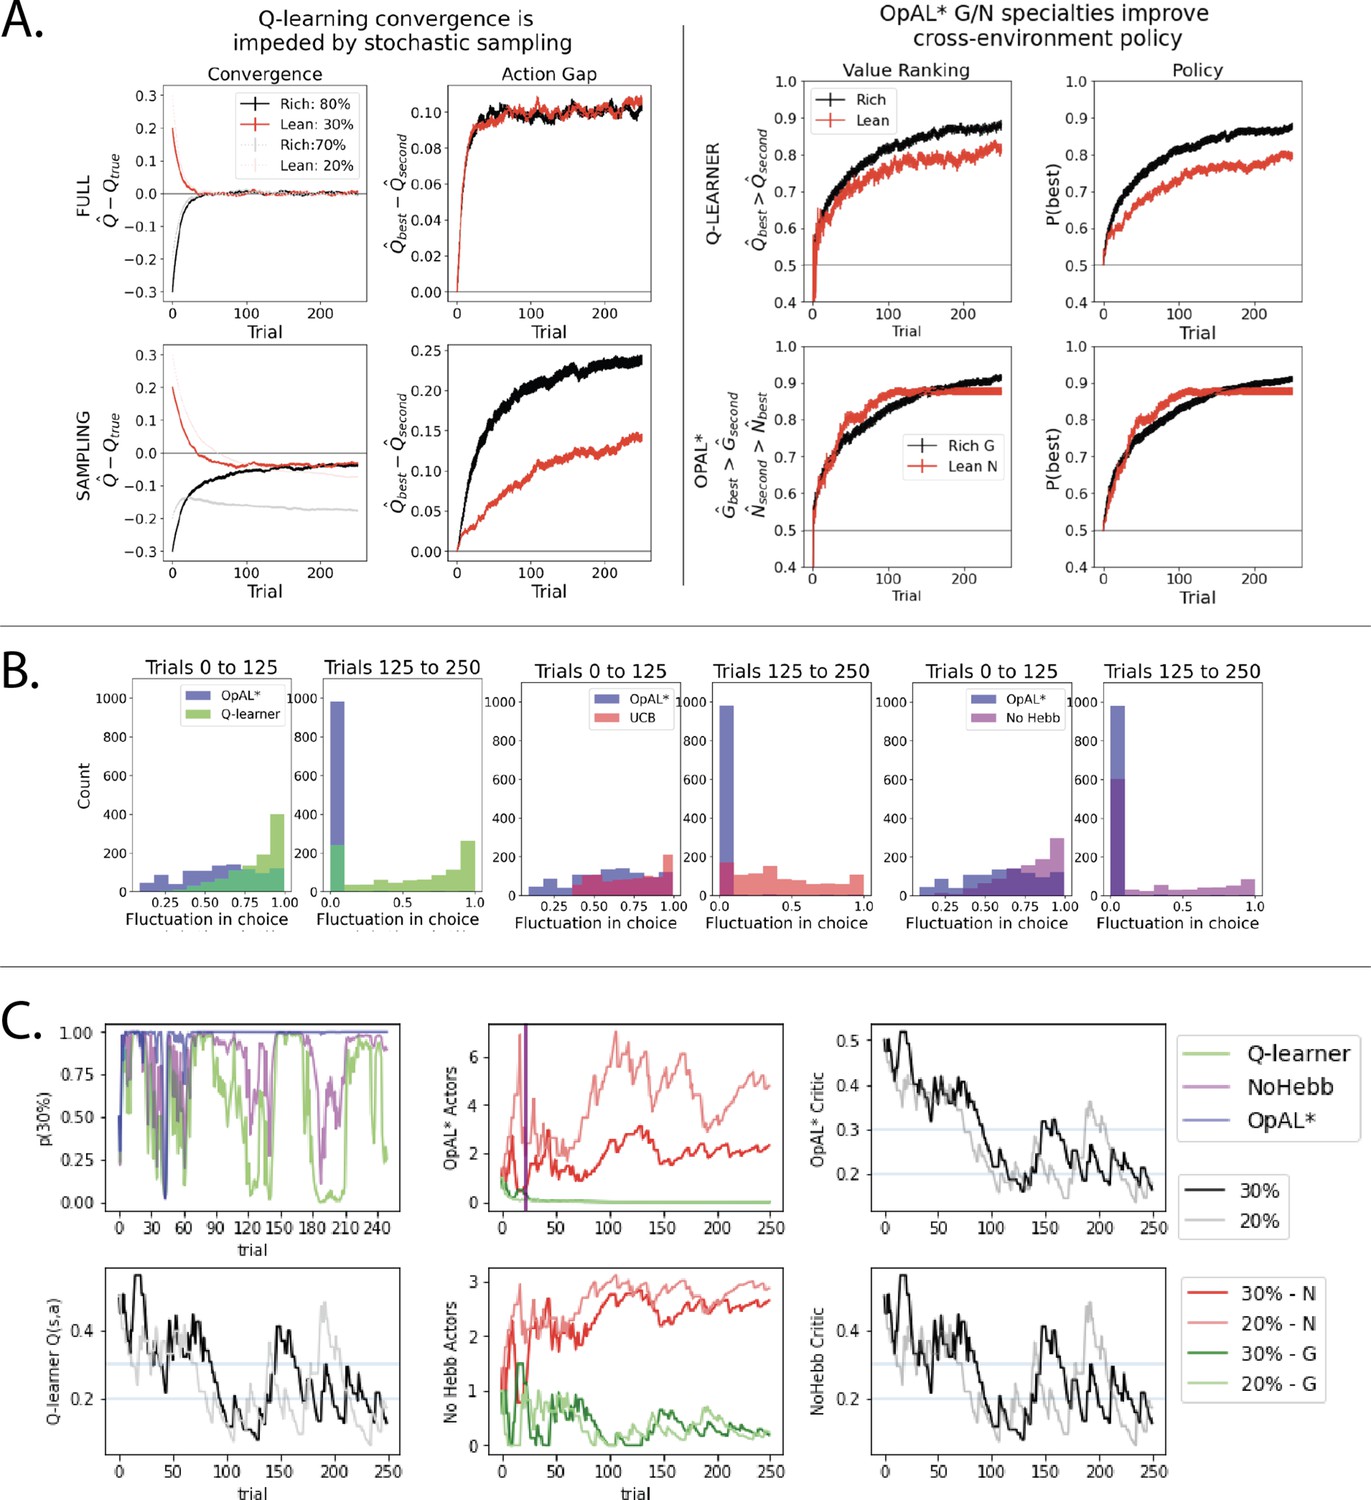
Overview of mechanisms contributing to performance differences.
Simulations in a and b conducted using the cross-environment optimized parameters according to grid search and 1000 simulations. (A) Left: stochastic sampling of actions hinders a Q learner’s convergence to true Q-values in lean environments (red lines) relative to rich environments (black/gray lines), causing reduced action gaps in lean environments. This difference is absent when full information is provided to the agent about reward outcomes for each alternative action (top row), implying that it is due to sampling (bottom row). Right: the proportion of simulations where the Q-value of the optimal action (80% or 30%) exceeds that of the suboptimal option (70% or 20%) differs in rich vs. lean, impeding the policy. In contrast, OpAL* capitalizes on the specialization in the N actor to discriminate between sparse reward outcomes, demonstrating comparable performance in both environments, as seen empirically in rodent behavior (Hamid et al., 2016). Similar patterns are seen in higher complexity environments (Figure 8—figure supplement 1). Learning curves reflect mean of 1000 simulations; error bars reflect standard error of the mean. (B) OpAL* exhibits reduced policy fluctuations in lean environments. Policy fluctuations are indexed by variability within simulations of the sign of . Higher standard deviation of this metric indicates more fluctuations, which are common in comparison models due to convergence issues. (C) OpAL* avoids policy fluctuations due to nonlinear accumulation of reward prediction errors (RPEs). Here, each agent experienced a fixed policy and reward sequence for a two-armed bandit (30% vs. 20%) to visualize learning dynamics for a fixed sequence of events. Left, top: each agent’s policy had they been able to freely choose. After initial exploration period, OpAL* reliably selects the optimal action; other agents again showed extended policy fluctuations. Middle: in OpAL*, N weights accumulate nonlinearly with RPEs for suboptimal 20% action, differentiating from 30%. This pattern is not present without Hebbian nonlinearity. Vertical bar indicates where dynamic DA is engaged as meta-critic determines the environment is lean, so OpAL* policy relies on the N actor. Similar patterns were observed for other random seeds.
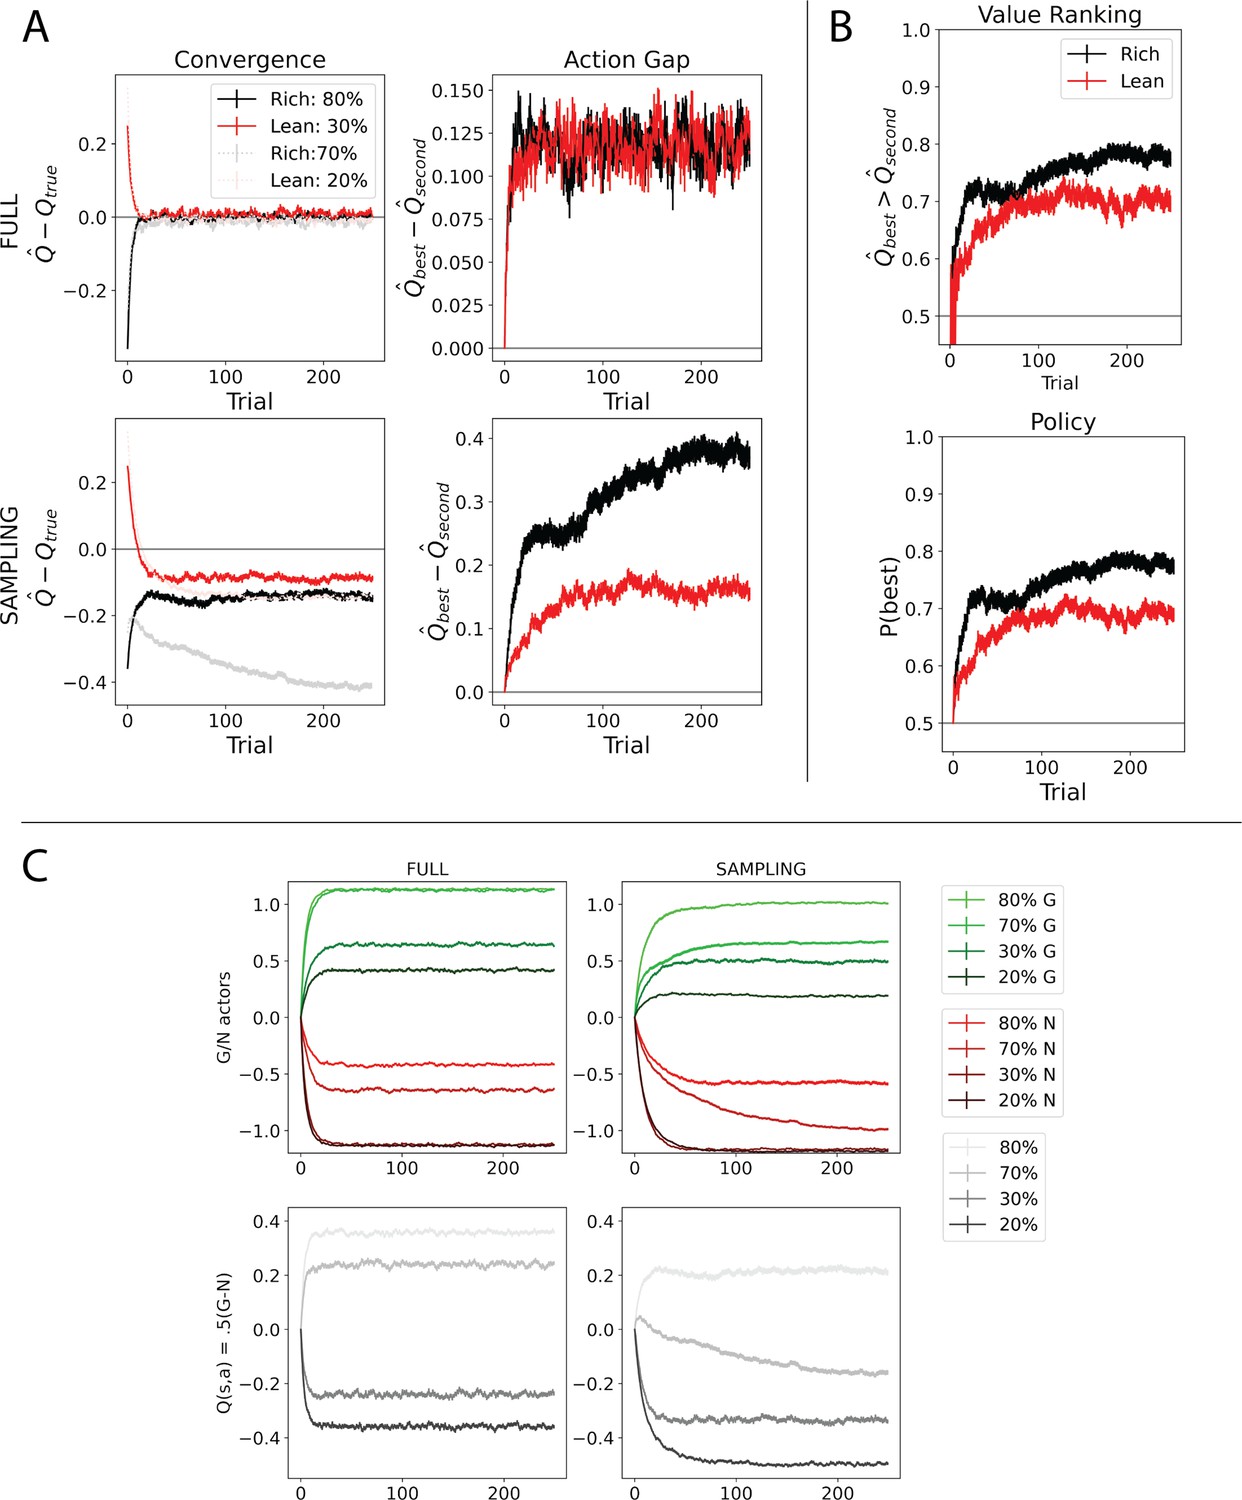
Figure 8—figure supplement 1
Q-learning convergence issues are amplified as the number of suboptimal actions increases.
Q-learning convergence issues are amplified when selecting among multiple actions (here, 6), causing decreased performance in lean relative to rich environments. OpAL* continues to show comparable action gaps between rich and lean environments. Learning curves reflect mean of 1000 simulations; error bars reflect standard error of the mean.
Figure 8—figure supplement 2
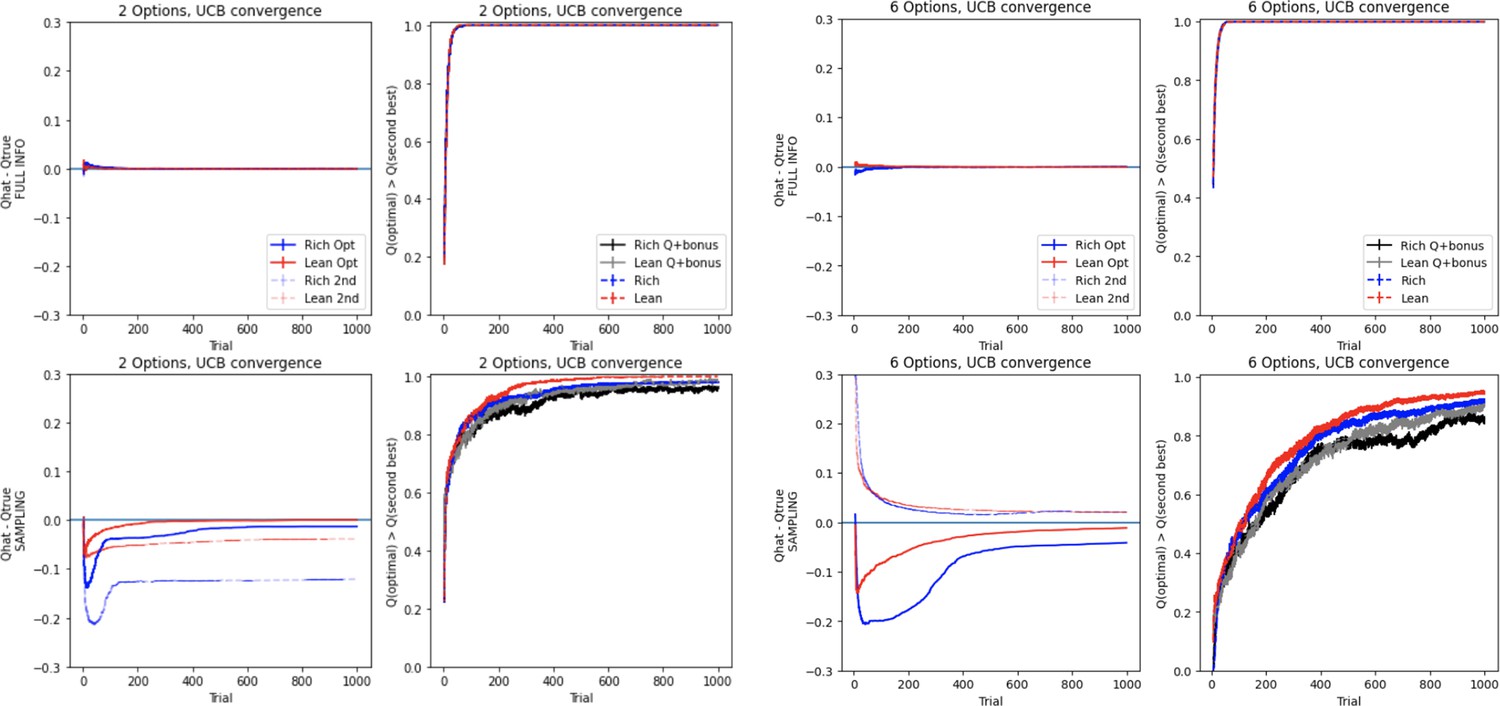
Upper Confidence Bound (UCB) convergence impacted by multiaction sampling.
UCB convergence is impeded when selecting among multiple actions, similar to Q-learning (Figure 8A and Figure 8—figure supplement 1). UCB’s exploration algorithm causes excessive sampling even when the correct answer is known (observe the difference between Q and Q+ bonus in the last 400 trials of the lean two-option environment), which is further exacerbated in high-complexity environments. Learning curves reflect mean of 1000 simulations; error bars reflect standard error of the mean.
Figure 8—figure supplement 3
Alternative opponent model that lacks three-factor Hebbian dynamics (Möller and Bogacz, 2019) is impacted by multiaction sampling.
Convergence behavior of Möller and Bogacz, 2019 due to sampling amongst multiple actions. (A) While under full information, the Möller and Bogacz model quickly converges, stochastic sampling affects this convergence for similar reasons as in Q-learning. Most notably, the convergence for the rich suboptimal option (70%) is underestimated as the model learns quickly to reliably select the optimal option (80%). Note that ‘Q-true’ here refers to the mean value to which the model converges when sampling a single action. We found that under probabilistic rewards that the Q-value (.5(G – N)) underestimates in rich and overestimates in lean, but reliably and stably provide ordinal rankings useful for decision-making. See panel (C). Right: the action gaps for rich and lean environments are divergent under stochastic sampling. (B) Under stochastic sampling, the proportion of simulations where the action gap is positive (i.e., in favor of the optimal action) is lower in lean than in rich environments (top), which ultimately translates to slowed policy in the lean environment (bottom). (C) G/N learning curves and Q-values –.5(G – N) – under full information (left) and stochastic policy (right). -N is plotted. Rich environment options converge less accurately to their full information representations, particularly the 70% option as it is undersampled and does not need to converge to learn an accurate policy. Both lean environment options are more accurate in their estimations, reflecting the increased exploration and sampling needed in lean environments (which produces worse performance in terms of net returns). (As nicely demonstrated in Möller and Bogacz, 2019, actor-critic variants which utilize the state value V(s) as a critic can cause similar G/N misestimations for suboptimal values due to the critic converging to the optimal option. However, in our simulations, misestimations arose for both options even with an actor-only implementation.) Learning curves reflect mean of 1000 simulations; error bars reflect standard error of the mean.
Figure 8—figure supplement 4
Consistency of reward prediction error (RPE) valence in OpAL* induces convexity.
From Collins and Frank, 2014. Higher-order terms in the recursive update caused by three-factor Hebbian dynamics (Equation 22) implicitly encode consistency in the valence of RPEs. This can be illustrated by varying actor learning rates, and . Higher learning rates imply greater influence of these higher-order terms (e.g., two-way interactions are scaled by ), inducing exaggerated convexity for G weights in rich environments (more consistency of positive RPEs) and N weights in lean environments (more consistency of negative RPEs).
Figure 9
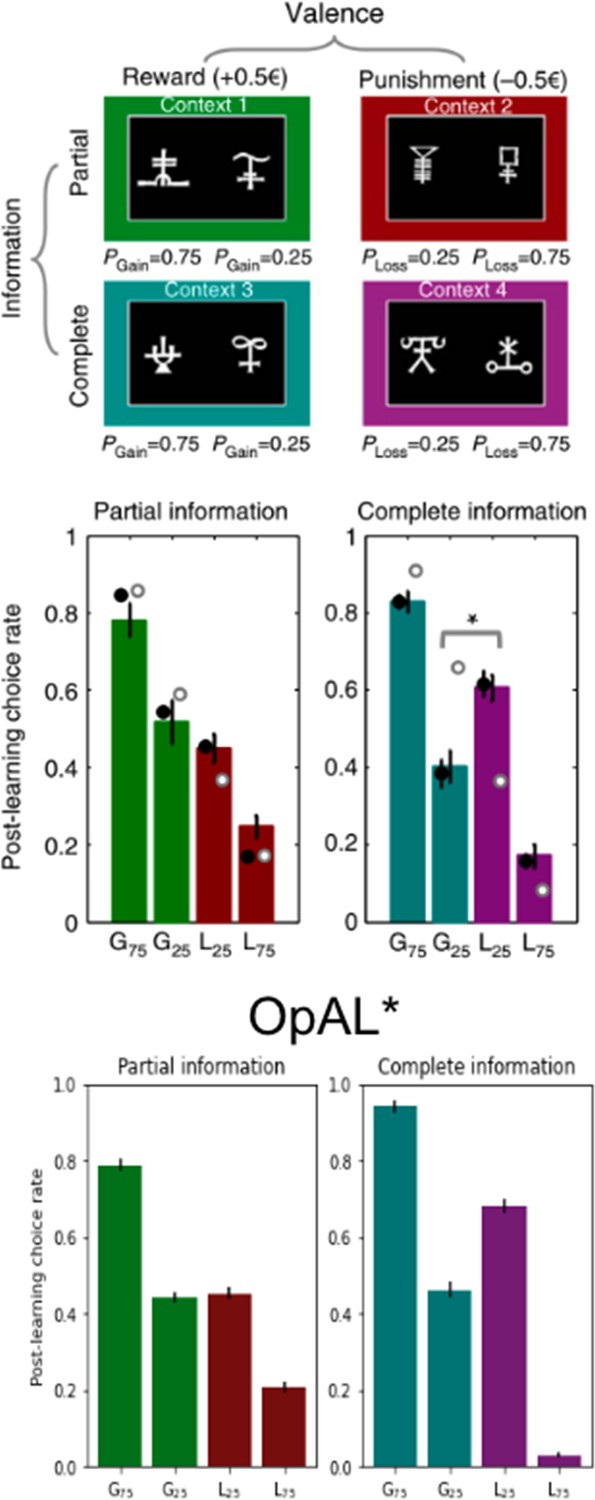
OpAL* captures counterintuitive and context-dependent human choice preference in Palminteri et al., 2015.
In Palminteri et al., 2015, participants learned to select between two stimuli to maximize their rewards. Participants learned about eight stimuli in total, where two stimuli were always paired together during the initial learning phase for a total of four ‘contexts.’ Contexts varied in valence – either rewarding or punishing – and varied in information – either only feedback of the selected action was provided (partial) or counterfactual information was also provided (complete). In the gain contexts, one action had a probability of receiving reward 75% of the time or nothing (G75%); the other received reward 25% of the time or nothing (G25%). In the loss contexts, the preferred action received a punishment 25% of the time or nothing (L25%); the other received a loss 75% of the time or nothing (L75%). In a post-learning transfer phase, participants were presented with stimuli every pair-wise combination regardless of context and were asked to choose which stimuli they preferred. For items learned under complete information, participants counterintuitively preferred the more frequent loss avoider (L25%) to the less frequent rewarding stimulus (G25%). While a standard Q-learner would predict preference according to expected value as is seen in the partial information results, a model which incorporates the relative value of an action to the state value into its prediction error would predict the counterintuitive results as Palminteri et al., 2015 propose. OpAL* can similarly capture these results by allowing the critic to quickly reflect the context value. Like in the model proposed by Palminteri et al., 2015, complete information allows the critic to converge more quickly to the state value and produce positive prediction errors for the frequent loss avoider (L25%) and negative prediction errors for the infrequent reward earner (G25%). Error bars for OpAL* show standard error of the mean. Top images (paradigm and empirical findings) reproduced from Figure 1a of Palminteri et al., 2015.
Figure 10
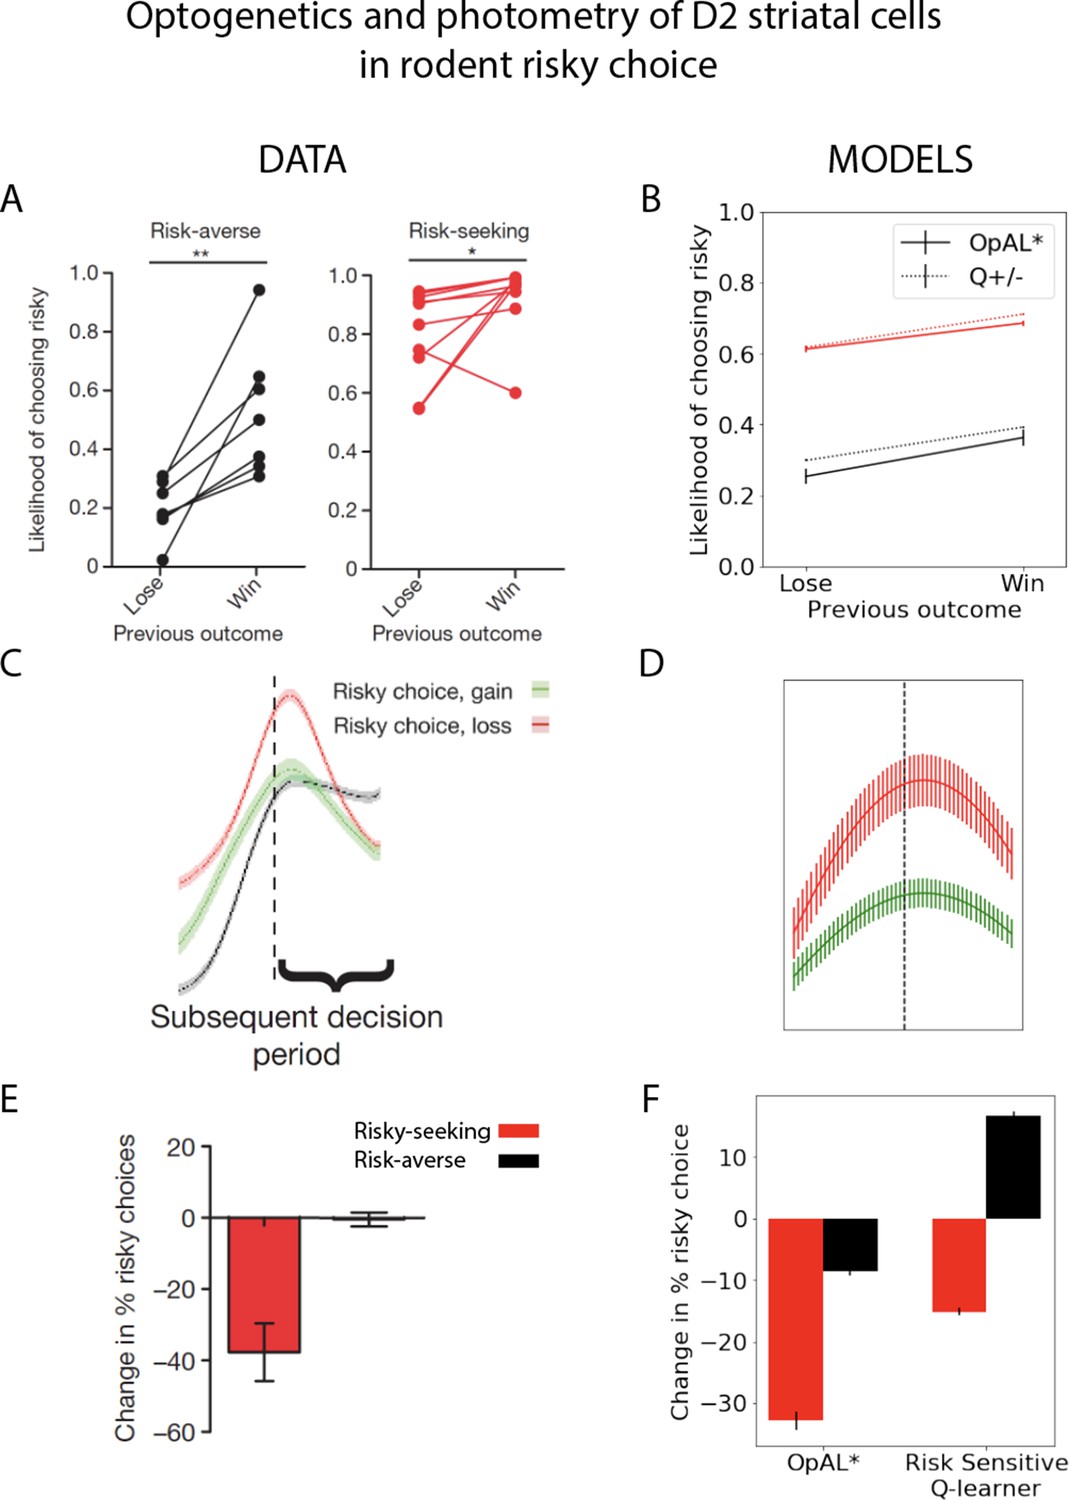
Striatal D2 medium spiny neuron (MSN) activity and reward history alter risky choice in rodents.
Rodents repeatedly selected between a certain option with low magnitude of reward and a gamble with higher payout when successful. Left column: reproduced from Zalocusky et al., 2016. Right column: model simulations with OpAL* and risk-sensitive RL (RSRL). (A, B) Both risk-averse and risk-seeking animals are more likely to avoid a gamble after a gamble ‘loss’ (failure to obtain the large reward). Both OpAL* and RSRL, a standard Q-learner with different learning rates for positive and negative prediction errors, can capture this trend, via changes in either choice function (D1 vs. D2 MSN contributions) or learning rates, respectively. Error bars for OpAL* show standard error of the mean. (C, D) D2 MSN activity, measured via photometry, is larger after a gamble loss (red) than a gamble win (green) during the subsequent decision period. This pattern is reproduced in OpAL*, whereby D2 MSN activity is influenced by the product of the weights and the adaptive βn, which amplifies D2 MSN activity when dopamine levels are low. The simulation peak represents the average of this product after a loss or after a win, which is carried over to subsequent choices; error bars reflect SEM across simulations and dynamics before and after peak were generated by convolving the signal with a sinusoidal kernel for illustrative purposes. (E, F) Optogenetic stimulation of D2 MSNs during the choice period induces risk-aversion selectively in risk-seeking rats. OpAL* captures this preferential effect by magnifying the effective D2 MSN activity and inducing avoidance primarily in risk-seeking agents. In contrast, RSRL predicts opposite patterns in risk-seeking and risk-averse animals. Error bars for simulations show standard error of the mean. Parameters OpAL*: . Baseline risk-seeking (0.85) and risk-averse (–0.75). Parameters RSRL: risk-seeking ; risk-averse . Since optogenetic effects were evident primarily during the choice period, we modeled this by changing the choice function in both models: in OpAL, trial-wise values were decreased by 1.0 to mimic increased D2 MSN activity/decreased DA. In RSRL, the choice function was altered by reducing (to 0.01), leading to opposite directional effects in risk-seeking and risk-averse agents. Agents selected between a certain option and a 50/50 gamble with twice the payout for 100 trials.
© 2016, Nature Publishing Group. Panels A, C and E are reproduced from Figures 1f, 3f and 4f from Zalocusky et al., 2016, with permission from Nature Publishing Group. They are not covered by the CC-BY 4.0 license and further reproduction of these panels would need permission from the copyright holder.
Figure 11
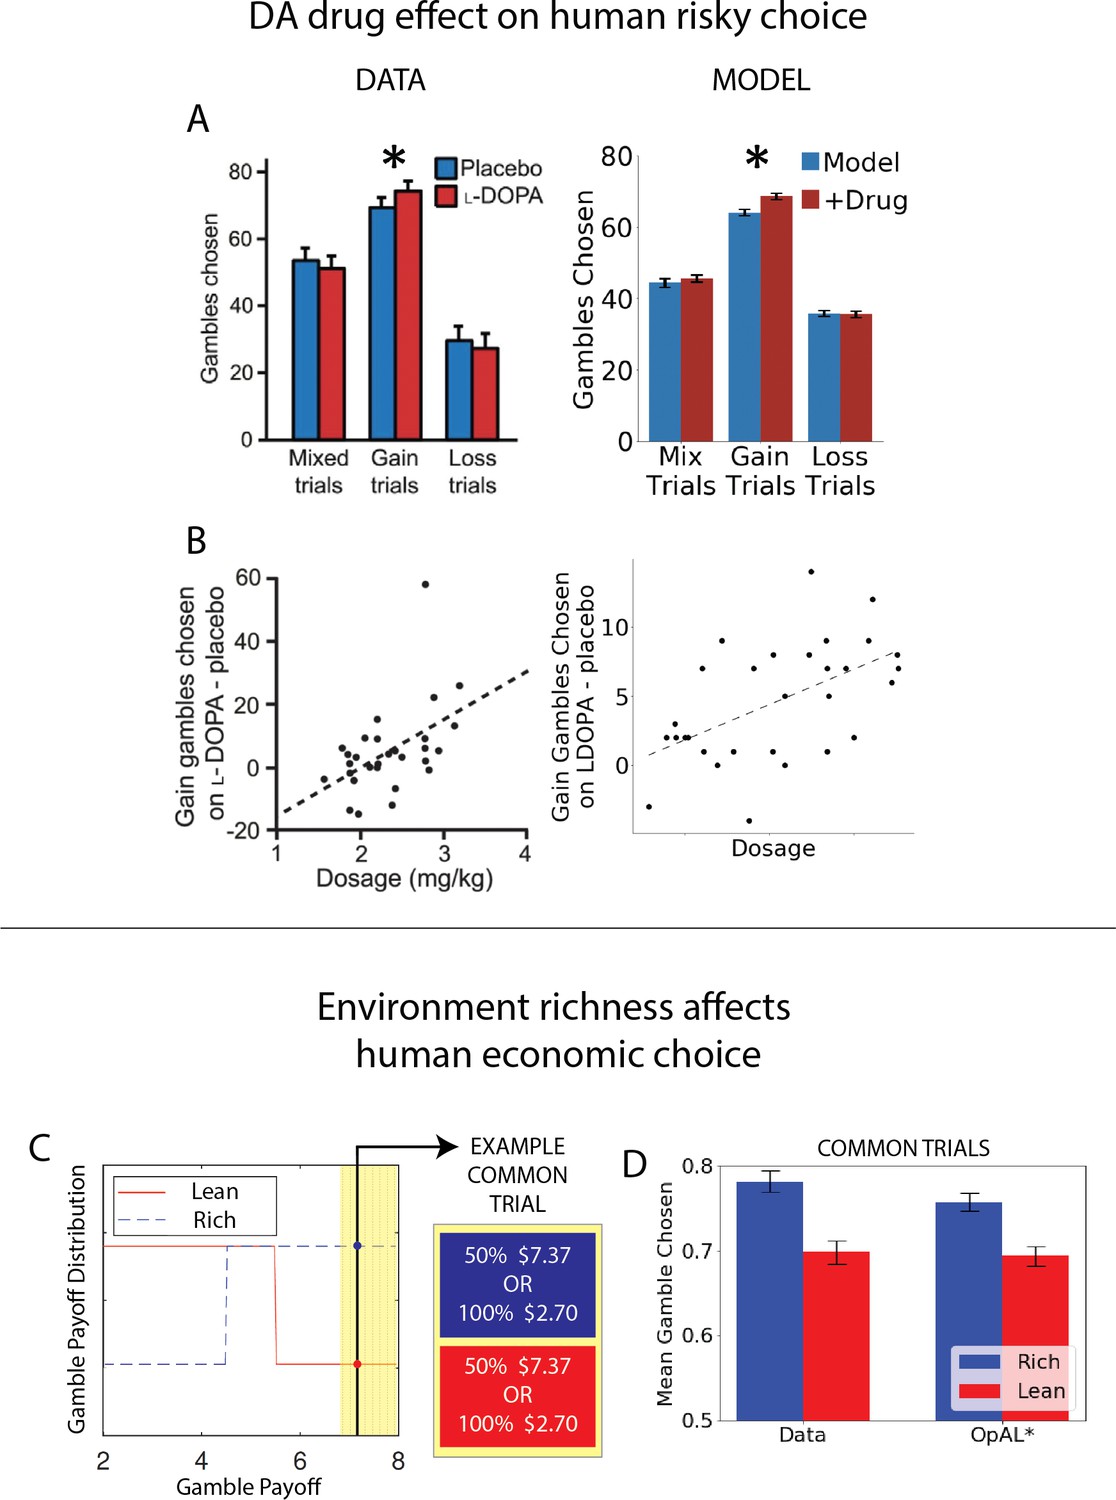
OpAL* captures human risk-taking patterns and their manipulation by drug and environmental context.
(A, B) Dopamine (DA) drug effects on risky decision-making and individual differences therein. OpAL* captures behavioral risk patterns of healthy participants on and off L-DOPA, a drug which boosts presynaptic DA. (A) L-DOPA administration selectively increased risky choice in gain trials, where choice was between a sure reward and a 50% gamble for a larger reward, as compared to loss trials (sure loss vs. gamble to avoid loss) or mix trials (in which gambles could result in gains or losses). Error bars for OpAL* show standard error of the mean. Left: modified figures from Rutledge et al., 2015. (B) These effects were larger for subjects with higher effective drug doses, Spearman’s . Left: modified figures from Rutledge et al., 2015. Right: OpAL* simulations reproduce these selective effects. Spearman’s To model individual differences in effective drug levels, for each pair of model on and off drug, was drawn from a normal distribution centered at 0.5 with variance 0.25. Parameters: . (C, D) Risky decisions are sensitive to environmental richness In contrast to other empirical results discussed where dopamine pathways were directly manipulated, Frydman and Jin, 2021, manipulated reward statistics of the payoffs in the environment, as in our normative simulations. Participants chose between a certain reward and a 50% gamble over two blocks. The distribution of payoffs in each block was either Rich (higher frequency of large magnitudes) or Lean (higher frequency of small magnitudes). Crucially, each block contained predetermined ‘common trials’ where the payoff of both the gamble and certain option was fixed (e.g., an offer 50% $7.13 vs. 100% $2.70 was presented in both the Rich and Lean block). The key finding was that participants were more likely to gamble on these common trials when presented in the Rich context. OpAL* reproduces this pattern due to adaptive increasing DA levels and risk-tasking in the Rich block. Error bars show standard error of the mean. Parameters: . Figure C modified from Frydman and Jin, 2021.
Appendix 1—figure 1
Effects of dopaminergic states that inaccurately reflect environmental richness.
Parameters optimized the average area under the curve (AUC) across both rich and lean environments according to the grid search. See ‘Parameter grid’ search for details.
Appendix 1—figure 2
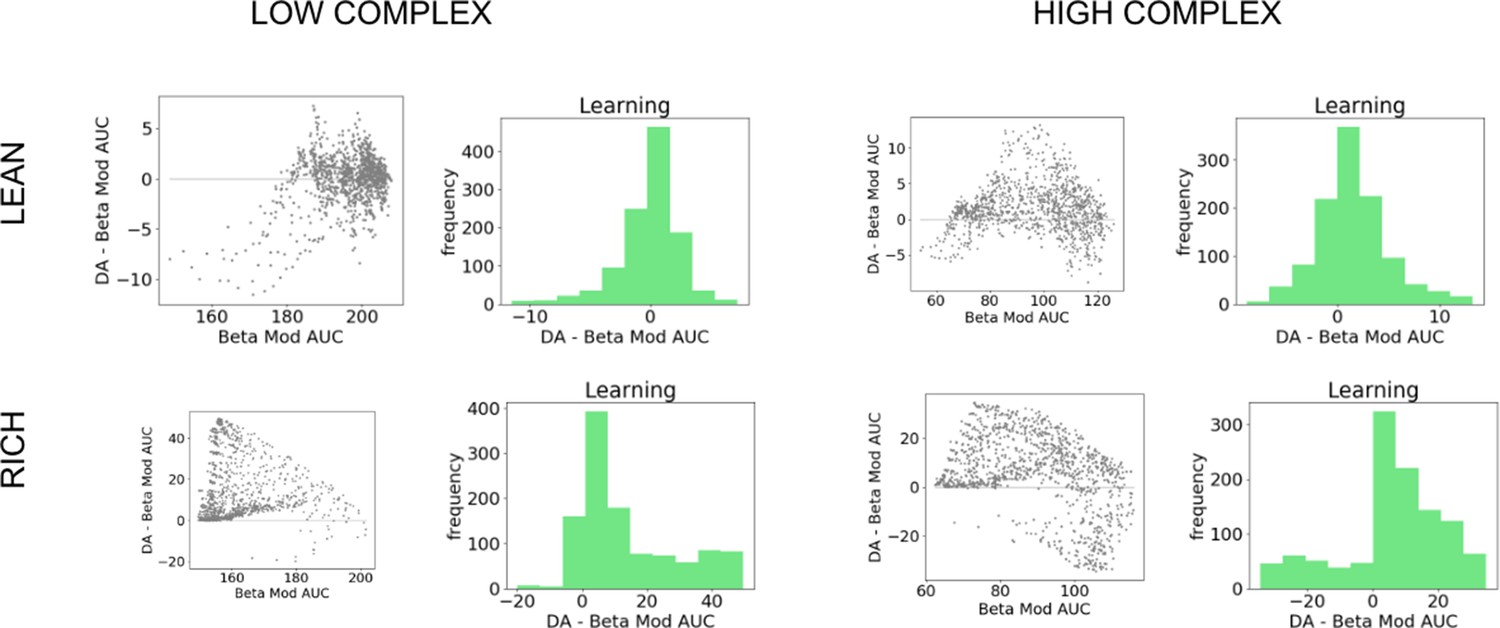
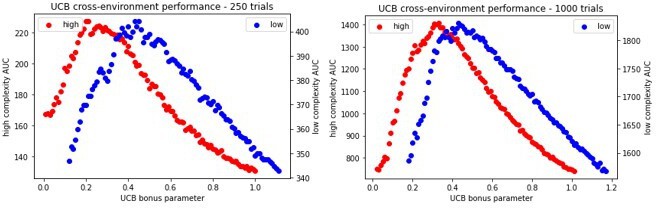
Comparison of OpAL* to dynamic modulation of softmax temperature (bmod).
Figure shows average areas under the curve (AUCs) of models for fixed parameter in both lean and rich environments for varying complexity. Histograms show differences in AUC of paired parameters. Across horizons and complexity levels, OpAL* significantly outperformed Bmod in the rich environment (). As time horizons increase, Bmod outperforms begins to outperform OpAL* in lower complexity levels for lean environments (levels 2 and 3 for 500 trials, all complexity levels for 1000 trials []), though with smaller effect sizes than OpAL*’s relative performance in rich.
Appendix 1—figure 3
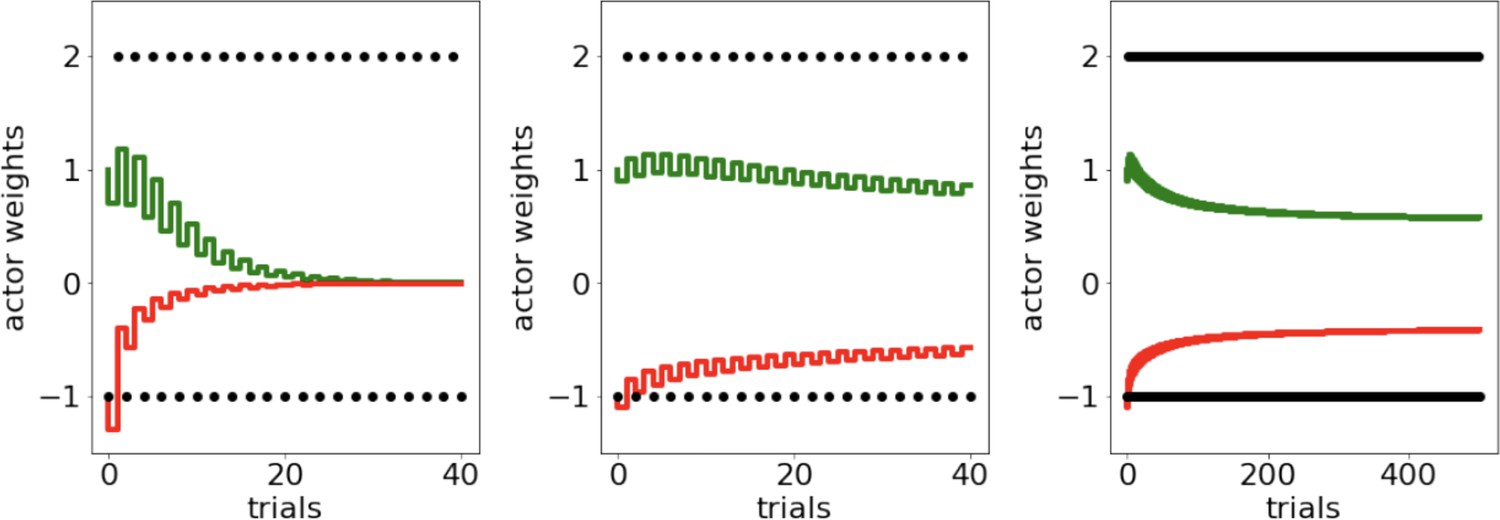
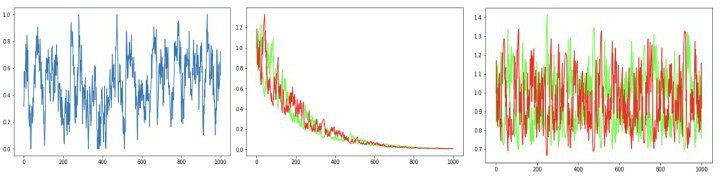
Scenario presented in Möller and Bogacz, 2019, where oscillating payout of +2 and loss of –1 induces accelerated decay of G and N weights to zero, caused both by large reward magnitudes and quick convergence of the critic.
To protect against such decay, we introduce normalization of reward prediction errors and learning rate annealing (middle and right).
Appendix 1—figure 4
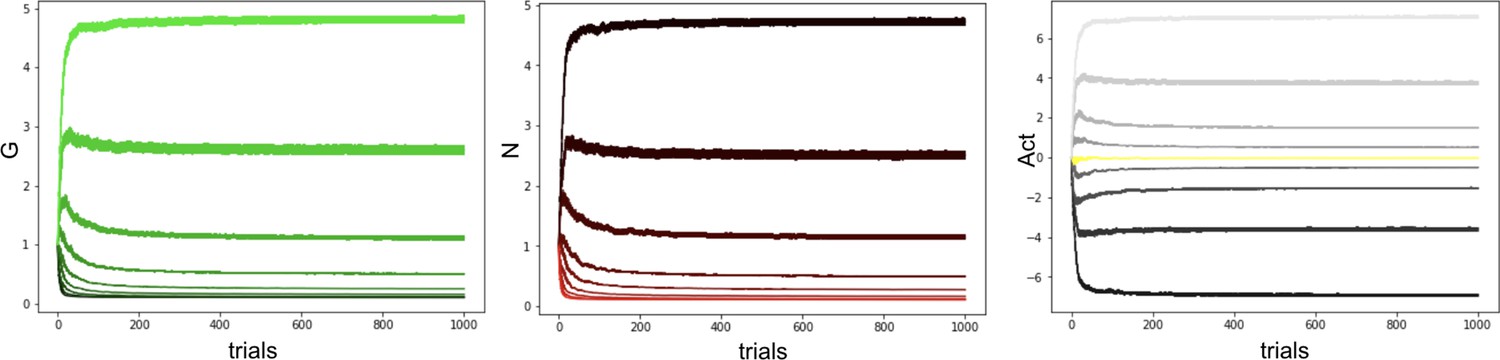
Our proposed annealing preserves ordinal rankings for extended learning.
Curves averaged over 100 simulations.
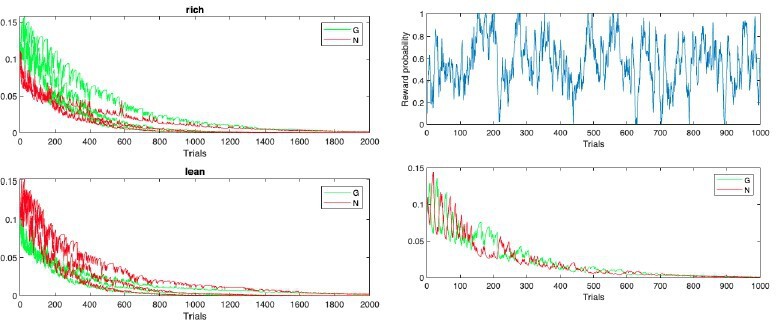
Appendix 1—figure 5

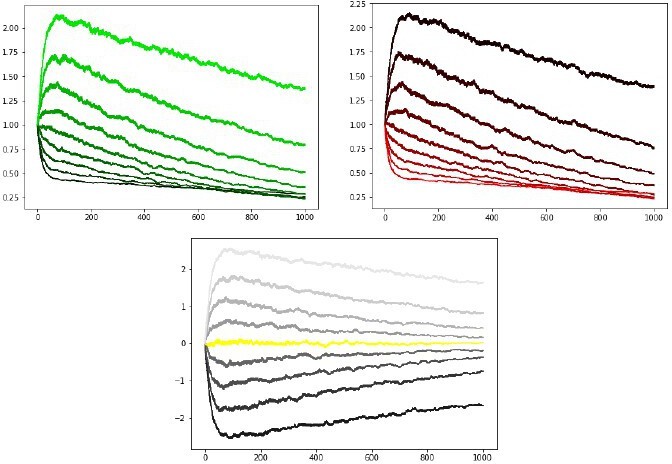
Combination of decay and annealing can also improve OpAL* responses to highly volatile environments, such as in a random walk (left, probability of reward).
Middle: OpAL* annealing slows convergence of G weights (green) and N weights (red) to zero but the model still suffers from decay. Right: OpAL* with decay and Bayesian annealing allow flexibility, though the optimization of this combined mechanism for variable environments is beyond the scope of this article.
Appendix 1—figure 6

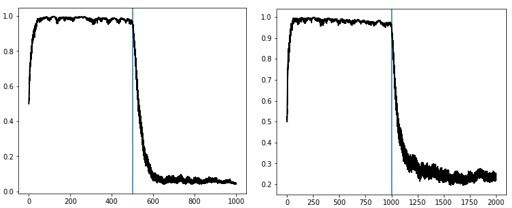
Left: Bayesian annealing allows OpAL* to remain flexible when the rewarding option suddenly changes.
Two-armed bandit task where option A is rewarded 80% of the time and option B is reward 50% of the time. After 150 trials, the reward contingencies reverse and option A is the least rewarding. Right: augmenting OpAL* further with decay as proposed by Franklin and Frank, 2015 increases adaptiveness to a switch point.
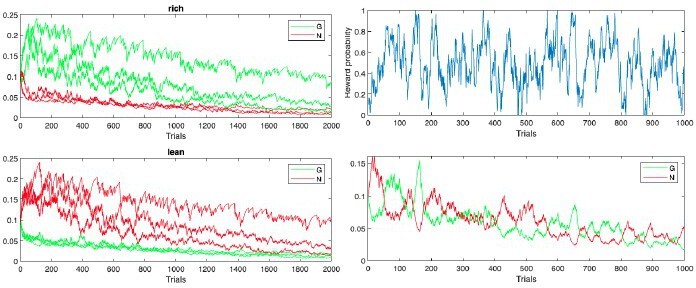
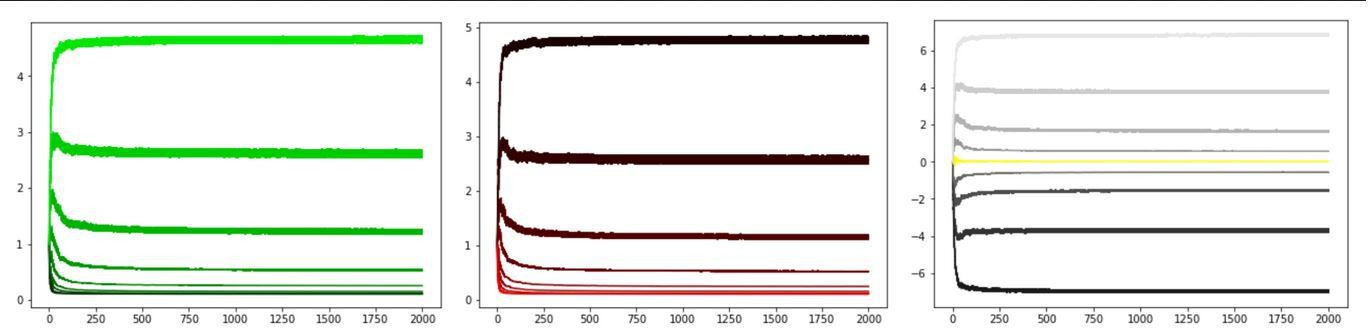
Author response image 1
Initial simulations from with Reviewer 3’s code and parameters (more positive G(N) values correspond to actions with higher reward probability in rich(lean)).
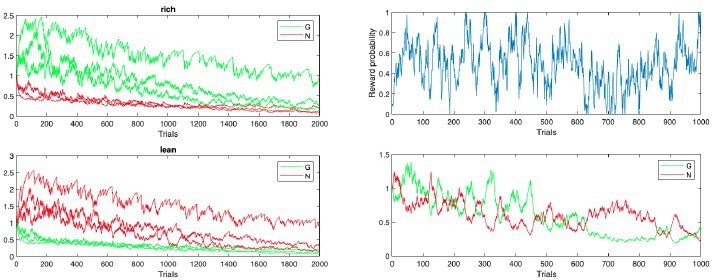
Author response image 2
Modified learning rates.
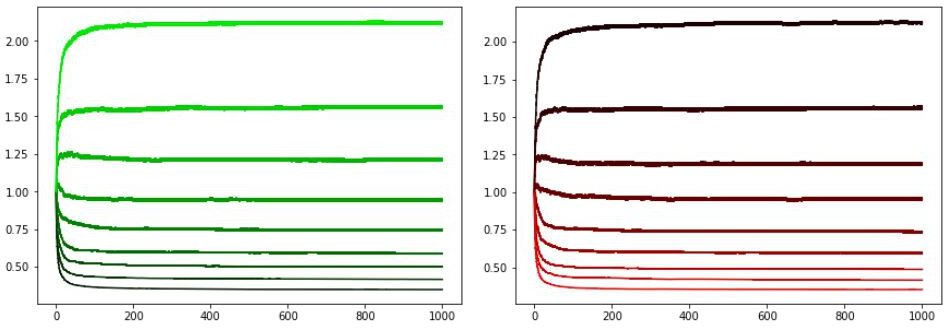
Author response image 3
Modified learning rates and actor initialization.
Author response image 4
Author response image 5
Author response image 6
Author response image 7
Author response image 8
Author response image 9

Author response image 10
Author response image 11
Author response image 12
Author response image 13
Author response image 14
Additional files
Download links
A two-part list of links to download the article, or parts of the article, in various formats.
Downloads (link to download the article as PDF)
Open citations (links to open the citations from this article in various online reference manager services)
Cite this article (links to download the citations from this article in formats compatible with various reference manager tools)
On the normative advantages of dopamine and striatal opponency for learning and choice
eLife 12:e85107.
https://doi.org/10.7554/eLife.85107


