The locus coeruleus broadcasts prediction errors across the cortex to promote sensorimotor plasticity
- Friedrich Miescher Institute for Biomedical Research, Switzerland
- Faculty of Sciences, University of Basel, Switzerland
Figures
Figure 1 with 1 supplement
LC axonal calcium activity reflects unsigned visuomotor prediction errors.
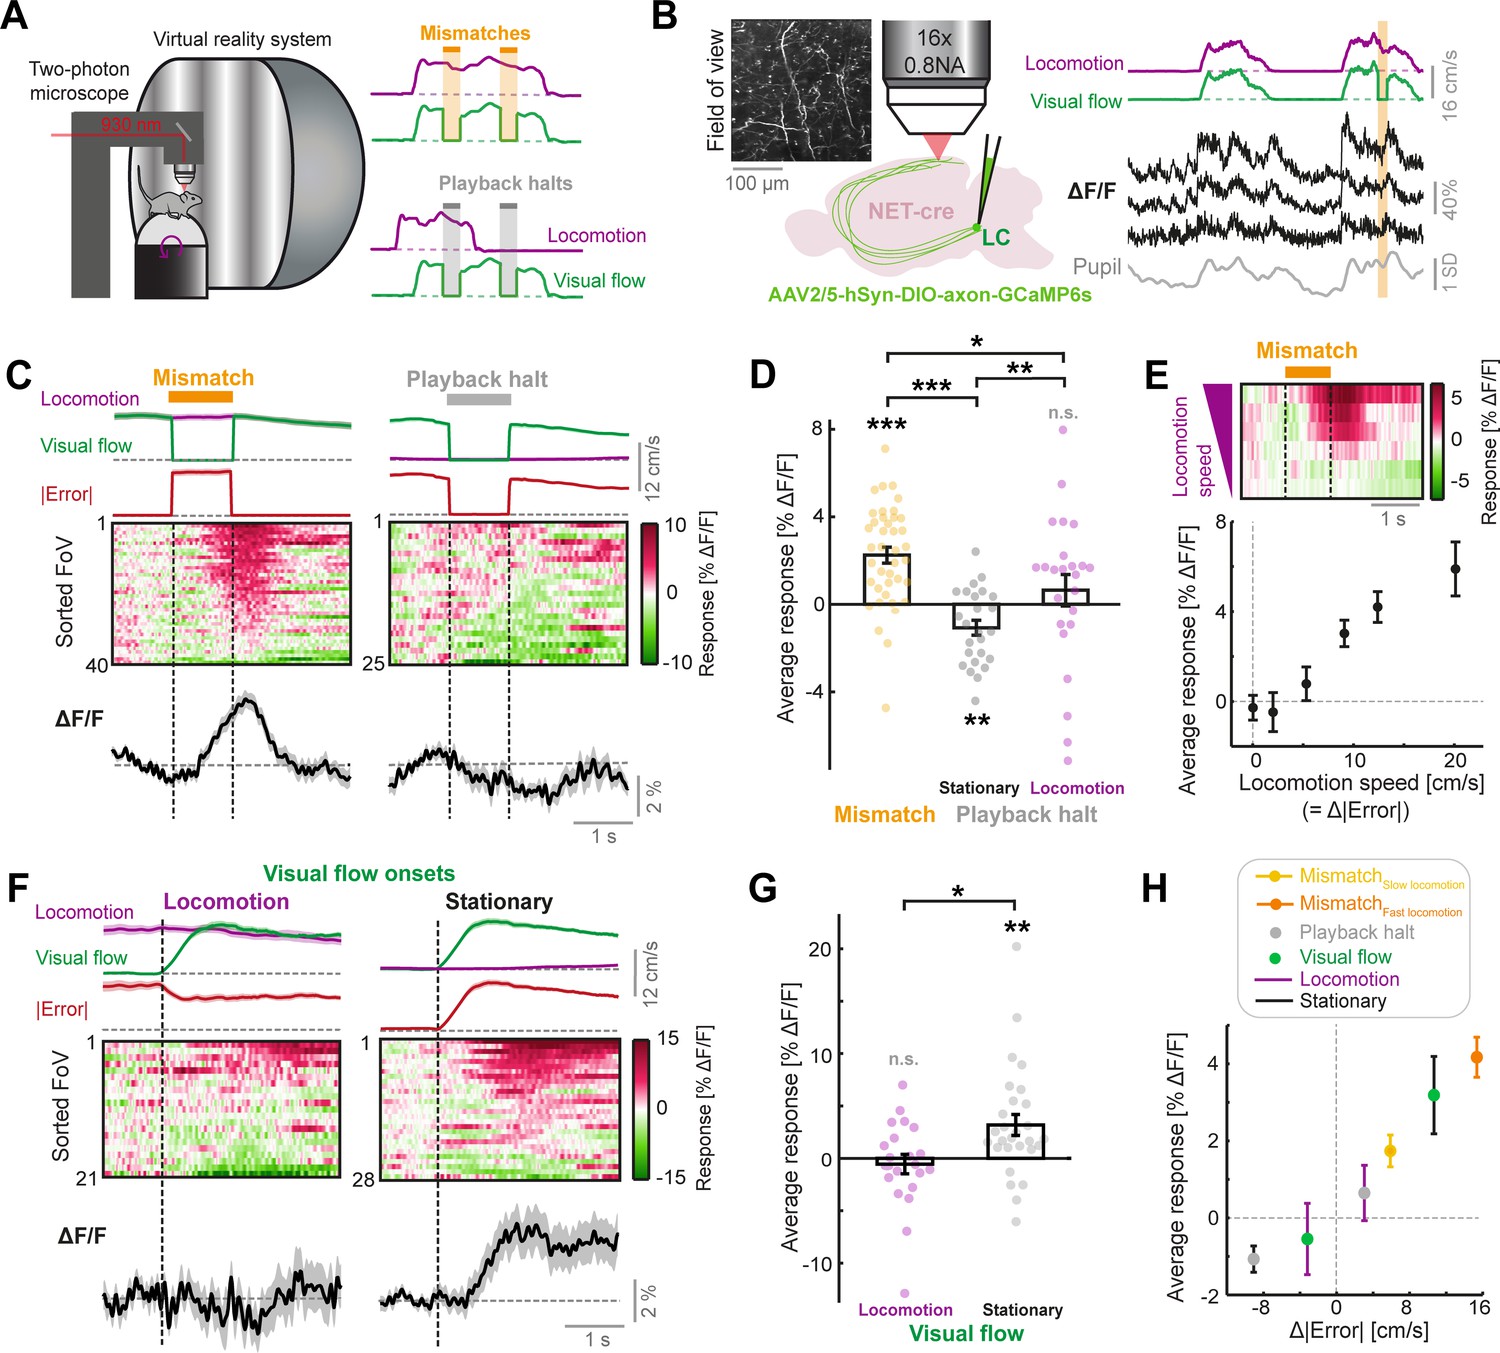
(A) Left: Schematic of the two-photon microscope and virtual reality system. Right: Schematics of the two virtual reality conditions. Top: closed loop condition in which visual flow speed (green) is yoked to locomotion speed (purple). Mismatches consist of 1 s halts in visual flow during locomotion (orange shading). Bottom: open loop condition in which visual flow from the closed loop session is replayed to the mouse uncoupled from locomotion. Playback halts are 1 s halts in visual flow in the open loop condition (gray shading). (B) Two-photon calcium imaging of LC axons in the dorsal cortex. Left: NET-Cre mice underwent stereotactic viral vector injections to express axon-targeted GCaMP6s in the LC. Four weeks later, axons were imaged in two regions of the cortex. Inset shows example two-photon field of view (FoV). Right: Example ΔF/F traces (black) from three different axon segments in the same FoV, recorded during the closed loop condition. Purple and green traces show locomotion and visual flow speed respectively. Orange shading indicates mismatch events. Gray trace shows pupil diameter. (C) Responses of LC axons to visual flow halt stimuli (left: mismatches, and right: playback halts while the mouse is stationary). Top: Locomotion speed (purple), visual flow speed (green) and absolute error (red; absolute difference between visual flow speed and locomotion speed) each averaged across trials. Middle: Heat map of the average responses of different fields of view (FoVs) sorted according to response magnitude. Bottom: Response averaged across FoVs. Shading indicates SEM. (D) Average responses per FoV to mismatches and playback halts, while the mouse was either stationary or locomoting. Error bars indicate SEM across FoVs. Here and in other panels, n.s.: not significant, *: p<0.05, **: p<0.01, ***: p<0.001. For complete statistical information see Supplementary file 1. (E) Mean mismatch response of LC axons averaged across FoVs as a function of locomotion speed. Top: Heat map of the average mismatch response, sorted according to locomotion speed (speeds correspond to below plot). Bottom: Mean and SEM (error bars) of the mismatch responses averaged over FoVs as a function of locomotion speed. Only datapoints with at least 10 FoVs in each speed bin are included. (F) Responses of LC axons to visual flow onsets in the open loop condition during locomotion (left) or stationary periods (right), plotted as in panel C. (G) Average responses of LC axons to visual flow onsets while the mouse was either locomoting or stationary, plotted as in panel D. (H) Responses of LC axons to the different visual flow stimuli in different conditions averaged across FoVs, color coded according to the legend, and plotted as a function of the change in absolute error between locomotion speed and visual flow speed during the stimulus (relative to 1 s prior to stimulus onset). Error bars indicate SEM.
Figure 1—figure supplement 1
Additional information and analyses on two-photon imaging of LC axons.
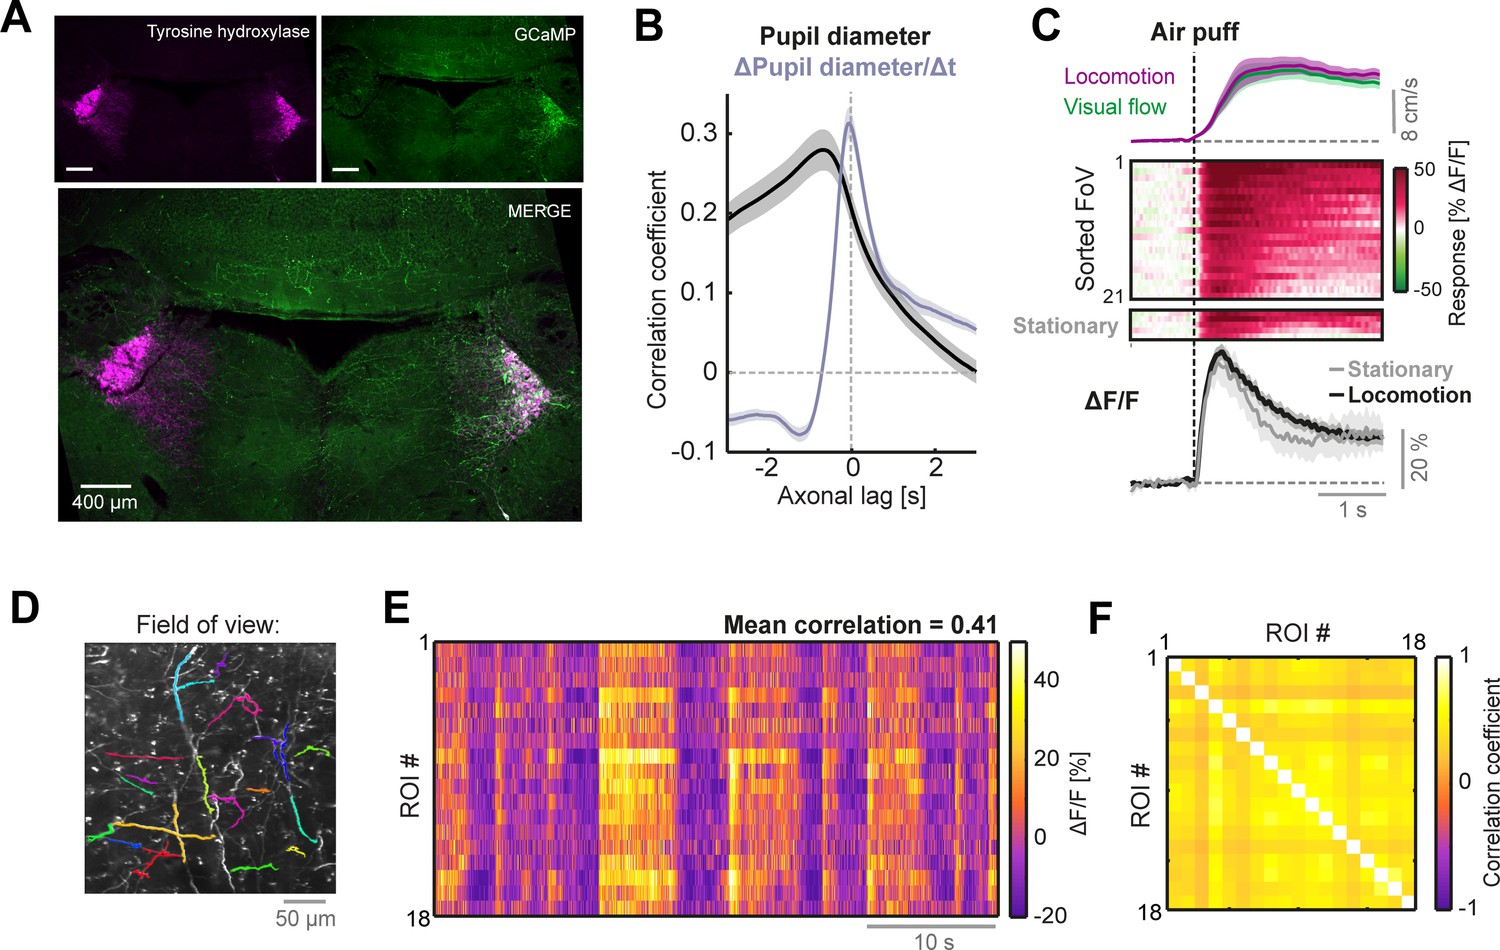
(A) Confocal micrographs showing immunolabelling for tyrosine hydroxylase (magenta) and GCaMP6s (green) in the two LC. GCaMP6s was expressed via stereotactic viral vector injection into only the right LC of NET-Cre mice. (B) Cross-correlations between LC axonal ΔF/F and pupil diameter (black) or the time derivative of pupil diameter (gray) averaged across 40 FoVs. Shading indicates SEM. Positive axonal lag values indicate time delays where axonal fluorescence lags relative to pupil diameter or its derivative. (C) Responses to air puff stimuli applied to the flank which were infrequently used to evoke locomotion (here during the closed loop condition). Top: Average locomotion speed (purple) and visual flow speed (green) for trials that evoked locomotion. Middle: Heat maps of the average air puff responses of different FoVs sorted according to response magnitude, for trials that evoked locomotion (top heat map) and rare trials that did not evoke locomotion (bottom heat map). Bottom: Response averaged across FoVs for air puff trials that evoked locomotion (black) and those that did not (gray). Shading indicates SEM. (D) Example two-photon field of view of LC axons, with 18 regions of interest (ROI) superimposed in different colors. (E) Heat map of ΔF/F of the 18 ROIs in panel D from a segment of closed loop experience. (F) Correlation matrix of the activity of the 18 different ROIs in panels D and E.
Figure 2 with 1 supplement
LC axonal responses are similar in sensory (posterior) and motor (anterior) cortical areas.
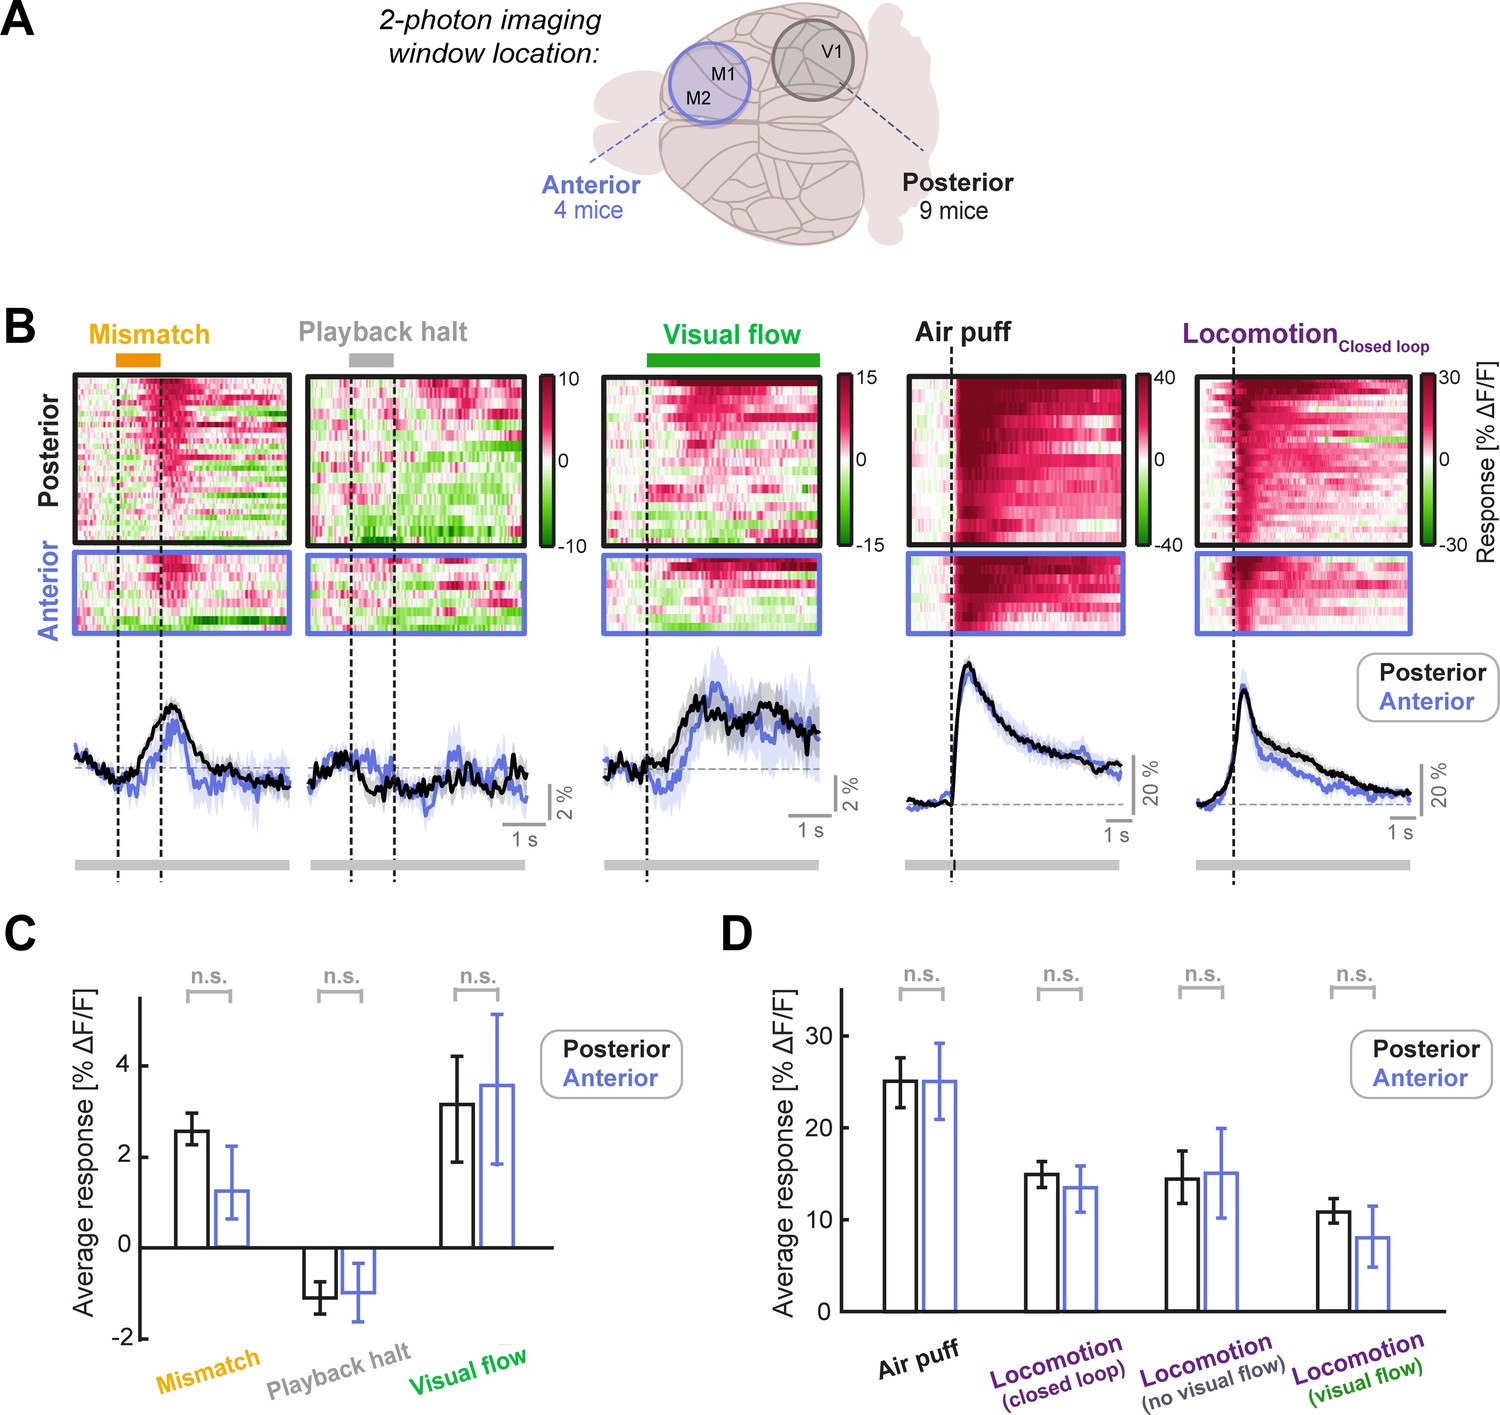
(A) Schematic of the two different locations of the two-photon imaging windows used. Posterior windows were centered on V1 and included surrounding structures, while anterior windows included the primary and secondary motor cortex. (B) Responses of posterior and anterior FoVs to (from left to right): Mismatch, playback halts (stationary), visual flow (stationary), air puff, and locomotion onset in closed loop. Each heatmap is sorted by average response. Color scale is ΔF/F. Traces below heatmaps show average across FoVs, for posterior (black) and anterior (blue) imaging sites. Shading shows SEM. Bar below plot indicates significance of comparison at each time point using an unpaired t-test: grey indicates p>0.01, black indicates p<0.01. (C) Average responses of LC axons to mismatch, playback halt, and visual flow onset averaged across FoVs, compared between posterior and anterior imaging locations. Error bars indicate SEM. Here and in other panels, n.s.: not significant. For complete statistical information see Supplementary file 1. (D) As in C, but for air puff responses (which were infrequently used to evoke locomotion) and locomotion onset responses in various conditions, each averaged in the 3 s window after onset. Note that locomotionVisual flow and locomotionNo visual flow occur in open loop conditions (see also Figure 2—figure supplement 1).
Figure 2—figure supplement 1
Locomotion onset responses of LC axons.
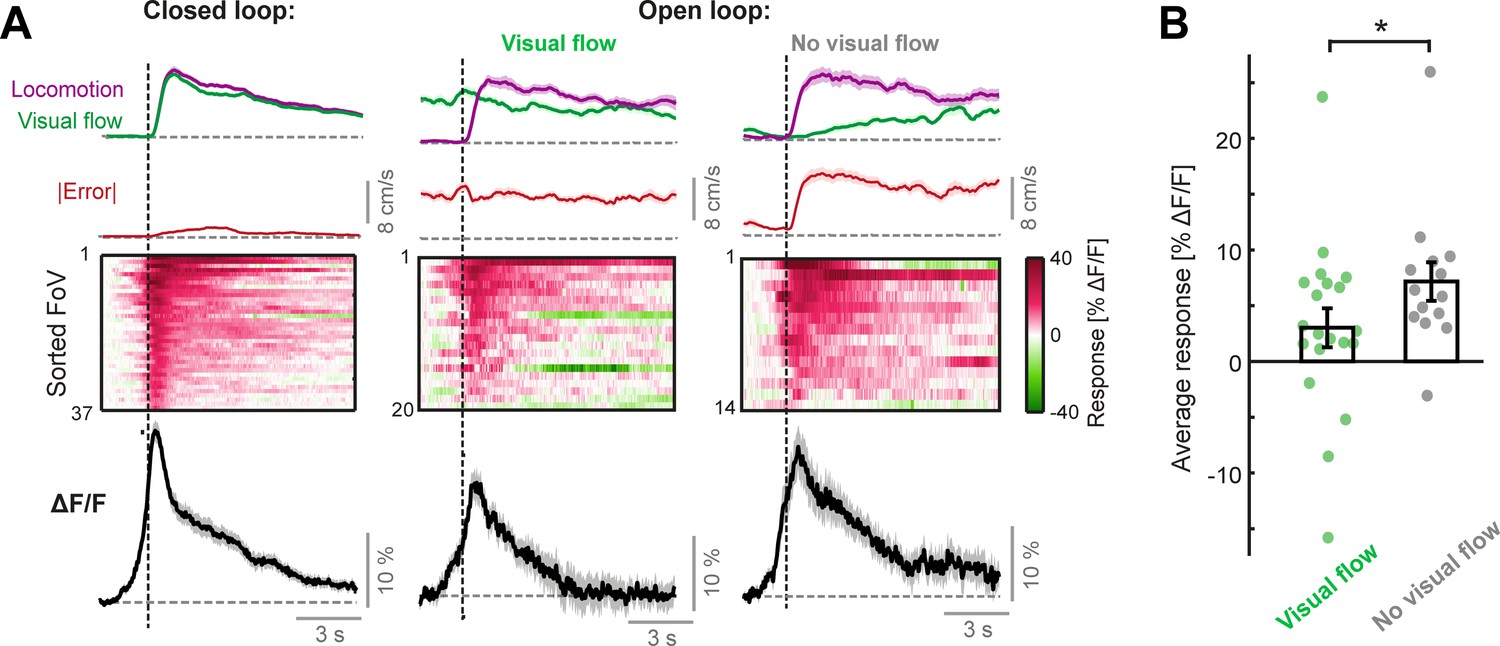
(A) Responses to the onset of locomotion occurring during the closed loop condition (left), during visual flow in the open loop condition (middle), and during no visual flow in the open loop condition (right). Top: Average visual flow speed (green) and locomotion speed (purple) averaged across trials. Note that the window for defining the occurrence of visual flow is in the 2 s window centered on the locomotion onset – therefore the incidence of visual flow increases away from this onset. Red trace shows the absolute error between locomotion speed and visual flow speed averaged across trials (note that, since absolute error is averaged across trials independently, it is not equivalent to the absolute difference in averaged locomotion speed and visual flow speed traces plotted above. In addition, note that the minor error occurring in the closed loop condition is due to mismatches). Middle: Heat map of the average responses of different fields of view (FoV) sorted according to response magnitude. Bottom: Response averaged over FoVs. Shading indicates SEM. (B) Comparison of average sustained response of LC axons to locomotion onsets in the open loop condition (quantified in the window 1–10 s after locomotion onset), during either visual flow or no visual flow, across FoVs. Each point indicates the average response of an individual FoV. Error bars indicate SEM. *: p < 0.05. For statistical information see Supplementary file 1.
Figure 3 with 2 supplements
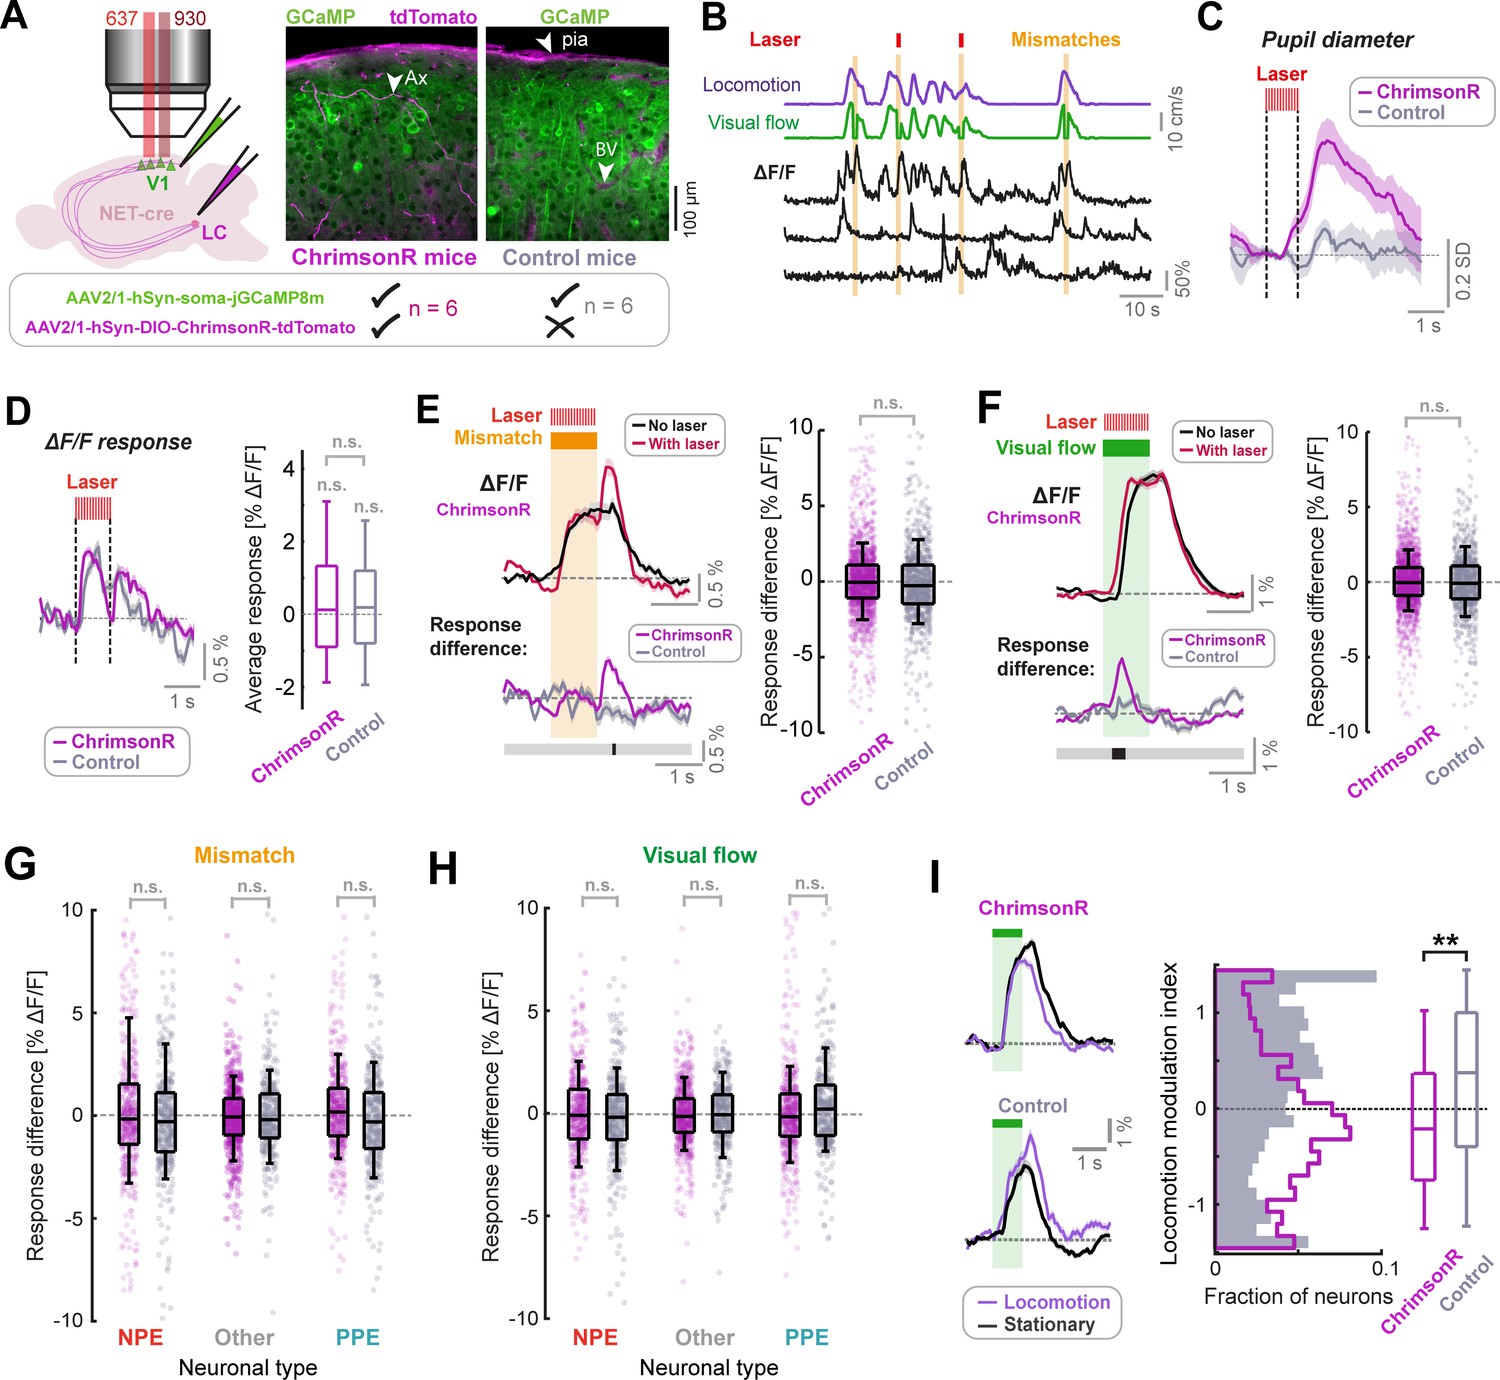
LC axon stimulation has only a small effect on stimulus responses in layer 2/3 of V1.
(A) AAV vector injections were used to express ChrimsonR-tdTomato in LC NET-positive neurons, and jGCaMP8m in layer 2/3 neurons of V1. Simultaneous two-photon calcium imaging and optogenetic stimulation with a 637 nm laser would take place in layer 2/3. Injections into the LC were omitted in control mice. Example histology images indicate expression of jGCaMP8m (green) and tdTomato (magenta); note that blood vessels and pia mater (see arrows labelled ‘BV’ and ‘pia’ respectively) are also visible in the magenta channel. Arrow labelled ‘Ax’ indicates an axon. (B) Example ΔF/F traces for three somatic ROIs in layer 2/3 of V1 (black) and the corresponding visual flow speed (green) and locomotion speed (purple) traces. Orange shading indicates visuomotor mismatch events. Red marks indicate concurrent laser stimulation to activate ChrimsonR on a random subset of mismatch trials. (C) Average pupil diameter response to stimulation with the optogenetic laser presented in isolation for ChrimsonR-expressing mice (pink), and control mice (gray). Shading represents SEM. (D) Left: Average population ΔF/F response of layer 2/3 neurons in V1 to the onset of the optogenetic stimulation laser presented in isolation. Shading represents SEM. Right: Boxplots to compare average response (quantified in the window 0.3–1.6 s after optogenetic stimulation onset) for the two groups of mice. Here and in other panels, n.s.: not significant. For complete statistical information see Supplementary file 1. (E) Analysis of mismatch responses of all layer 2/3 neurons. Left: Average population ΔF/F response of layer 2/3 neurons in V1 of ChrimsonR-expressing mice to visuomotor mismatch either with (red) or without (black) concurrent optogenetic laser stimulation. Shading represents SEM. Below plot shows average difference between trials with and without laser stimulation averaged across the population for ChrimsonR-expressing (pink) and control (gray) mice. Bold line below indicates timepoints where control and ChrimsonR-expressing datasets significantly differed (black) or not (gray). Right: Boxplots to compare the difference in average mismatch response between trials with and without optogenetic laser stimulation. Pink points indicate data for each neuron from ChrimsonR-expressing mice, and gray points indicate data from control mice. Note, statistical tests against zero for the effect in ChrimsonR-expressing mice were also insignificant (see Supplementary file 1). (F) As for E, but for responses to 1 s fixed speed visual flow stimuli in open loop conditions. (G) As for boxplots in panel E, but for mismatch responses of three different functionally defined neuronal groups: NPE = negative prediction error neurons, with large responses to mismatches, PPE = positive prediction error neurons, with large responses to visual flow, and an intermediate group ‘other’. See Methods and Figure 3—figure supplement 2 for information on neuronal types. Note, statistical tests against zero for the effect in ChrimsonR-expressing mice were also insignificant (see Supplementary file 1). (H) As for G, but for responses to 1 s fixed speed visual flow stimuli in open loop conditions. (I) Left: Population average responses to visual flow stimuli during stationary periods (black) and during locomotion (purple), for control mice (bottom), and ChrimsonR-expressing mice (top). Shading represents SEM. Note that only trials without concurrent optogenetic stimulation are included here. Right: Histograms and boxplots to show distribution of locomotion modulation index for the visual responses recorded in control (gray) and ChrimsonR-expressing mice (pink). Here, **: p<0.01 (see Supplementary file 1).
Figure 3—figure supplement 1
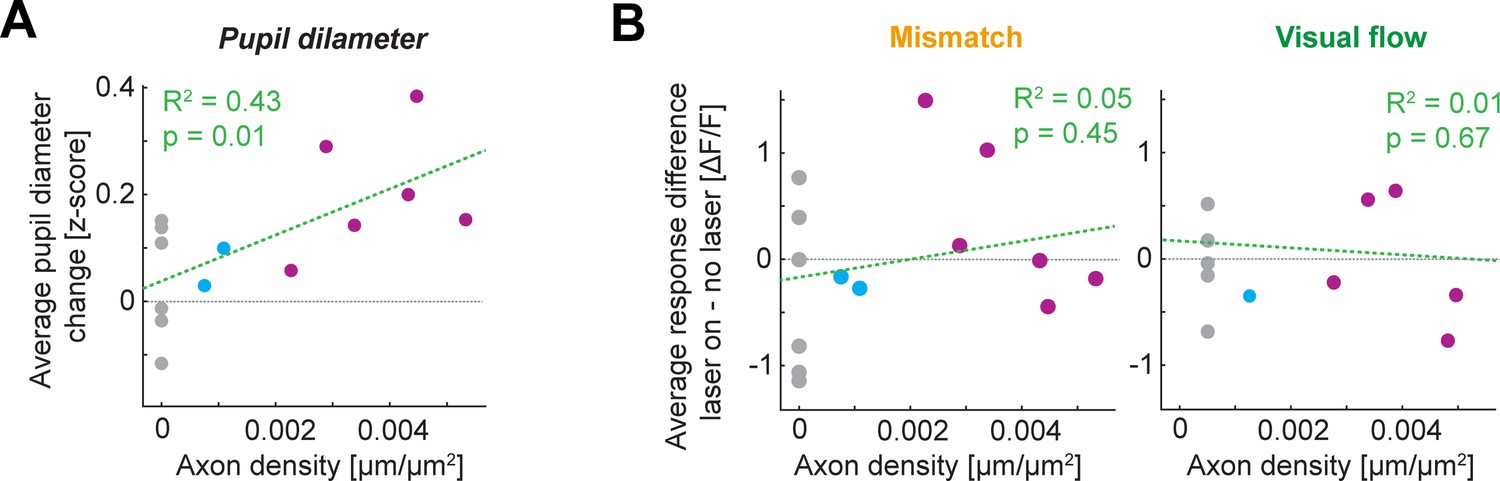
Dependence of laser stimulation effects on ChrimsonR-labelled LC axon density.
(A) Laser-evoked change in pupil diameter plotted against ChrimsonR-labelled axon density in V1 (see Methods) for the dataset in Figure 3. Pink shows high ChrimsonR-expressing mice, blue shows low ChrimsonR-expressing mice, and gray shows control mice. (B) As in A, but for the effect of laser stimulation on average mismatch and visual flow responses, averaged across the population recorded in each mouse.
Figure 3—figure supplement 2

Classification of functional neuronal types in V1 layer 2/3.
(A) Percentage of neurons as a function of the difference in response to locomotion onsets in closed loop conditions and open loop conditions. Neurons with a responses difference below the 33rd percentile (open loop response >closed loop response), were classified as visually suppressed NPE neurons (red), while those with a response difference exceeding the 66th percentile (closed loop response >open loop response), were classified as visually driven PPE neurons (turquoise), as shown. Data for this panel comes from Figure 3 dataset. (B) Top: Diagram of visual flow and locomotion speed traces to indicate closed loop and open loop locomotion onsets (black dashed lines). Bottom: Responses to locomotion onset during closed loop and open loop, averaged across neurons classified as NPE (n = 907), PPE (n = 910), and the intermediate group (Other, n = 810). Shading indicates SEM. Data for this panel comes from Figure 3 dataset. (C) Bar graph to show visual flow and visuomotor mismatch responses, averaged across neurons, compared for the three functional neuron types: NPE (n = 907), Other (n = 810), and PPE neurons (n = 910). Error bars indicate SEM. Data for this panel comes from Figure 3 dataset. (D) Bar graph to show nasotemporal and temporonasal visual flow responses (split further into occurring during locomotion or stationary periods), averaged across neurons, compared for the three functional neuron types: NPE, Other, and PPE neurons. Each bar represents data from between 372 and 434 neurons. Error bars indicate SEM. Data for this panel comes from Figure 4 dataset (High ChrimsonR only). Mismatch data was not acquired for this dataset. (E) Bar graph to show visual flow onset and visuomotor mismatch responses, averaged across neurons, compared between NPE, Other, and PPE cell classes (each bar represents data from between 2600 and 2700 neurons). Error bars indicate SEM. Data for this panel comes from Figure 5 datasets (coupled trained and normally reared mice).
Figure 4 with 2 supplements
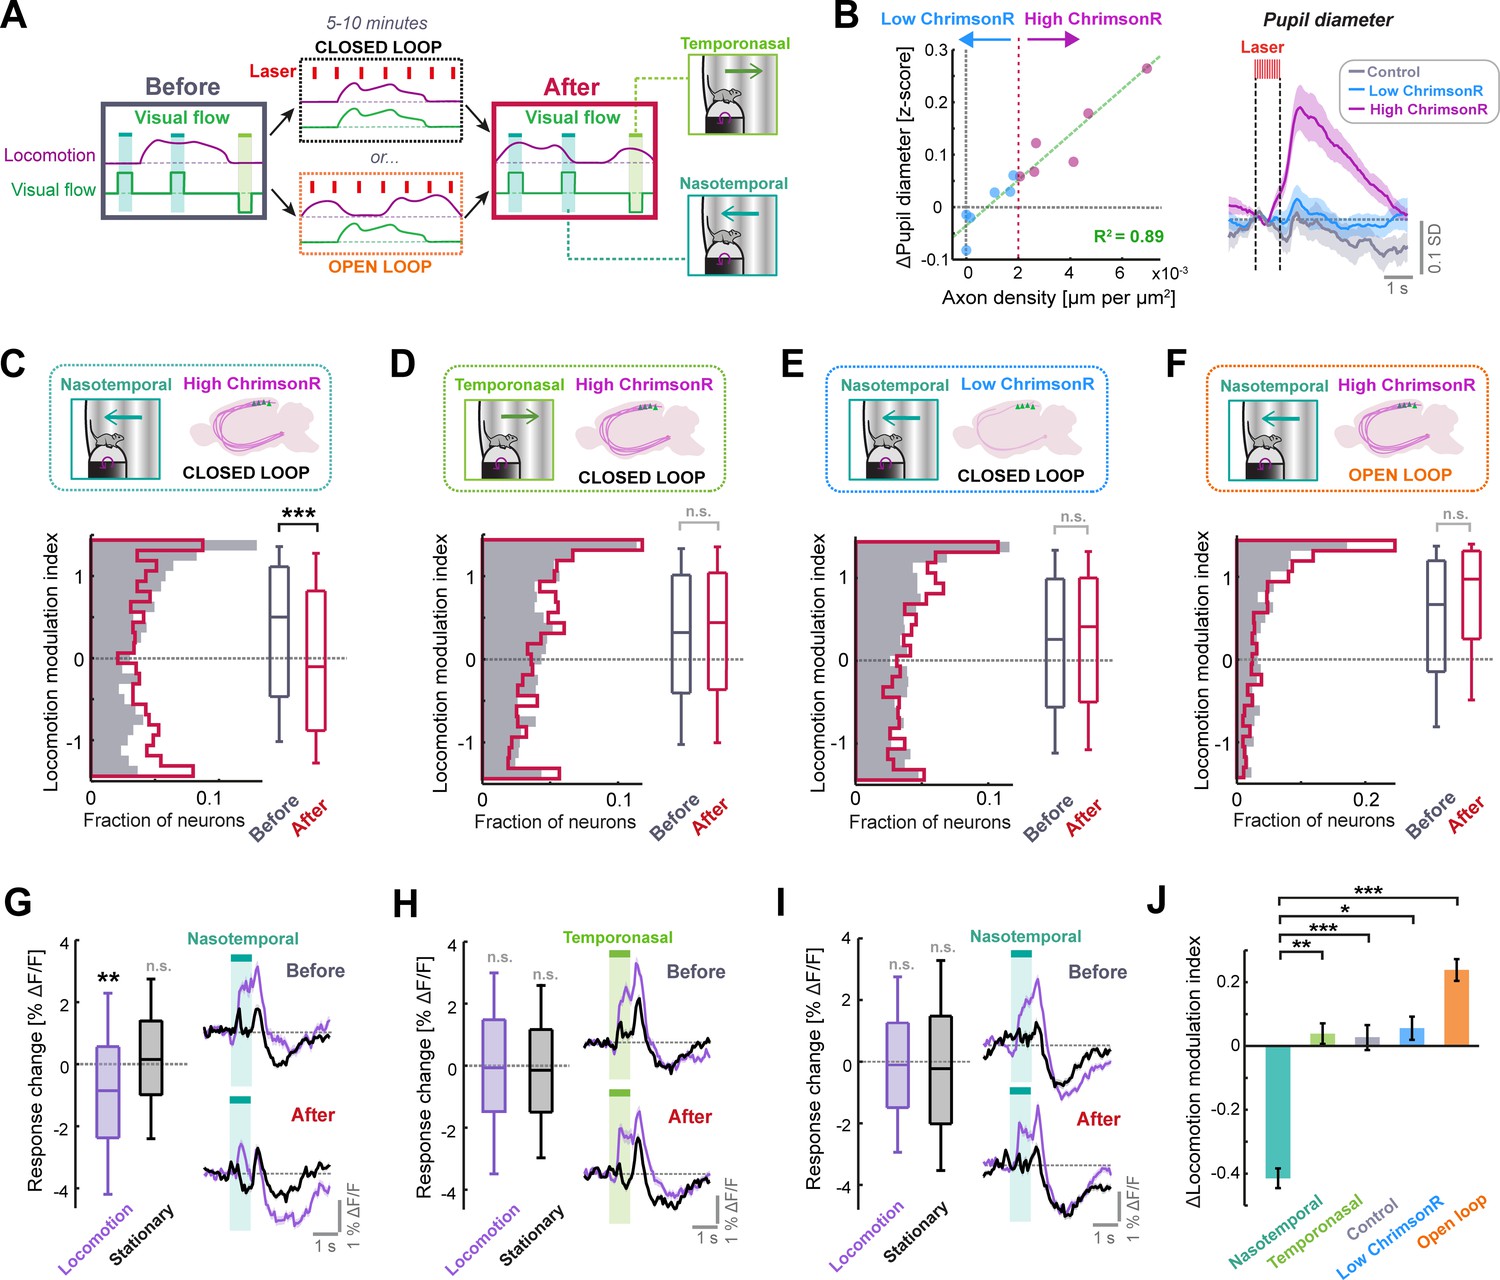
Phasic LC output enhances sensorimotor plasticity in layer 2/3 of V1.
(A) Diagram of the experiment used to determine whether LC axon stimulation during different visuomotor coupling conditions can modulate plasticity. Visual responses are compared before and after 5–10 min of either closed or open loop conditions, during which LC axons were stimulated every 7 s on average. (B) Left: Scatter plot to show the relationship between density of ChrimsonR-tdTomato labelled axons in V1 (total axon length per unit area of the cortex, analyzed postmortem) and the average evoked pupil dilation during optogenetic stimulation. Green dashed line is a linear regression fit to the data, and red dotted line indicates axon density threshold used to categorize low (blue) and high (pink) ChrimsonR-expressing mice. Right: Average pupil diameter response to stimulation with the optogenetic laser for 6 mice with high ChrimsonR expression in LC axons (pink), 6 mice with low ChrimsonR expression (blue), and 7 control mice that did not receive a vector injection into the LC (black). Shading represents SEM over sessions. (C) Analysis of plasticity in nasotemporal visual flow responses in ChrimsonR-expressing mice undergoing optogenetic laser stimulation during closed loop visuomotor experience. Histograms and boxplots show distribution of locomotion modulation indices for the visual responses of layer 2/3 V1 neurons recorded before (dark gray) and after the stimulation period (red). Here and in all other panels: n.s.: not significant, *: p<0.05, **: p<0.01, ***: p<0.001. See Supplementary file 1 for all statistical information. (D) As for panel C, but for temporonasal visual flow responses. (E) As for panel C, but for low ChrimsonR-expressing mice. (F) As for panel C, but for the condition in which optogenetic stimulation occurred during open loop replays of visual flow (i.e. no visuomotor coupling). (G) Analysis of plasticity in nasotemporal visual flow responses in high ChrimsonR-expressing mice undergoing optogenetic laser stimulation during the closed loop condition. Left: Boxplots of the change in response to visual flow after optogenetic stimulation for responses recorded during locomotion (purple) and those recorded during stationary periods (black). Right: Average population response to visual flow during locomotion (purple) and during stationary periods (black), before (top) and after (bottom) optogenetic stimulation. Shading indicates SEM. (H) As for panel G, but for temporonasal visual flow responses. (I) As for panel G, but for low ChrimsonR-expressing mice. (J) Change in locomotion modulation index after optogenetic stimulation, for the four sets of experiments from panels C (nasotemporal), D (temporonasal), Figure 4—figure supplement 1C (Control), E (low ChrimsonR expression), and F (open loop) (presented in the respective sequence).
Figure 4—figure supplement 1

Additional information and analyses on optogenetic stimulation of LC axons to drive plasticity.
(A) Two example confocal microscopy images from V1 showing jGCaMP8m expression (green) and tdTomato expression (magenta), indicating labelled LC axons. The right image is from an animal classified as high ChrimsonR-expressing, based on labelled axon density, and left image is from an animal classified as low ChrimsonR-expressing. (B) Comparison of average pupil diameter response (quantified in the window 1.3–4.7 s after optogenetic stimulation onset) for control, low ChrimsonR-expressing and high ChrimsonR-expressing mice. Here and in other panels, n.s.: p>0.05, *: p<0.05, **: p<0.01, ***: p<0.001. For complete statistical information see Supplementary file 1. (C) Average population ΔF/F response of layer 2/3 neurons in V1 to the onset of the optogenetic stimulation laser. Shading indicates SEM. Note that optogenetic laser power was lowered compared to the value used in Figure 3, and the positive response seen in Figure 3D is no longer evident. (D) Analysis of plasticity in nasotemporal visual flow responses in control mice which underwent optogenetic laser stimulation during the closed loop condition. Left: Distribution of locomotion modulation index for the visual responses recorded before (dark gray) and after the stimulation period (red). Right: Change in ΔF/F response to visual flow after optogenetic stimulation for responses recorded during locomotion (purple) and during stationary periods (black). (E) As for panel D, but for temporonasal visual flow responses recorded in high ChrimsonR-expressing mice, where optogenetic stimulation occurred during open loop replays of visual flow (i.e. uncoupled from locomotion). (F) Analysis of plasticity in nasotemporal visual flow responses for high ChrimsonR-expressing mice which underwent optogenetic laser stimulation during open loop replays of visual flow (i.e. uncoupled from locomotion). Boxplot shows the change in ΔF/F response to visual flow after optogenetic stimulation for responses recorded during locomotion (purple) and during stationary periods (black). Traces show average population response to visual flow during locomotion (purple) and during stationary periods (black), before (top) and after (below) optogenetic stimulation. Shading indicates SEM.
Figure 4—figure supplement 2
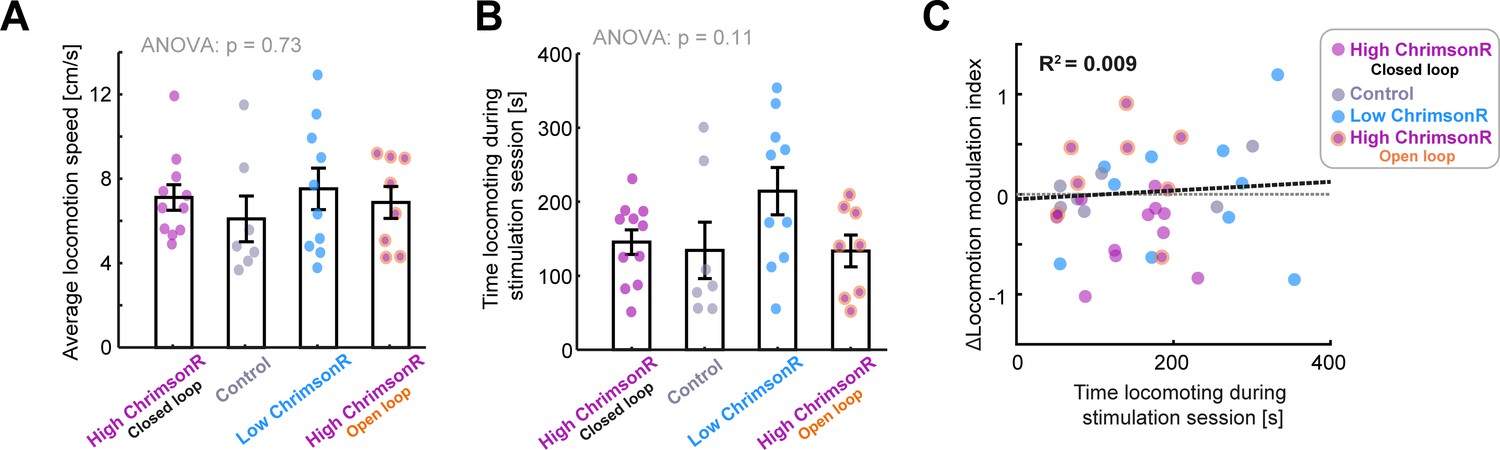
Differences in locomotion during stimulation cannot explain differences in the change of locomotion modulation index between groups.
Related to Figure 4. (A) Average locomotion speed (excluding stationary periods) for: High ChrimsonR-expressing mice during closed loop stimulation, Control mice during closed loop stimulation, low ChrimsonR-expressing mice during closed loop stimulation, and high ChrimsonR-expressing mice during open loop stimulation. Points show data for each imaging session. Error bars represent SEM. (B) As for panel A, but for the time spent engaged in locomotion during the stimulation period. (C) Change in locomotion modulation index after optogenetic stimulation plotted against the time spent engaged in locomotion during the laser stimulation period of the imaging session. Each point shows the averages for a single imaging session.
Figure 5 with 1 supplement
LC axon stimulation over minutes recapitulates the visuomotor plasticity seen over days.
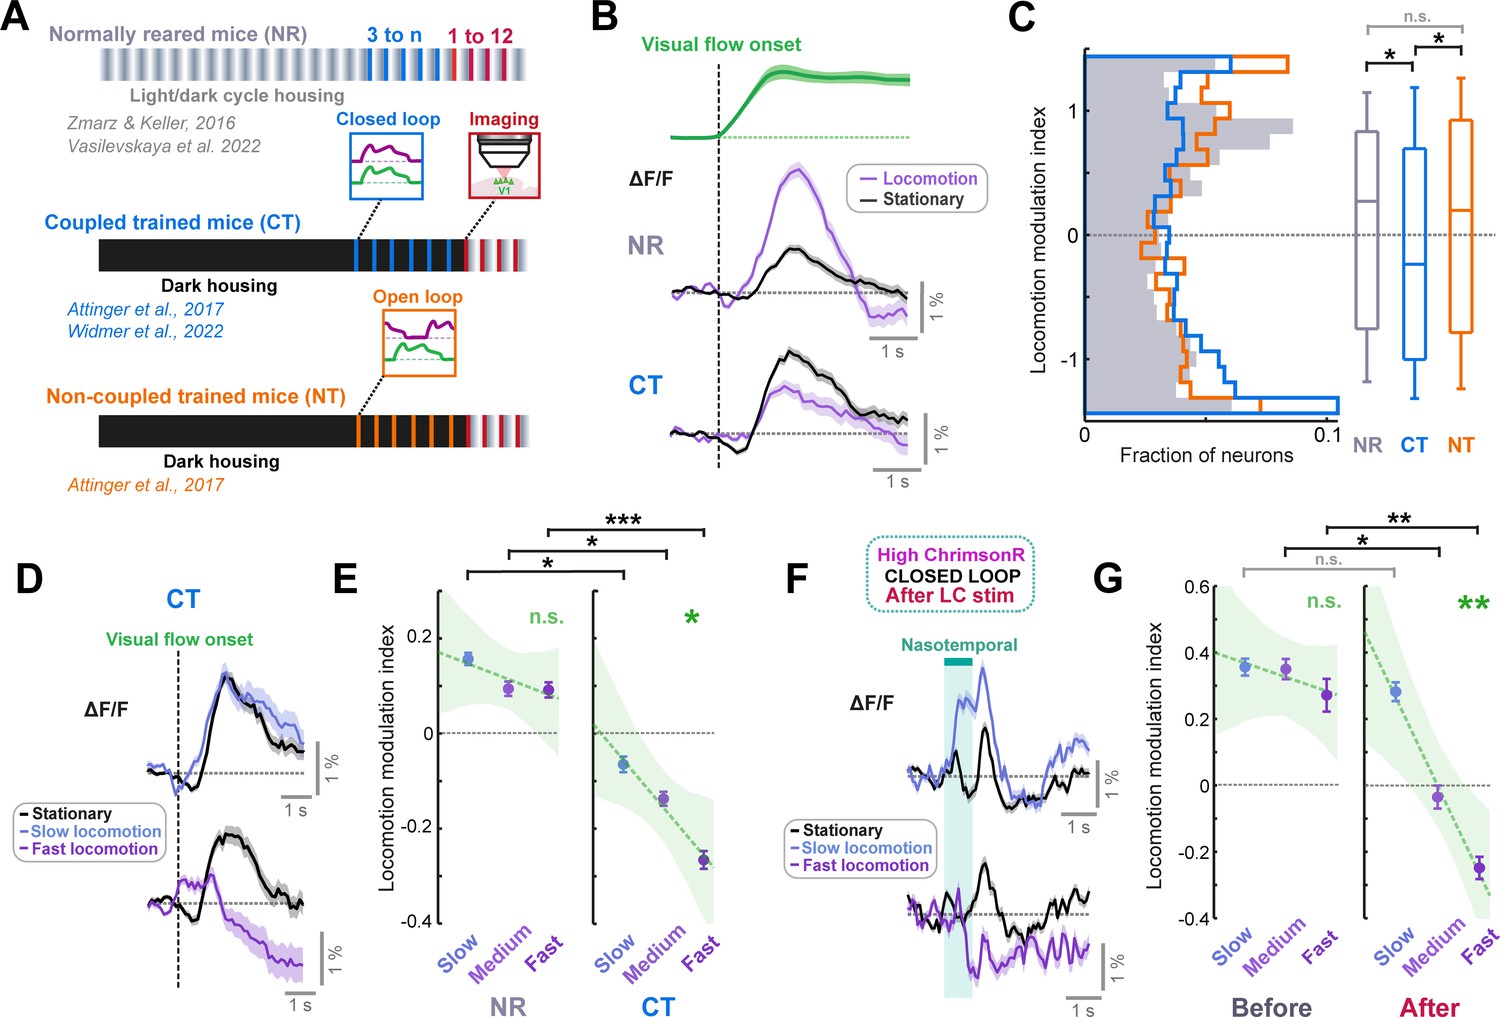
(A) Diagram of the three groups of mice reared with different visuomotor experience. Normally reared mice (NR, gray) were raised with a normal light/dark cycle in their cages, with the full diversity of visuomotor coupling in freely moving conditions. Coupled trained mice (CT, blue) were reared in the dark, and their only visuomotor experience prior to imaging was during closed loop conditions in the virtual reality system. Non-coupled trained mice (NT, orange) were reared similar to coupled trained mice, except their only visual experience was during open loop conditions in the virtual reality system. (B) Average population responses of layer 2/3 neurons in V1 to the onset of visual flow during open loop replay sessions. Green shows the average speed profile of the visual flow stimulus, purple shows the average population responses during locomotion, and black shows the average population responses during stationary periods for normally reared (top) and coupled trained (bottom) mice. Shading indicates SEM. (C) Distribution of the locomotion modulation indices of all V1 layer 2/3 neurons for the visual flow onset responses recorded in normally reared (gray), coupled trained (blue), and non-coupled trained (orange) mice. Here and in other panels, n.s.: not significant, *: p<0.05, **: p<0.01, ***: p < 0.001. For complete statistical information see Supplementary file 1. (D) Average population responses of layer 2/3 neurons in V1 in coupled trained mice to the onset of visual flow during stationary periods (black), and during slow (top) and fast (bottom) locomotion (purple). Shading indicates SEM. (E) Comparison of locomotion modulation indices averaged across neurons for visual flow onset responses recorded during slow, medium, and fast locomotion speeds, in normally reared (left) and coupled trained (right) mice. Error bars indicate SEM. Green dashed line indicates linear regression fit to the data, and shading indicates the 95% confidence interval of the regression. Green asterisks and ‘n.s.’ indicate significance of the fit. (F) As for panel D, but for nasotemporal visual flow responses in high ChrimsonR-expressing mice after LC axon stimulation in closed loop conditions. (G) As for panel E, but for nasotemporal visual flow responses in high ChrimsonR-expressing mice before (left) and after (right) LC axon stimulation in closed loop visuomotor coupling.
Figure 5—figure supplement 1
Comparison of locomotion modulation index across different functional neuronal types in layer 2/3 V1.
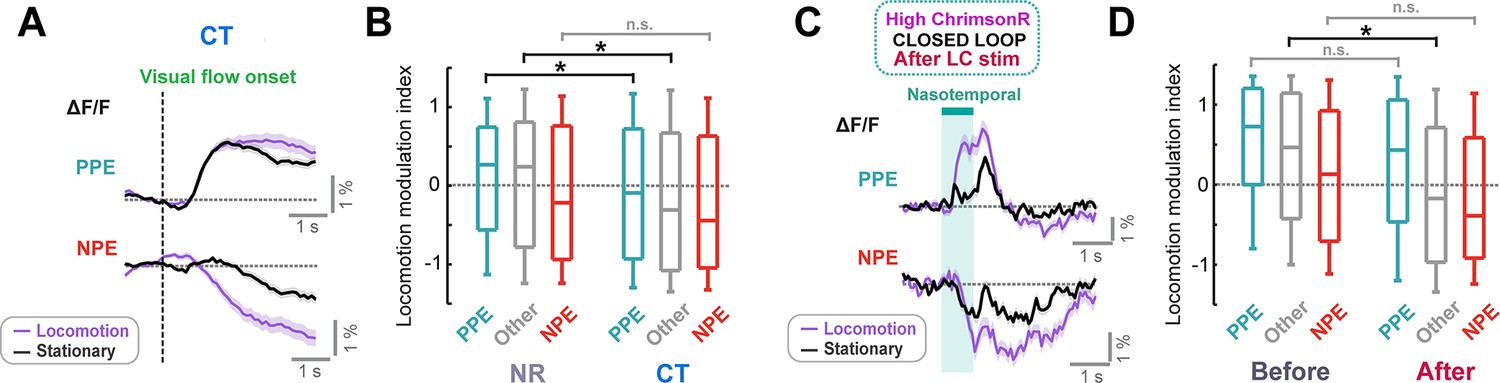
Related to Figure 5. (A) Average population responses of layer 2/3 neurons in V1 in coupled trained mice to the onset of visual flow during stationary periods (black), and during locomotion (purple) for visually driven positive prediction error neurons (PPE, top) and visually suppressed negative prediction error neurons (NPE, bottom). Shading indicates SEM. (B) Comparison of locomotion modulation index for visual flow onset responses of positive (turquoise), negative (orange) prediction error neurons, and an intermediate population of neurons (gray), recorded in normally reared (left) and coupled trained (right) mice. For information on functional neuron types, see Figure 3—figure supplement 2. Here and in other panels, n.s.: p>0.05, *: p<0.05, **: p<0.01, ***: p<0.001. For complete statistical information see Supplementary file 1. (C) As for panel A, but for nasotemporal visual flow responses in high ChrimsonR-expressing mice after LC axon stimulation in closed loop conditions. (D) As for panel B, but for nasotemporal visual flow responses in high ChrimsonR-expressing mice before (left) and after (right) LC axon stimulation in closed loop conditions.
Author response image 1

Correlations between axon density and average effect of laser stimulation on stimulus responses and pupil dilation (data from manuscript Figure 3).
Grey points show control mice, blue points show low ChrimsonR-expressing mice, and purple points show high ChrimsonR- expressing mice.
Author response image 2

Difference in responses to visual stimuli caused by optogenetic stimulation, calculated by subtracting the average response when no laser was presented from the average response when the laser was presented concurrent with the visual stimulus.
Pink traces show the response difference for ChrimsonR-expressing mice, and grey shows the same for control mice. Black blocks below indicate consecutive timepoints after stimulation showing a significant difference between ChrimsonR and control as determined by hierarchical bootstrapping (p<0.05).
Tables
Author response table 1
| Figure panel | Comparison | Value compared | Mean 1 (delta shown for paired tests) | DS1 | Mean 2 (n/a for paired tests) | SD 2 | P value | Test type | N (FoVs) | N (Mice) |
|---|---|---|---|---|---|---|---|---|---|---|
| Figure 1D | Mismatch vs Playback halt (stationary) | Mean response [% ΔF/F] | 2.25 | 2.28 | -1.08 | 1.71 | <10-4 | Bootstrap | 40, 25 | 13, 10 |
| Figure 1D | Mean response vs zero | Mismatch response [% ΔF/F] | 2.25 | 2.28 | n/a | n/a | <10-4 | Bootstrap | 40 | 13 |
| Figure 1D | Playback halt locomotion vs stationary | Mean response [% ΔF/F] | -1.08 | 1.71 | 0.58 | 3.54 | 0.0348 | Bootstrap | 25, 24 | 10, 10 |
| Figure 1D | Mean response vs zero | Playback halt response (stationary) [% ΔF/F] | -1.08 | 1.71 | n/a | n/a | 0.0072 | Bootstrap | 25 | 10 |
| Figure 1D | Mismatch vs Playback halt response (locomotion) | Mean response [% ΔF/F] | 0.58 | 3.54 | 2.25 | 2.28 | 0.0286 | Bootstrap | 24, 40 | 10, 13 |
| Figure 1D | Mean response vs zero | Playback halt response (locomotion) [% ΔF/F] | 0.58 | 3.54 | n/a | n/a | 0.2314 | Bootstrap | 24 | 10 |
| Figure 1G | Mean response vs zero | Visual flow response (locomotion) [% ΔF/F] | -0.58 | 4.19 | n/a | n/a | 0.2821 | Bootstrap | 21 | 11 |
| Figure 1G | Mean response vs zero | Visual flow response (stationary) [% ΔF/F] | 3.16 | 5.27 | n/a | n/a | 0.0055 | Bootstrap | 28 | 11 |
| Figure 1G | Locomotion vs stationary | Mean visual response [% ΔF/F] | 3.16 | 5.27 | -0.58 | 4.19 | 0.0082 | Bootstrap | 28, 21 | 11, 11 |
| Figure 2B | Posterior vs Anterior | Mismatch response [% ΔF/F] | 2.55 | 2.02 | 1.21 | 2.92 | 0.0922 | Bootstrap | 31, 9 | 9, 4 |
| Figure 2B | Posterior vs Anterior | Playback halt response (stationary) [% ΔF/F] | -1.11 | 1.56 | -1.01 | 2.05 | 0.499 | Bootstrap | 16, 9 | 6,4 |
| Figure 2B | Posterior vs Anterior | Visual flow response (stationary) [% ΔF/F] | 2.98 | 5.46 | 3.53 | 5.14 | 0.4194 | Bootstrap | 19, 9 | 7, 4 |
| Figure 2C | Posterior vs Anterior | Air puff response [% ΔF/F] | 24.73 | 10.03 | 24.48 | 11.24 | 0.4841 | Bootstrap | 13, 8 | 6, 4 |
| Figure 2C | Posterior vs Anterior | Locomotion response (closed loop) [% ΔF/F] | 14.99 | 7.07 | 13.33 | 7.86 | 0.3666 | Bootstrap | 28, 9 | 9, 4 |
| Figure 2C | Posterior vs Anterior | Locomotion response (no visual flow) [% ΔF/F] | 14.42 | 8.05 | 14.96 | 11.93 | 0.4204 | Bootstrap | 8, 6 | 6, 3 |
| Figure 2C | Posterior vs Anterior | Locomotion response (visual flow) [% ΔF/F] | 10.85 | 5.89 | 8.12 | 8.46 | 0.3324 | Bootstrap | 14, 6 | 6, 3 |
| Figure S2B | With vs without visual flow | Locomotion onset response (open loop) [% ΔF/F] | 3.03 | 7.82 | 7.17 | 6.45 | 0.071 | Bootstrap | 20, 14 | 9, 9 |
Additional files
-
Supplementary file 1
Table detailing all statistical tests and sample sizes.
- https://cdn.elifesciences.org/articles/85111/elife-85111-supp1-v1.docx
-
MDAR checklist
- https://cdn.elifesciences.org/articles/85111/elife-85111-mdarchecklist1-v1.docx
Download links
A two-part list of links to download the article, or parts of the article, in various formats.
Downloads (link to download the article as PDF)
Open citations (links to open the citations from this article in various online reference manager services)
Cite this article (links to download the citations from this article in formats compatible with various reference manager tools)
The locus coeruleus broadcasts prediction errors across the cortex to promote sensorimotor plasticity
eLife 12:RP85111.
https://doi.org/10.7554/eLife.85111.3


