Intravital imaging-based genetic screen reveals the transcriptional network governing Candida albicans filamentation during mammalian infection
- Department of Pediatrics, Carver College of Medicine, University of Iowa, United States
- Departments of Microbiology and Immunology, Carver College of Medicine, University of Iowa, United States
- Molecular Physiology and Biophysics, Carver College of Medicine, University of Iowa, United States
Figures
Figure 1 with 1 supplement
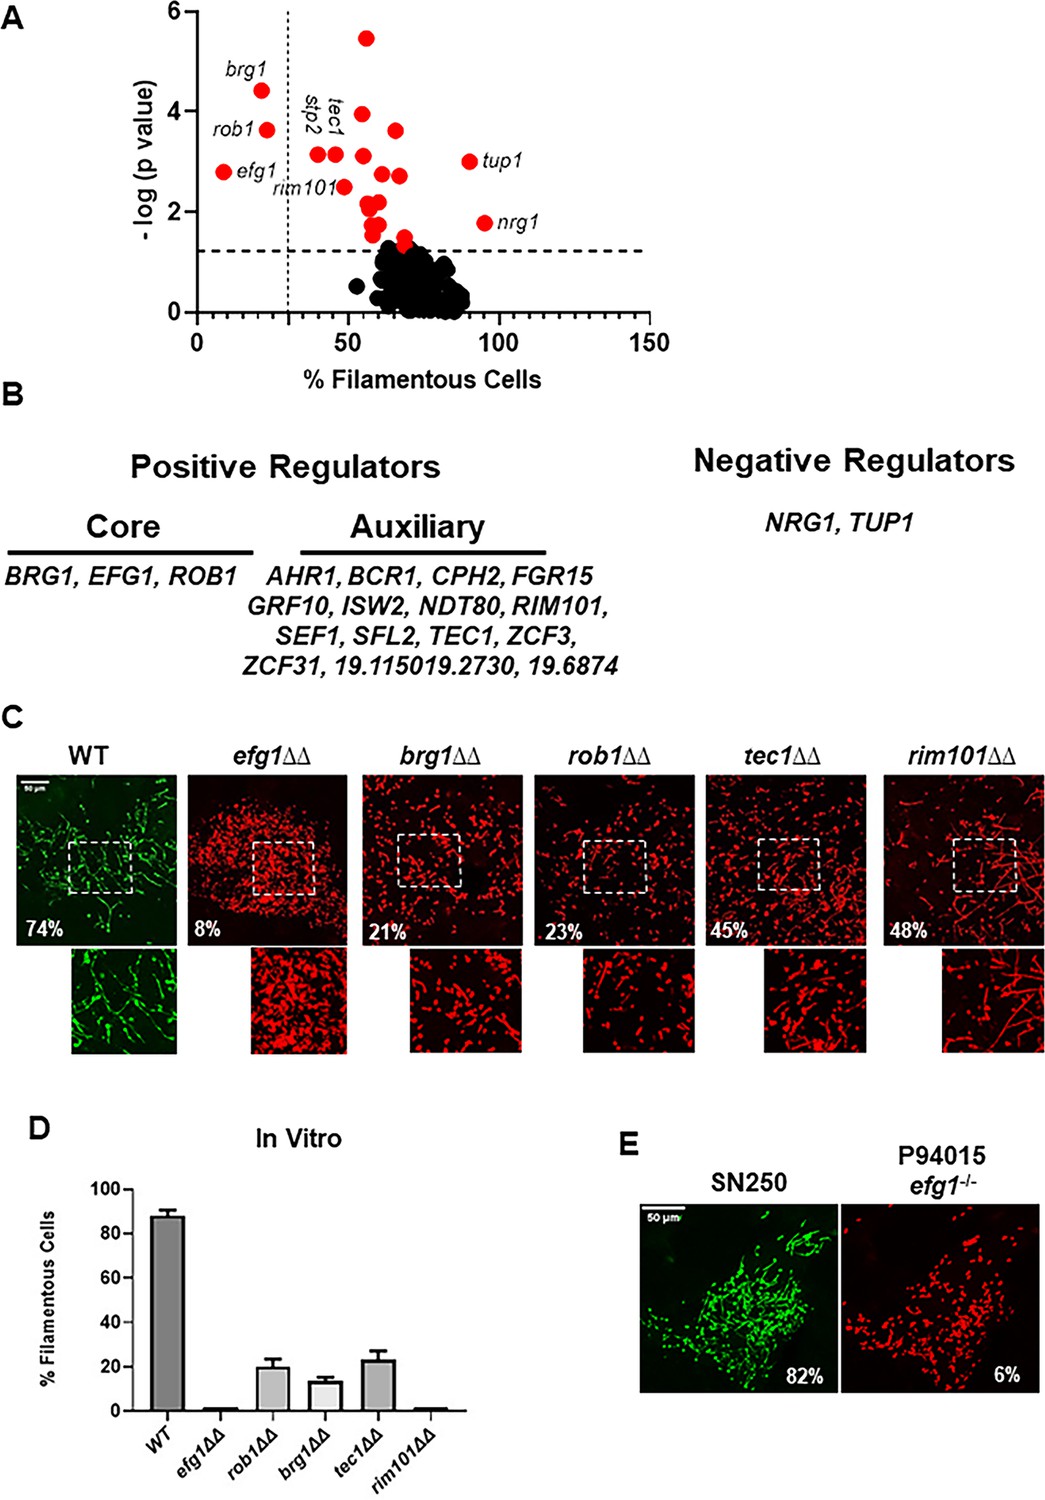
Intravital imaging assay identifies transcription factor mutants with altered initiation of filament formation in vivo.
(A) Volcano plot of % filamentous cells of transcription factor homozygous deletion mutants normalized to co-infecting wild type (WT) cells 24 hr after injection into the subdermal tissue of a mouse ear. The p values are derived from paired Student’s t tests of >100 cells in 3–4 fields per ear. See Supplementary file 1 for all data. Red dots indicate mutants with statistically significant differences in % filamentous cells relative to WT. The vertical dotted line distinguishes the core positive regulators from auxiliary regulators; the horizontal dotted line indicates p=0.05 (Student’s t test). (B) Gene names for the core and auxiliary positive regulators and the two negative regulators. (C) Representative images for WT and the five mutants with the strongest phenotypes; the percentage of filamentous cells is noted in each panel. The boxed regions shown are magnified in the lower panel. (D) The percentage of filamentous cells for the five mutants and WT after in vitro induction for 4 hr in RPMI+10% fetal bovine serum (FBS) at 37°C. The bars indicate mean of two independent experiments with >100 cells counted per strain. (E) Comparison of filamentation of the reference strain SN250 to a clinical isolate with a natural EFG1 loss-of-function mutation (P94015).
-
Figure 1—source data 1
Source data for Figure 1A.
Confocal image files for transcription factor mutants with altered filament/yeast distribution along with their wild type (WT) comparator. Files are named: genename_Max Stack_1 for the mutant images and WT_genename_Max Stack 1 for the WT counterpart.
- https://cdn.elifesciences.org/articles/85114/elife-85114-fig1-data1-v2.zip
-
Figure 1—source data 2
Confocal images for images shown in Figure 1C with file name as described in Figure 1A.
- https://cdn.elifesciences.org/articles/85114/elife-85114-fig1-data2-v2.zip
-
Figure 1—source data 3
Bright-field images for the quantitative assessment of morphology shown in the graph in Figure 1D.
- https://cdn.elifesciences.org/articles/85114/elife-85114-fig1-data3-v2.zip
-
Figure 1—source data 4
Confocal images for images shown in Figure 1E with file name as described in Figure 1A.
- https://cdn.elifesciences.org/articles/85114/elife-85114-fig1-data4-v2.zip
Figure 1—figure supplement 1

The percentage of filamentous cells for stp2∆∆ arg4∆∆ and stp2∆∆ arg4∆∆::ARG4 indicates that ARG4 and STP2 genetically interact.
* indicates p<0.05 by Student’s t test.
-
Figure 1—figure supplement 1—source data 1
Images for the comparison of the stp2∆∆ mutant with the ARG complemented stp2∆∆ mutant.
- https://cdn.elifesciences.org/articles/85114/elife-85114-fig1-figsupp1-data1-v2.zip
Figure 2 with 1 supplement
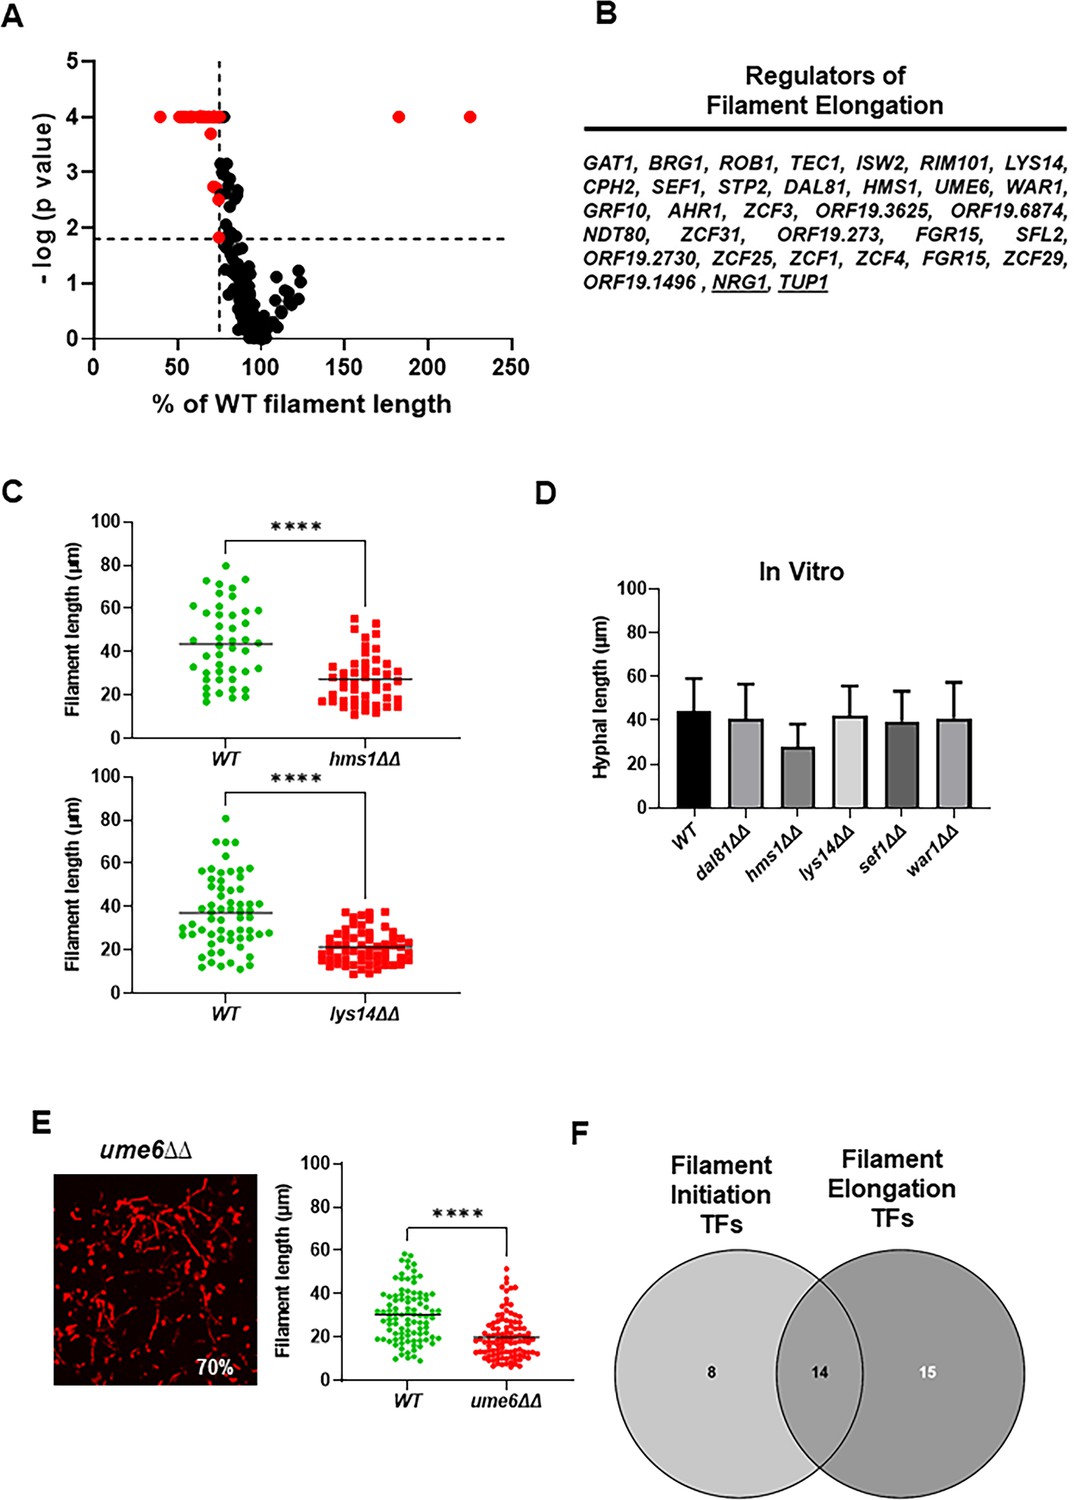
Identification of transcription factor (TF) deletion mutants with reduced filament length in vivo.
(A) Volcano plot of filament length normalized to wild type (WT) in the same fields using the same images described in Figure 1. The p values are derived from a Mann-Whitney U test. The red dots indicate mutants with statistically significant reductions in filament length. The vertical dotted line indicates 75% of WT filament length; the horizontal dotted line indicates p=0.05 (Mann-Whitney). The full data set is provided in Supplementary file 2. (B) The set of TF mutants with lengths ≤75% of WT. (C) Representative data for two mutants with reduced filament length. **** indicates p value <0.001 by Mann-Whitney U test. (D) In vitro filament length for WT and five mutants with reduced filament length in vivo; 4 hr incubation in RPMI+10% fetal bovine serum (FBS) at 37°C. (E) The ume6∆∆ mutant shows WT levels of filament formation but reduced filament length in vivo. (F) Venn diagram showing the distribution of mutants with reduced filament initiation, filament initiation and elongation, and elongation.
-
Figure 2—source data 1
Confocal image files for transcription factor mutants with reduced filament length and its wild type (WT) comparator.
Files are named: genename_Max Stack_1 for the mutant images and WT_genename_Max Stack 1 for the WT counterpart. Figure 2A.
- https://cdn.elifesciences.org/articles/85114/elife-85114-fig2-data1-v2.zip
-
Figure 2—source data 2
Prism files with the filament length measurements and statistical analysis for transcription factor mutants and their wild type (WT) comparators.
File names are: Filament length_genename. The WT comparators are in each prism file. Figure 2A.
- https://cdn.elifesciences.org/articles/85114/elife-85114-fig2-data2-v2.zip
-
Figure 2—source data 3
Images for the in vitro measurement of filament lengths shown in Figure 2D.
- https://cdn.elifesciences.org/articles/85114/elife-85114-fig2-data3-v2.zip
-
Figure 2—source data 4
Image for length determination of ume6∆∆.
- https://cdn.elifesciences.org/articles/85114/elife-85114-fig2-data4-v2.zip
Figure 2—figure supplement 1
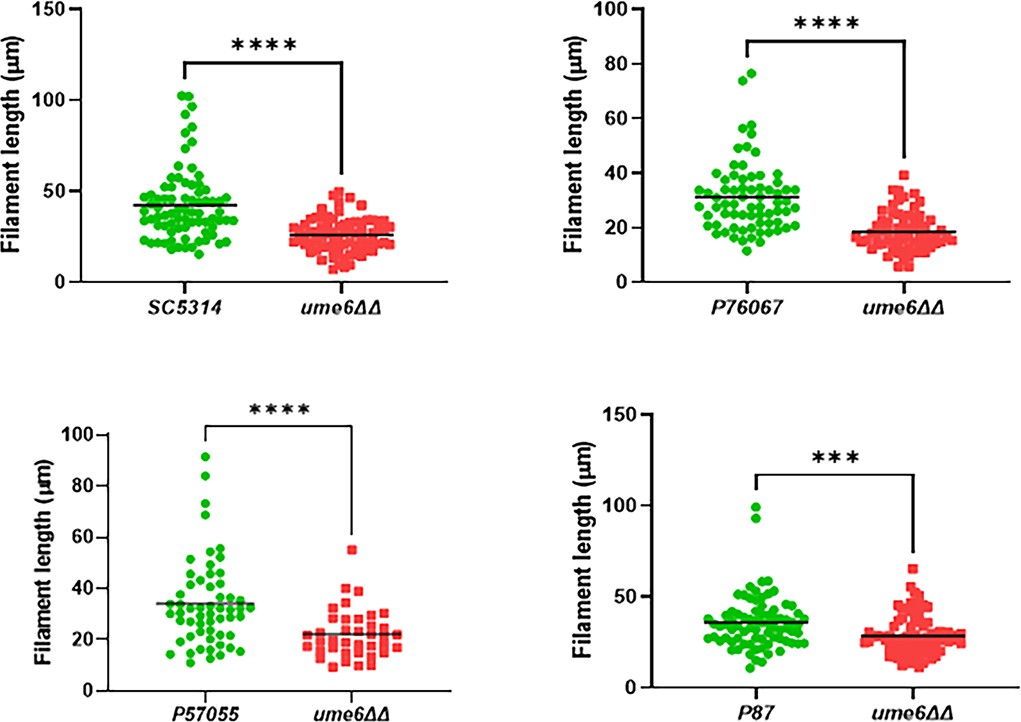
The length of in vivo filaments formed by ume6∆∆ mutants in four filament forming C. albicans strains.
*** indicates p<0.05; **** p<0.005 by Mann-Whitney U test.
-
Figure 2—figure supplement 1—source data 1
Images for the measurement of ume6∆∆ length in clinical strains.
- https://cdn.elifesciences.org/articles/85114/elife-85114-fig2-figsupp1-data1-v2.zip
Figure 3
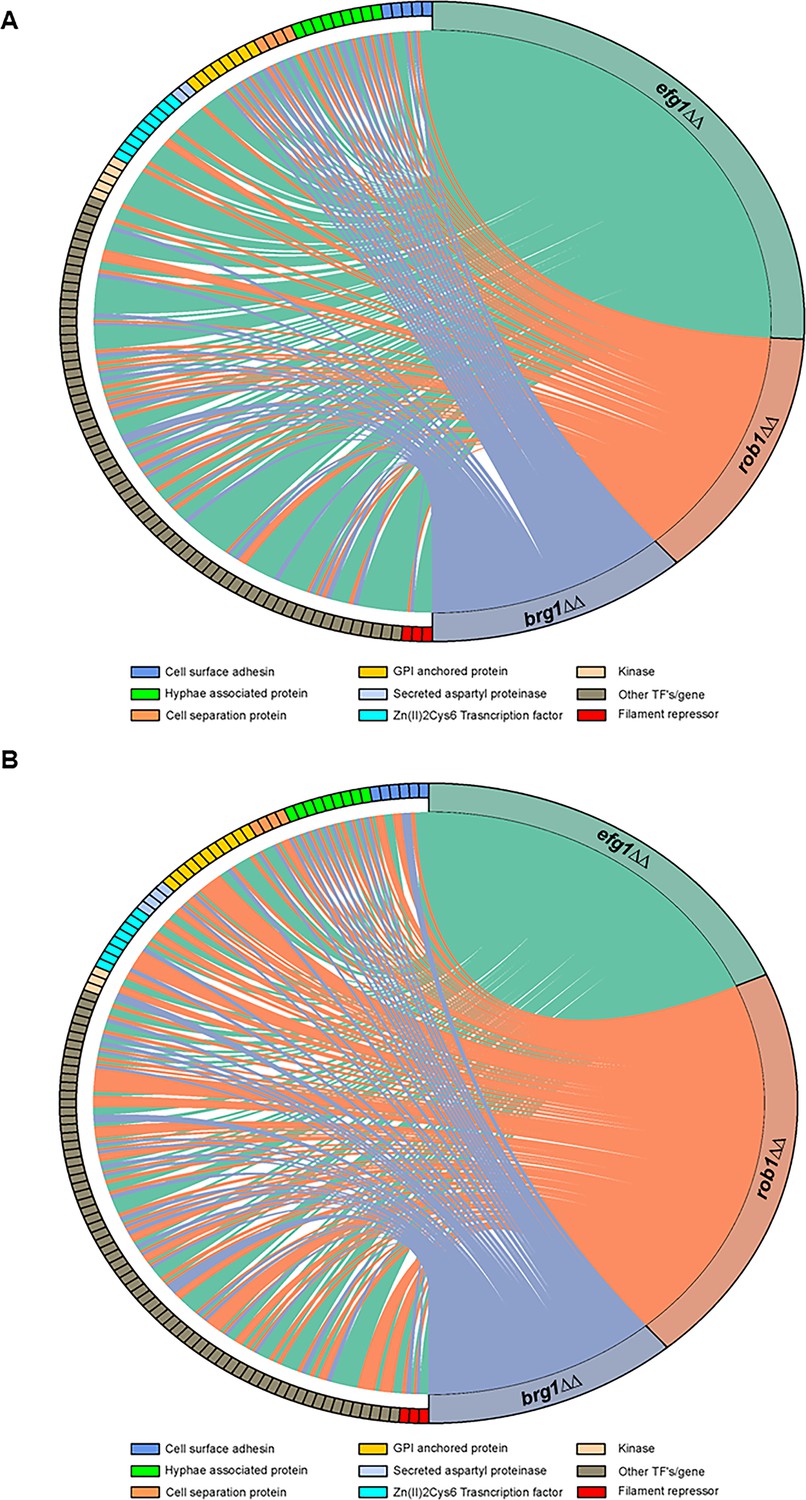
The core filament initiation regulators Brg1, Efg1, and Rob1 have distinct effects on the expression of environmentally responsive genes during filamentation in vitro and in vivo.
Chord diagram depicts the sets of genes downregulated by twofold in the brg1∆∆, efg1∆∆, and rob1∆∆ mutants relative to wild type (WT) during (A) in vitro (RPMI+10% fetal bovine serum (FBS), 37°C, 4 hr,) or (B) in vivo (24 hr post infection) filamentation. The expression of each target depicted on the left of the circle was determined using a NanoString nCounter; 188 genes were assayed of which 57 are known to be hyphae-associated. A line indicates that a given gene was reduced by twofold in a statistically significant manner (Benjamini-Yekutieli procedure, false discovery rate [FDR] = 0.1). The size of the colored regions on the right is proportional to the number of targets downregulated in the efg1∆∆ (teal), rob1∆∆ (salmon), and brg1∆∆ (purple). The targets are arrayed on the left of the chord diagram and grouped by functional category as indicated by color code. The complete data sets are provided in Supplementary file 3.
Figure 4

Core transcriptional regulators of in vivo filament initiation have overlapping and distinct regulons in vitro and in vivo.
(A) Efg1, Brg1, and Rob1 regulate distinct sets of genes in vivo and in vitro. Differentially expressed genes were defined as those with ±2 fold-change relative wild type (WT) in the same condition with false discovery rate [FDR] = 0.1 as determined by the Benjamini-Yekutieli procedure. Raw data are available in Supplementary file 3. (B) Efg1 and Rob1 have distinct regulons in vivo while Brg1 regulated genes overlap extensively with those regulated by Rob1 and Efg1. (C) Regulatory networks of Efg1, Rob1, and Brg1 with negative and auxiliary regulators of filament initiation in vitro (C) and in vivo (D).
Figure 5
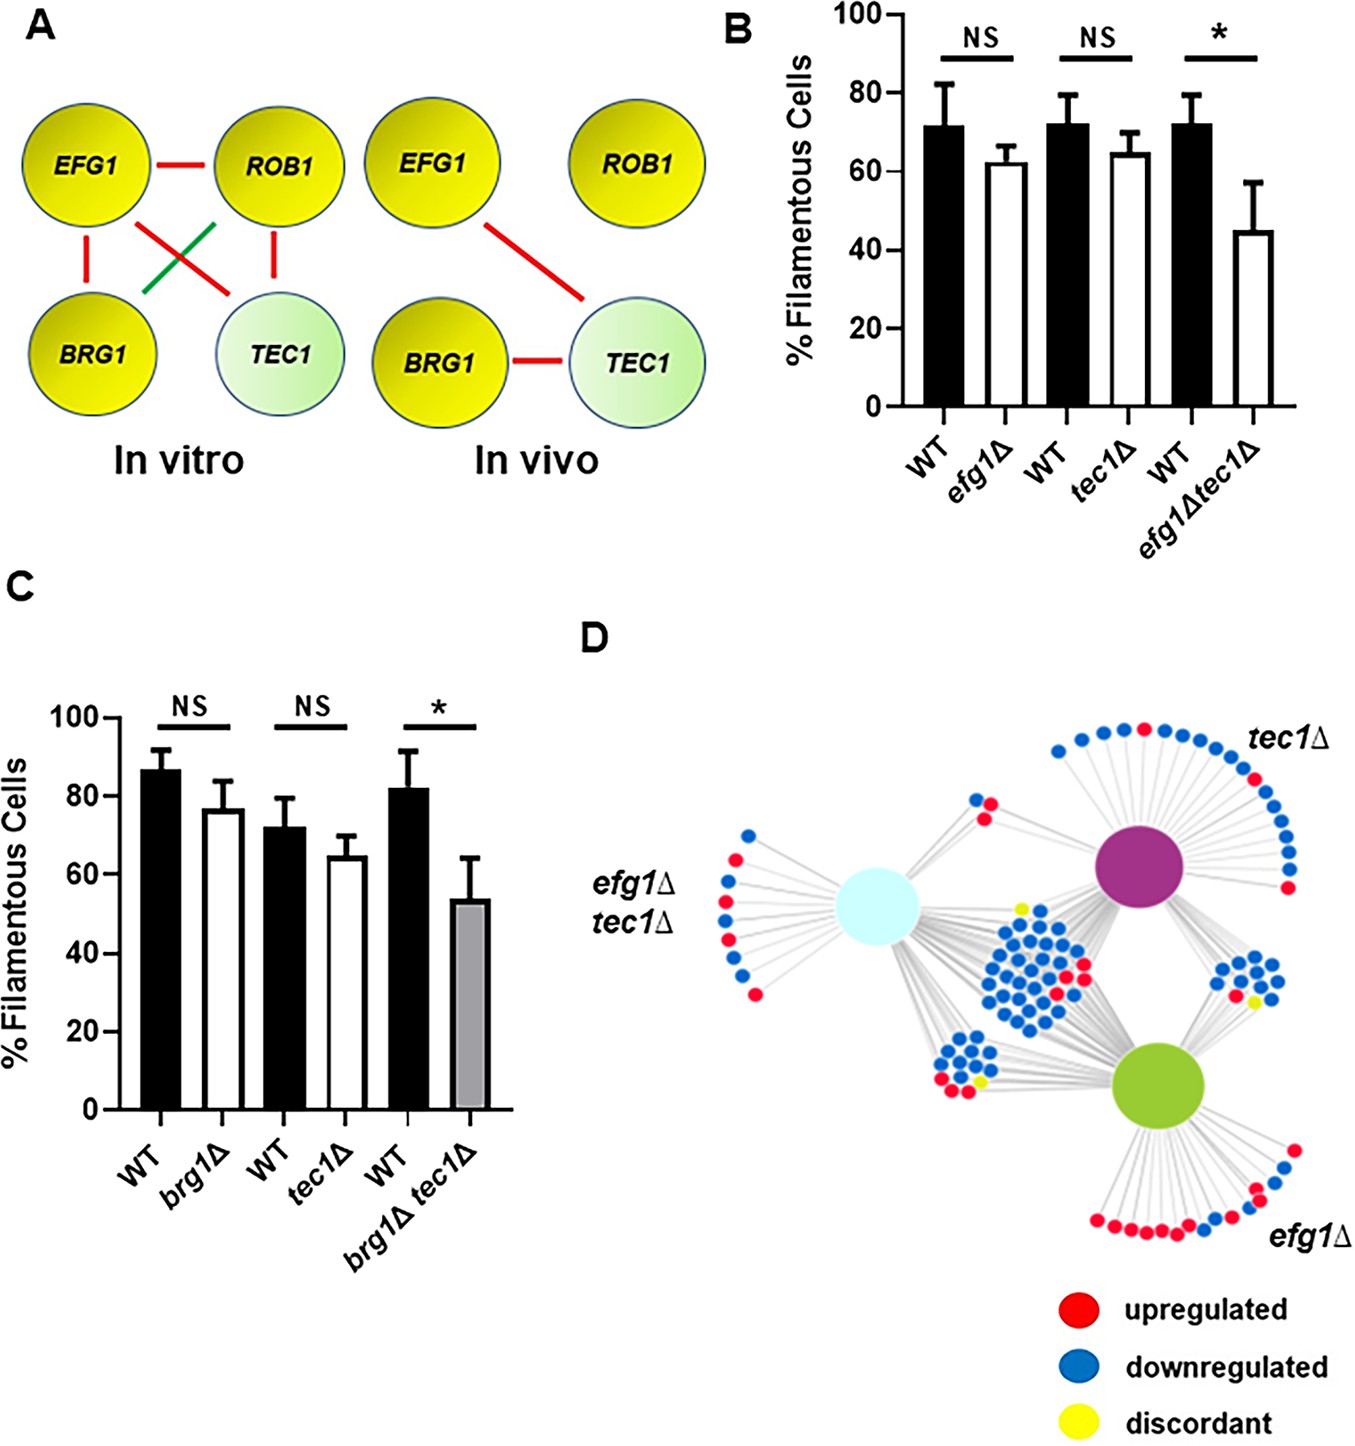
Efg1 and Brg1 show complex haploinsufficient genetic interactions with Tec1.
(A) The genetic interactions of the core filament initiation regulators with Tec1 differ between in vitro and in vivo conditions. Red indicates a negative interaction; green indicates a positive interaction according to the multiplicative model described in text. The single ∆ after the gene name indicates that the mutant is heterozygous at that locus. Filament initiation data for the interaction of (B) efg1∆ and tec1∆ and (C) brg1∆ and tec1∆. *p<0.05 paired Student’s t test. Bars indicate mean of 4–5 replicate fields with >100 cells. Error bars indicate standard deviation. (D) The differentially expressed genes in the efg1∆ tec1∆ double heterozygous mutant overlap with the genes differentially expressed in the corresponding single heterozygous mutants (efg1∆ and tec1∆). Full data set is provided in Supplementary file 4.
Figure 6
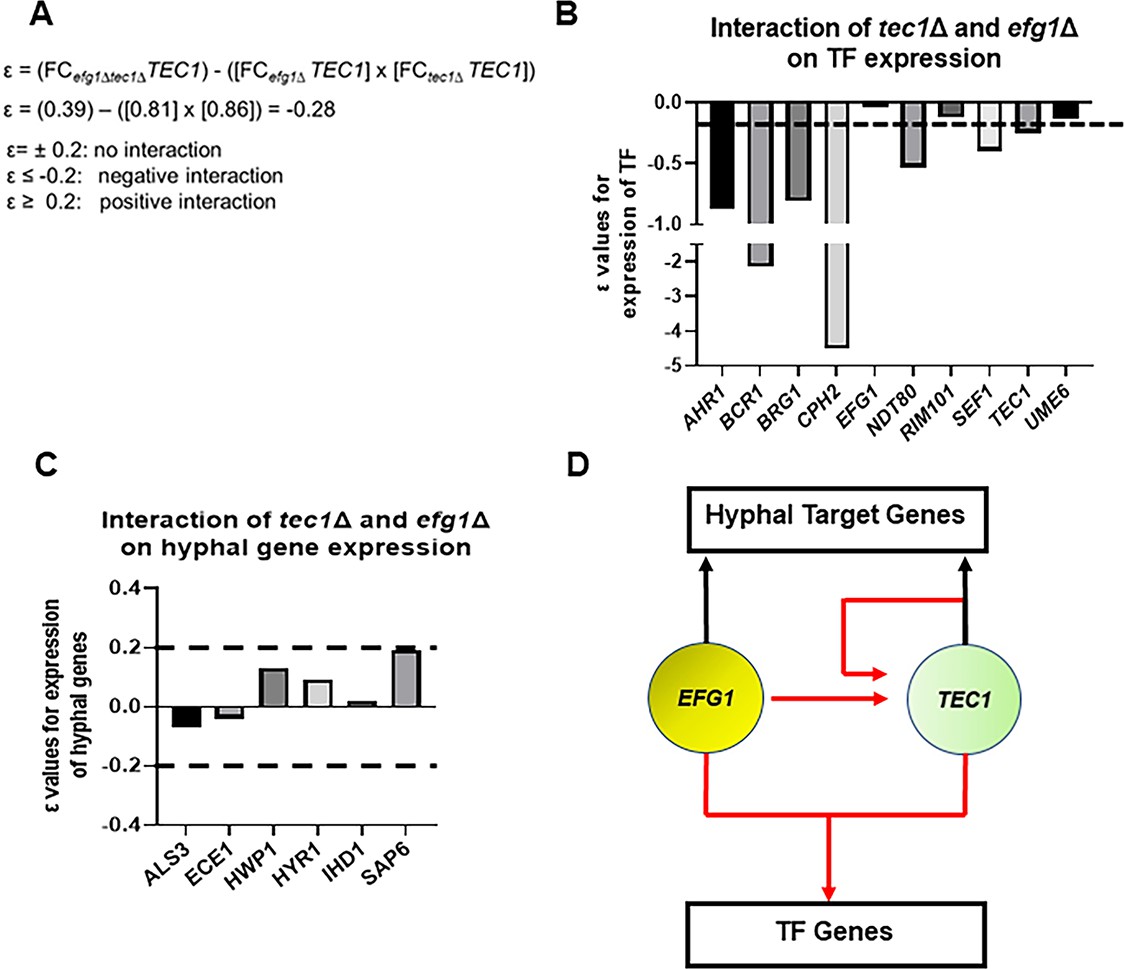
Efg1 and Tec1 synergistically affect the expression of auxiliary regulators of filament initiation but independently regulate the expression of hypha-associated genes.
(A) Sample calculation of the interaction score (ε) for the effect of the tec1∆, efg1∆, and tec1∆ efg1∆ mutants on auxiliary transcription factor (TF) expression and hyphae-specific genes. ε values calculated using data in Supplementary file 4. The dotted line indicates the cut-off for negative or positive interactions (ε±0.2) based on the estimated error; targets for which the –0.2>ε<0.2 were considered to have no interaction. (B) depicts interactions for auxiliary TFs and (C) for a set of hyphae-associated genes. (D) Proposed regulatory circuit for Efg1 and Tec1 based on genetic interaction analysis.
Figure 7
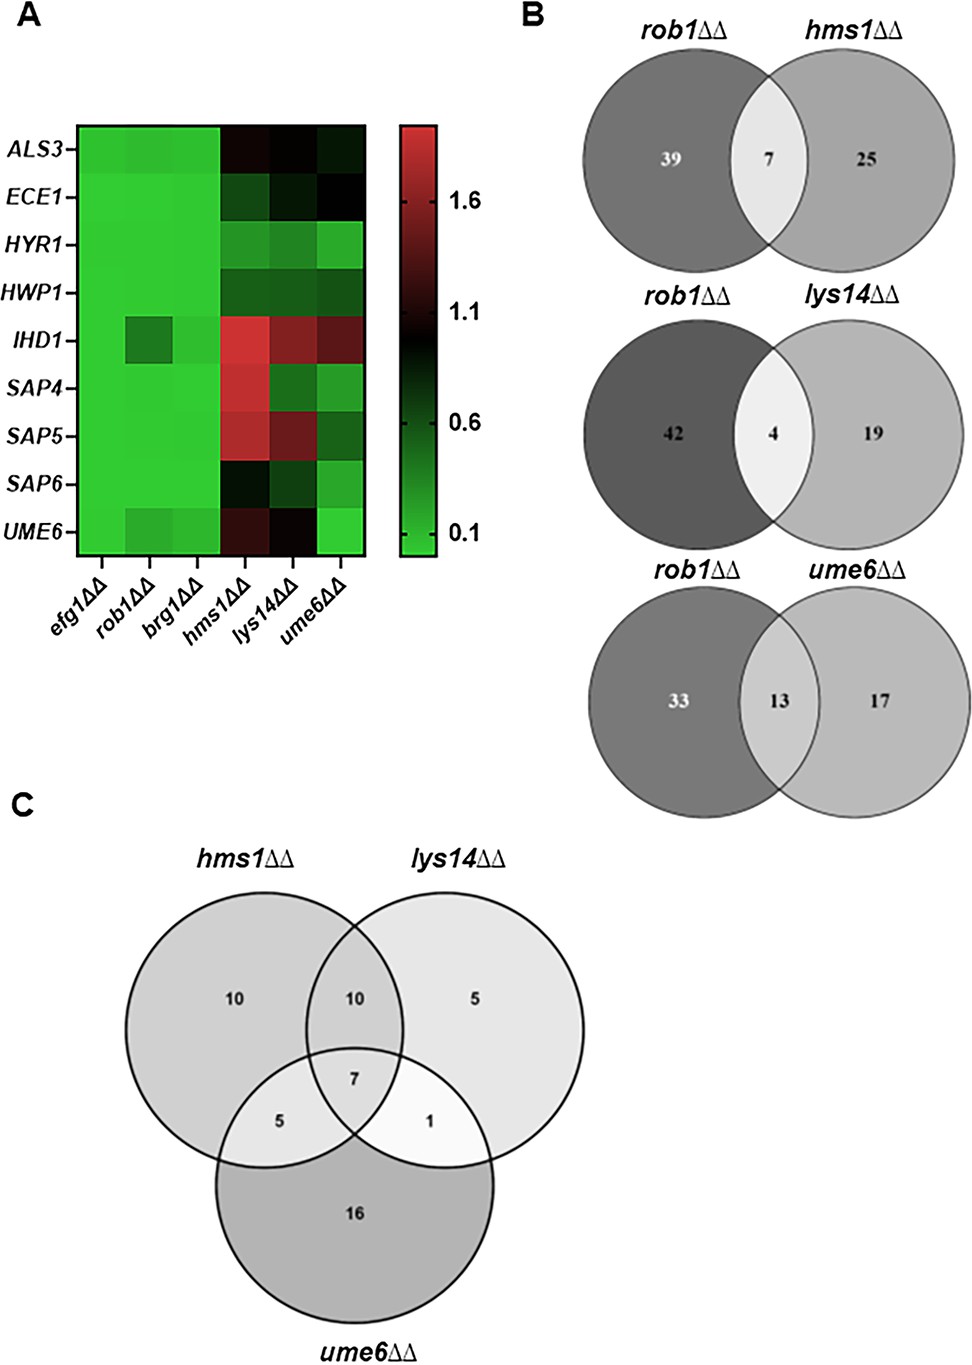
Transcription factors that specifically affect filament length regulate a set of genes distinct from those regulated by transcription factors involved in filament initiation.
(A) Heat map comparing the expression of the indicate hypha-associated genes in the core filament initiation regulators (efg1∆∆, brg1∆∆, and rob1∆∆) with three regulators of hyphal elongation (hms1∆∆, lys14∆∆, and ume6∆∆). The full data set is provided in Supplementary file 5. (B) Venn diagrams comparing genes downregulated in the rob1∆∆ mutant with three regulators of hyphal elongation (hms1∆∆, lys14∆∆, and ume6∆∆). (C) Venn diagram comparing the overlap in genes downregulated in hms1∆∆, lys14∆∆, and ume6∆∆.
Figure 8
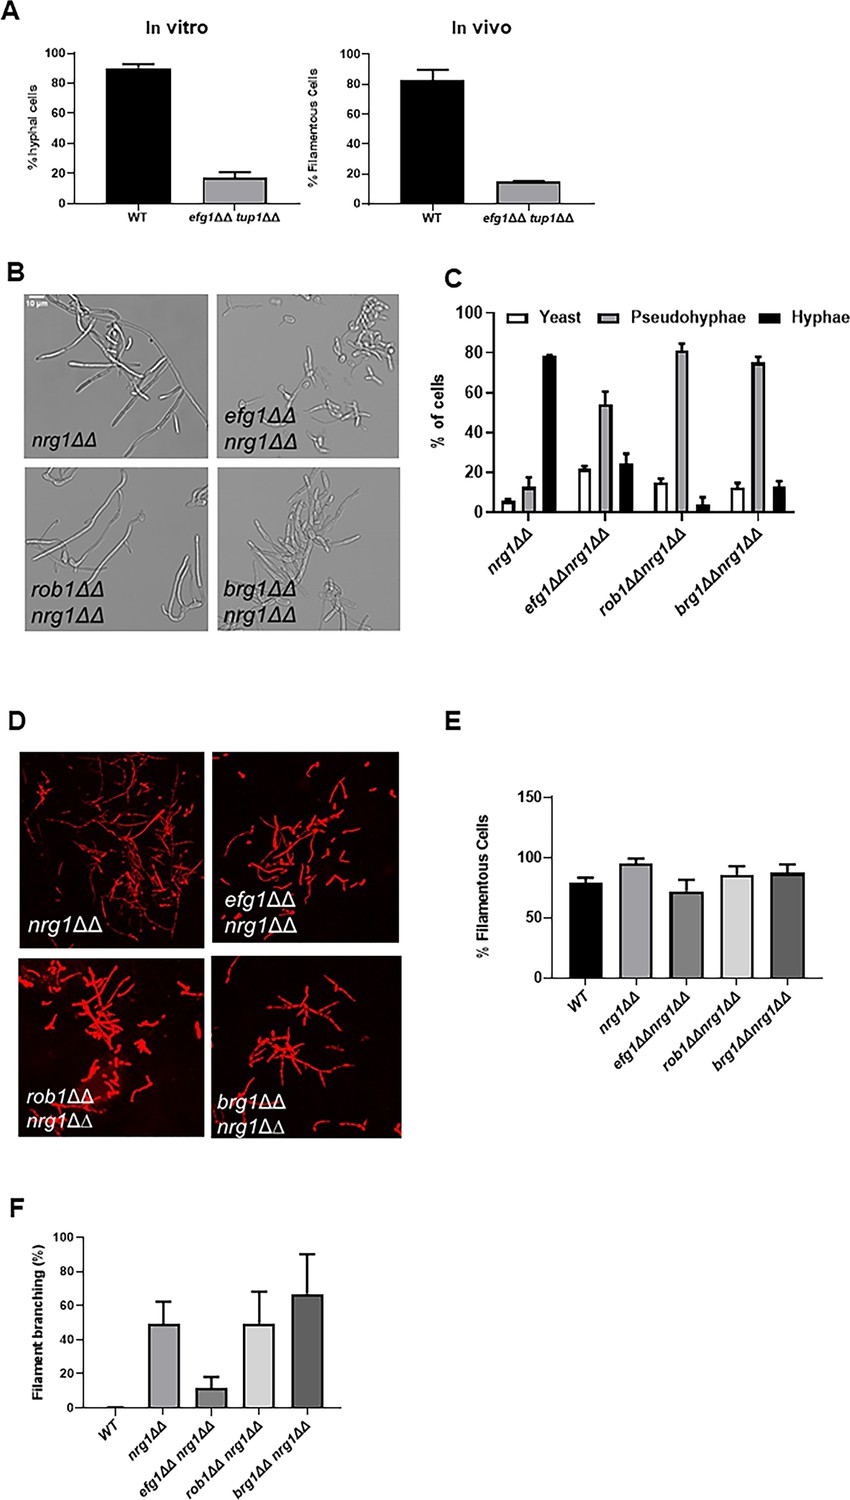
Genetic interactions between the core positive and negative regulators of filament initiation.
(A) The percentage of filaments formed by the tup1∆∆ efg1∆∆ mutant relative to wild type (WT) after 4 hr induction with RPMI+10% fetal bovine serum (FBS) or 24 hr infection in mouse ear. (B) Photomicrographs of the indicated mutants after in vitro induction. (C) Distribution of yeast, hyphae, and pseudohyphae after in vitro induction. (D) Representative micrographs of in vivo filamentation for the indicated strains. (E) The percentage of filaments observed in vivo for the indicated strains. (F) The percentage of cells with branches observed in vivo. The bars indicate at least two independent inductions and ear assays with standard deviation indicated by error bars.
-
Figure 8—source data 1
Images for comparison analysis of efg1∆∆ nrg1∆∆ and efg1∆∆ tup1∆∆ filamentation.
- https://cdn.elifesciences.org/articles/85114/elife-85114-fig8-data1-v2.zip
-
Figure 8—source data 2
Confocal images corresponding to the in vivo in Figure 8D.
- https://cdn.elifesciences.org/articles/85114/elife-85114-fig8-data2-v2.zip
Figure 9 with 1 supplement
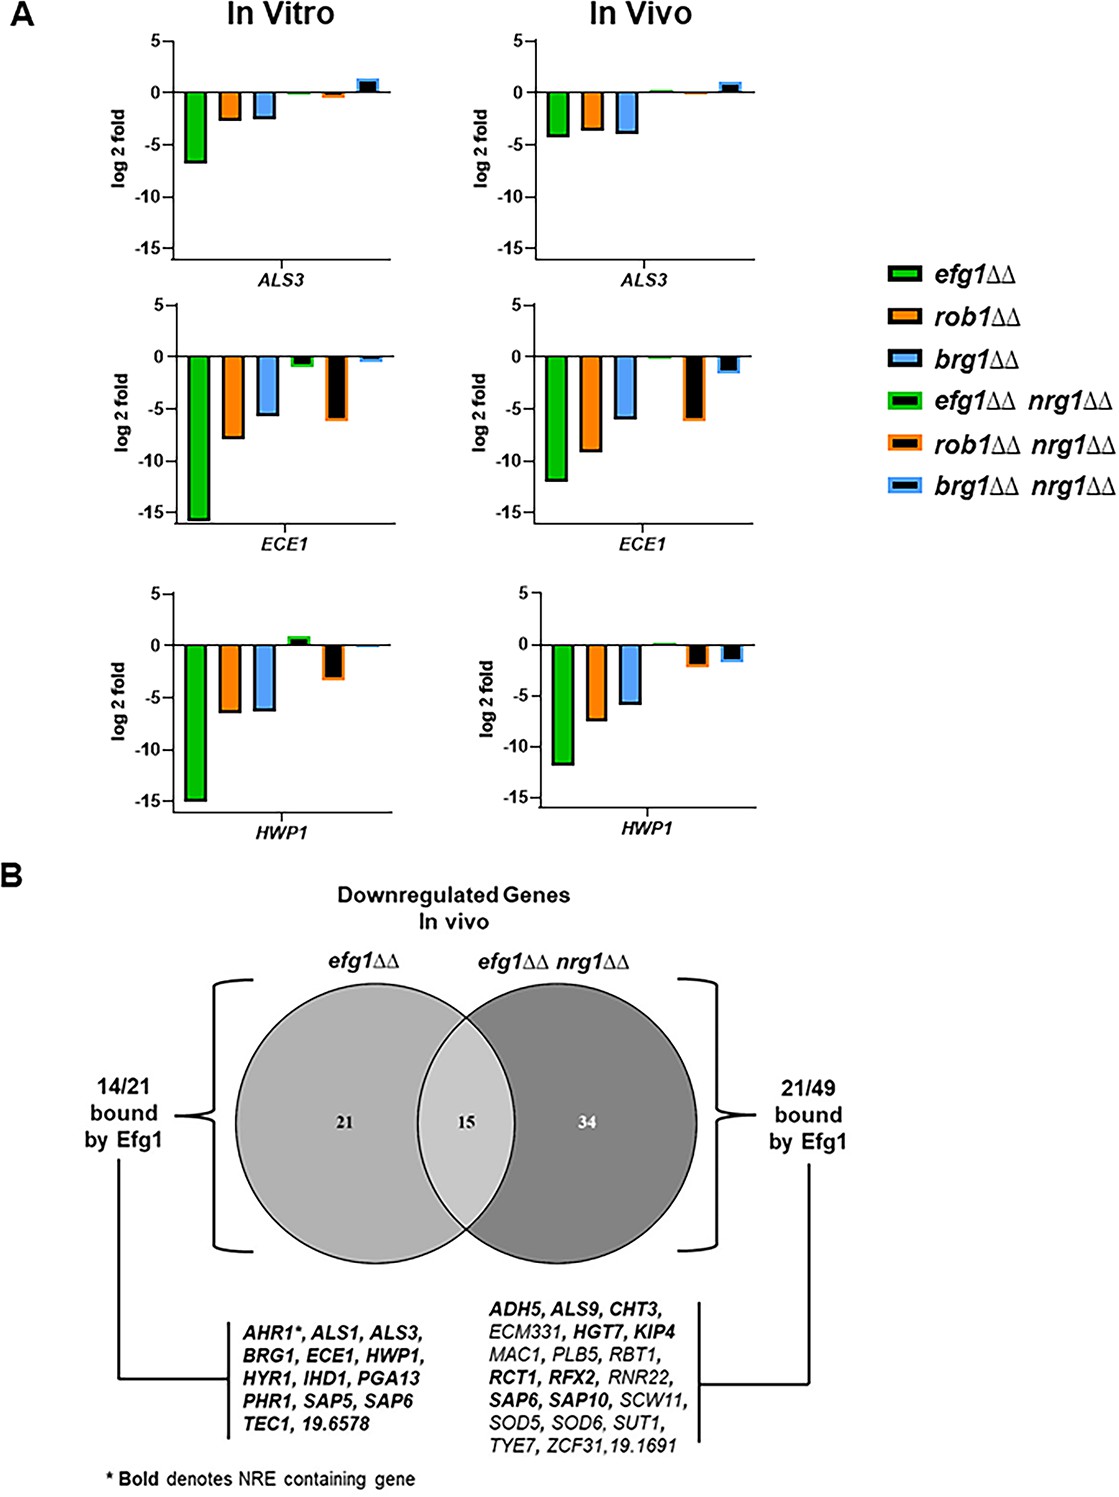
Deletion of NRG1 restores the expression of hypha-associated genes to the efg1∆∆ mutant in vitro and in vivo.
(A) The expression of ALS3, ECE1, and HWP1, canonical hypha-associated genes, in the indicated strains. The fold-change is relative to wild type (WT) for both in vitro and in vivo inductions The data are presented in Supplementary file 3 and Supplementary file 6 along with standard deviation and false discovery rate (FDR) statistics. (B) The Venn diagram compares the downregulated genes in the efg1∆∆ and efg1∆∆ nrg1∆∆ mutants (see Supplementary files 3; 6 and 7). Direct Efg1 targets are genes identified in references (Lassak et al., 2011; Witchley et al., 2021 or Do et al., 2022). Nrg1 Response Elements (NRE) were as defined in reference (Murad et al., 2001).
Figure 9—figure supplement 1
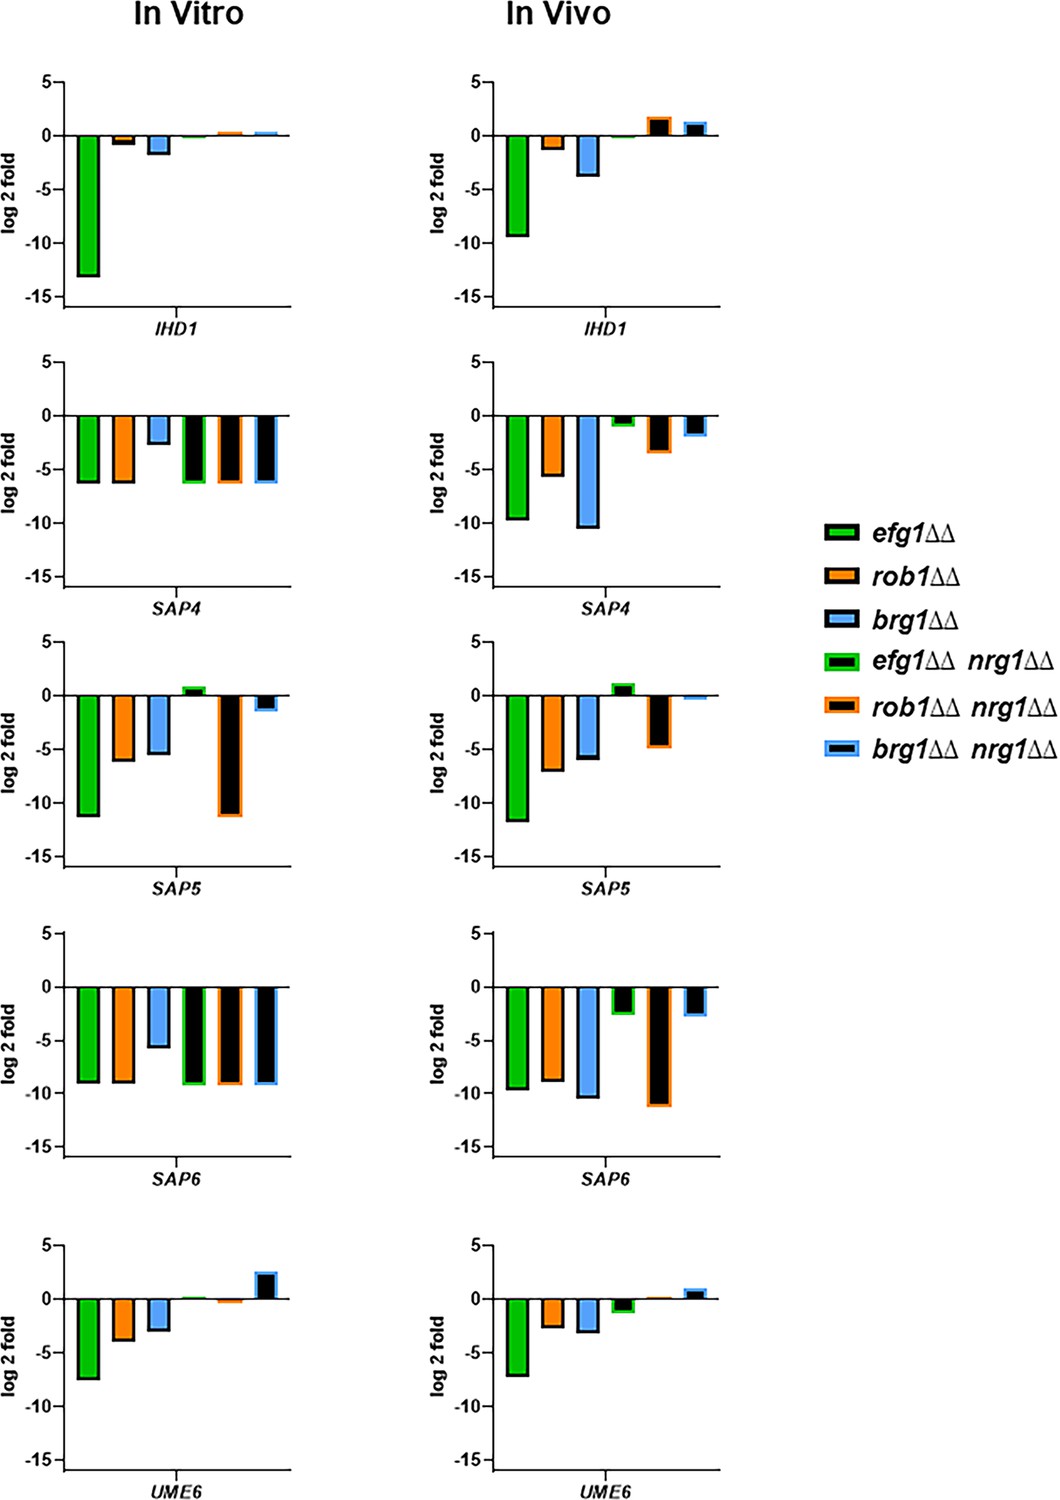
The expression of five canonical hypha-associated genes in the indicated strains.
The fold-change is relative to wild type (WT) for both in vitro and in vivo inductions The data are presented in Supplementary files 3 and 6 along with standard deviation and false discovery rate (FDR) statistics.
Figure 10
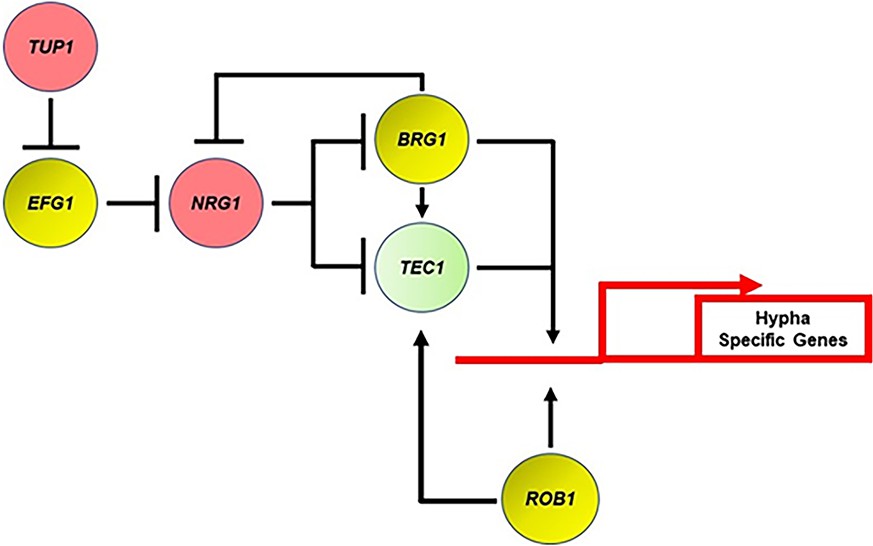
Transcriptional regulatory circuit for the expression of hypha-specific genes.
Red indicates repressor of filamentation; yellow indicates core positive regulator; and light green indicates auxiliary. Arrows indicate positive regulatory step and perpendicular line indicates negative regulatory step.
Tables
Key resources table
| Reagent type (species) or resource | Designation | Source or reference | Identifiers | Additional information |
|---|---|---|---|---|
| Strain, strain background (Candida albicans) | C. albicans strains generated in this work | See strain table in Supplementary file 8 | ||
| Strain, strain background (Candida albicans) | C. albicans SN background, homozygous TF deletion mutant collection | Fungal Genetics Stock Center (https://www.fgsc.net/) | Deletion set from Oliver Homann | |
| Strain, strain background (Mus musculus, female) | DBA2/N (6–12 weeks) | Envigo | ||
| Biological sample | Fetal bovine serum | Gibco/Thermo Fisher (https://www.thermofisher.com/order/catalog/product/26140079) | Cat. #: 26140-079 | |
| Sequence-based reagent | NanoString Gene probe set | NanoString Co. | Custom Probe Set | See Supplementary file 3 for complete list of genes |
| Sequence-based reagent | RPMI1640 Cell culture medium | Gibco/Thermo Fisher (https://www.thermofisher.com/order/catalog/product/11875093) | Cat. #: 11875-093 | |
| Commercial assay or kit | RNA extraction kit | Previously been sold by Lucigen and now can be obtained at https://us.vwr.com/store/product/22399774/masterpuretm-complete-dna-and-rna-purification-kit-biosearch-technologies | Cat. #: 76081-748 | |
| Commercial assay or kit | iScript cDNA synthesis kit (Bio-Rad) | https://www.bio-rad.com/en-us/sku/1708891-iscript-cdna-synthesis-kit-100-x-20-ul-rxns?ID=1708891 | Cat. #: 170-8891 | |
| Commercial assay or kit | iQ SYBR Green Supermix (Bio-Rad) | https://www.bio-rad.com/en-us/sku/1708880-iq-sybr-green-supermix-100-x-50-ul-rxns-2-5-ml-2-x-1-25-ml?ID=1708880 | Cat. #: 170-8892 | |
| Software, Algorithm | GraphPad Prism software | GraphPad Prism (https://graphpad.com) | Version: 9.5.0 (730) | |
| Software, Algorithm | NanoString software | https://nanostring.com/products/analysis-solutions/nsolver-advanced-analysis-software/ | Version: 4.0 | |
| Software, Algorithm | ImageJ /FiJi software | https://imagej.nih.gov/ij/download.html | Version: 1.8.0_322 (64 bit) |
Additional files
-
Supplementary file 1
Analysis of the extent of filamentation of 155 transcription factor deletion mutants during ear infection.
The columns indicate: gene name; percentage filaments formed relative to co-infecting wild type (WT) strain; standard deviation; p value for comparison of the mutant to WT using paired Student’s t test.
- https://cdn.elifesciences.org/articles/85114/elife-85114-supp1-v2.xlsx
-
Supplementary file 2
Analysis of filament length of 155 transcription factor deletion mutants during ear infection.
The columns indicate: gene name; mean length of the wild type (WT); mean length of the mutant; p value for comparison of WT to mutant by Mann-Whitney U test; and relative length of the mutant with its co-infecting WT set to 100%. Bold indicates mutants with statistically different filament lengths (p<0.05).
- https://cdn.elifesciences.org/articles/85114/elife-85114-supp2-v2.xlsx
-
Supplementary file 3
NanoString expression profile of efg1∆∆, brg1∆∆, and rob1∆∆ mutants in vitro and in vivo.
The gene names; raw nCounter counts for wild type (WT) and the mutant strains; normalized counts; average counts for the strains; counts normalized to WT; fold-change for the gene expression in the mutant relative to WT; the p value calculated using Student’s t test; and the false discovery rate (FDR) calculated using the Benjamini-Yekutieli procedure are provided. Red indicates a gene downregulated by twofold relative to WT with FDR ≤0.1; green indicates a gene upregulated using the same criteria.
- https://cdn.elifesciences.org/articles/85114/elife-85114-supp3-v2.xlsx
-
Supplementary file 4
NanoString expression profile of tec1∆, efg1∆, and tec1∆ efg1∆ in vitro and in vivo.
The gene names; raw nCounter counts for wild type (WT) and the mutant strains; normalized counts; average counts for the strains; counts normalized to WT; fold-change for the gene expression in the mutant relative to WT; the p value calculated using Student’s t test; and the false discovery rate (FDR) calculated using the Benjamini-Yekutieli procedure are provided. Red indicates a gene downregulated by twofold relative to WT with FDR ≤0.1; green indicates a gene upregulated using the same criteria.
- https://cdn.elifesciences.org/articles/85114/elife-85114-supp4-v2.xlsx
-
Supplementary file 5
NanoString expression profile of filament elongation regulators hms1∆∆, lys14∆∆, and ume6∆∆ in vivo.
The gene names; raw nCounter counts for wild type (WT) and the mutant strains; normalized counts; average counts for the strains; counts normalized to WT; fold-change for the gene expression in the mutant relative to WT; the p value calculated using Student’s t test; and the false discovery rate (FDR) calculated using the Benjamini-Yekutieli procedure are provided. Red indicates a gene downregulated by twofold relative to WT with FDR ≤0.1; green indicates a gene upregulated using the same criteria.
- https://cdn.elifesciences.org/articles/85114/elife-85114-supp5-v2.xlsx
-
Supplementary file 6
NanoString expression profile of Nrg1 double mutants in vitro and in vivo.
The gene names; raw nCounter counts for wild type (WT) and the mutant strains; normalized counts; average counts for the strains; counts normalized to WT; fold-change for the gene expression in the mutant relative to WT; the p value calculated using Student’s t test; and the false discovery rate (FDR) calculated using the Benjamini-Yekutieli procedure are provided. Red indicates a gene downregulated by twofold relative to WT with FDR ≤0.1; green indicates a gene upregulated using the same criteria.
- https://cdn.elifesciences.org/articles/85114/elife-85114-supp6-v2.xlsx
-
Supplementary file 7
Summary of all genes differentially in the study.
- https://cdn.elifesciences.org/articles/85114/elife-85114-supp7-v2.xlsx
-
Supplementary file 8
Table of C. albicans strains used in this study.
- https://cdn.elifesciences.org/articles/85114/elife-85114-supp8-v2.docx
-
Supplementary file 9
Table of oligonucleotides and plasmids used in this study.
- https://cdn.elifesciences.org/articles/85114/elife-85114-supp9-v2.xlsx
-
MDAR checklist
- https://cdn.elifesciences.org/articles/85114/elife-85114-mdarchecklist1-v2.docx
Download links
A two-part list of links to download the article, or parts of the article, in various formats.
Downloads (link to download the article as PDF)
Open citations (links to open the citations from this article in various online reference manager services)
Cite this article (links to download the citations from this article in formats compatible with various reference manager tools)
Intravital imaging-based genetic screen reveals the transcriptional network governing Candida albicans filamentation during mammalian infection
eLife 12:e85114.
https://doi.org/10.7554/eLife.85114


