Plasmodium falciparum adapts its investment into replication versus transmission according to the host environment
- KEMRI-Wellcome Trust Research Programme, Kenya
- Pwani University Biosciences Research Centre, Pwani University, Kenya
- Wellcome Center for Integrative Parasitology, University of Glasgow, United Kingdom
- Institute of Parasitology, Vetsuisse and Medical Faculty, University of Zurich, Switzerland
- Radboud University Nijmegen Medical Centre, Netherlands
Figures
Figure 1
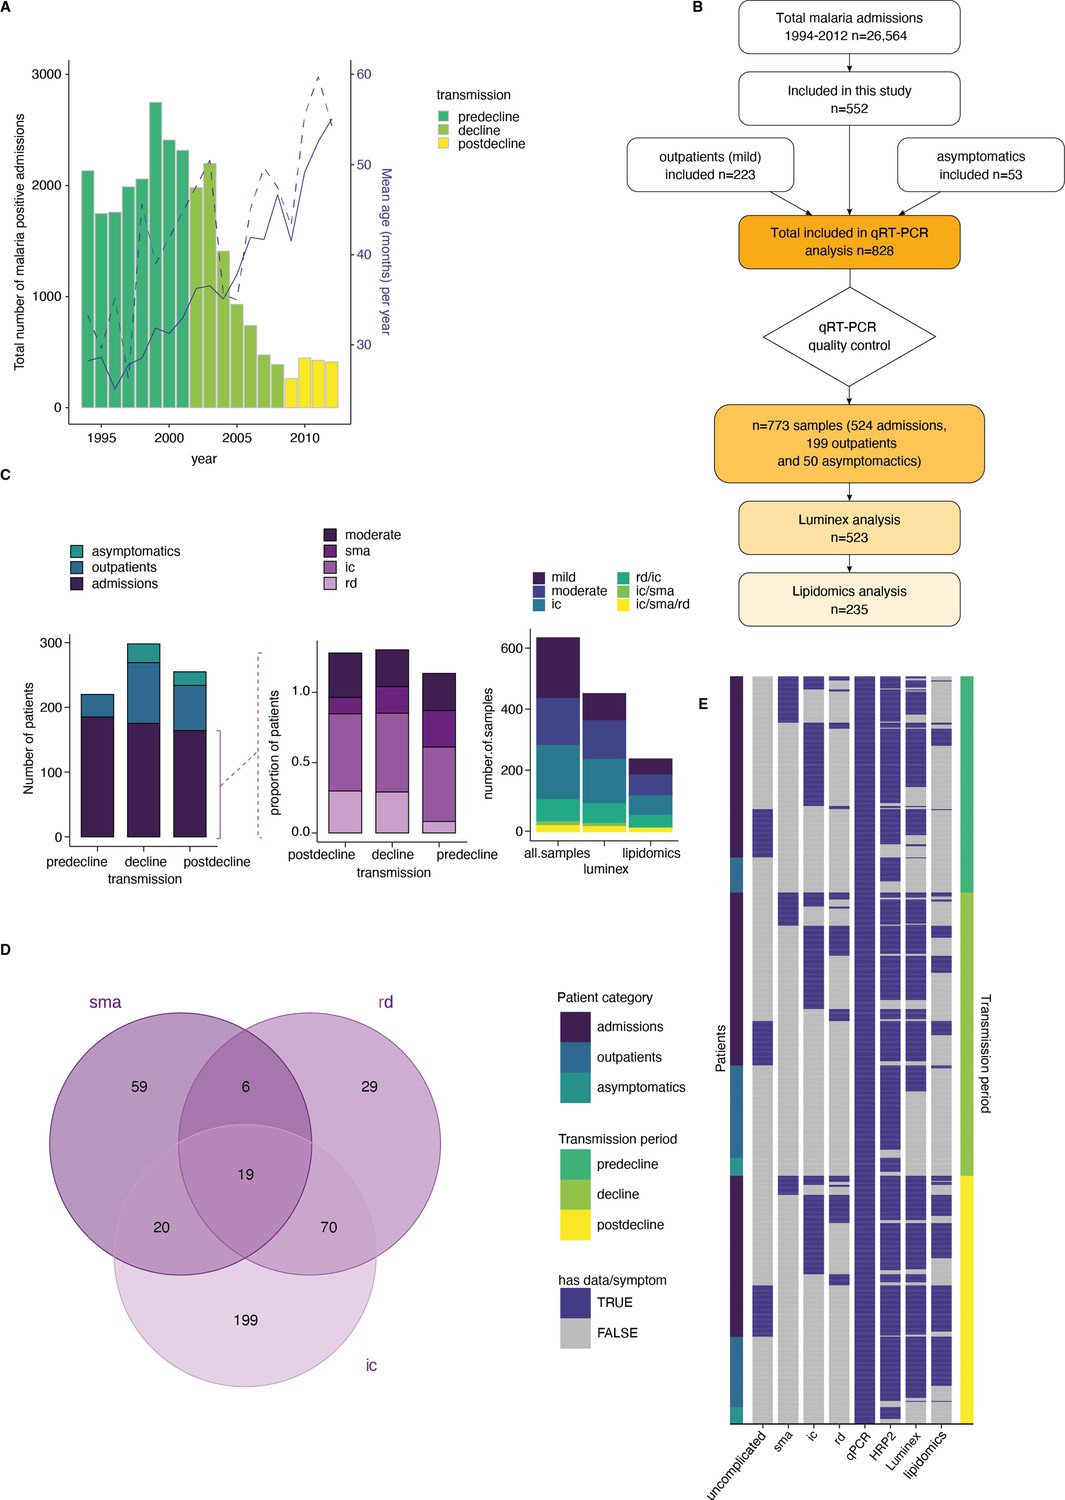
A clinical malaria patient cohort during changing the transmission in Kilifi, Kenya.
(A) Total malaria admissions and patient age of the parent cohort. Number of patients per year (gray histogram, left axis). The solid blue line is the average patient age in the parent cohort, the dashed line is the average patient age in this study (both right axis). (B) Schematic of sample selection for this study. (C) Clinical presentation of patients selected for this study. Left: all patients, middle: admissions only, right: subset selected for luminex and lipidomics analysis. sma = severe malarial anemia, ic = impaired consiousness, rd = respiratory distress. (D) Number of patients in this study with different clinical presentations (402 severe cases initially selected). (E) Overview of the data available for each patient of the study, after excluding samples with Pfsir2a and ap2-g transcript transcription units greater or equal to 32 as described in the methods. Each row is one patient, organized by patient category (left axis) and transmission period (right axis).
Figure 2 with 1 supplement
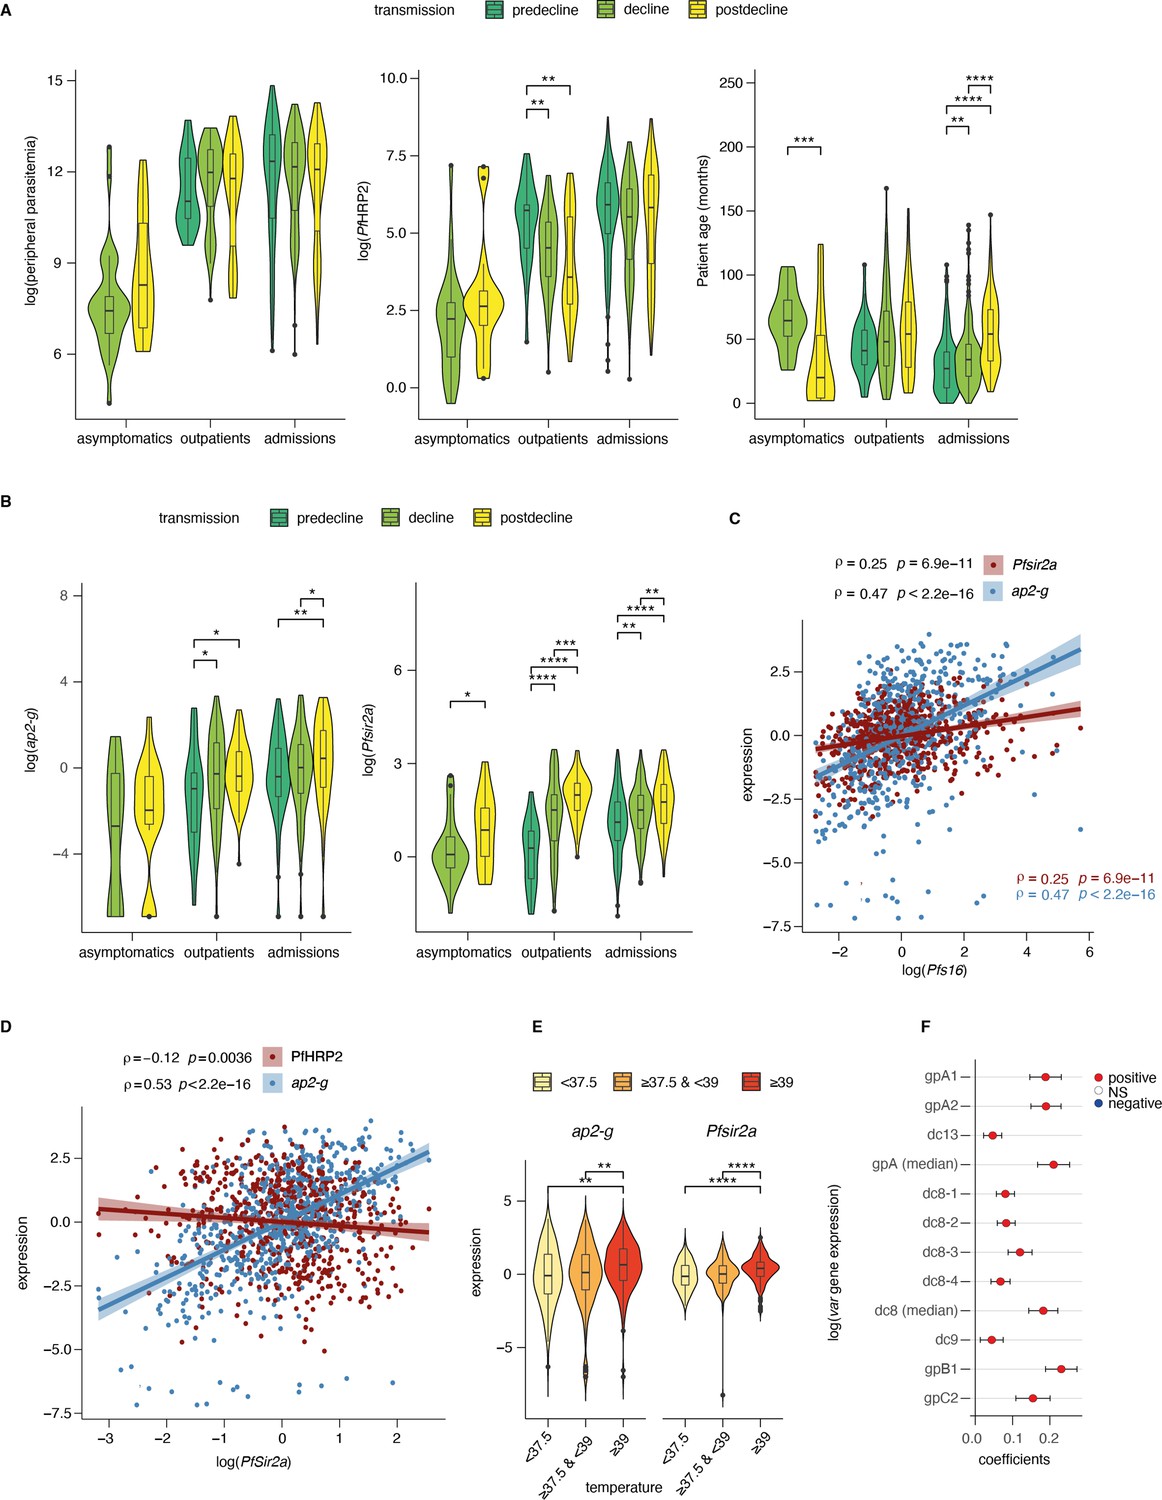
Dynamics of parasite parameters across transmission periods.
(A) Peripheral parasitemia (smear, left), total parasite biomass (PfHRP2, middle), and patient age (right) across patients. Number of patients: Asymptomatics: decline: n=29, postdecline: n=21; Outpatients: predecline: n=35, decline: n=94, postdecline: n=70; Admissions: predecline: n=185, decline: n=175, postdecline: n=164. (B) ap2-g transcript levels (left) and Pfsir2a levels (right) across patients. (C) Spearman’s correlation between Pfs16 and ap2-g (blue), or PfSir2a transcription (red) across patients (corrected for transmission). The lines fitted are linear regressions for visualization only. (D) Spearman’s correlation between Pfsir2a and ap2-g transcription (blue), or PfHRP2 levels (red) across patients (corrected for transmission). The lines fitted are linear regressions for visualization only. (E) ap2-g and Pfsir2a transcription (corrected for transmission) stratified by patient temperature. "<37.5": n=122, ">=37.5 & <39": n=228, ">=39": n=196. (F) Linear regression showing the association of var gene transcription levels with Pfsir2a levels (adjusted for transmission). 95% confidence intervals are shown. n=723 for all but c2 n=577. The color indicates whether the relationship is statistically significant (with Benjamini & Hochberg multiple tests correction). Positive correlations are in red, and negative in blue. gpA1, gpA2, and dc13 represent group A var gene transcripts. dc8-1 to dc8-4 represent DC8 var gene transcripts while gpb1 and gpc2 represent group B and C var genes. In the above graphs C-F (and all subsequent figures), asymptomatics were excluded in analyses involving the transmission period since they are not represented in the pre-decline period. All pairwise statistical tests indicated in the graphs are Wilcoxon tests corrected for multiple testing (Benjamini & Hochberg, *=FDR < 0.05, **=<0.01, ***=<0.001, and ****=<0.0001).
Figure 2—figure supplement 1
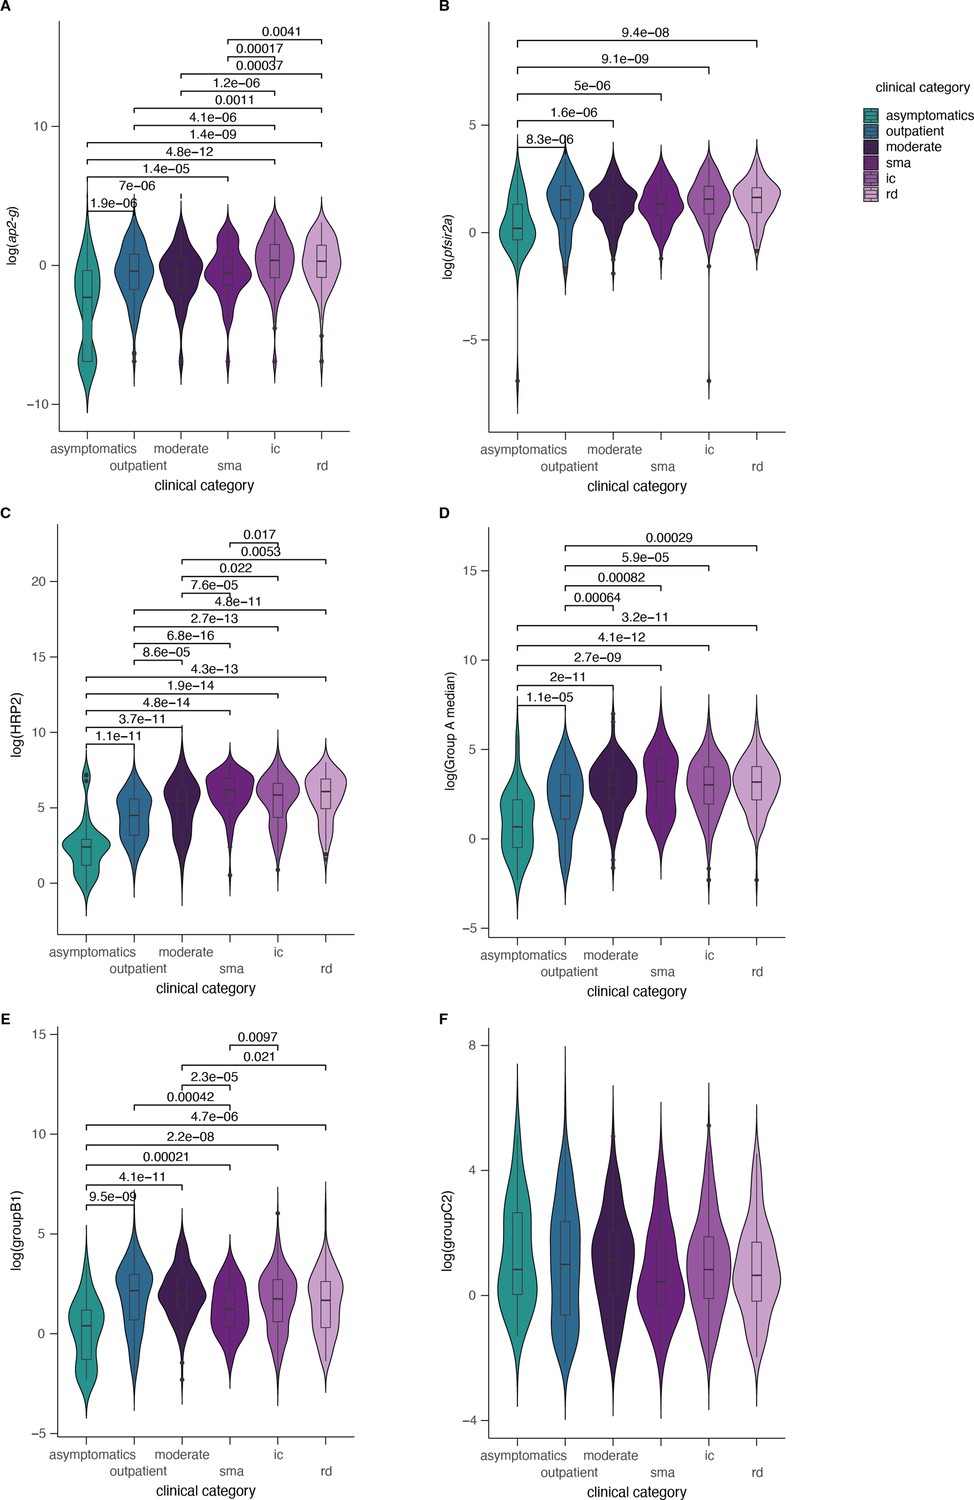
Parasite parameters stratified by clinical categories.
ap2-g, Pfsir2a, var gene transcription, and PfHRP2 levels stratified by clinical categories. Significant Wilcoxon test p-values (corrected for multiple testing) marked with *p<0.05, **p<0.01, ***p<0.001, ****p<0.0001. Number of patients: A,B,D,E: asymptomatics: n=50, outpatients: n=199, moderate: n=147, sma=100, ic=286, rd=115; C: asymptomatics n=38, outpatients: n=174, moderate: n=126, sma=95, ic=260, rd=100; F: asymptomatics: n=29, outpatients: n=175, moderate: n=101, sma: n=92, ic: n=215, rd: n=85.
Figure 3 with 3 supplements
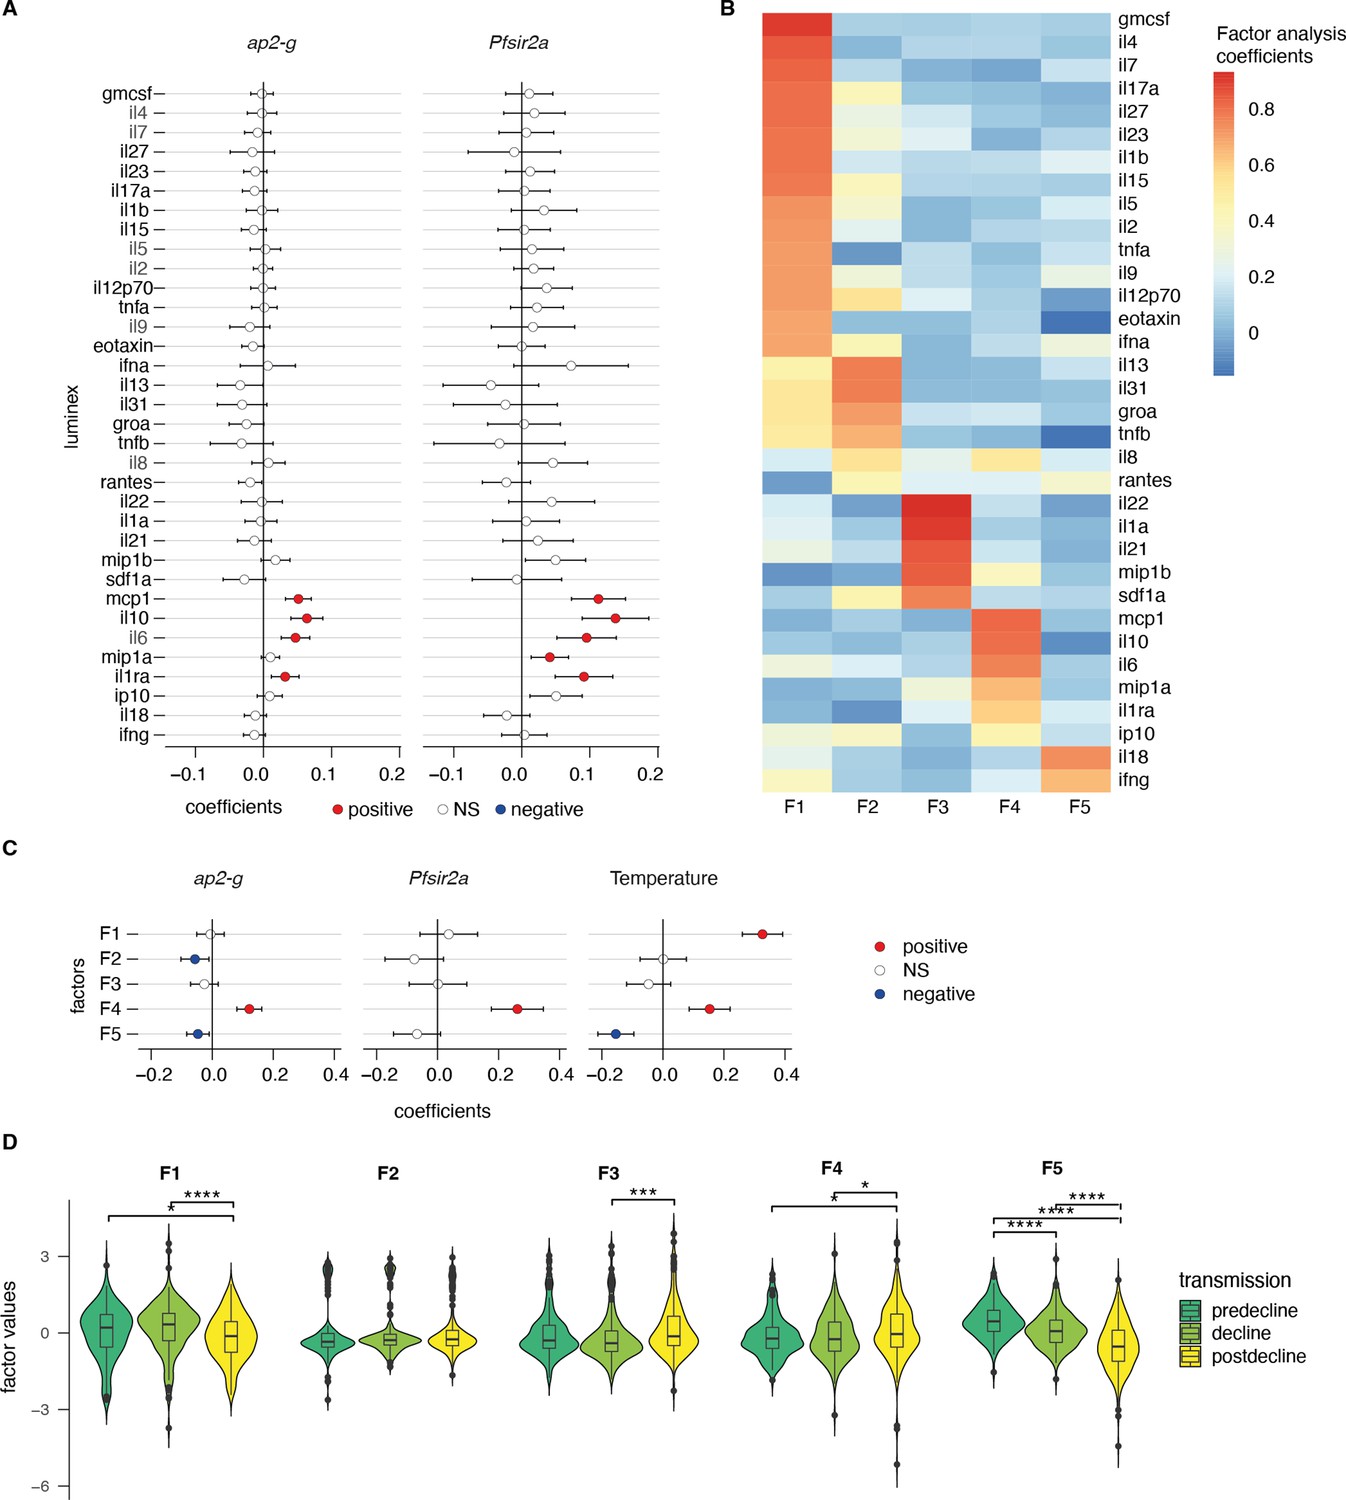
ap2-g and Pfsir2a transcription levels are associated with the host inflammation profile.
(A) Association of inflammatory markers with ap2-g and Pfsir2a transcripts, tested using transmission period, age, and PfHRP2 adjusted linear regression (p-values adjusted for multiple testing using Benjamini & Hochberg multiple tests correction). Plotted is the regression coefficient (estimate) and 95% CI. Above and below zero indicate statistically significant positive (red) and negative associations (blue), respectively. n=523 (B) Principal exploratory factor analysis. The figure shows the inflammatory marker loadings on the five factors (F1–F5) identified to have eigenvalue above 1. (C) Linear regression between inflammatory factors. (F1–F5) and ap2-g and Pfsir2a transcription and patient temperature (adjusted for transmission, PfHRP2, and age). Plotted is the coefficient between the factor and the parameter (estimate) and 95% CI. Number of Patients: ap2-g and Pfsir2a: n=523, Temperature: n=496. The association is significant if the correlation FDR <0.05, in which case the positive associations are marked in red and the negative ones in blue. (D) Inflammatory factors stratified by transmission period. Pairwise tests are Wilcoxon tests (Benjamini & Hochberg, *=FDR < 0.05, **=<0.01, ***=<0.001, and ****=<0.0001). Number of patients: predecline: n=131, decline: n=180, postdecline: n=212.
Figure 3—figure supplement 1

Parasite and inflammatory markers stratified by transmission period.
(A) Linear regression between ap2-g (left), Pfs16 (middle), or Pfsir2a (right) transcript levels and ap2-g, Pfs16, Pfsir2a, var gene transcripts levels as per Figure 3A. Data are corrected for transmission period, age, and Plasmodium falciparum histidine-rich protein 2 (PfHRP2). Number of patients: see Figure 2F (B) Linear regressions between ap2-g (left) or Pfsir2a (right) transcript levels and luminex markers as per Figure 3A, stratified by transmission period. Number of patients: predecline: n=131, decline: n=180, postdecline: n=212.
Figure 3—figure supplement 2
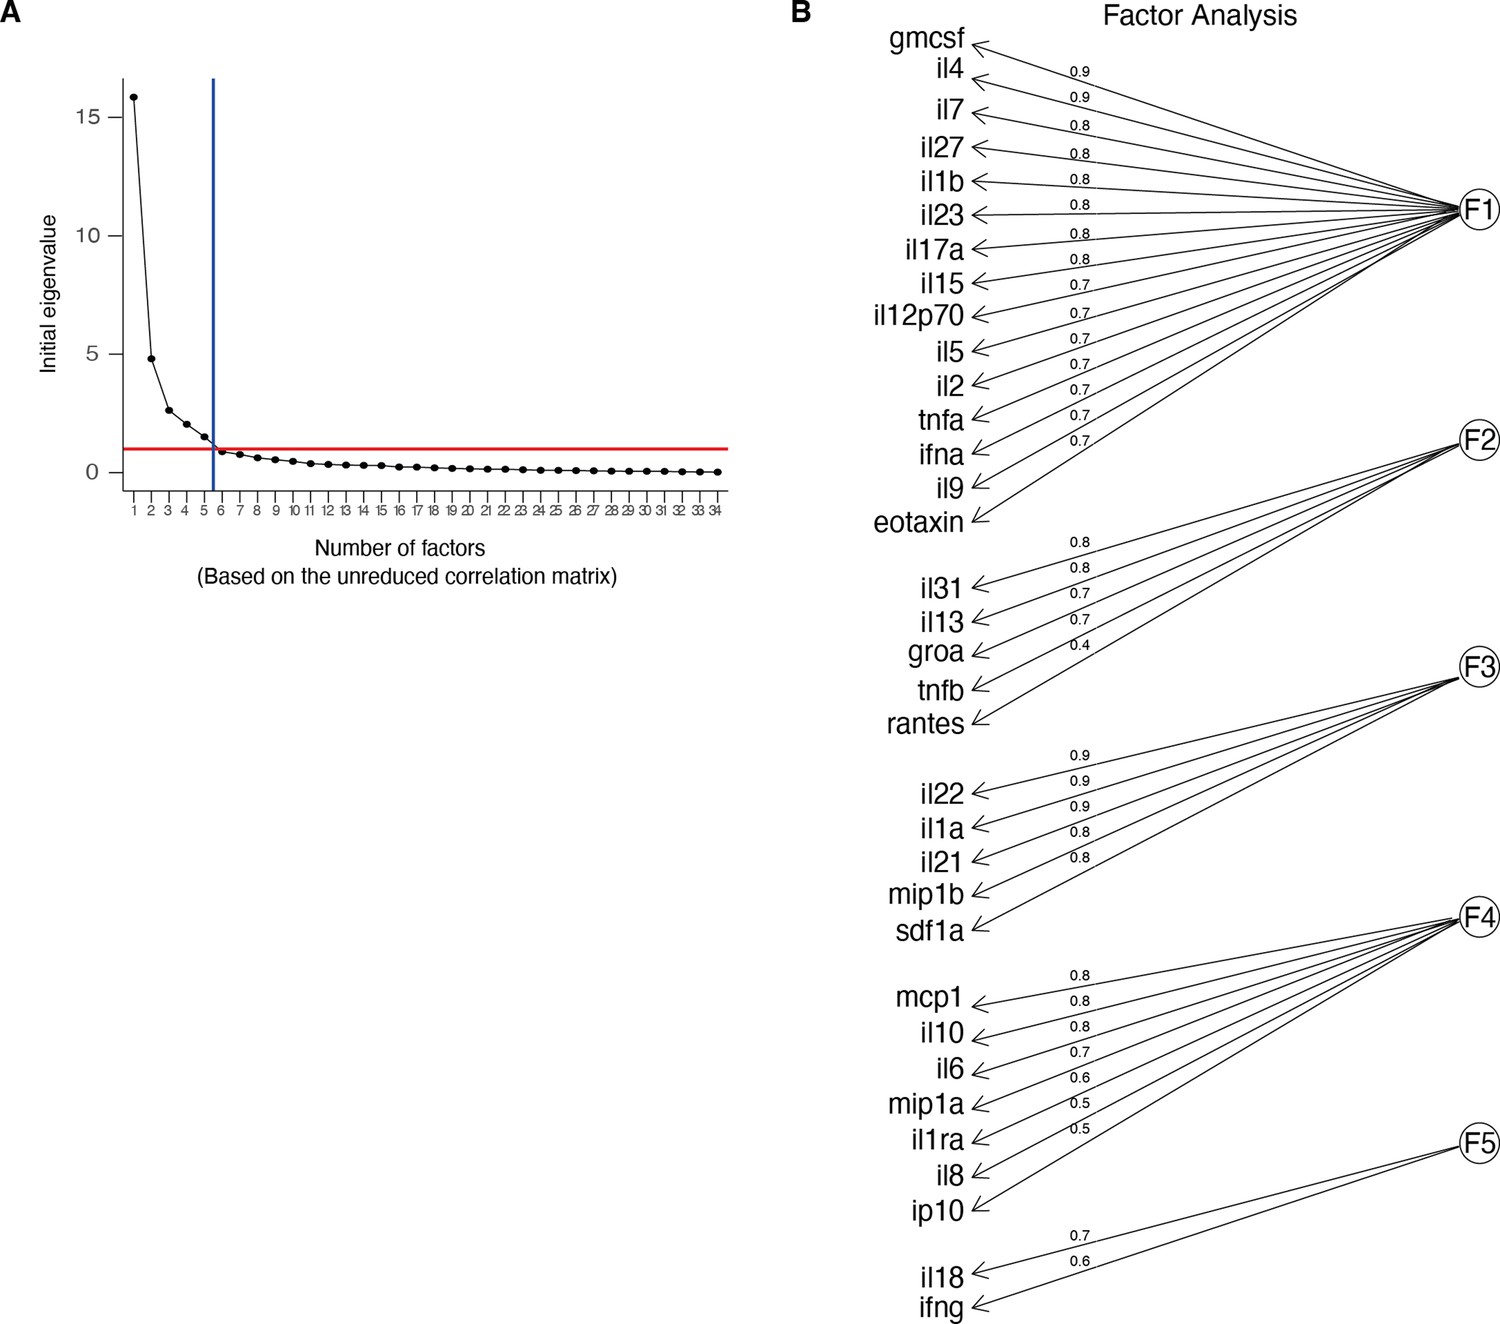
Factor loadings.
(A) Scree plot showing the eigenvalues vs the number of factors (factor analysis of the luminex data). (B) Major loadings of each factor calculated by factor analysis of the luminex data (values ≥ 0.3). Loading values are noted on the edges.
Figure 3—figure supplement 3
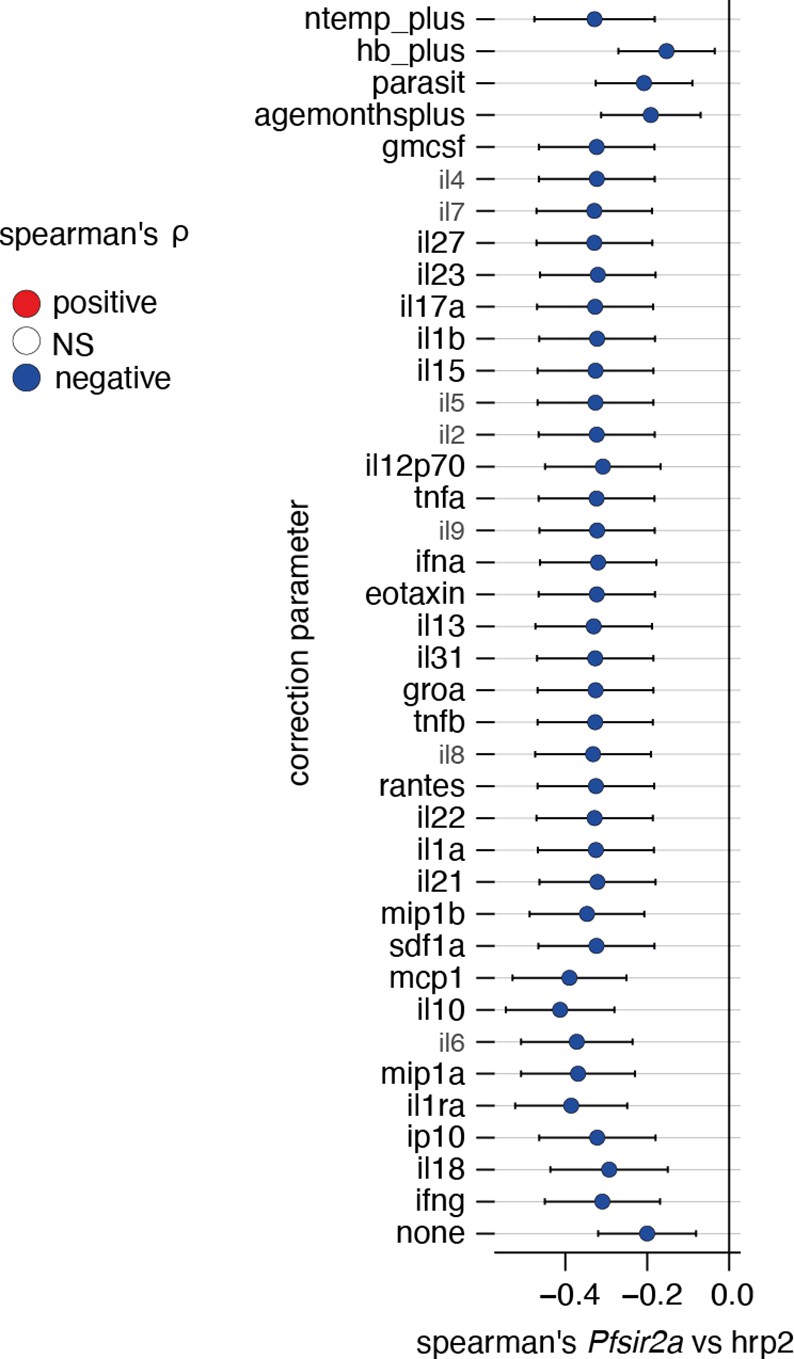
Correcting Plasmodium falciparum histidine-rich protein 2 (PfHRP2) vs Pfsir2a associations for external factors.
Plotted is the linear regression coefficient (estimate) and 95% CI. Blue indicates a significant negative correlation between PfHRP2 levels and Pfsir2a transcription with the additional correction indicated on the left. Number of patients: all cytokines: n=517, age: n=632, hb_plus: n=599, parasit (parasitemia): n=643, ntemp_plus(patient temperature): n=497.
Figure 4 with 2 supplements
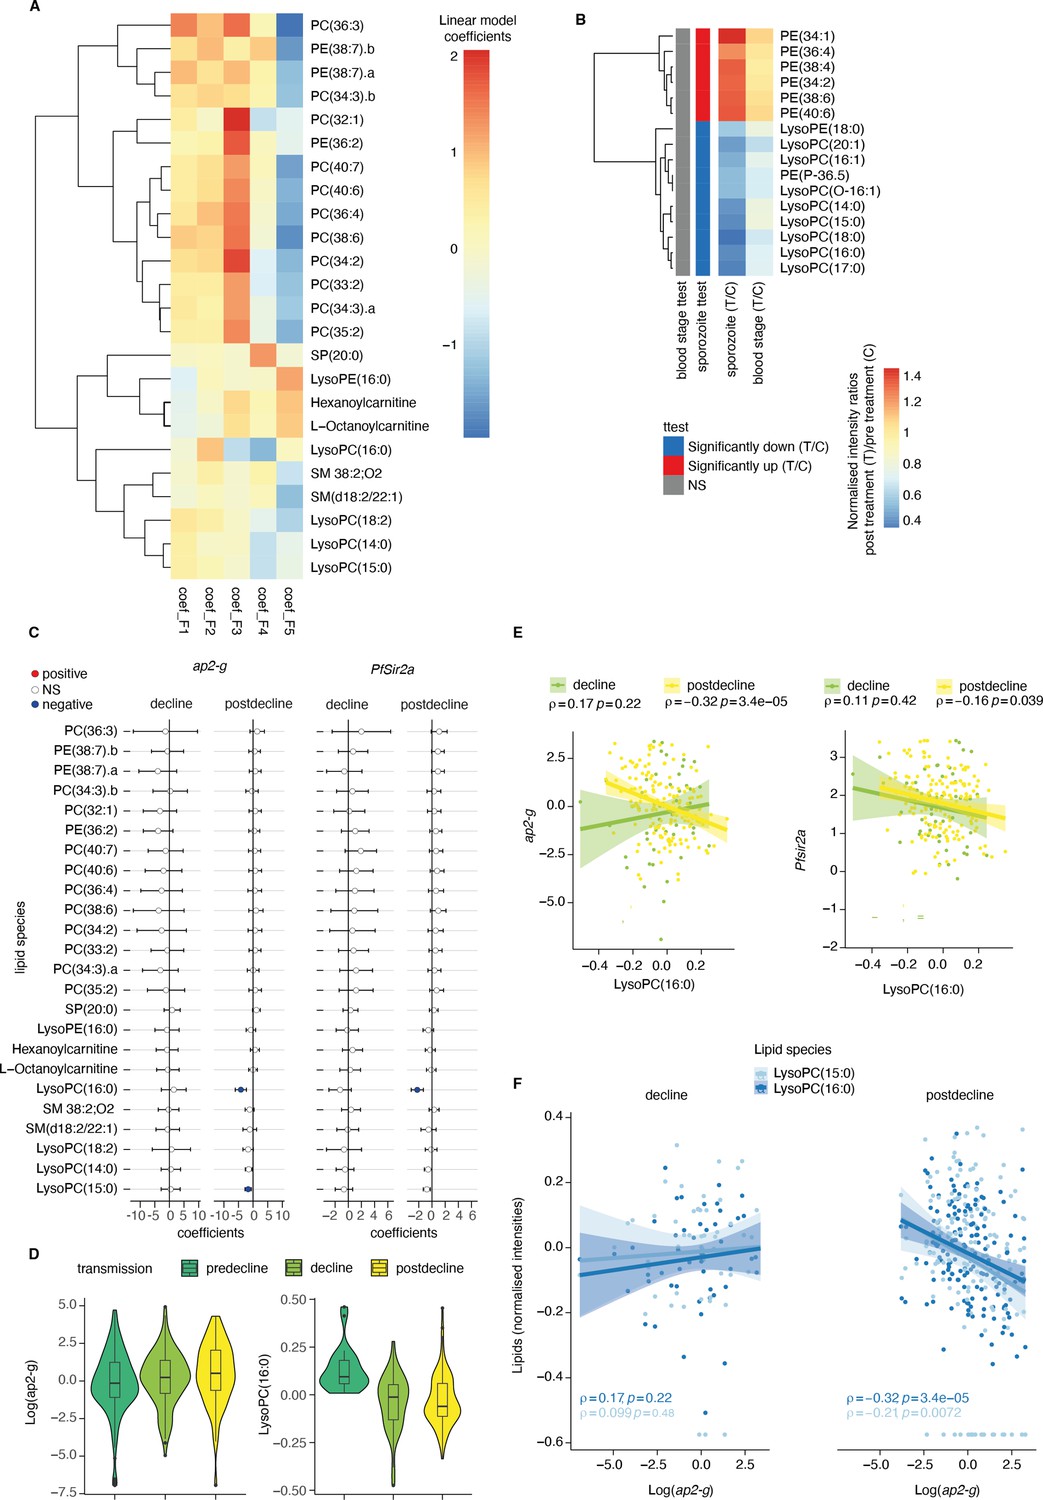
Plasma Lysophosphatidylcholine (LPC) links host inflammation to ap2-g and Pfsir2a transcription.
(A) Heatmap of the linear regression coefficients between lipids and inflammatory factors (F1-F5, adjusted for transmission period and corrected for multiple testing). Shown are all lipids that are significantly associated (positive or negative) with factors F1-F5, clustered using R hclust (distance = Euclidean, method = centroid) and that have been manually identified and filtered for peak quality (isotopes and fragments weres also filtered out). (B) Shown are the lipids with significant differences (student’s t-test corrected for multiple testing) between pre- and post-treatment in the controlled human malaria infections (CHMI) for either infection route (blood or sporozoite infection). Plotted is the fold-change post-treatment vs pre-treatment. On the left is indicated whether the lipid is significantly increased (red) or decreased (blue) in either route of infection. (C) Linear regression between the lipids from A and ap2-g or Pfsir2a transcription levels. Plotted is the coefficient and 95% CI. Blue indicates statistically significant negative correlations, while red indicates statically significant positive correlations (FDR <0.05). (D) Distribution of ap2-g transcript levels (left) and LysoPC (16:0) intensity (right) across patients and stratified by transmission period. Data are corrected for age and PfHRP2. (E) Correlation between LPC (16:0) (top) and ap2-g (top), or Pfsir2a (bottom) transcription (Spearman’s correlations corrected for multiple testing). (F) Correlations between identified LPCs and ap2-g transcription by transmission period (Spearman’s correlations corrected for multiple testing). Note that the predecline period is not plotted separately in panels C-E due to insufficient sample numbers for the statistical analysis. Number of patients: predecline: n=22, decline: n=53, postdecline: n=160.
Figure 4—figure supplement 1
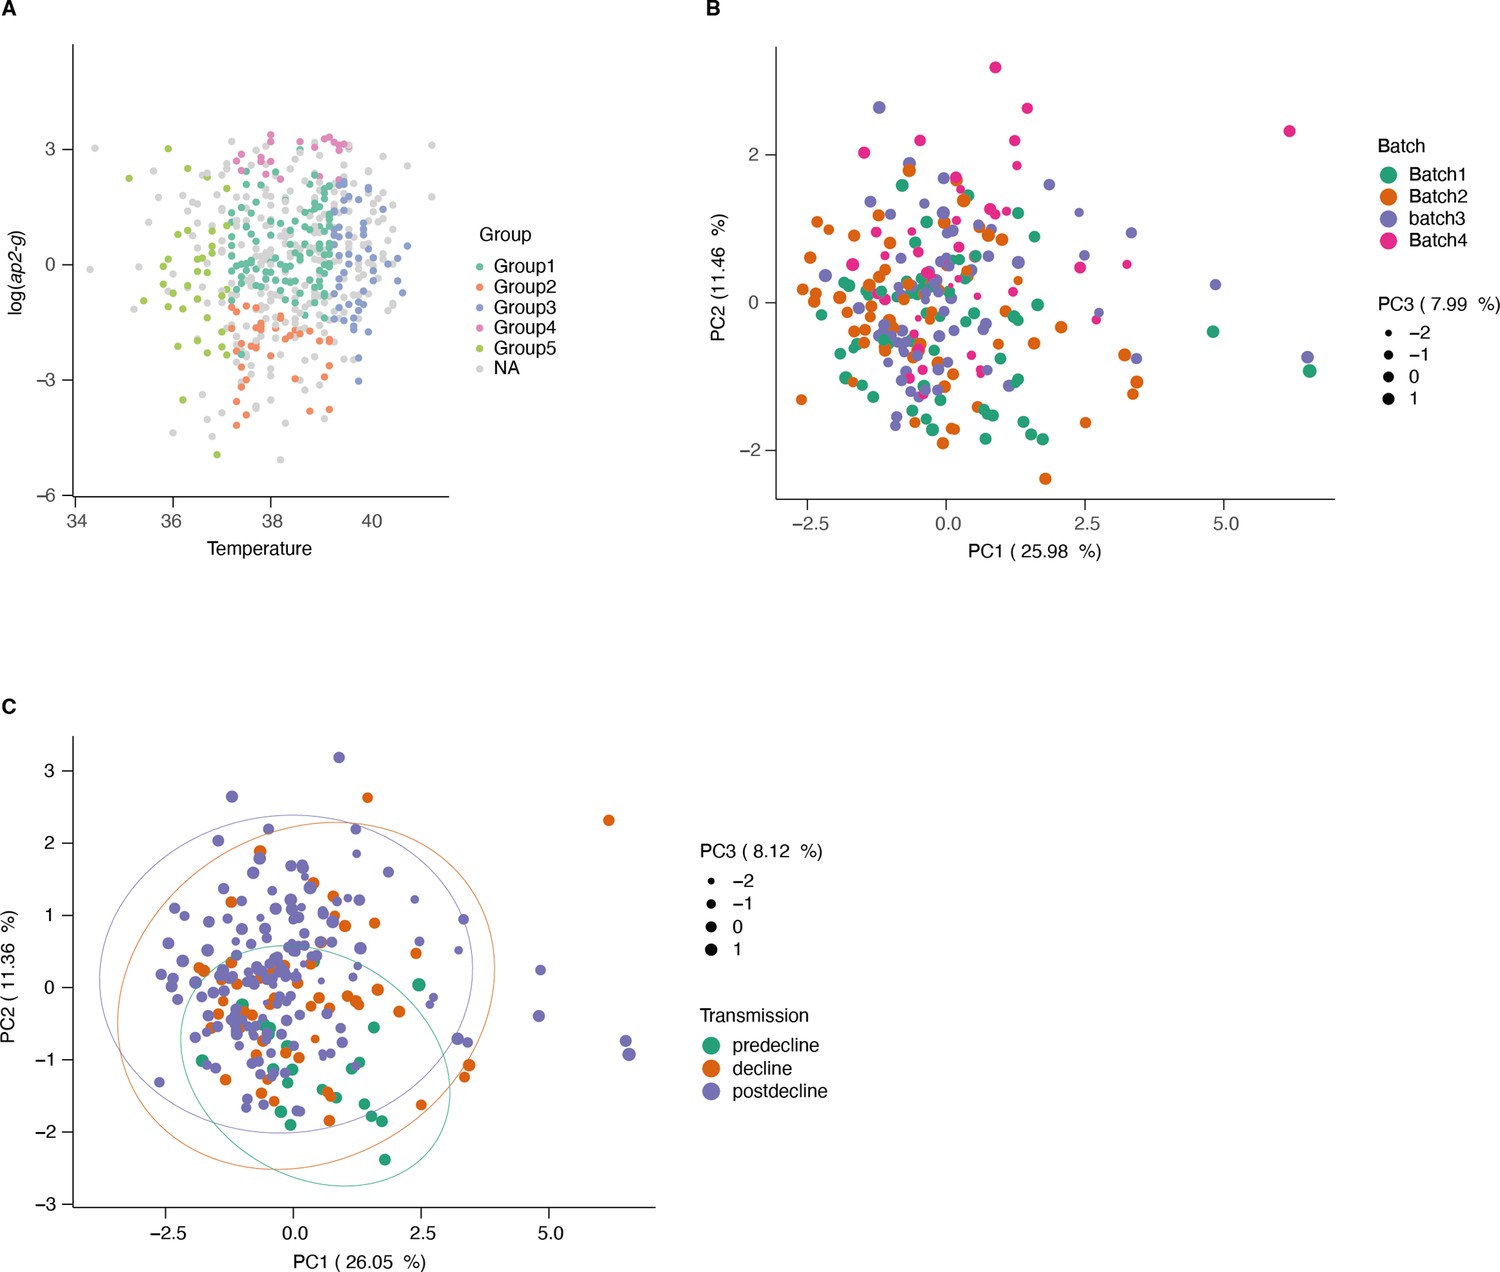
Sample subsetting and batch correction for lipidomics data.
(A) Patient temperature, ap2-g transcription level, and disease type were used to subset samples for metabolomics. This resulted in five groups from severe disease categories and matching mild cases (outpatients, in gray). (B) PCA of the lipidomics data colored by batch number (post batch correction). (C) PCA of the lipidomics data colored by transmission period.
Figure 4—figure supplement 2

Controlled human malaria infections (CHMI) data.
(A) ap2-g transcription was measured on day 1 of treatment (T1) and stratified by type of infection. (B–E) Average (and standard deviation) cytokine levels during the experiment per infection type. Shown are those markers shared with the luminex analysis of the Kilifi cohort. (F) Average normalized lipid levels are significantly different pre and post-treatment (sp = sporozoite infection, bs = blood stage infection). (C=days post-infection, T=days post-treatment). On the left is indicated whether the lipid is significantly increased (red) or decreased (blue) in either type of infection. Number of patients: blood stage: n=11, sporozoite: n=6.
Figure 5
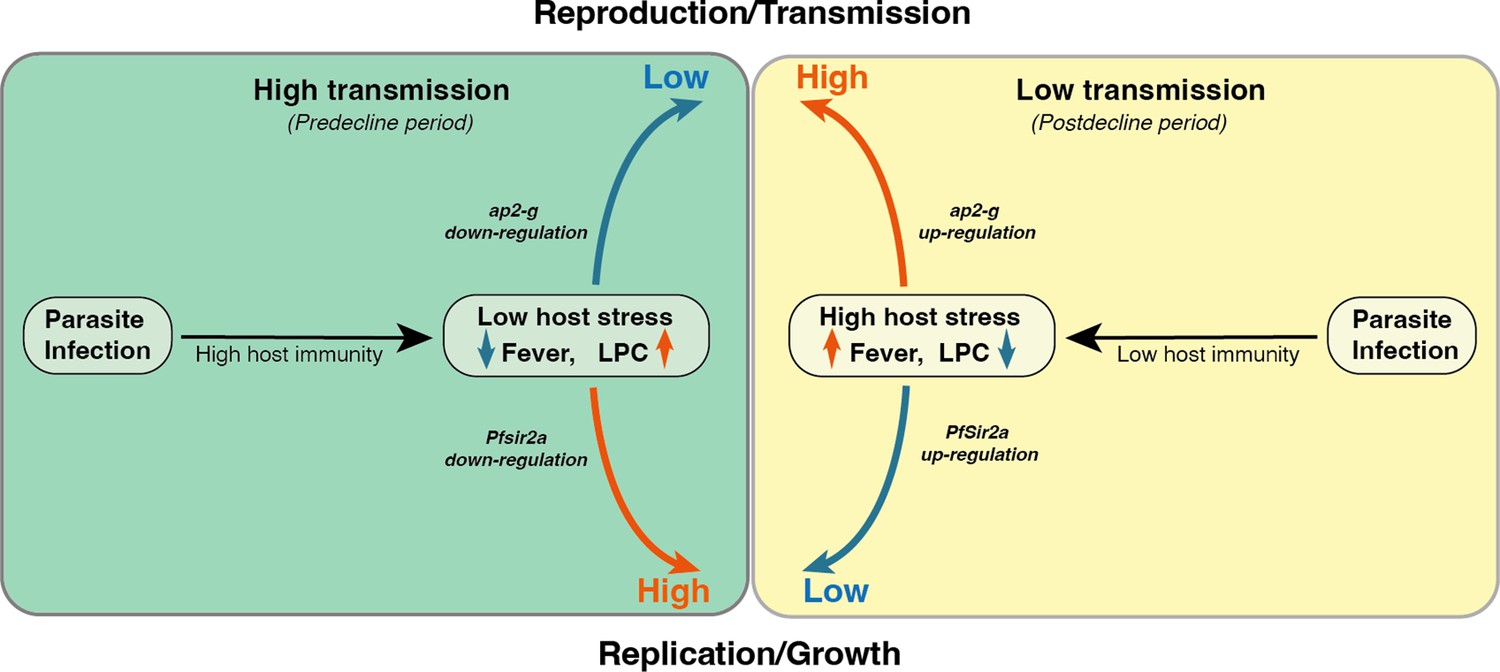
Proposed model on a within-host adaptation of the parasite to changing environments.
The model is based on the interaction between the different host and parasite parameters described in this study. It proposes that declining transmission reduces host immunity, resulting in an inflammatory response associated with increased host stressors (including reduced Lysophosphatidylcholine (LPC) availability, and fever) and susceptibility to clinical symptoms/damage. The altered host response modifies the parasite response during infection, resulting in increased investment in transmission (as indicated by the elevated ap2-g levels) and reduced replication (as indicated by elevated Pfsir2a levels and reduced parasite burden/Plasmodium falciparum histidine-rich protein 2 (PfHRP2) levels).
Additional files
-
Supplementary file 1
Associations between parasite parameters ap2-g, Pfsir2-a and PfHRP2, and clinical parameters.
- https://cdn.elifesciences.org/articles/85140/elife-85140-supp1-v2.xlsx
-
Supplementary file 2
Associations between parasite parameters ap2-g, Pfsir2-a and PfHRP2, host luminex markers, and lipidomics data.
- https://cdn.elifesciences.org/articles/85140/elife-85140-supp2-v2.xlsx
-
Supplementary file 3
Structural equation model (SEM).
The model assumes that pre-existing host immunity affects the interaction between the host (i.e. altered within the host environment including inflammatory response. fever, nutritional resource availability) and parasite (i.e. altered investment in reproduction vs replication). Significant p-values are highlighted in bold and negative and positive estimates of associations are highlighted in blue and red, respectively.
- https://cdn.elifesciences.org/articles/85140/elife-85140-supp3-v2.xlsx
-
MDAR checklist
- https://cdn.elifesciences.org/articles/85140/elife-85140-mdarchecklist1-v2.docx
Download links
A two-part list of links to download the article, or parts of the article, in various formats.
Downloads (link to download the article as PDF)
Open citations (links to open the citations from this article in various online reference manager services)
Cite this article (links to download the citations from this article in formats compatible with various reference manager tools)
Plasmodium falciparum adapts its investment into replication versus transmission according to the host environment
eLife 12:e85140.
https://doi.org/10.7554/eLife.85140


