Functional and microstructural plasticity following social and interoceptive mental training
- Otto Hahn Group Cognitive Neurogenetics, Max Planck Institute for Human Cognitive and Brain Sciences, Germany
- INM-7, FZ Jülich, Germany
- Clinical Psychology and Behavioral Neuroscience, Faculty of Psychology, Technische Universität Dresden, Germany
- Max Planck Institute for Human Cognitive and Brain Sciences, Germany
- Multimodal Imaging and Connectome Analysis Lab, McConnell Brain Imaging Centre, Montreal Neurological Institute and Hospital, McGill University, Canada
- Department of Data Science, Inha University, Republic of Korea
- Center for Neuroscience Imaging Research, Institute for Basic Science, Republic of Korea
- Center for the Developing Brain, Child Mind Institute, United States
- Department of Biomedical Engineering, Sungkyunkwan University, Republic of Korea
- Department of Psychology, Wurzburg University, Germany
- Department of Psychosomatic Medicine and Psychotherapy, Medical Center – University of Freiburg, Faculty of Medicine, University of Freiburg, Germany
- Social Neuroscience Lab, Max Planck Society, Germany
Figures
Figure 1
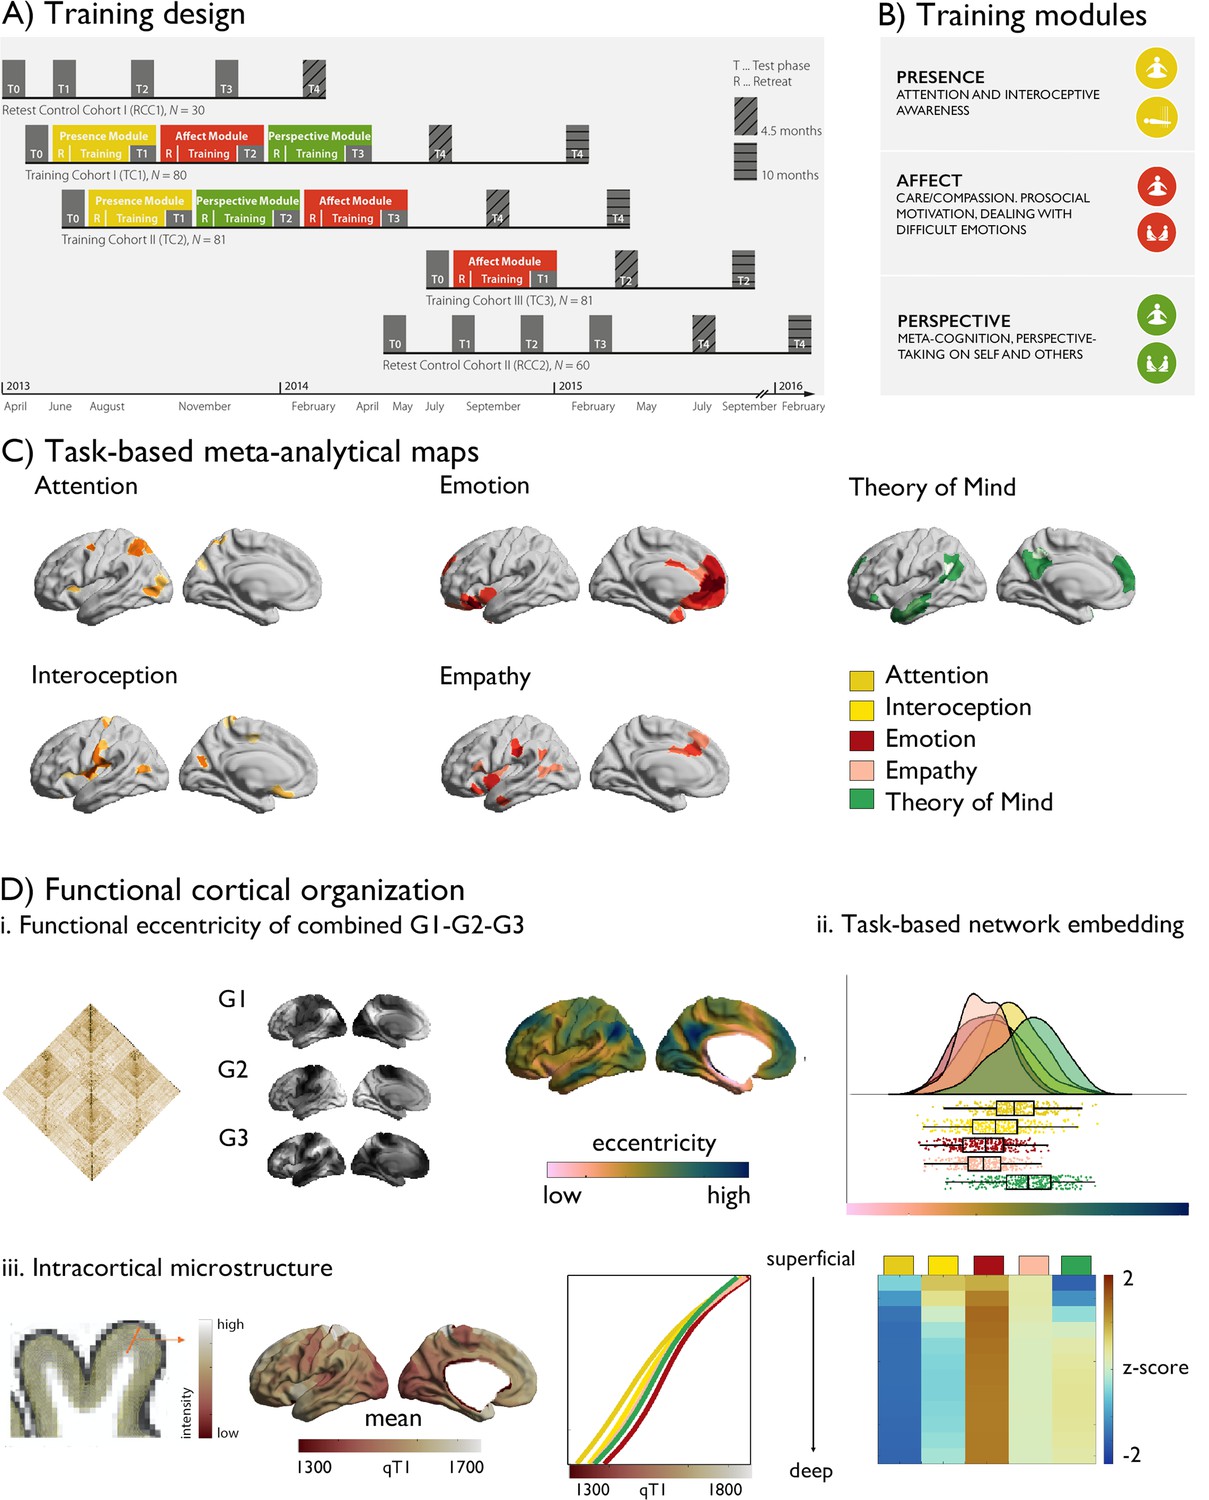
Study design.
(A) Training design of the ReSource study; (B) Training modules; (C) Task-based meta-analytical maps, and a legend of the color-coding of the maps; (D) Functional cortical organization: i. functional connectivity matrix, gradient 1–3, eccentricity metric; ii. task-based network embedding; iii. intracortical microstructure, mean qT1 values as a function of task-based meta-analytical maps and cortical depth and relative values (z-scored per depth-compartment).
Figure 2 with 4 supplements
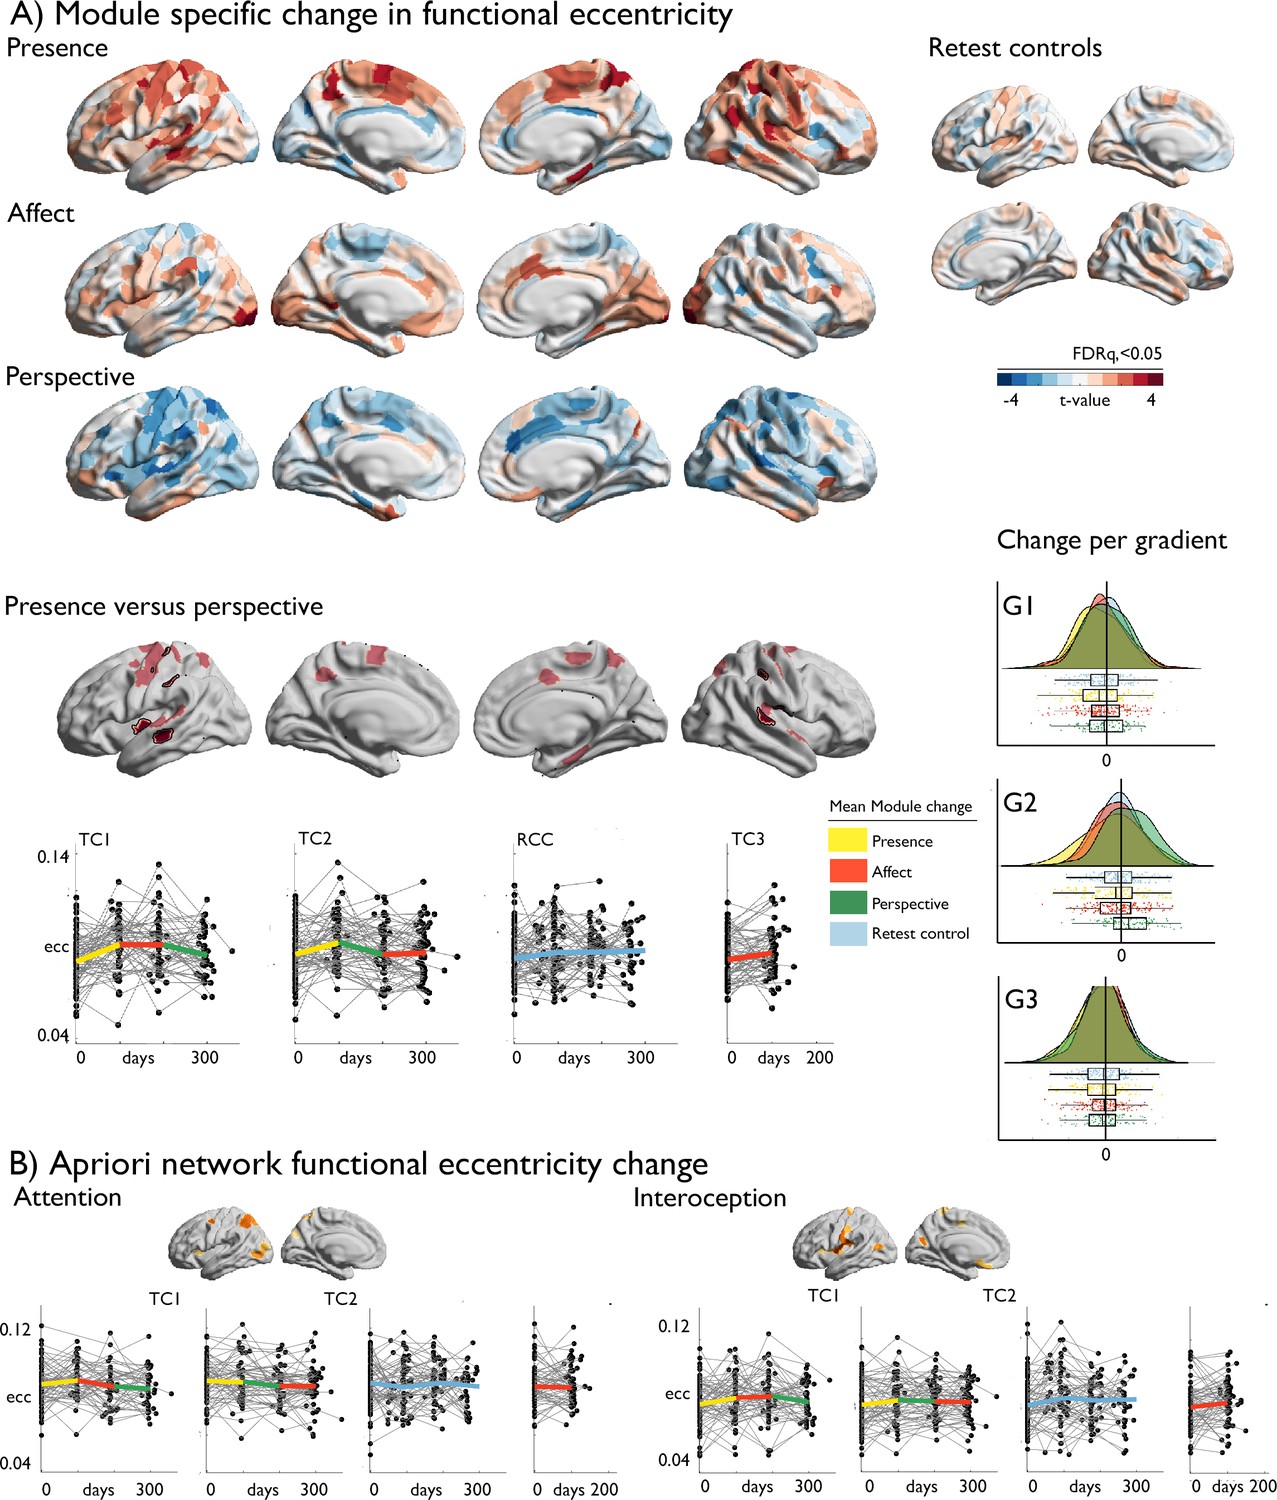
Training-induced changes in cortical functional organization.
(A) upper: T-maps of TM-specific changes in functional eccentricity; lower: TM-specific change in functional eccentricity, p<0.01, FDRq <0.05 outlined in black, below: alterations of eccentricity in the FDRq <0.05 regions, right: mean changes in FDRq <0.05 eccentricity regions as a function of G1-G2-G3; (B) A-priori network functional eccentricity change in networks that showed TM-specific change.
Figure 2—figure supplement 1

TM-specific change in functional eccentricity as a function of training cohort and a-priori network.
X-axes depict days of training, y-axes change in functional eccentricity, colors reflect the TM (yellow = Presence; red = Affect; green = Perspective).
Figure 2—figure supplement 2

TM-specific change in functional Gradient 1.
Trends at p<0.01, FDRq <0.05 outlined in black.
Figure 2—figure supplement 3

TM-specific change in functional Gradient 2.
Trends at p<0.01, FDRq <0.05 outlined in black.
Figure 2—figure supplement 4

TM-specific change in functional Gradient 3.
Trends at p<0.01, FDRq <0.05 outlined in black.
Figure 3 with 2 supplements
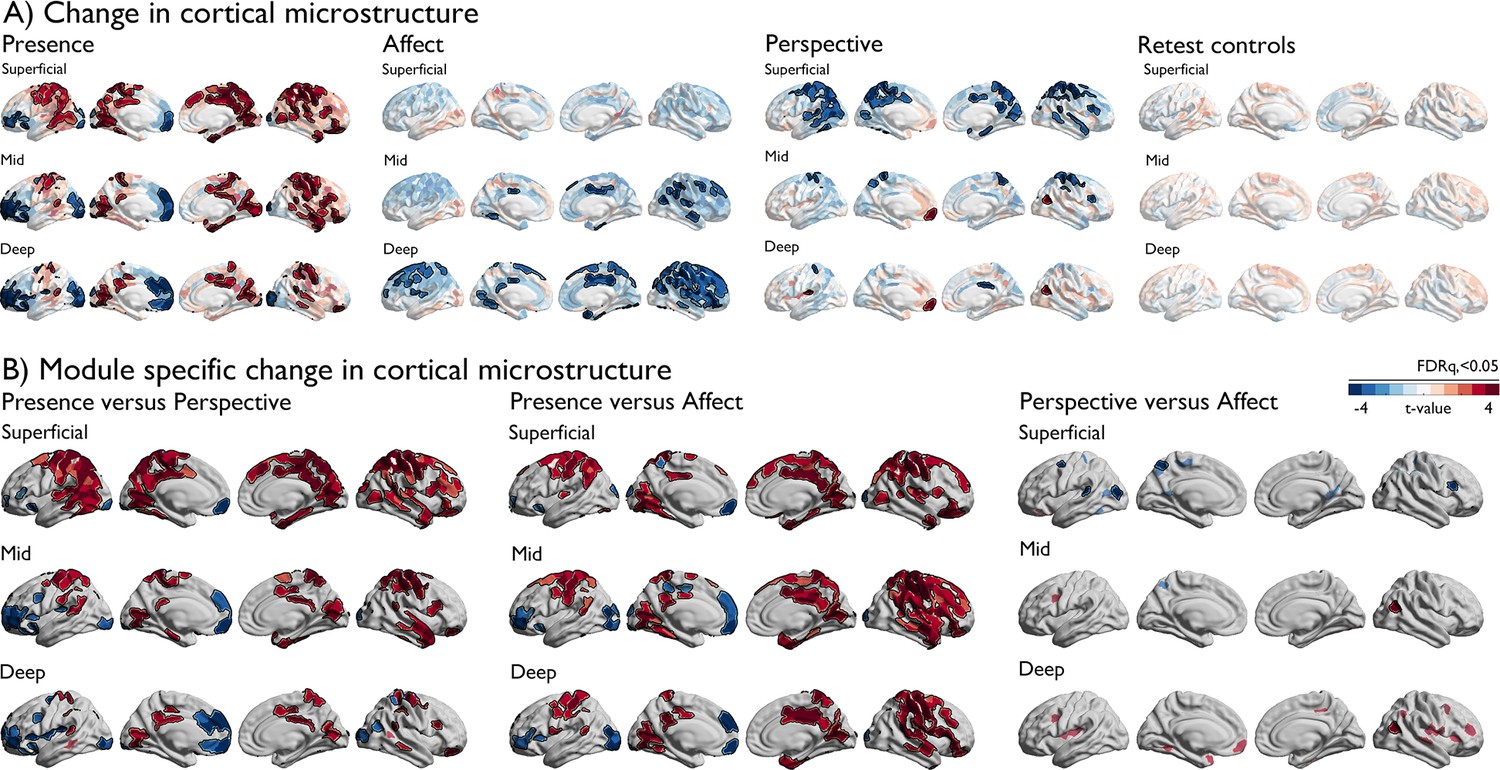
Changes in depth-varying microstructure as a function of TM.
(A). Change in cortical microstructure, per TM, red indicates positive change in qT1, blue negative change. FDRq <0.05 findings are outlined in black on top of t-values per parcel; (B) TM specific change in cortical microstructure. Red indicates positive change in qT1, blue negative change. FDRq <0.05 findings are outlined in black in combination with semi-transparent trends (p<0.01).
Figure 3—figure supplement 1
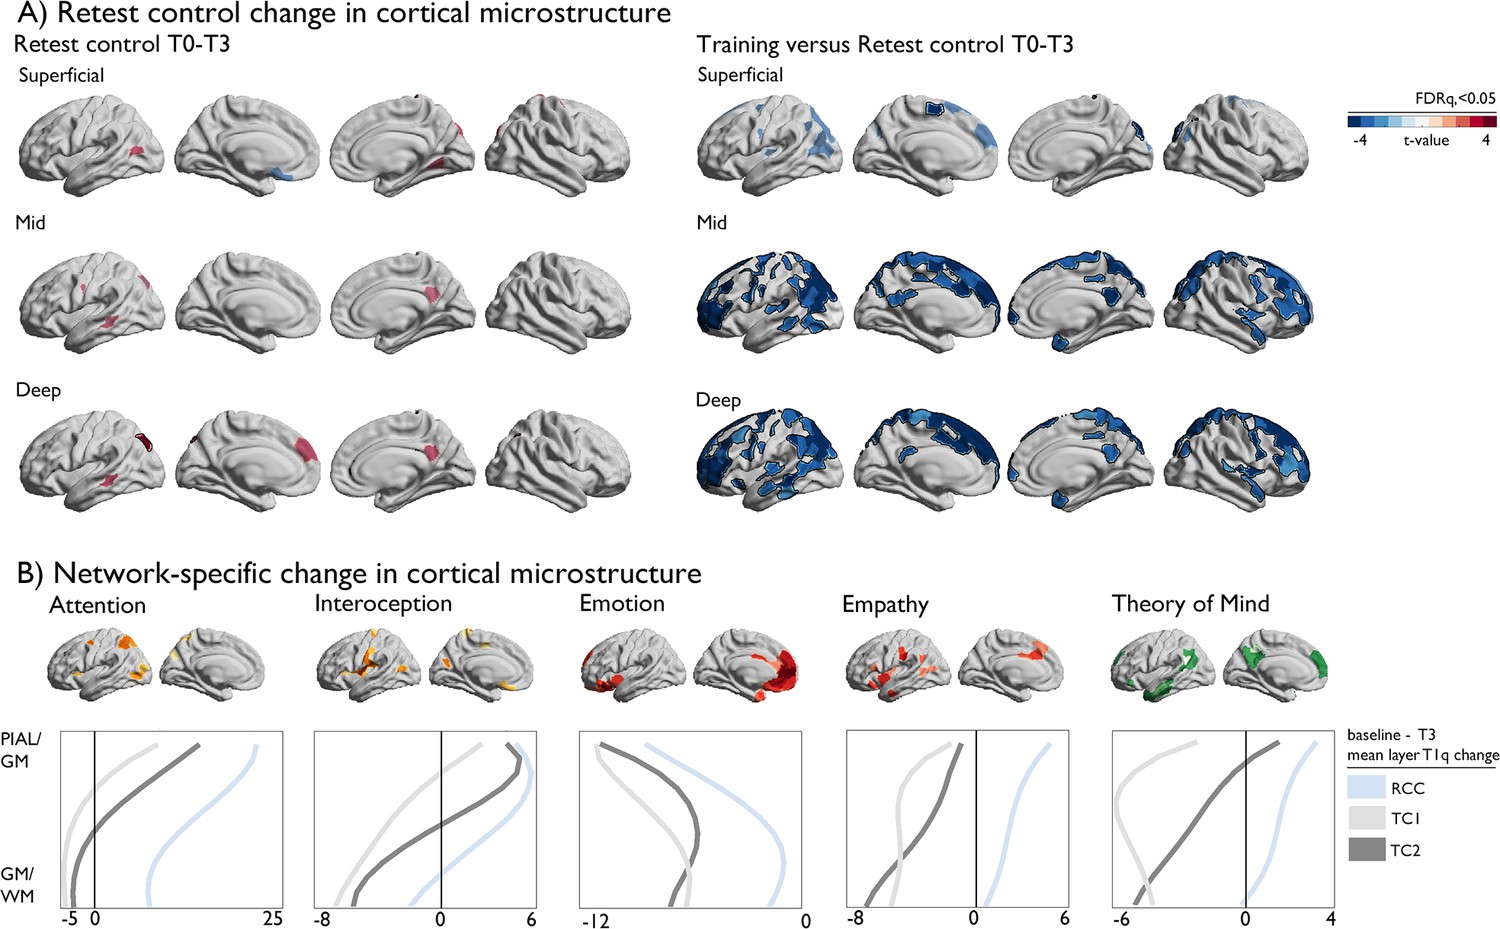
Training-specific change in qT1 from baseline to T3 as a function superficial (1:4) mid (5:8) and deep (8:12) depth compartment.
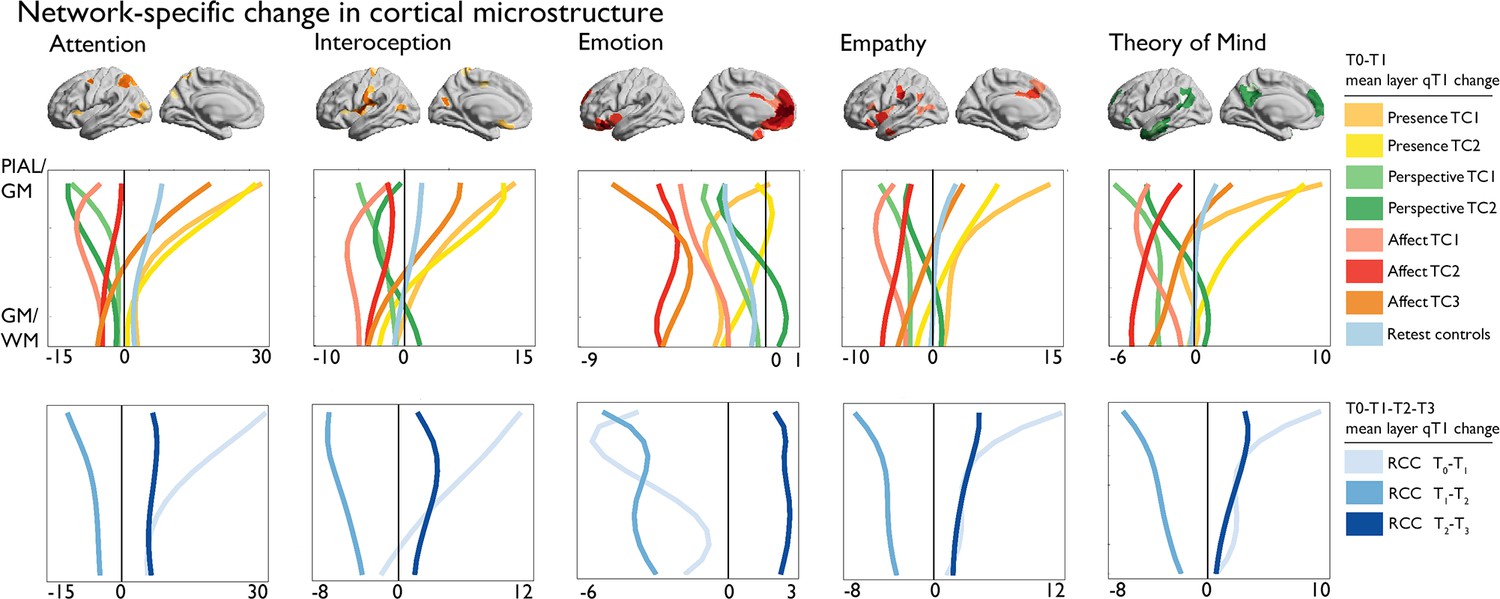
(A). Left: Change in retest controls, right: Change in training versus retest controls, trends at p<0.01, FDRq <0.05 outlined in black. (B) Network-specific change in qT1 as a function of training cohort.
Figure 3—figure supplement 2

Cohort-specific change in qT1 from baseline to T1 as a function superficial (1:4) mid (5:8) and deep (8:12) depth compartment.
(A). First row: Left: Change in Presence TC1 vs retest controls, middle: change in Presence TC1 versus Affect TC3, right: Change in Affect TC3 versus retest controls; second row: Left: Change in Presence TC2 vs retest controls, right: change in Presence TC2 versus Affect TC3, trends at p<0.01, FDRq <0.05 outlined in black; (B) Network-specific change in qT1 as a function of training cohort in T0-T1.
Figure 4 with 2 supplements
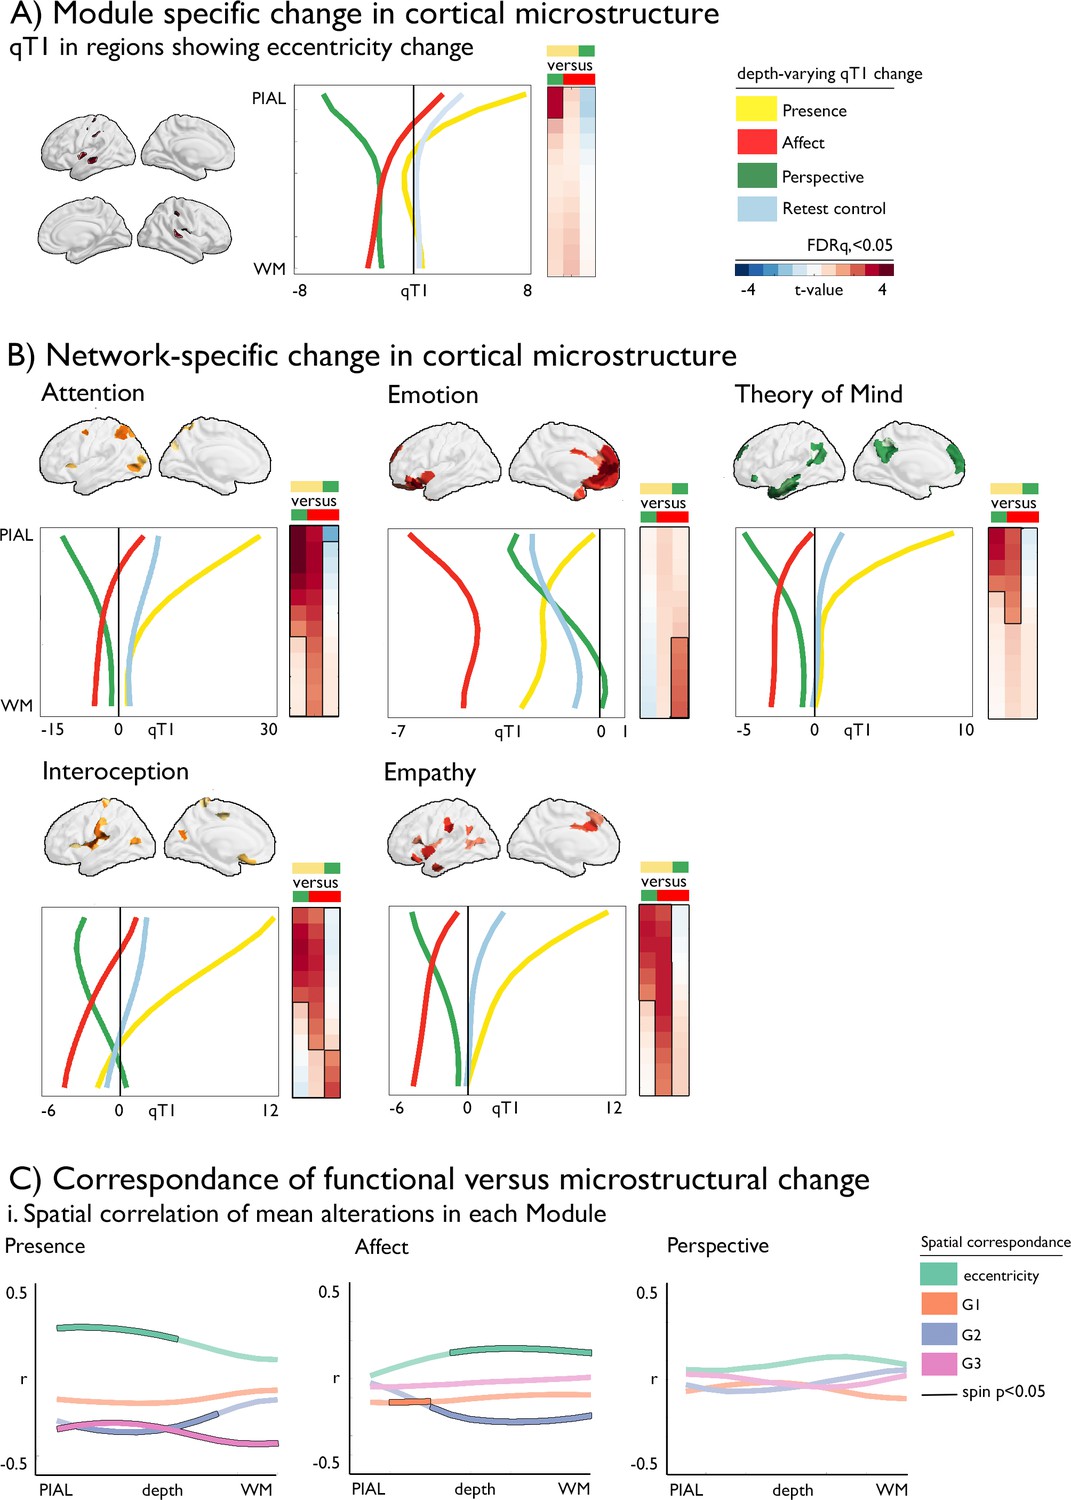
Dissociable microstructural alterations following mental training.
(A).TM-specific changes in cortical microstructure; qT1 in regions showing eccentricity change (y-axis: depth, x-axis: qT1 change); (B) Network-specific change in cortical microstructure as a function of depth, mean change per TM, pFDR <0.05 have black outline (y-axis: depth, x-axis: qT1 change). The boxes on the right of each plot display the statistics (t-values) of the respective difference between TM, with the contrast color coded as upper minus lower TM (defined by color); (C) Correspondence of functional versus microstructural change; i. Spatial correlation of mean alterations in each TM, black outline indicates pspin <0.05, as a function of cortical depth.
Figure 4—figure supplement 1
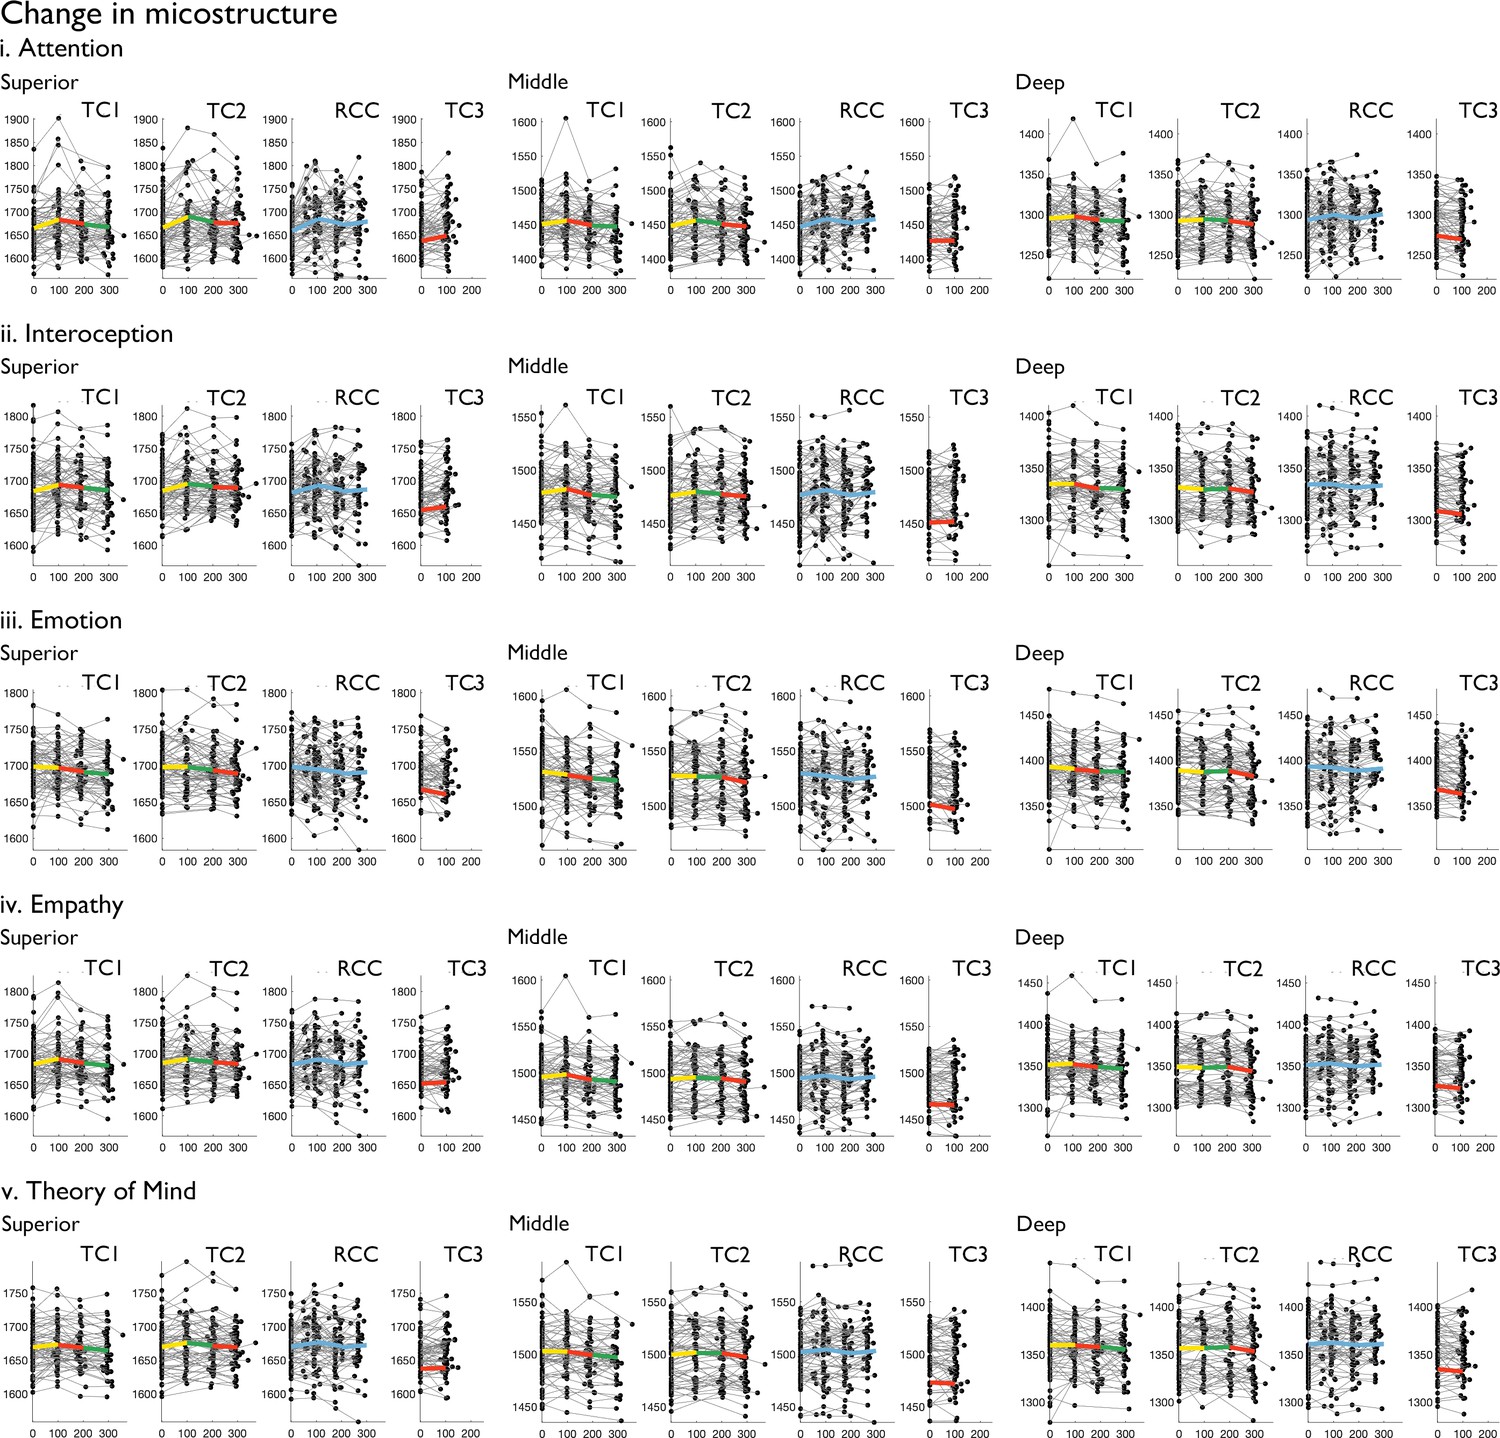
TM-specific change in superficial (1:4) mid (5:8) and deep (8:12) depth compartment microstructure as a function of training cohort and a-priori network.
Yellow = Presence, Red = Affect, Green = Perspective, Blue = Retest Control. Changes are displayed as a function of days past baseline (MRI measurement points).
Figure 4—figure supplement 2
TM-specific change in qT1 as a function superficial (1:4) mid (5:8) and deep (8:12) depth compartment.
Network specific changes in microstructure as a function of depth per training cohort/retest control cohort, and time point.
Figure 5
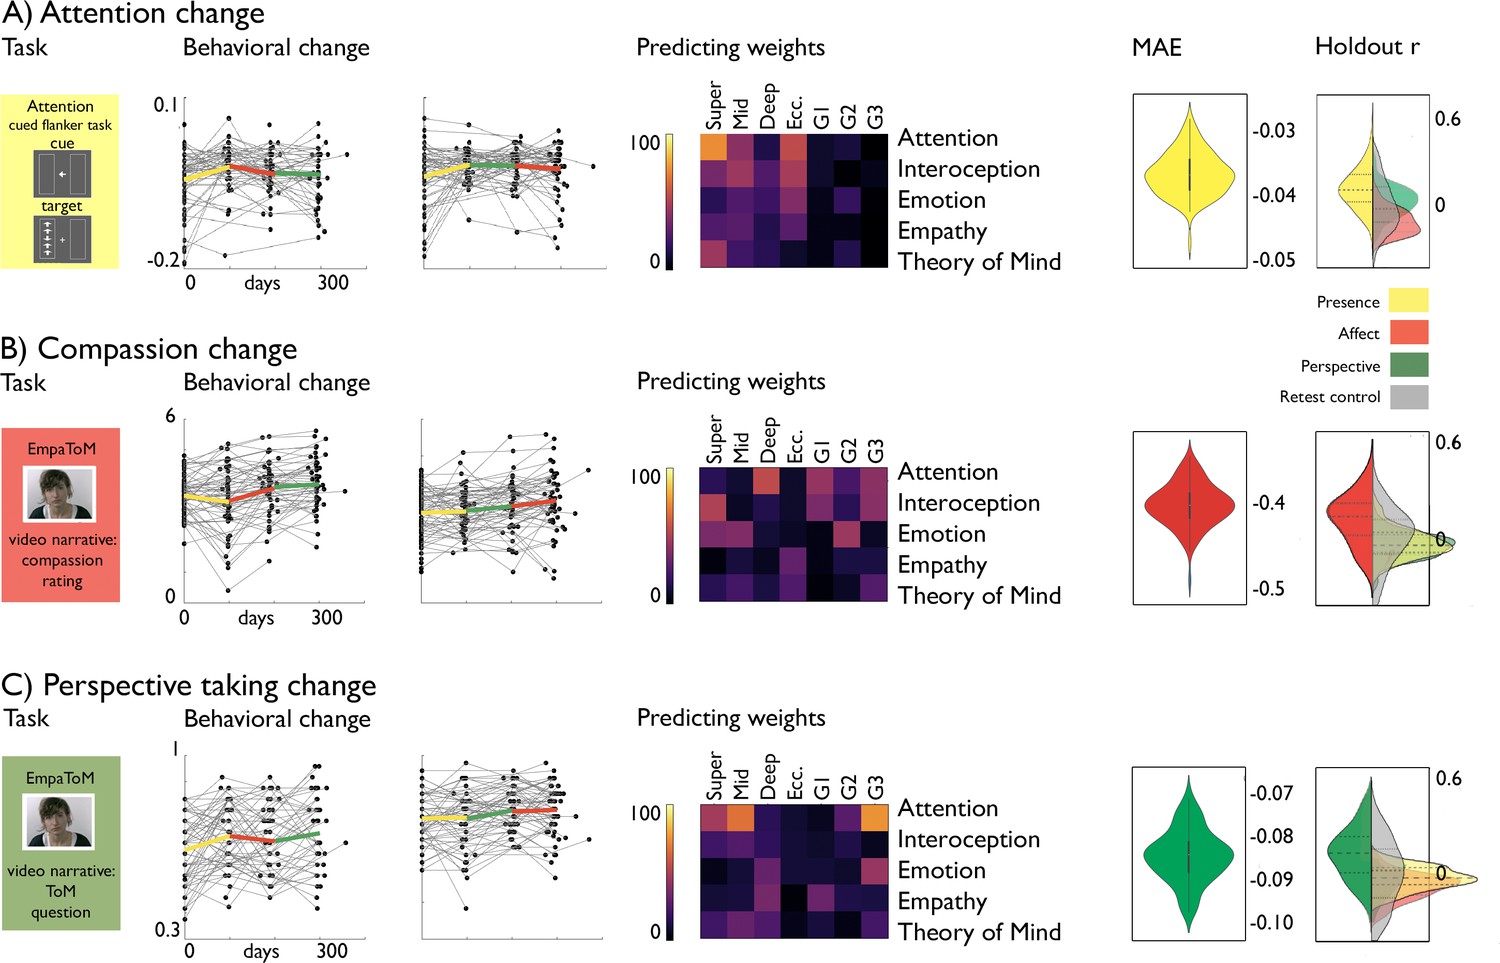
Behavioral change prediction.
(A).Attention change; from left to right: attention task, behavioral change, predicting weights, nMAE and holdout r distribution; (B). Compassion change; from left to right: compassion task, behavioral change, predicting weights, nMAE and holdout r distribution; (C). Perspective-taking change; from left to right: perspective-taking task, behavioral change, predicting weights, nMAE and holdout r distribution (left side; within TM, right side; other TM (yellow: Presence; red: Affect; Green: Perspective) or RCC (grey)).
Tables
Table 1
Participant inclusion in resting-state analysis and quantitative T1 analysis.
| Recruited (N, mean age, % female) | T0 (N) | T1 (N) | T2 (N) | T3 (N) |
|---|---|---|---|---|
| Total (N=332) TC1 (N=80; 41.3; 58.8) TC2 (N=81; 41.2; 59.3) RCC (N=90; 40.0; 58.9) TC3 (N=81; 40.4; 60.5) | 268 69 67 65 67 | 259 65 59 68 67 | 182 57 61 64 | 184 55 64 65 |
Table 2
Reason for missing data across the study duration.
MR incidental findings are based on T0 radiological evaluations; participants who did not survive MRI quality control refers to movement and/or artefacts in the T1-weighted MRI; dropout details can be found in Singer et al., 2016; no MRT: due to illness / scheduling issues / discomfort in scanner; other: non-disclosed; functional MRI missing: no complete functional MRI; functional MRI quality:>0.3 mm movement (low quality in volume +surface).
| Reason for dropout(TC1, TC2, RCC) | T0 | T1 | T2 | T3 |
|---|---|---|---|---|
| Structural MR incidental finding Structural MRI quality control Dropout Medical reasons Other Functional MRI missing/QC qT1 missing | 5 7 2 1 4 18 13 | (5 based on T0) 6 7 (2 based on T0) 7 (1 based on T0) 10 14 7 | (5 based on T0) 4 7 (9 based on T01) 7 (8 based on T01) 7 16 6 | (5 based on T0) 2 7 (16 based on T012) (15 based on T012) 7 8 7 |
Table 3
Reason for missing data across the study duration.
MR incidental findings are based on T0 radiological evaluations; participants who did not survive MRI quality control refers to movement and/or artefacts in the T1-weighted MRI; dropout details can be found in Singer et al., 2016; no MRT: due to illness / scheduling issues / discomfort in scanner; other: non-disclosed.
| Reason for dropout (TC3) | T0 | T1 |
|---|---|---|
| MR incidental finding MRI quality control Dropout Medical reasons Other Functional MRI missing/QC qT1 missing | 3 0 0 1 5 1 4 | (3 based on T0) 0 3 2 3 3 0 |
Table 4
TM-specific changes in eccentricity per a priori networks.
| Presence (n=109) vs Perspective (n=96) | Presence (n=109) vs Affect (n=104) | Perspective (n=96)vs Affect (n=104) | |
|---|---|---|---|
| Attention | t=2.842, p=0.005*, d=0.247 | t=1.458, p>0.05, d=0.127 | t=−1.692, p>0.05, d=−0.147 |
| Interoception | t=2.765, p=0.006*, d=0.240 | t=1.043, p>0.05, d=0.091 | t=−2.008, p=0.045, d=−0.174 |
| Emotion | t=0.387, p>0.05, d=0.035 | t=−0.135, p>0.05, d=−0.011 | t=−0.552, p>0.05, d=−0.048 |
| Empathy | t=2.218, p=0.027, d=193 | t=0.879, p>0.05, d=0.076 | t=−1.569, p>0.05, d=−0.136 |
| Theory of Mind | t=1.721, p>0.05, d=0.149 | t=1.324, p>0.05, d=0.115 | t=−0.601, p>0.05, d=−0.052 |
-
*
signifies FDR corrected differences.
Author response table 1
Eccentricity and non-overlapping networks (Figure 2).
| Presence-Perspective | Presence-Affect | Perspective-Affect | ||||
|---|---|---|---|---|---|---|
| attention | 2,776 | p=0,006 | 1,451 | p=0,147 | -1,624 | p=0,105 |
| interoception | 2,637 | p=0,009 | 1,279 | p=0,201 | -1,641 | p=0,101 |
| emotion | 0,034 | p=0,973 | -0,353 | p=0,724 | -0,377 | p=0,706 |
| empathy | 1,700 | p=0,090 | 0,510 | p=0,610 | -1,360 | p=0,174 |
| ToM | 1,901 | p=0,058 | 1,172 | p=0,242 | -0,943 | p=0,346 |
Author response table 2
Microstructure and non-overlapping networks as a function of cortical depth in qT1 (Figure 4).
| Presence-Perspective | |||||||||
|---|---|---|---|---|---|---|---|---|---|
| attention | interoception | emotion | empathy | ToM | |||||
| t-value | p-value | t-value p-value | t-value | p-value | t-value | p-value | t-value | p-value | |
| 5,680 | 0,000 | 3,673 | 0,000 | -0,763 | 0,446 | 3,737 | 0,000 | 4,995 | 0,000 |
| 5,593 | 0,000 | 4,454 | 0,000 | -0,824 | 0,410 | 3,892 | 0,000 | 4,753 | 0,000 |
| 5,185 | 0,000 | 4,743 | 0,000 | -0,985 | 0,325 | 3,826 | 0,000 | 4,086 | 0,000 |
| 4,565 | 0,000 | 4,582 | 0,000 | -1,211 | 0,226 | 3,601 | 0,000 | 3,171 | 0,002 |
| 3,845 | 0,000 | 4,135 | 0,000 | -1,444 | 0,149 | 3,306 | 0,001 | 2,331 | 0,020 |
| 3,119 | 0,002 | 3,509 | 0,000 | -1,605 | 0,109 | 3,020 | 0,003 | 1,741 | 0,082 |
| 2,436 | 0,015 | 2,770 | 0,006 | -1,656 | 0,098 | 2,690 | 0,007 | 1,440 | 0,150 |
| 1,852 | 0,065 | 1,920 | 0,055 | -1,658 | 0,098 | 2,320 | 0,021 | 1,321 | 0,187 |
| 1,434 | 0,152 | 1,038 | 0,300 | -1,696 | 0,090 | 1,952 | 0,051 | 1,268 | 0,205 |
| 1,215 | 0,225 | 0,224 | 0,823 | -1,796 | 0,073 | 1,683 | 0,093 | 1,245 | 0,214 |
| 1,161 | 0,246 | -0,446 | 0,656 | -1,899 | 0,058 | 1,560 | 0,119 | 1,234 | 0,218 |
| 1,216 | 0,225 | -0,949 | 0,343 | -2,018 | 0,044 | 1,546 | 0,123 | 1,214 | 0,225 |
| Presence-Affect | |||||||||
| 3,868 | 0,000 | 2,685 | 0,007 | 0,913 | 0,362 | 3,055 | 0,002 | 3,133 | 0,002 |
| 4,103 | 0,000 | 3,179 | 0,002 | 0,960 | 0,338 | 3,257 | 0,001 | 3,036 | 0,003 |
| 4,091 | 0,000 | 3,420 | 0,001 | 0,915 | 0,360 | 3,361 | 0,001 | 2,820 | 0,005 |
| 3,911 | 0,000 | 3,447 | 0,001 | 0,828 | 0,408 | 3,403 | 0,001 | 2,560 | 0,011 |
| 3,656 | 0,000 | 3,313 | 0,001 | 0,809 | 0,419 | 3,432 | 0,001 | 2,395 | 0,017 |
| 3,386 | 0,001 | 3,090 | 0,002 | 0,892 | 0,373 | 3,506 | 0,000 | 2,372 | 0,018 |
| 3,118 | 0,002 | 2,847 | 0,005 | 1,041 | 0,298 | 3,588 | 0,000 | 2,418 | 0,016 |
| 2,867 | 0,004 | 2,618 | 0,009 | 1,201 | 0,230 | 3,552 | 0,000 | 2,434 | 0,015 |
| 2,663 | 0,008 | 2,404 | 0,017 | 1,268 | 0,205 | 3,363 | 0,001 | 2,381 | 0,018 |
| 2,552 | 0,011 | 2,181 | 0,030 | 1,251 | 0,211 | 3,131 | 0,002 | 2,295 | 0,022 |
| 2,526 | 0,012 | 2,017 | 0,044 | 1,169 | 0,243 | 2,957 | 0,003 | 2,212 | 0,027 |
| 2,555 | 0,011 | 1,887 | 0,060 | 0,992 | 0,322 | 2,876 | 0,004 | 2,176 | 0,030 |
| Perspective-Affect | |||||||||
| -2,447 | 0,015 | -1,406 | 0,160 | 1,709 | 0,088 | -1,124 | 0,262 | -2,418 | 0,016 |
| -2,127 | 0,034 | -1,778 | 0,076 | 1,821 | 0,069 | -1,101 | 0,271 | -2,249 | 0,025 |
| -1,697 | 0,090 | -1,858 | 0,064 | 1,953 | 0,051 | -0,932 | 0,352 | -1,733 | 0,084 |
| -1,196 | 0,232 | -1,658 | 0,098 | 2,115 | 0,035 | -0,648 | 0,517 | -0,989 | 0,323 |
| -0,660 | 0,509 | -1,301 | 0,194 | 2,350 | 0,019 | -0,299 | 0,765 | -0,233 | 0,816 |
| -0,132 | 0,895 | -0,837 | 0,403 | 2,606 | 0,009 | 0,084 | 0,933 | 0,386 | 0,699 |
| 0,352 | 0,725 | -0,270 | 0,787 | 2,805 | 0,005 | 0,524 | 0,600 | 0,759 | 0,448 |
| 0,744 | 0,457 | 0,432 | 0,666 | 2,957 | 0,003 | 0,894 | 0,372 | 0,904 | 0,367 |
| 1,002 | 0,317 | 1,182 | 0,238 | 3,062 | 0,002 | 1,111 | 0,267 | 0,910 | 0,363 |
| 1,133 | 0,258 | 1,854 | 0,064 | 3,153 | 0,002 | 1,182 | 0,238 | 0,852 | 0,394 |
| 1,166 | 0,244 | 2,426 | 0,016 | 3,186 | 0,002 | 1,148 | 0,252 | 0,784 | 0,433 |
| 1,134 | 0,257 | 2,849 | 0,005 | 3,146 | 0,002 | 1,085 | 0,278 | 0,772 | 0,441 |
Additional files
-
Supplementary file 1
Complete summary of supplementary tables and analysis.
(a). Descriptive statistics Presence (b). Descriptive statistics Affect (c). Descriptive statistics Affect, excluding active controls (TC3) (d). Descriptive statistics Perspective (e). Descriptive statistics Retest controls. (f). Functional eccentricity changes GSR controlled per a-priori network. T-values and p-values below P<0.05, * indicates FDRp <0.05. (g). Functional eccentricity changes in training cohort 1 per a-priori network. T-values and p-values below P<0.05, * indicates FDRp <0.05. (h). Functional eccentricity changes in training cohort 2 per a-priori network. T-values and p-values below P<0.05, * indicates FDRp <0.05. (i). Functional eccentricity changes per a-priori network baseline to T1. T-values and p-values below P<0.05, * indicates FDRp <0.05. (j). Functional eccentricity changes per a-priori network T1 to T3. T-values and p-values below P<0.05, * indicates FDRp <0.05. (k). G1-G3 change per a-priori network Presence vs Perspective. T-values and p-values below P<0.05, * indicates FDRp <0.05. (l). G1-G3 change per a-priori network Presence vs Affect. T-values and p-values below P<0.05, * indicates FDRp <0.05. (m). G1-G3 change per a-priori network Perspective vs Affect. T-values and p-values below P<0.05, * indicates FDRp <0.05. (n). Functional eccentricity changes per a-priori network controlling for cortical thickness change. T-values and p-values below P<0.05, * indicates FDRp <0.05. (o). Functional eccentricity changes per a-priori network from baseline to T3. T-values and p-values below P<0.05, * indicates FDRp <0.05. (p). Depth-dependent qT1 change per a-priori network Training vs Retest Control. T-values and p-values below P<0.05. * indicates FDRp <0.05.(q). Descriptives of retest-control change (mean change over T0-T1; T1-T2; T2-T3) as a function of depth-dependent qT1. (r). Descriptive of Presence change (mean change over T0-T1) as a function of depth-dependent qT1 (s). Descriptives of Affect change (mean change over T0-T1, T1-T2 and T2-T3) as a function of depth-dependent qT1. (t). Descriptives of Affect change (mean change over T1-T2 and T2-T3) as a function of depth-dependent qT1. (u). Descriptives of Perspective change (mean change over T1-T2 and T2-T3) as a function of depth-dependent qT1. (v). Depth-dependent qT1 change per a-priori network Presence vs Perspective. T-values and p-values below P<0.05, and Cohen’s D effect size, * indicates FDRp <0.05. (w). Depth-dependent qT1 change per a-priori network Presence vs Affect. T-values and p-values below P<0.05, and Cohen’s D effect size, * indicates FDRp <0.05. (x). Depth-dependent qT1 change per a-priori network Perspective vs Affect. T-values and p-values below P<0.05, and Cohen’s D effect size, * indicates FDRp <0.05. (y). Depth-dependent qT1 change per a-priori network Presence vs Perspective in TC1. T-values and p-values below P<0.05. * indicates FDRp <0.05. (z). Depth-dependent qT1 change per a-priori network Presence vs Affect in TC1. T-values and p-values below P<0.05. * indicates FDRp <0.05. (za). Depth-dependent qT1 change per a-priori network Perspective vs Affect in TC1. T-values and p-values below P<0.05. * indicates FDRp <0.05. (zb). Depth-dependent qT1 change per a-priori network Presence vs Perspective in TC2. T-values and p-values below P<0.05. * indicates FDRp <0.05. (zc). Depth-dependent qT1 change per a-priori network Presence vs Affect in TC2. T-values and p-values below P<0.05. * indicates FDRp <0.05. (zd). Depth-dependent qT1 change per a-priori network Perspective vs Affect in TC2. T-values and p-values below P<0.05. * indicates FDRp <0.05. (ze). Depth-dependent qT1 change per a-priori network baseline – T1: TC1 (Presence) versus Retest Control. T-values and p-values below P<0.05. * indicates FDRp <0.05. (zf). Depth-dependent qT1 change per a-priori network baseline – T1: TC2 (Presence) versus Retest Control. T-values and p-values below P<0.05. * indicates FDRp <0.05. (zg). Depth-dependent qT1 change per a-priori network baseline – T1: Affect TC3 vs Retest Control. T-values and p-values below P<0.05. * indicates FDRp <0.05. (zh). Depth-dependent qT1 change per a-priori network baseline – T1: Presence TC1 vs Affect TC3. T-values and p-values below P<0.05. * indicates FDRp <0.05. (zi). Depth-dependent qT1 change per a-priori network baseline – T1: Presence TC2 vs Affect TC3. T-values and p-values below P<0.05. * indicates FDRp <0.05. (zj). Depth-dependent qT1 change per a-priori network T1 – T3: Perspective versus Affect (TC1 +TC2). T-values and p-values below P<0.05. * indicates FDRp <0.05. (zk). Depth-dependent qT1 change per a-priori network T1 – T3: Affect vs Retest Control. * T-values and p-values below P<0.05. * indicates FDRp <0.05. (zl). Depth-dependent qT1 change per a-priori network T1 – T3: Perspective vs Retest Control. T-values and p-values below P<0.05. * indicates FDRp <0.05. (zm). Depth-dependent qT1 change per a-priori network controlling for CTX: Presence versus Perspective. T-values and p-values below P<0.05. * indicates FDRp <0.05.(zn). Depth-dependent qT1 change per a-priori network controlling for CTX: Presence versus Affect. T-values and p-values below P<0.05. * indicates FDRp <0.05. (zo). Depth-dependent qT1 change per a-priori network controlling for CTX: Perspective versus Affect. T-values and p-values below P<0.05. * indicates FDRp <0.05.
- https://cdn.elifesciences.org/articles/85188/elife-85188-supp1-v2.docx
-
MDAR checklist
- https://cdn.elifesciences.org/articles/85188/elife-85188-mdarchecklist1-v2.docx
Download links
A two-part list of links to download the article, or parts of the article, in various formats.
Downloads (link to download the article as PDF)
Open citations (links to open the citations from this article in various online reference manager services)
Cite this article (links to download the citations from this article in formats compatible with various reference manager tools)
Functional and microstructural plasticity following social and interoceptive mental training
eLife 12:e85188.
https://doi.org/10.7554/eLife.85188


