The landscape of m1A modification and its posttranscriptional regulatory functions in primary neurons
- Department of Orthopaedics, Qilu Hospital of Shandong University, Shandong University Centre for Orthopaedics, Advanced Medical Research Institute, Cheeloo College of Medicine, Shandong University, China
- Department of Bioinformatics, School of Basic Medical Sciences, Tianjin Medical University, China
- Department of Orthopaedics, Tianjin Medical University General Hospital, International Science and Technology Cooperation Base of Spinal Cord Injury, Tianjin Key Laboratory of Spine and Spinal Cord, China
- Department of Orthopedics, Hunan Key Laboratory of Tumor Models and Individualized Medicine, The Second Xiangya Hospital, Central South University, China
Figures
Figure 1 with 1 supplement
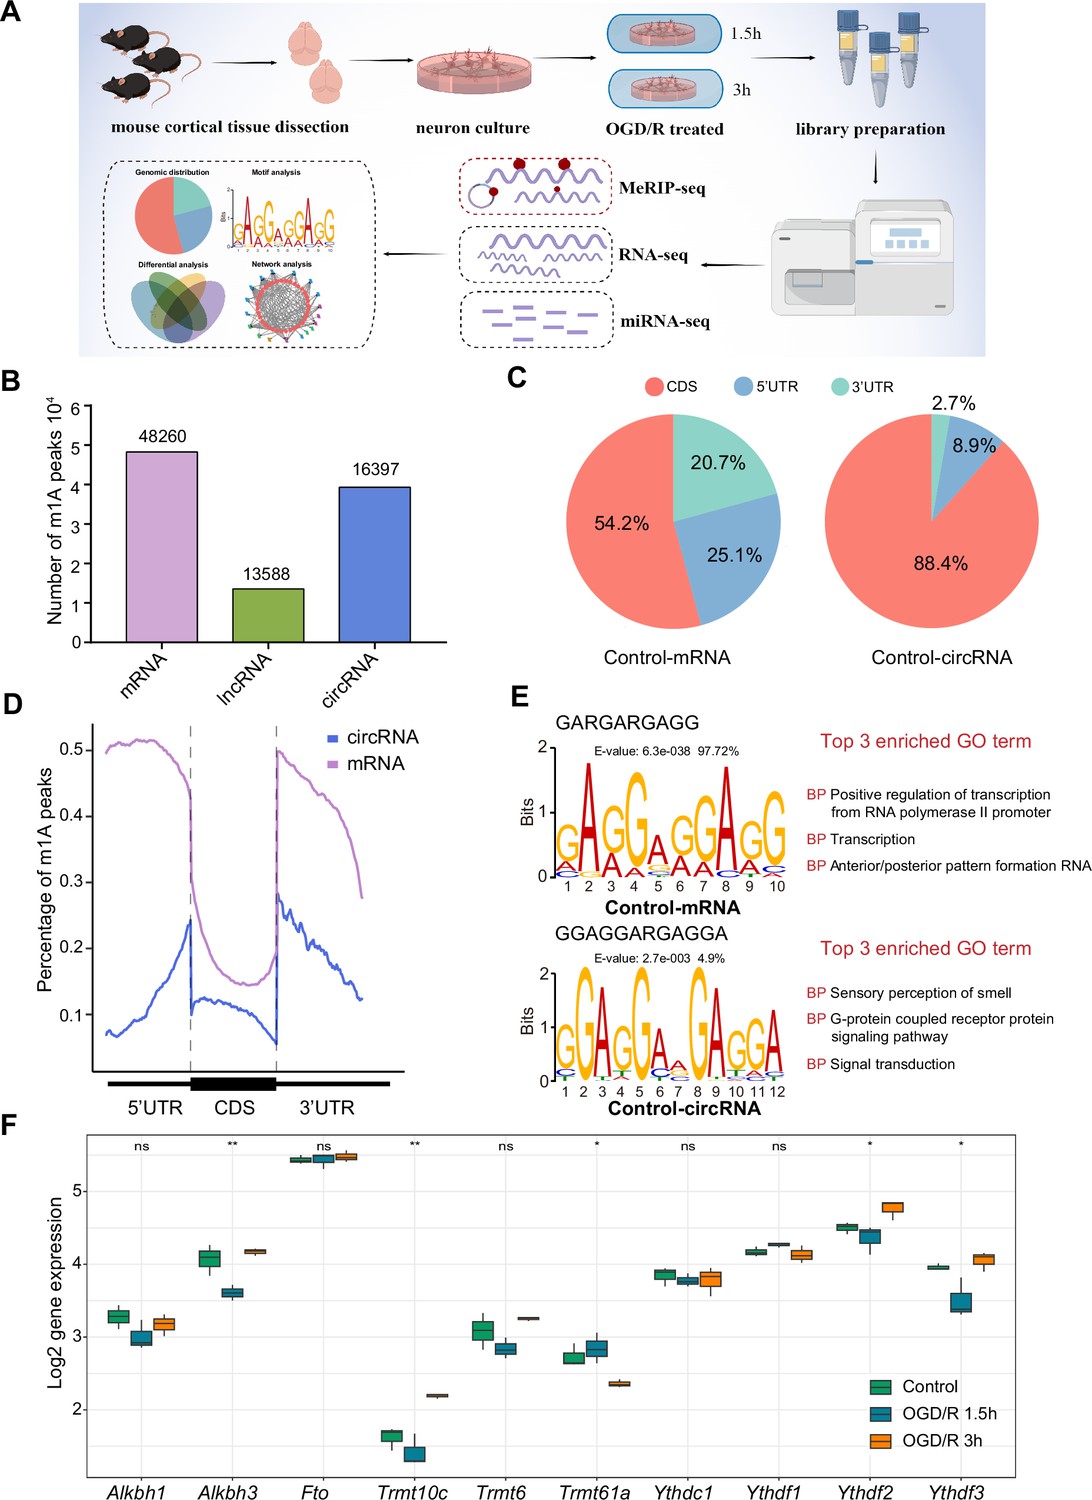
The common m1A modification features in primary neurons.
(A) Schematic of the experimental design and data analysis workflow (drawn by Figdraw). (B) m1A peaks identified in different RNAs (mRNA, lncRNA, and circRNA). (C) The genomic distribution of m1A peaks in mRNAs and circRNAs. (D) The genomic distribution pattern of m1A peaks in mRNAs and circRNAs on a metagene. (E) Potential motifs for m1A peaks in both m1A mRNAs and m1A circRNAs in the Control group. The E-value of a motif is based on its log likelihood ratio, width, sites, and background letter frequencies. The percentage represents the proportion of a motif in all identified motifs. (F) Boxplots showing differential gene expression of m1A regulators among three groups, One-way ANOVA was used to compare the means among different groups (* p<0.05, ** p<0.01, *** p<0.001, n=3 biologically independent samples per group).
Figure 1—figure supplement 1
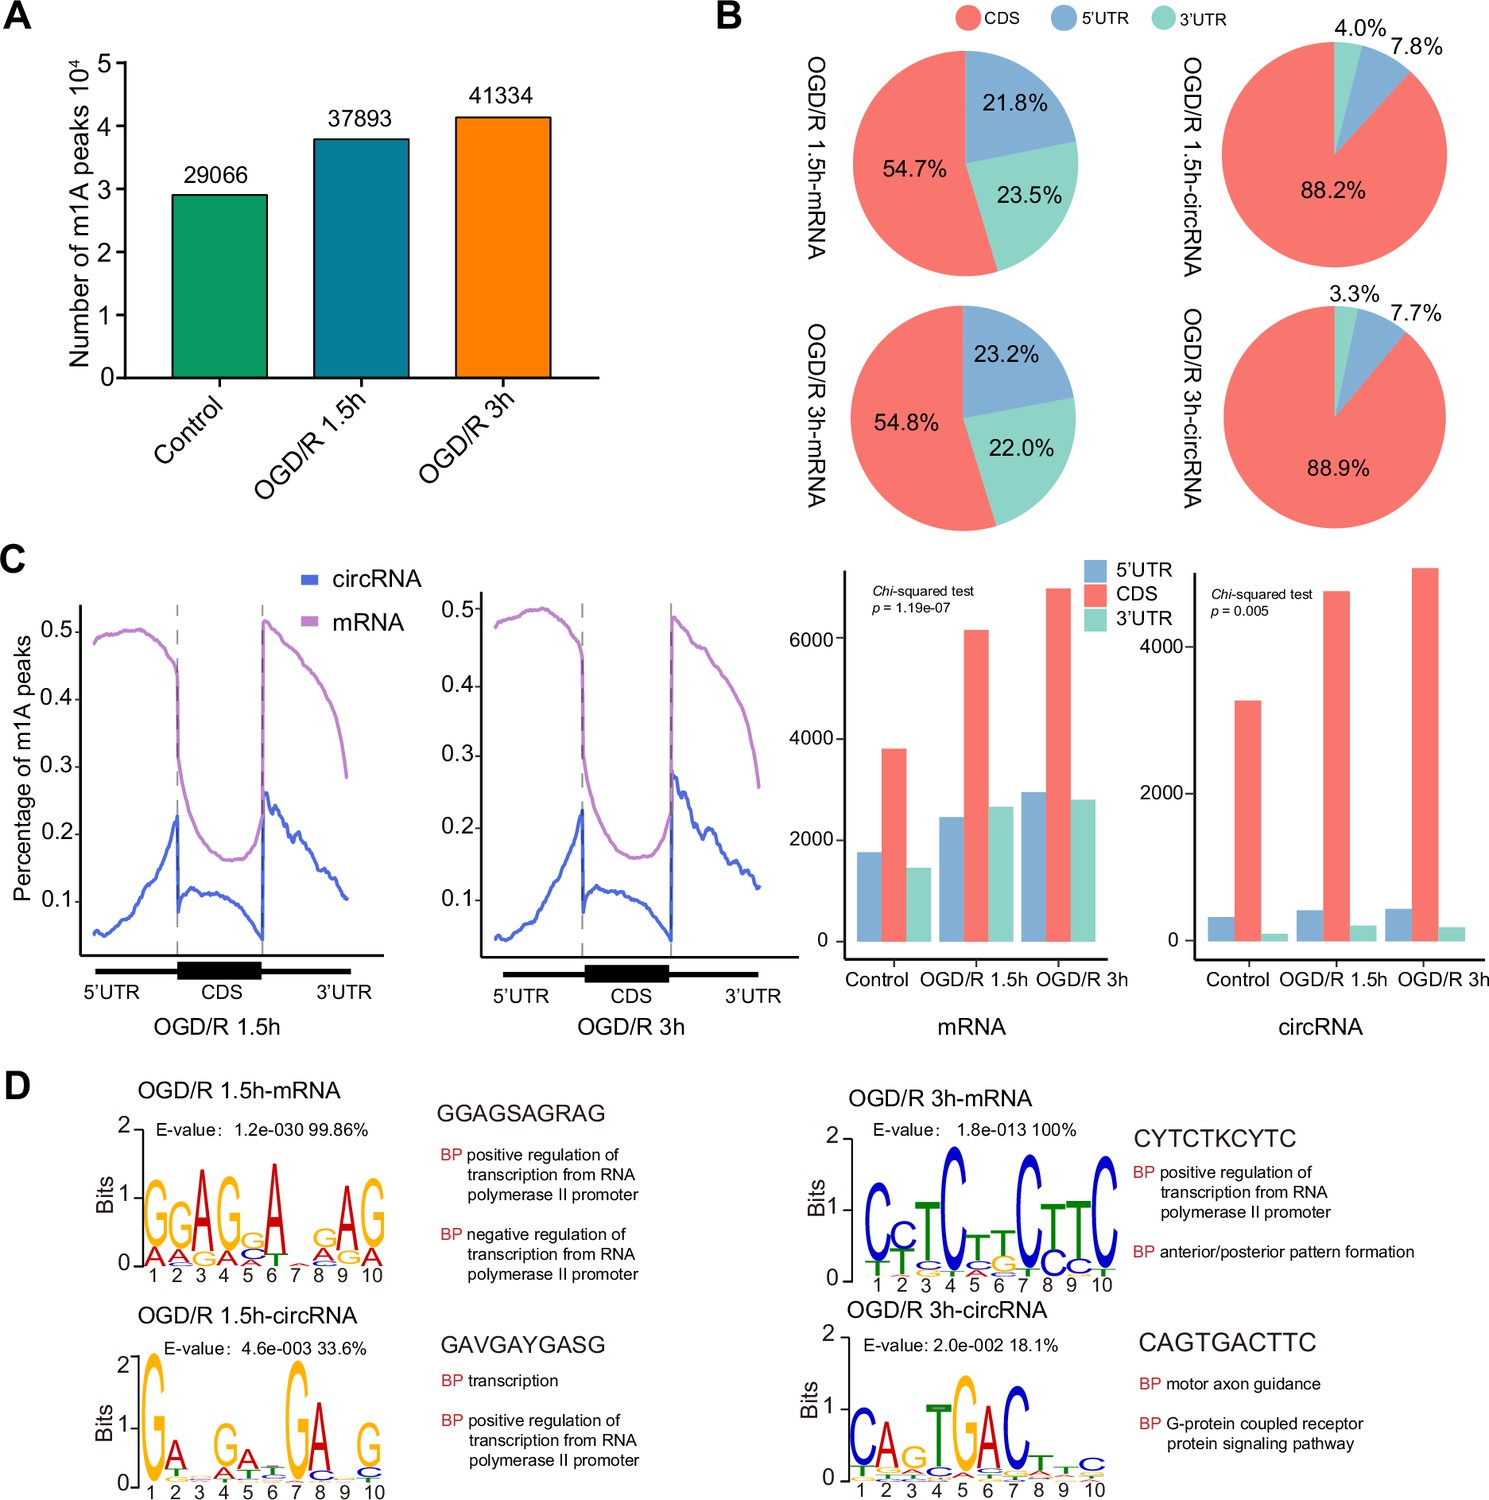
The common m1A modification features in primary neurons.
(A) m1A peaks identified in different groups (control, OGD/R 1.5 hr and OGD/R 3 hr). B. The genomic distribution of m1A peaks in mRNAs and circRNAs in the OGD/R 1.5 hr and OGD/R 3 hr groups. C. The genomic distribution pattern of m1A peaks in mRNAs and circRNAs on a metagene in the OGD/R 1.5 hr and OGD/R 3 hr groups. D. Potential motifs for m1A peaks in both m1A mRNAs and m1A circRNAs in the OGD/R 1.5 hr (left) and OGD/R 3 hr (right) groups.
Figure 2 with 1 supplement
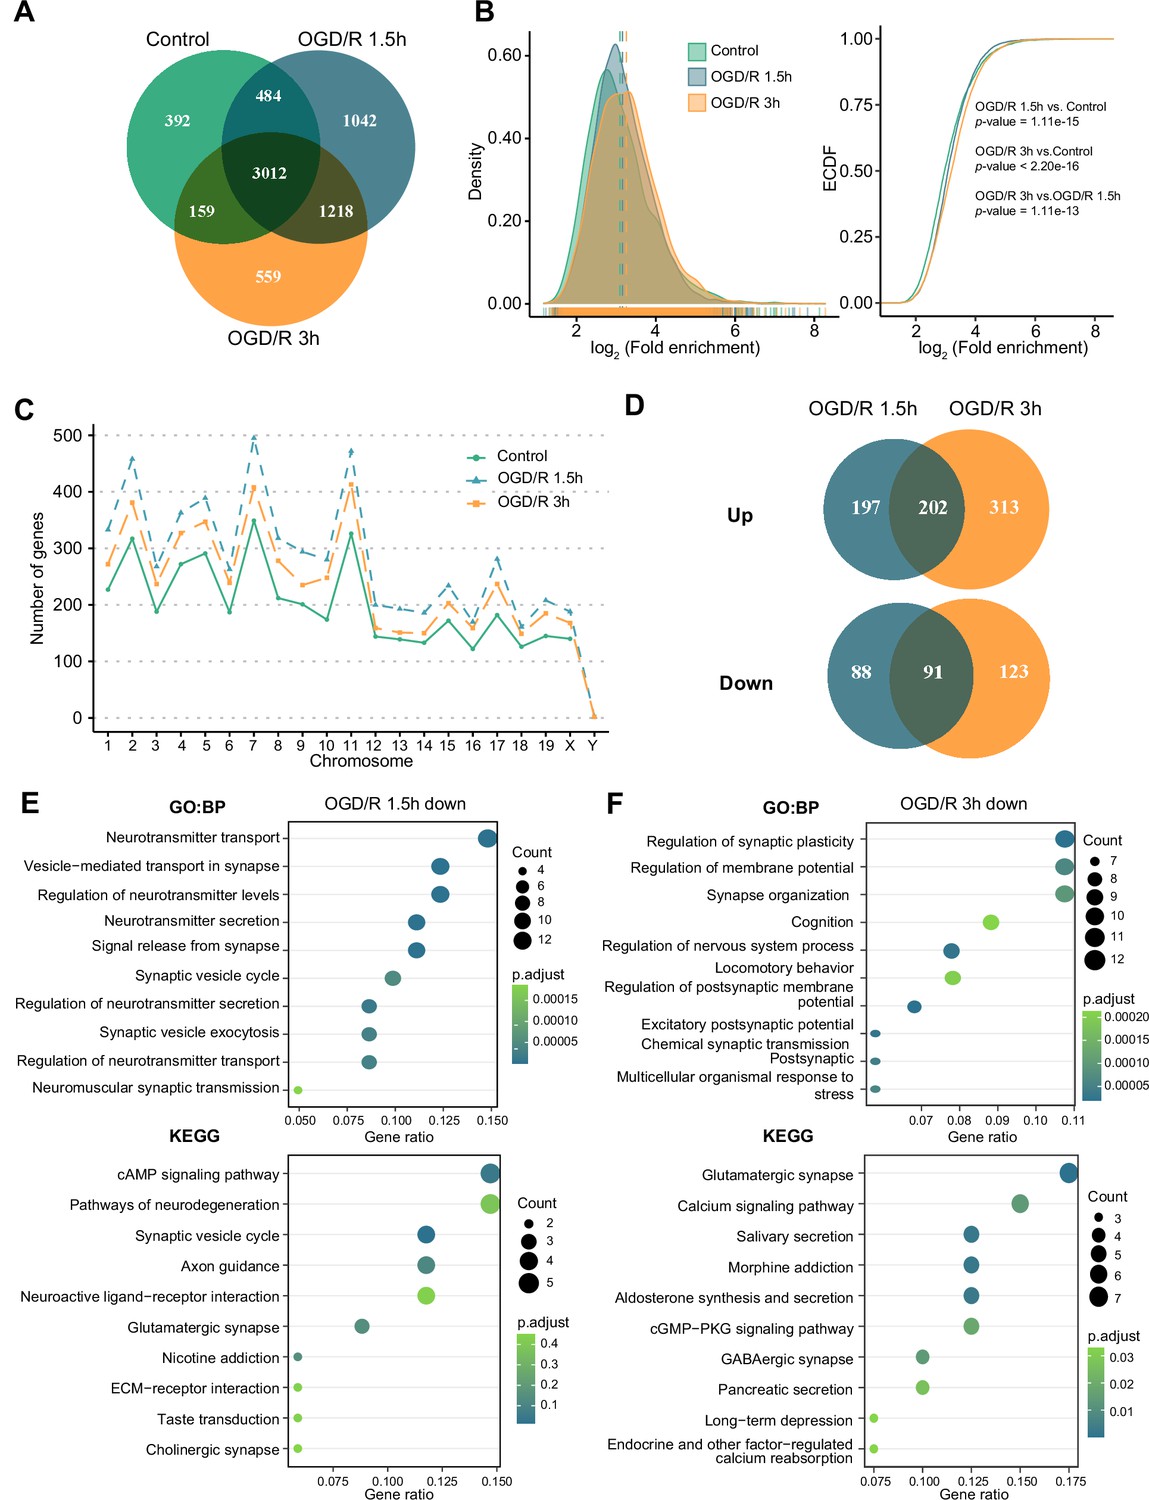
OGD/R increases the number of m1A mRNAs and affects neuron fate.
(A) Shared and unique m1A mRNAs in the Control and different OGD/R groups. B. The density distribution (left) and cumulative distribution function curves (right) to show the m1A modification level among different groups. The Kolmogorov‒Smirnov test was used to test the significance. C. The number of m1A mRNAs on each chromosome in different groups. D. Venn diagram showing differentially methylated (up and down) m1A mRNAs in the OGD/R 1.5 hr and OGD/R 3 hr groups. E-F. GO and KEGG analyses of differentially methylated (down) m1A mRNAs in the OGD/R 1.5 hr (E) and OGD/R 3 hr (F) groups.
-
Figure 2—source data 1
Modification sites detected for mRNAs in three groups.
- https://cdn.elifesciences.org/articles/85324/elife-85324-fig2-data1-v1.xlsx
-
Figure 2—source data 2
Differential modification sites detected for mRNAs between OGD/R and Control.
- https://cdn.elifesciences.org/articles/85324/elife-85324-fig2-data2-v1.xlsx
Figure 2—figure supplement 1
OGD/R increases the number of m1A mRNAs and affects neuron fate.
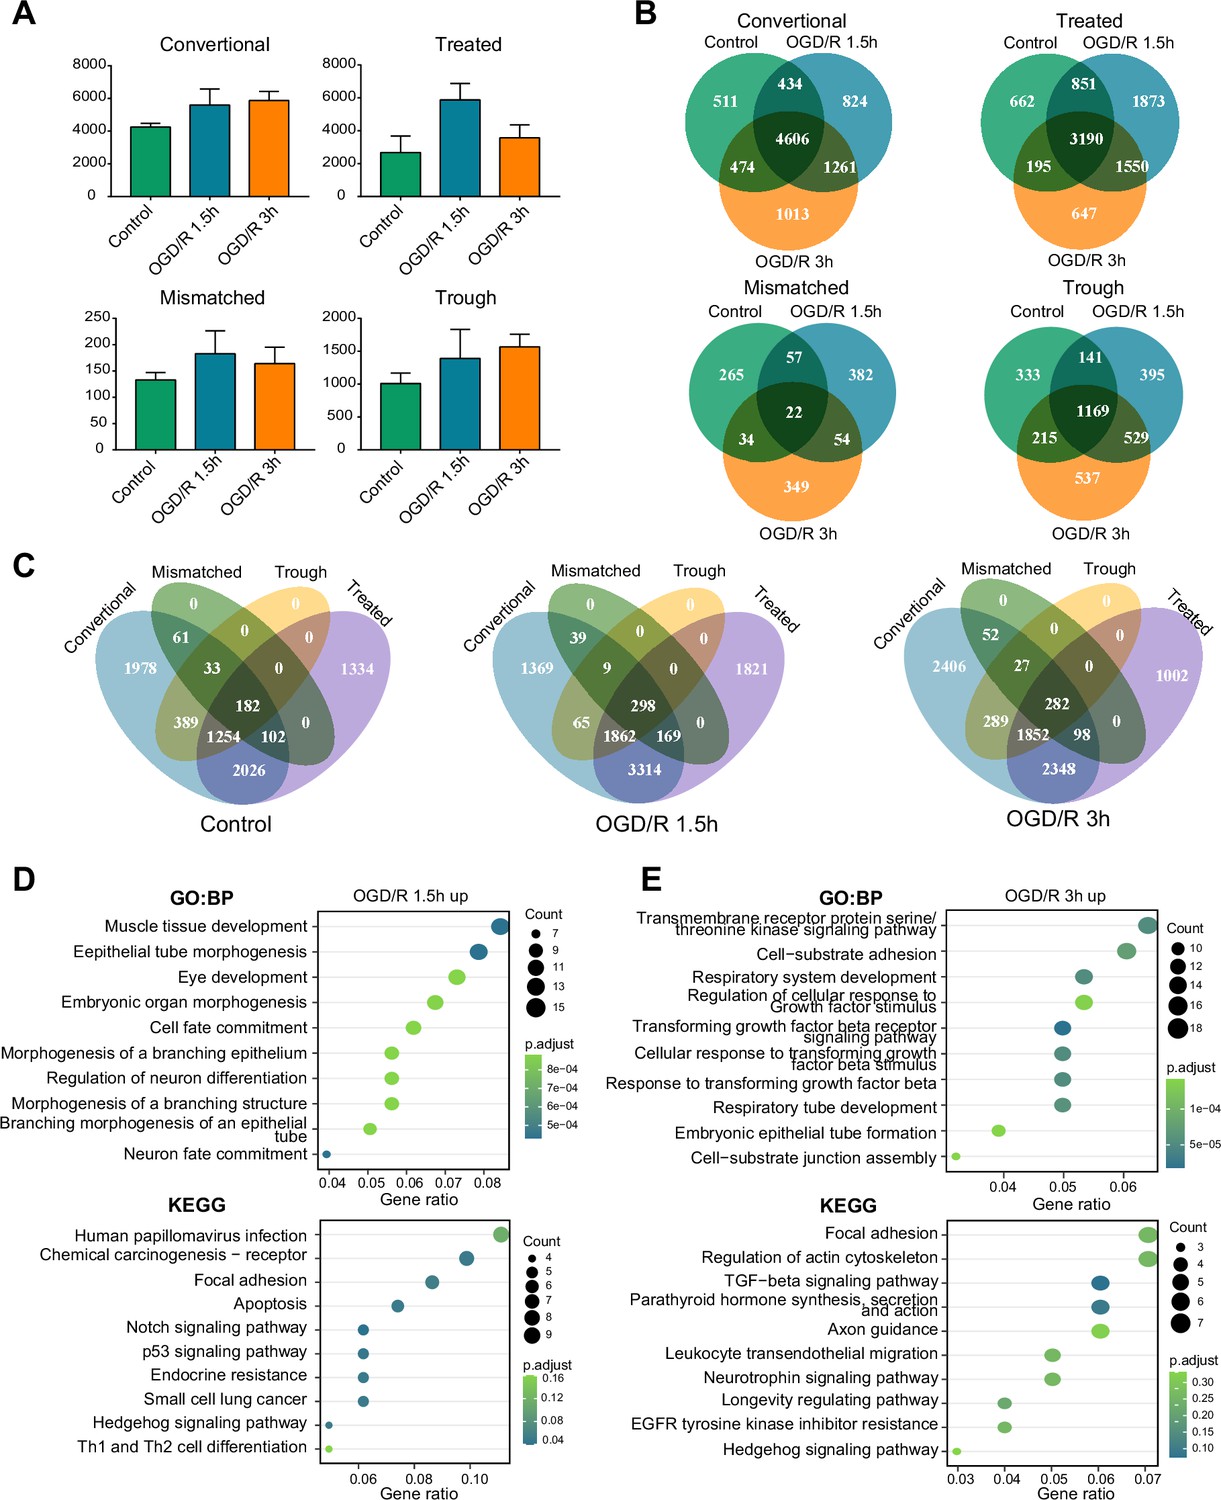
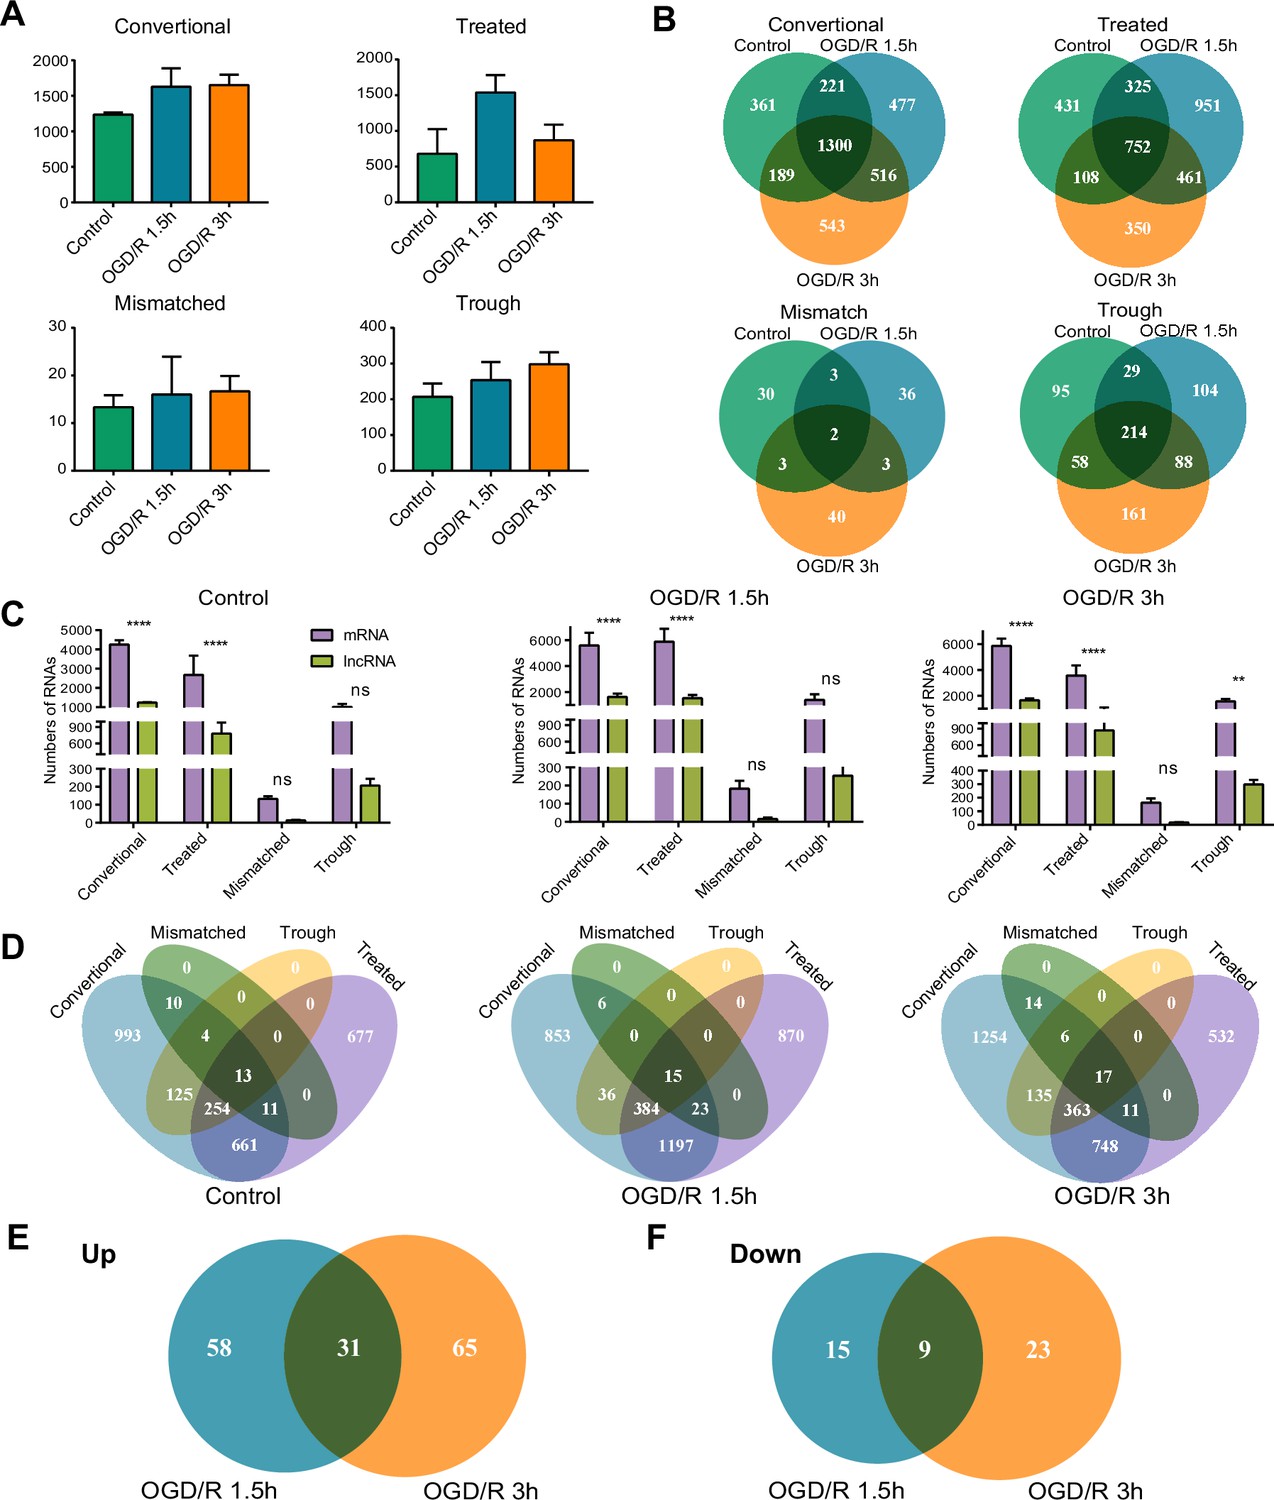
(A) The number of m1A mRNAs in the three groups identified by four different methods,sample size = 3 for each group, error bar represents the standard deviation of triplicate measurements. (B) Overlap of m1A mRNAs in three groups identified by four different methods. (C) Overlap of m1A mRNAs by the four identified methods in the three groups. (D-E) GO and KEGG analysis of differentially methylated (up) m1A mRNAs in the OGD/R 1.5 hr (D) and OGD/R 3 hr (E) groups.
Figure 3 with 1 supplement
OGD/R increases the number of m1A lncRNAs and affects RNA processing.
(A) Shared and unique m1A lncRNAs in the Control and different OGD/R groups. (B) The genomic resources of m1A lncRNAs in the Control and OGD/R-treated groups. (C) The density distribution (left) and cumulative distribution function curves (right) show the m1A modification level among the different groups. The Kolmogorov‒Smirnov test was used to test the significance. (D) The number of m1A lncRNAs on each chromosome in different groups. (E-F) The interaction networks between lncRNAs and RBPs in different OGD/R groups (E) and functional enrichment analysis of those core RBPs (F).
-
Figure 3—source data 1
Modification sites detected for lncRNAs in three groups.
- https://cdn.elifesciences.org/articles/85324/elife-85324-fig3-data1-v1.xlsx
-
Figure 3—source data 2
Differential modification sites detected for lncRNAs between OGD/R and Control.
- https://cdn.elifesciences.org/articles/85324/elife-85324-fig3-data2-v1.xlsx
Figure 3—figure supplement 1
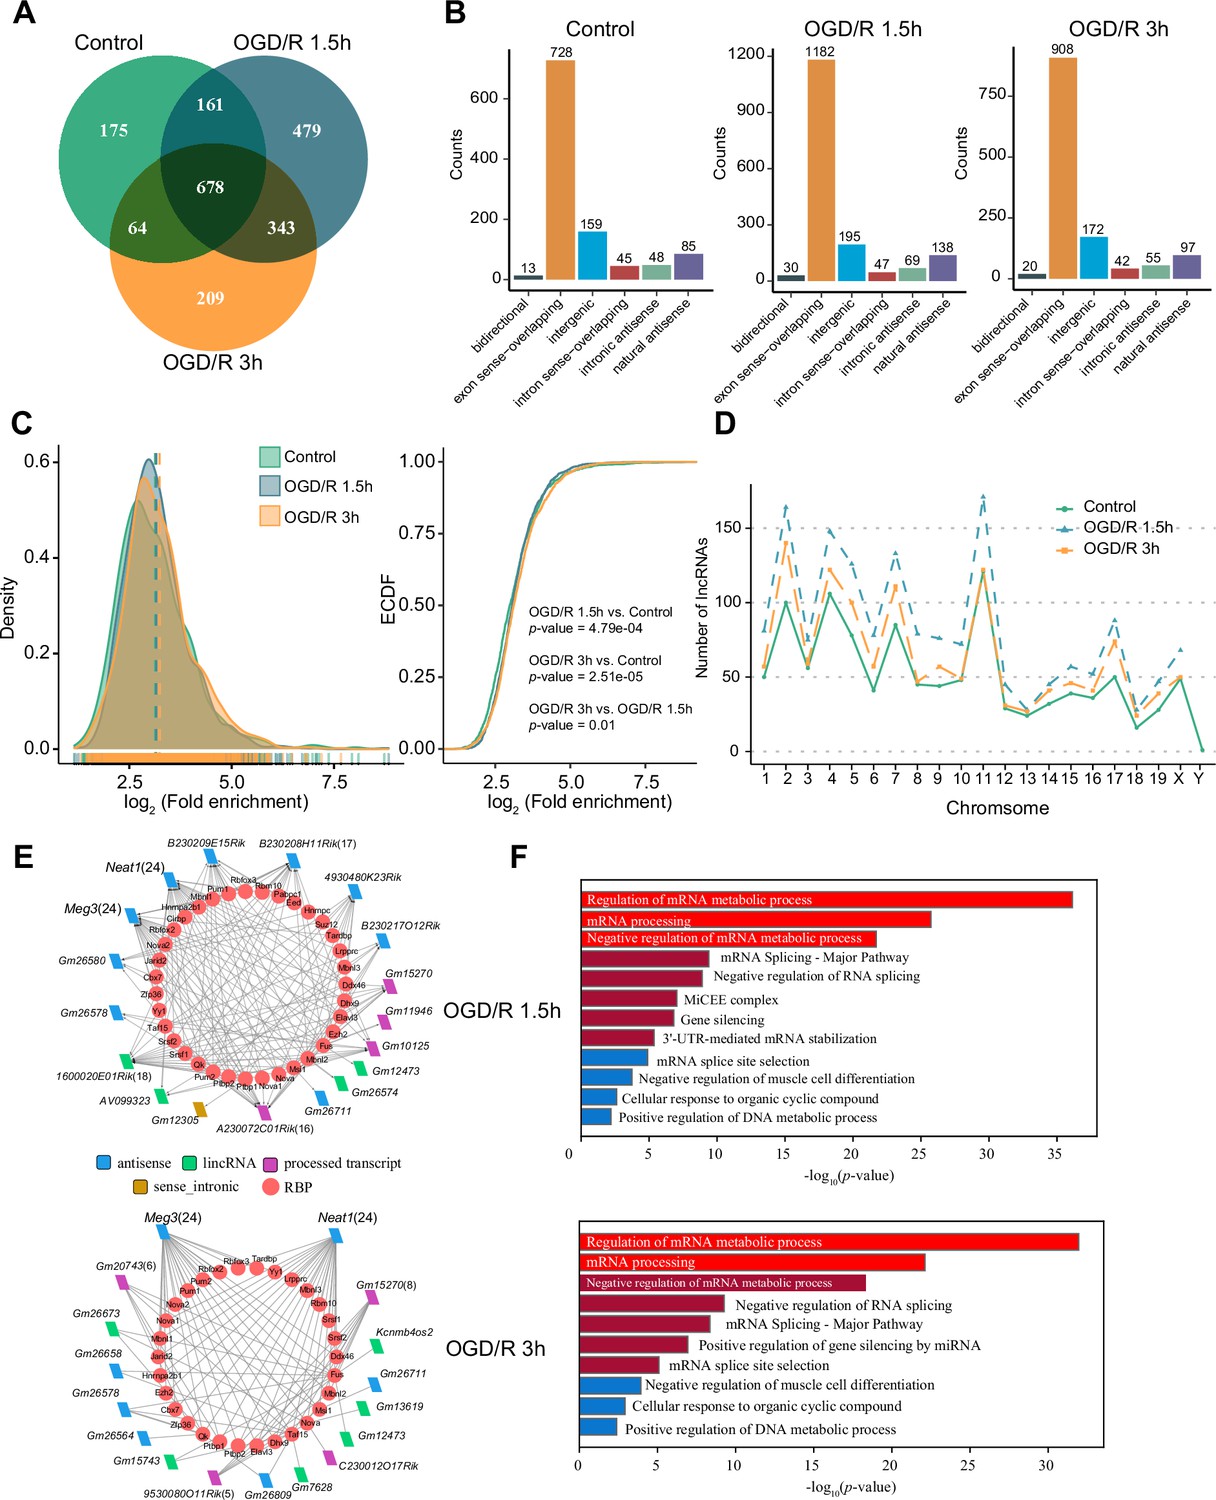
OGD/R increases the number of m1A lncRNAs and affects RNA processing.
(A) The number of m1A lncRNAs in the three groups identified by four different methods. (B) Overlap of m1A lncRNAs in three groups identified by four different methods. (C) Comparison of m1A mRNAs and m1A lncRNAs in three groups identified by four different methods. Student t test was used to identify the significance. (D) Overlap of m1A mRNAs by four identified methods in the three groups. (E-F) Differentially methylated m1A lncRNAs in different OGD/R groups, increasing methylated lncRNAs (E), decreasing methylated lncRNAs (F). Sample size = 3 for each group, error bar represents the standard deviation of triplicate measurements. T-test for comparison between two groups. * p < 0.05, ** p < 0.01, *** p < 0.001, **** p < 0.0001.
Figure 4 with 1 supplement
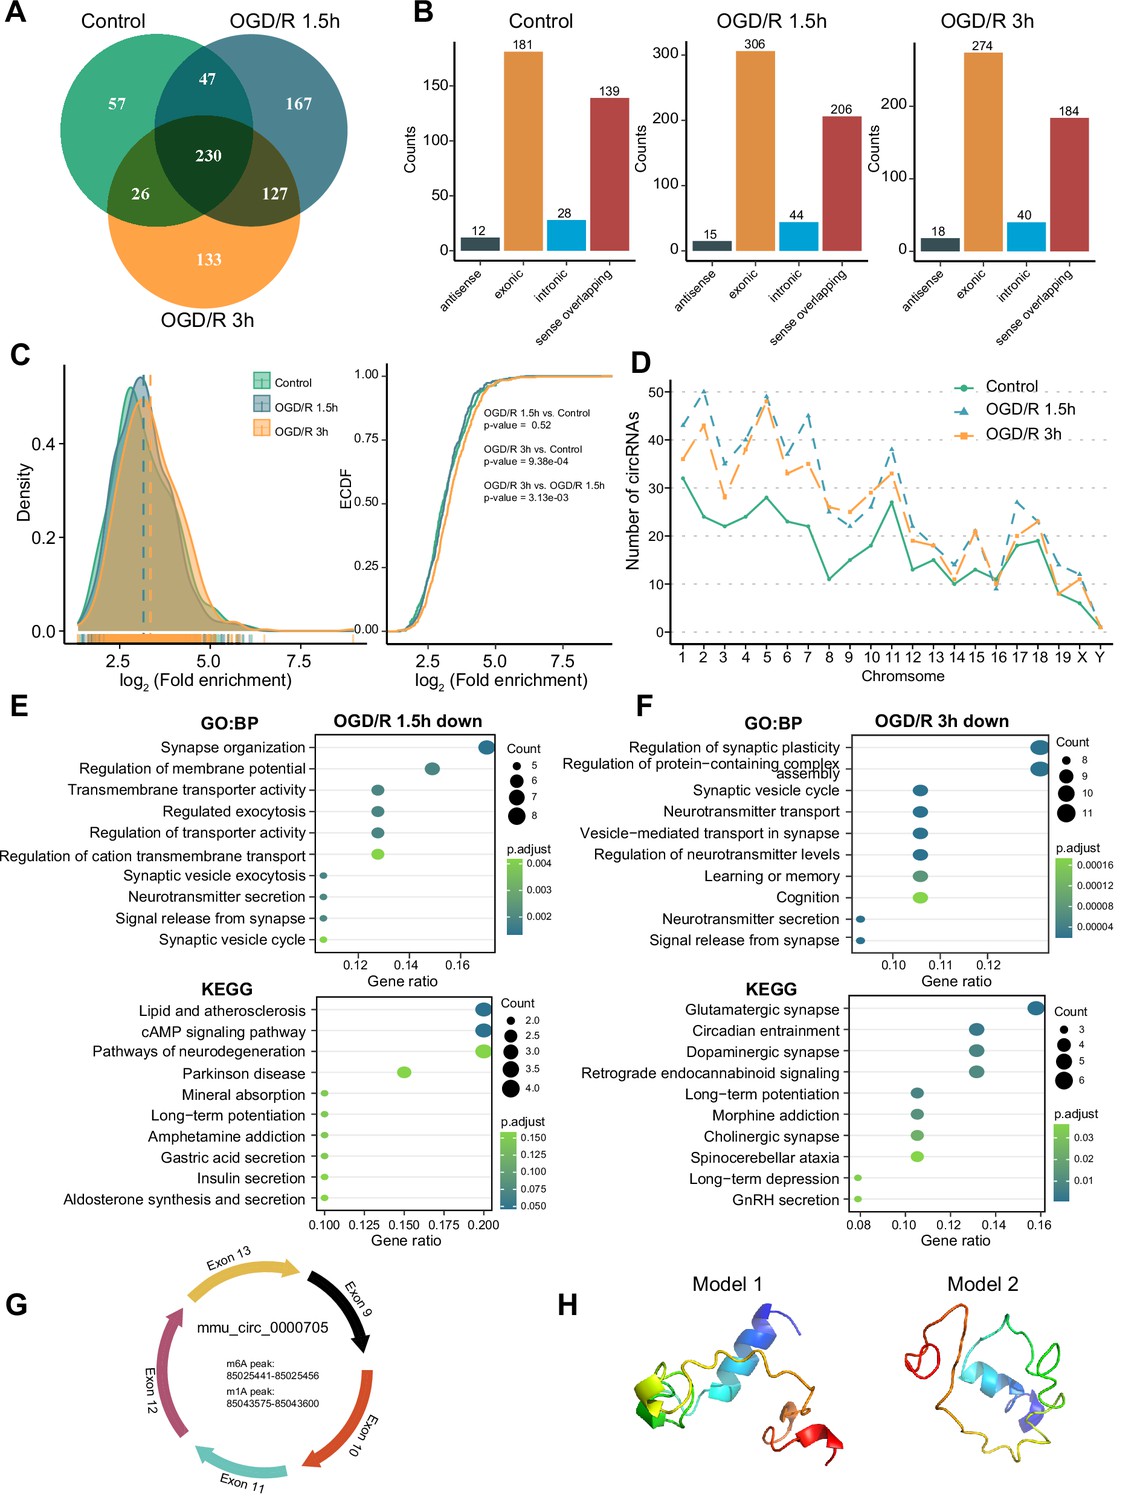
OGD/R increases the m1A modification sites on circRNA and regulates translation functions.
(A) Shared and unique m1A circRNAs in the Control and different OGD/R groups. (B) The genomic resources of m1A circRNAs in the Control and OGD/R-treated groups. (C) The density distribution (left) and cumulative distribution function curves (right) show the m1A modification level among the different groups. The Kolmogorov‒Smirnov test was used to test the significance. (D) The number of m1A circRNAs on each chromosome in different groups. (E-F) GO and KEGG analysis of differentially methylated (down) m1A circRNAs in OGD/R 1.5 hr (E) and OGD/R 3 hr (F). (G) An example of a circRNA (mmu_circ_0000705) with translation ability that also contains an m1A and m6A modification site. (H) Predicted polypeptide structure of mmu_circ_0000705.
-
Figure 4—source data 1
Modification sites detected for circRNAs in three groups.
- https://cdn.elifesciences.org/articles/85324/elife-85324-fig4-data1-v1.xlsx
-
Figure 4—source data 2
Differential modification sites detected for circRNAs between OGD/R and Control.
- https://cdn.elifesciences.org/articles/85324/elife-85324-fig4-data2-v1.xlsx
Figure 4—figure supplement 1
OGD/R increases the m1A modification sites on circRNA and regulates translation functions.
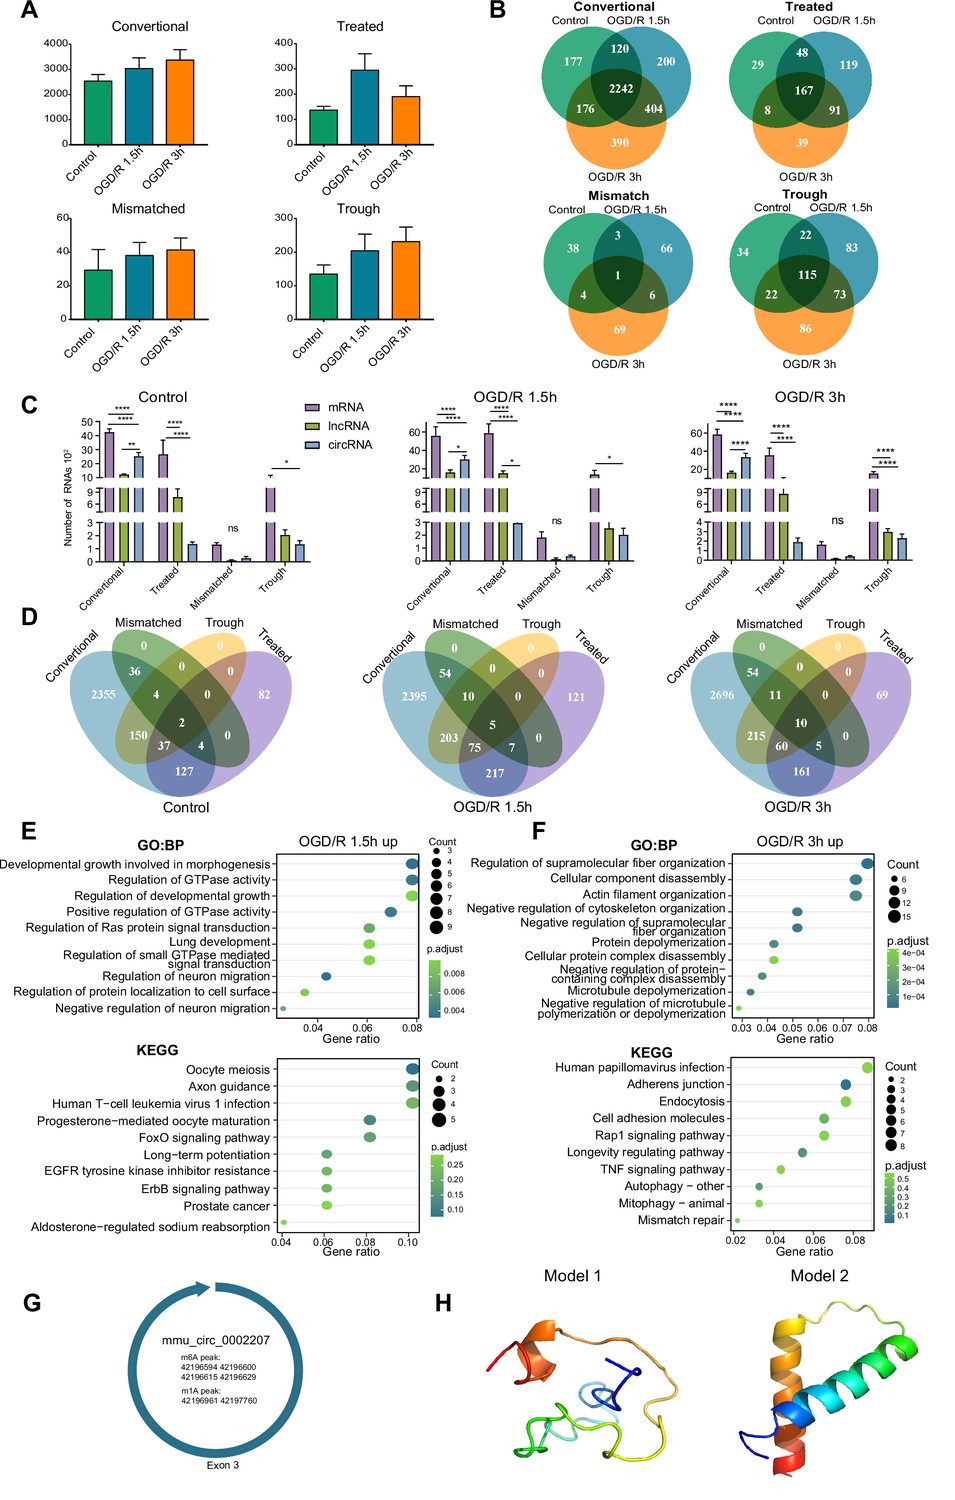
(A) The number of m1A circRNAs in the three groups identified by four different methods. (B) Overlap of m1A circRNAs in the three groups identified by four different methods. (C) Comparison of m1A mRNAs and m1A circRNAs in three groups identified by four different methods. One-way ANOVA was used to identify significance among the three groups. (D) Overlap of m1A circRNAs in four identified methods in three groups. (E-F) GO and KEGG analyses of differentially methylated (upregulated) m1A circRNAs in the OGD/R 1.5 hr (E) and OGD/R 3 hr (F) groups. (G) Another example of a circRNA (mmu_circ_0002207) with translation ability that also contains m1A and m6A modification sites. H. Predicted polypeptide structure of mmu_circ_0002207. Sample size = 3 for each group, error bar represents the standard deviation of triplicate measurements. One-way ANOVA for comparison among three groups. * p < 0.05, ** p < 0.01, *** p < 0.001, **** p < 0.0001.
Figure 5 with 1 supplement
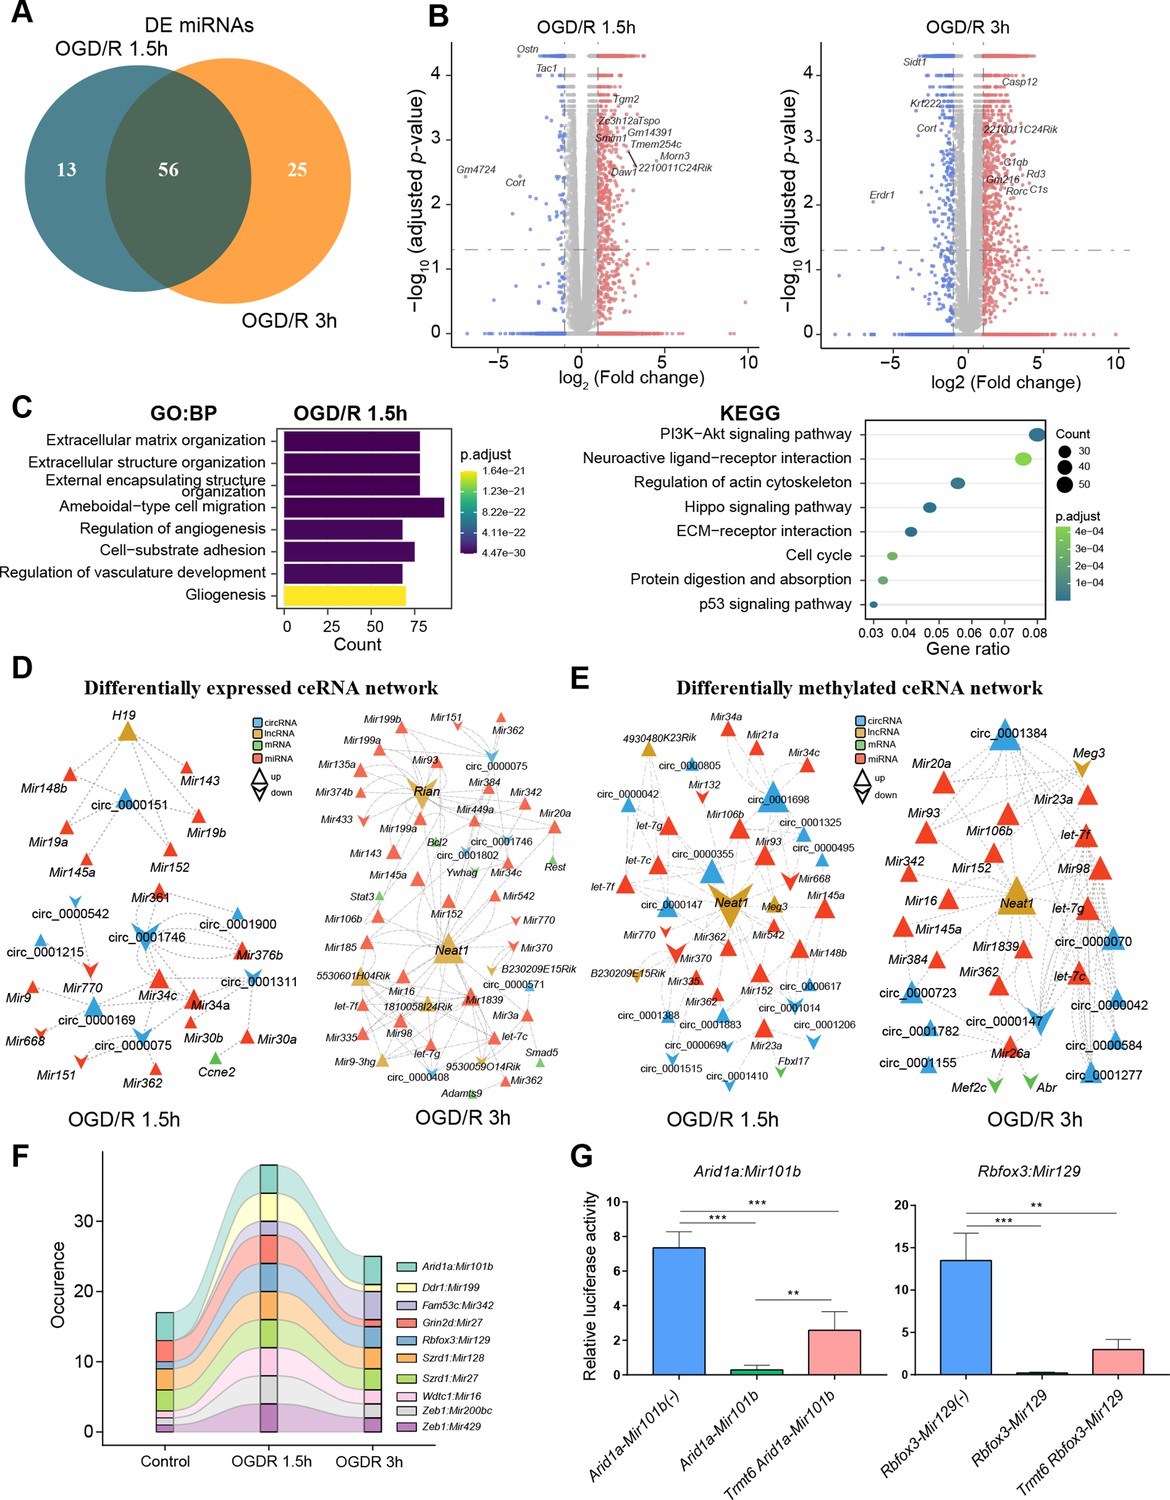
m1A modification affects the ceRNA mechanism of differentially methylated lncRNAs and circRNAs.
(A) Venn diagram showing differentially expressed miRNAs in different OGD/R-treated groups. (B) Volcano plot showing differentially expressed mRNAs in different OGD/R-treated groups (OGD/R 1.5 hr, left and OGD/R 3 hr, right). (C) GO analysis shows the biological functions of the differentially expressed mRNAs in the OGD/R 1.5 hr group. D-E. Expression- (D) and methylation-specific (E) ceRNA regulatory networks in the OGD/R 1.5 hr and OGD/R 3 hr groups. (F) Sankey diagram showing the dynamic changes in miRNA‒mRNA pairs in the Control, OGD/R 1.5 hr and OGD/R 3 hr groups. (G) A dual luciferase assay showed that m1A modification of Arid1a and Rbfox3 blocks the binding of the corresponding miRNAs. Sample size = 3 for each group, error bar represents the standard deviation of triplicate measurements. One-way ANOVA for comparison among three groups. * p < 0.05, ** p < 0.01, *** p < 0.001, **** p < 0.0001.
-
Figure 5—source data 1
Differential expression of miRNAs between OGD/R and Control.
- https://cdn.elifesciences.org/articles/85324/elife-85324-fig5-data1-v1.xlsx
-
Figure 5—source data 2
The miRNA sequences and mRNA sequences used in Figure 5.
- https://cdn.elifesciences.org/articles/85324/elife-85324-fig5-data2-v1.docx
Figure 5—figure supplement 1
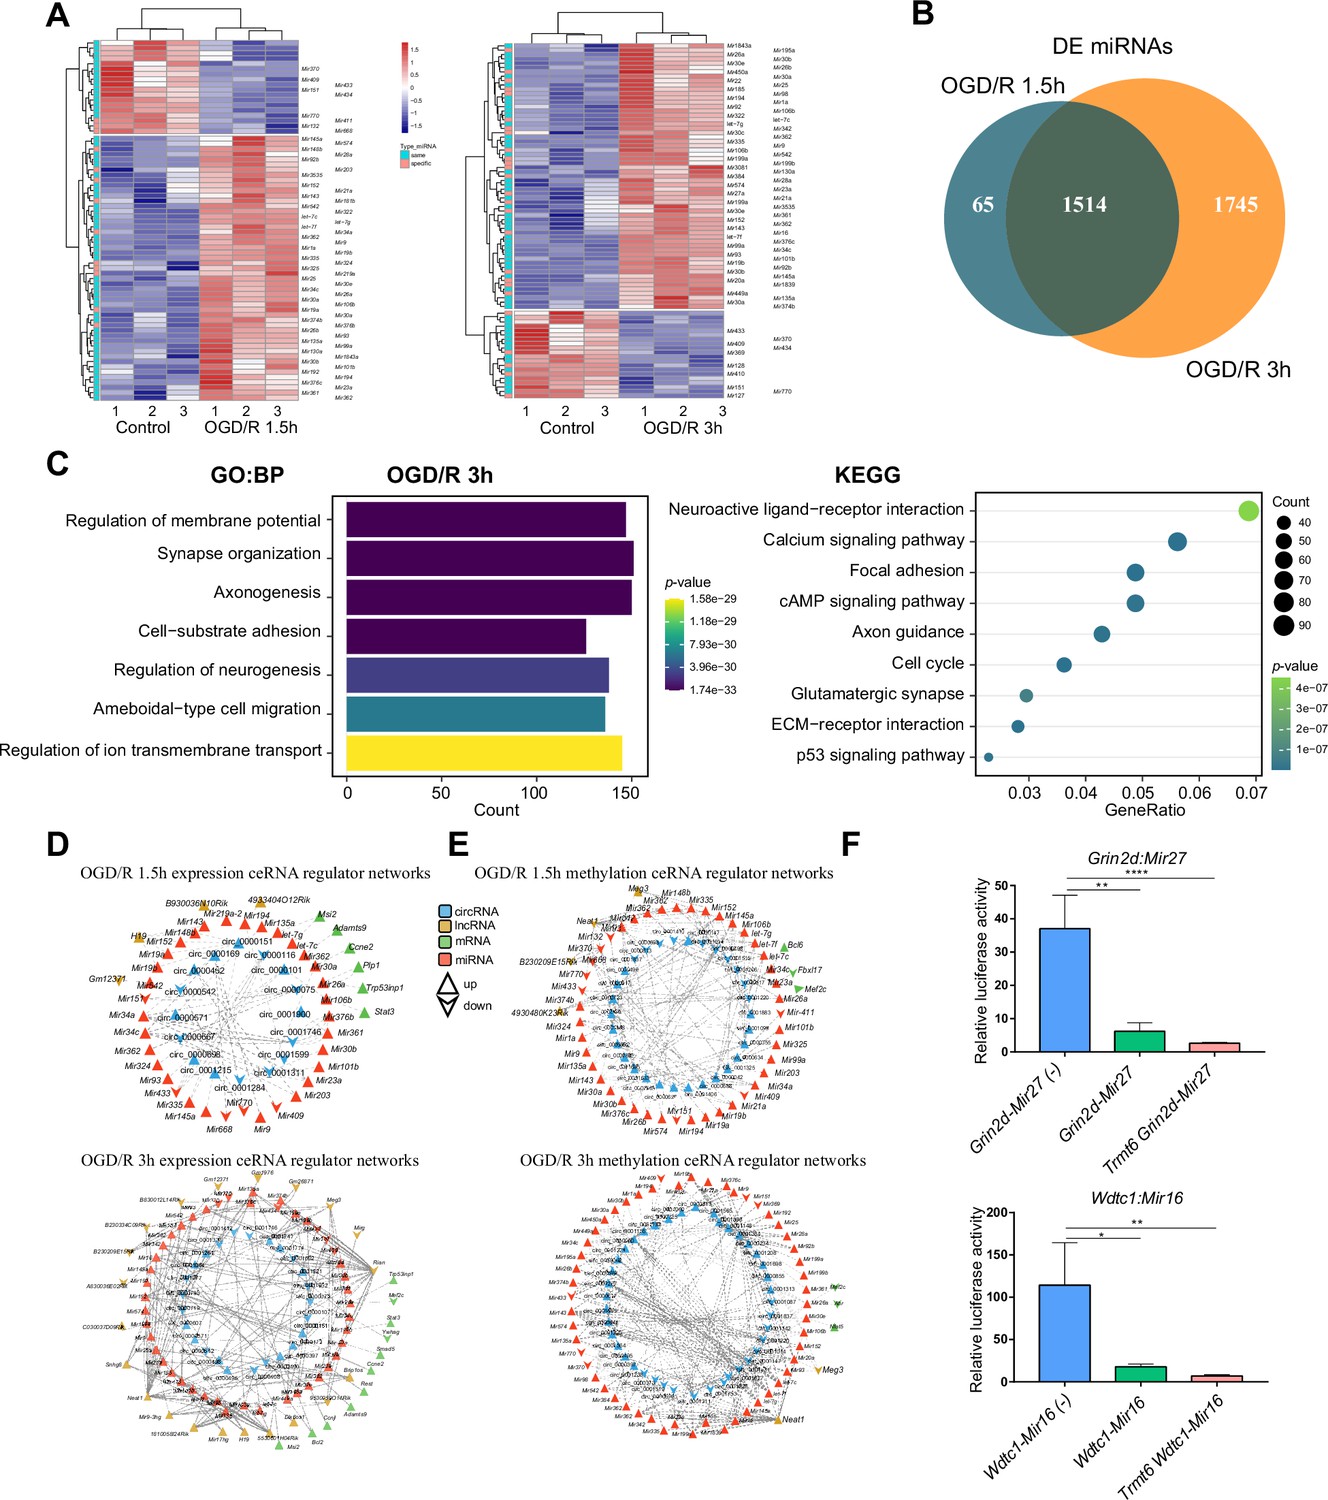
m1A modification affects the ceRNA mechanism of differentially methylated lncRNAs and circRNAs.
(A) Differentially expressed miRNAs in different OGD/R 1.5 hr (left) and OGD/R 3 hr (right) groups. (B) Common and specific differentially expressed mRNAs in the OGD/R 1.5 hr and OGD/R 3 hr groups. (C) GO and KEGG analyses show the enriched pathways of the differentially expressed mRNAs in the OGD/R 3 hr group. (D-E) Expression- (D) and methylation-specific (E) ceRNA regulatory networks in the OGD/R 1.5 hr and OGD/R 3 hr groups. (F) A dual luciferase assay showed that m1A modification of Grin2d and Wdtc1 had no effect on the binding of miRNA and mRNA. Sample size = 3 for each group, error bar represents the standard deviation of triplicate measurements. One-way ANOVA for comparison among three groups. * p < 0.05, ** p < 0.01, *** p < 0.001, **** p < 0.0001.
Figure 6 with 1 supplement
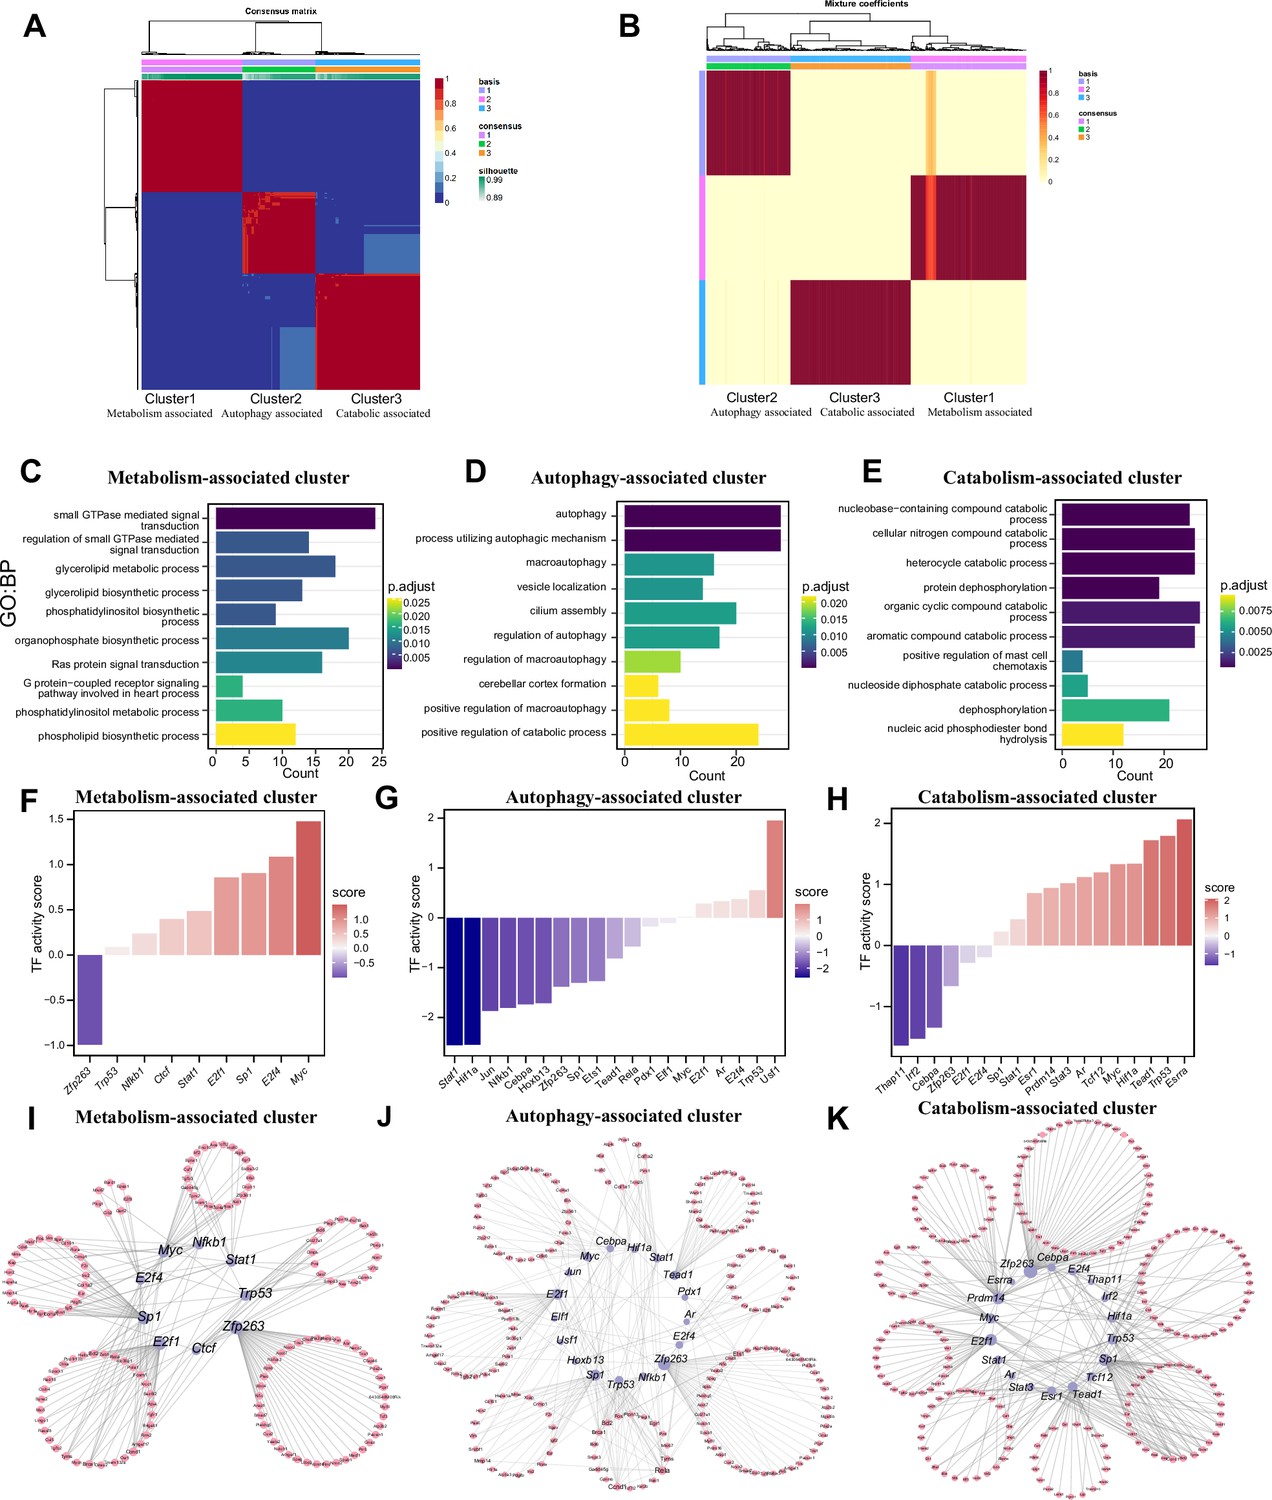
Three patterns regulate m1A modification in neurons.
(A) NMF analysis shows three m1A modification clusters (termed the metabolism-associated cluster (MAC), autophagy-associated cluster (AAC), and catabolic-associated cluster (CAC)). (B) Mixture coefficients matrix also shows that the three clusters have good discrimination. (C-E) GO enrichment analysis shows the different biological functions of each cluster. (F-H) Bar graph shows the transcription factors activity in each m1A pattern. (I-K) TF-target genes regulatory networks in m1A patterns.
Figure 6—figure supplement 1
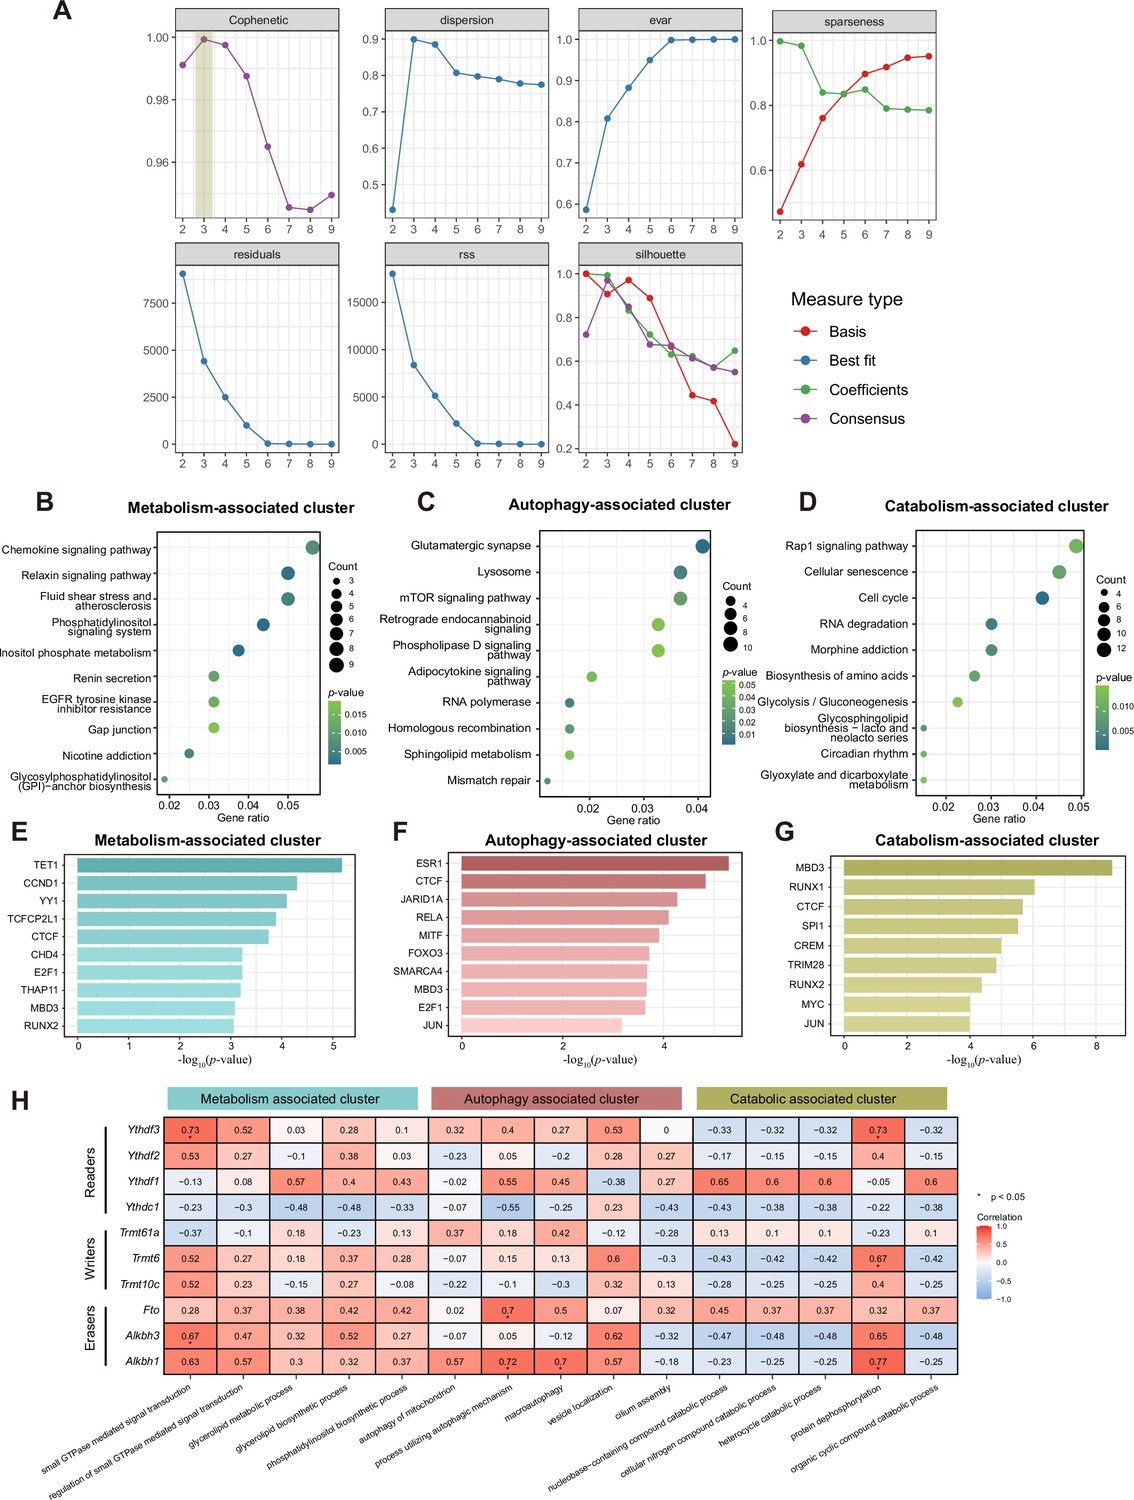
Three patterns regulate m1A modification in neurons.
(A) Estimation of the number of clusters. Quality measures computed from 1000 runs for each value of r. The estimation is based on Brunet’s algorithm. (B-D) KEGG analysis shows enriched pathways of three specific clusters. (E-G) Bar graph shows the enriched transcription factors in each m1A pattern by the ‘Enrichr’ database. (H) Heatmap shows the correlation between m1A regulator expression and representative functions in three m1A patterns.
Additional files
Download links
A two-part list of links to download the article, or parts of the article, in various formats.
Downloads (link to download the article as PDF)
Open citations (links to open the citations from this article in various online reference manager services)
Cite this article (links to download the citations from this article in formats compatible with various reference manager tools)
The landscape of m1A modification and its posttranscriptional regulatory functions in primary neurons
eLife 12:e85324.
https://doi.org/10.7554/eLife.85324


