Healthcare in England was affected by the COVID-19 pandemic across the pancreatic cancer pathway: A cohort study using OpenSAFELY-TPP
- Faculty of Health and Medical Sciences, University of Surrey, United Kingdom
- Bennett Institute for Applied Data Science, Nuffield Department of Primary Care Health Sciences, University of Oxford, United Kingdom
- HPB Surgical Unit, Royal Surrey NHS Foundation Trust, United Kingdom
- Oncology Section, Surrey Cancer Research Institute, Department of Clinical and Experimental Medicine, University of Surrey, United Kingdom
- Institute of Immunology and Immunotherapy, University of Birmingham, United Kingdom
- MRC Unit for Lifelong Health and Ageing and Centre for Longitudinal Studies, University College London, United Kingdom
Figures
Figure 1
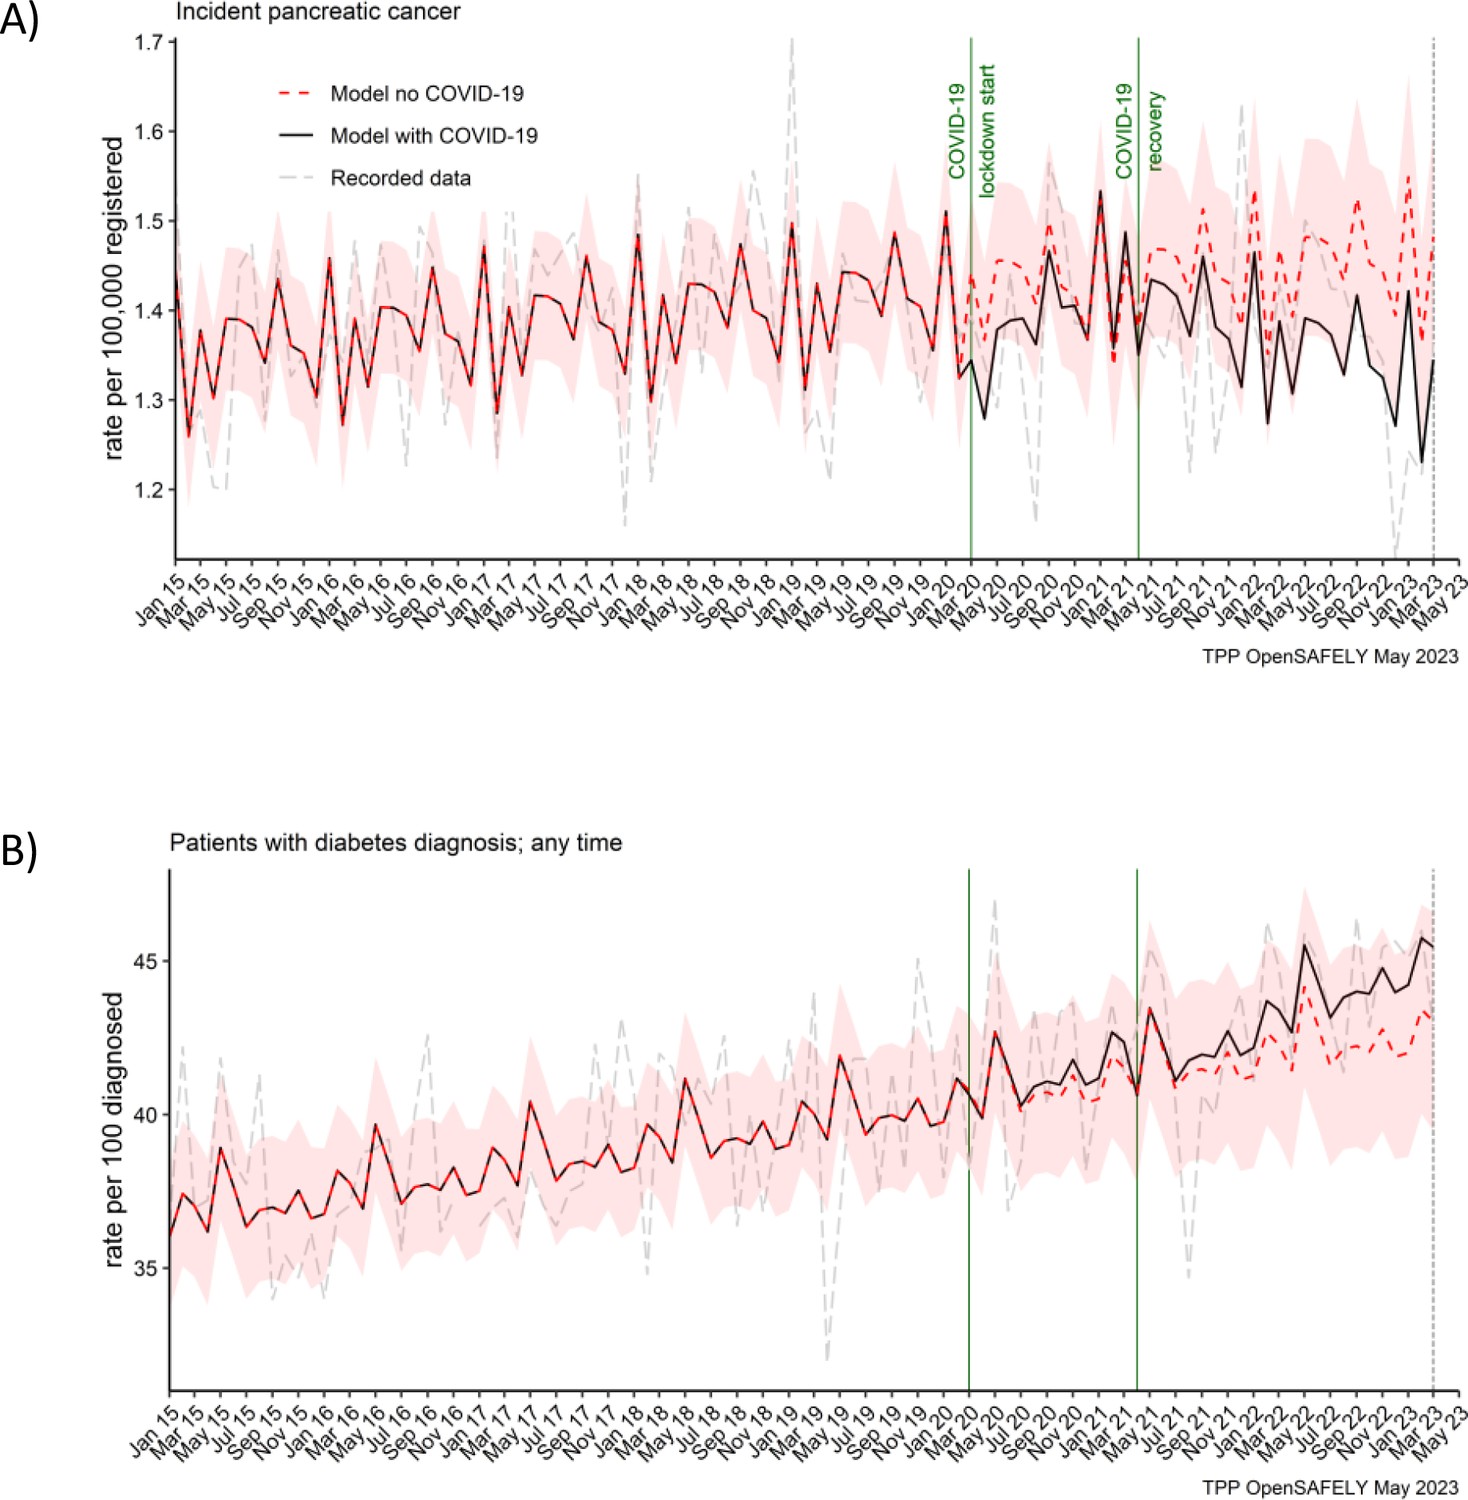
Pancreatic cancer diagnosis and diabetes diagnosis in people with pancreatic cancer were not affected by the pandemic.
Observed and predicted monthly rates (as if the COVID-19 pandemic had not happened) for (A) pancreatic cancer diagnosis per 100,000 registered patients, and (B) diabetes diagnosis per 100 people with pancreatic cancer. Generalised linear models were used to predict monthly rates with the 95% confidence intervals to estimate the effect of the pandemic.
Figure 2
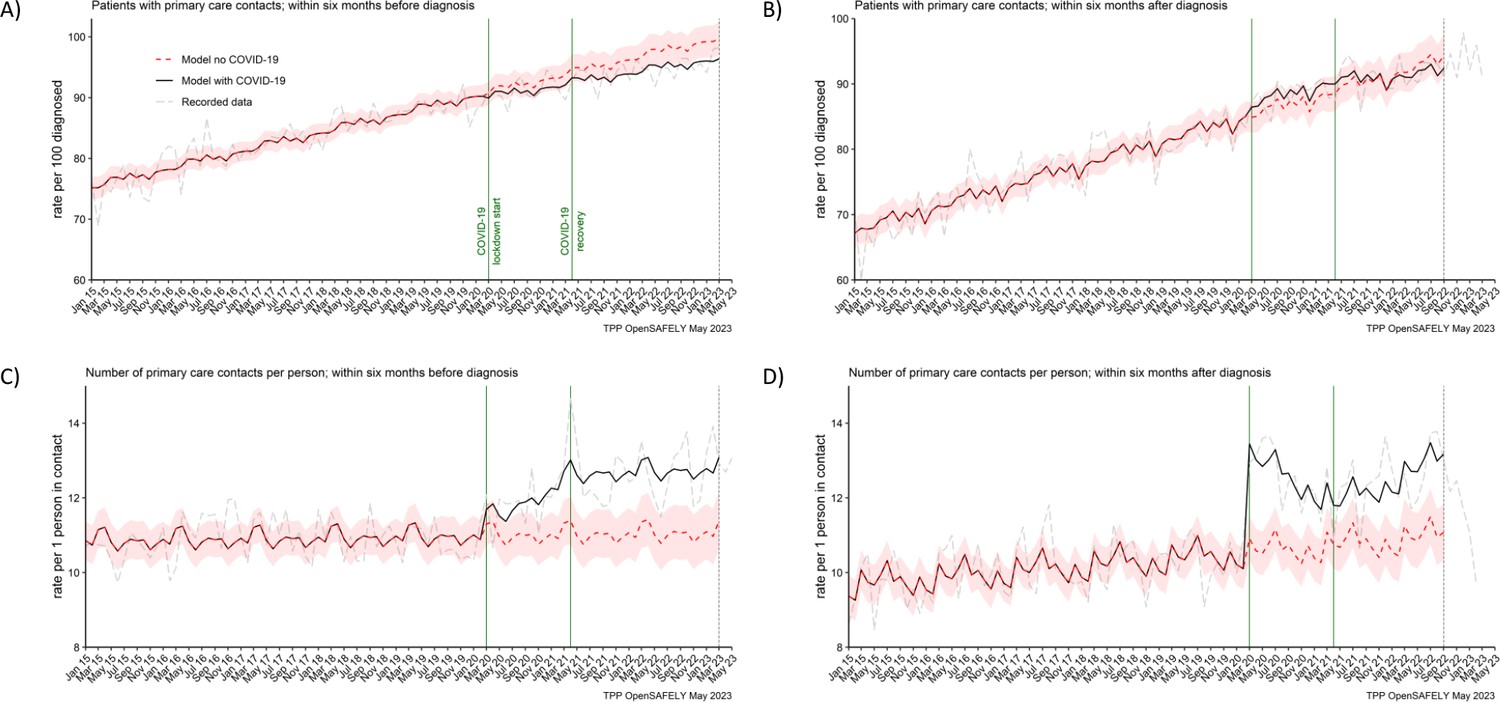
The number of people contacting primary care was not affected, but the number of contacts per person increased during the pandemic.
The observed and predicted (as if the COVID-19 pandemic had not happened) monthly rates of (A) people in contact with primary care before pancreatic cancer diagnosis, and (B) people in contact with primary care after pancreatic cancer diagnosis. Rates are per 100 people diagnosed with pancreatic cancer. Figures (C) and (D) are monthly rates of primary care contacts per person before and after pancreatic cancer diagnosis. Contacts with primary care include all contact events (all reasons and purposes), not only healthcare appointments. Generalised linear models were used to predict monthly rates with the 95% confidence intervals to estimate the effect of the pandemic.
Figure 3
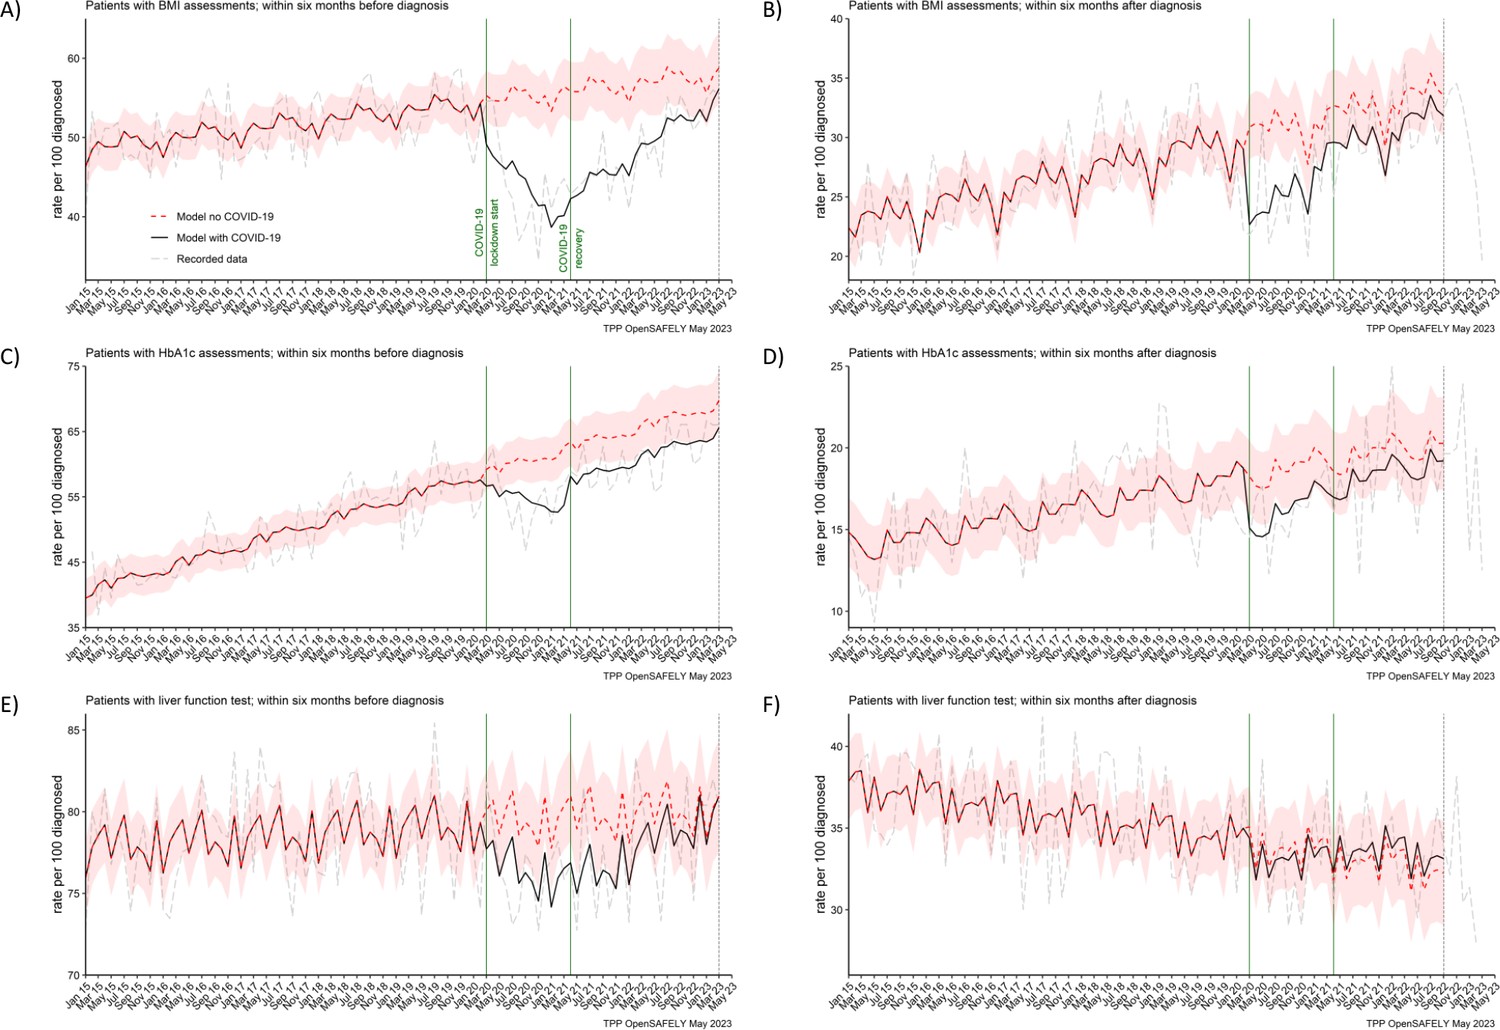
BMI, HbA1c and liver function testing decreased especially prior pancreatic cancer diagnosis.
The observed and predicted (if the COVID-19 pandemic had not happened) monthly rates of (A) and (B) people with at least one body mass index (BMI) assessment before and after pancreatic cancer diagnosis, (C) and (D) people with at least one glycated haemoglobin (HbA1c) assessment before and after pancreatic cancer diagnosis, and (E) and (F) people with at least one liver function assessment before and after pancreatic cancer diagnosis. All rates are per 100 people diagnosed with pancreatic cancer. Generalised linear models were used to predict monthly rates with the 95% confidence intervals to estimate the effect of the pandemic.
Figure 4
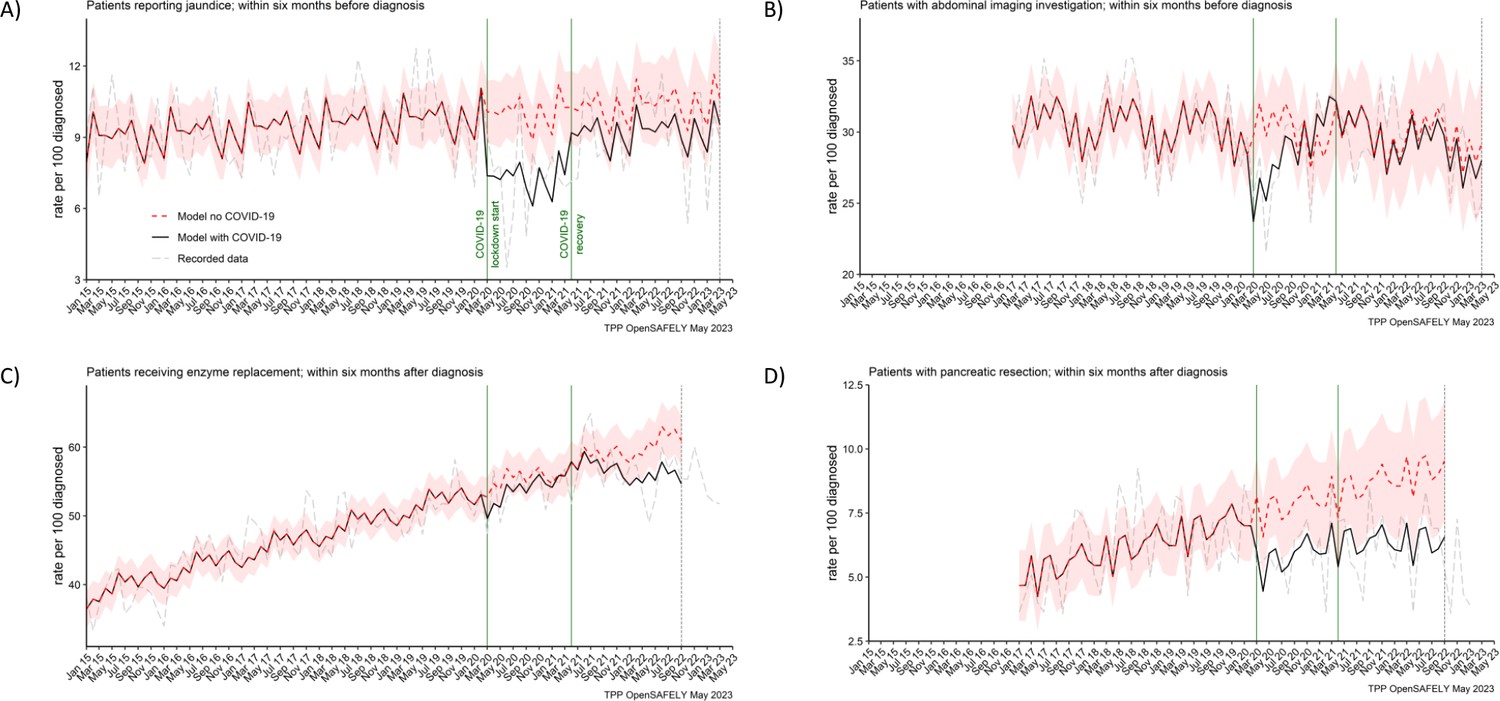
Recording of jaundice, abdominal imaging and surgical resections were negatively affected from the start of the pandemic, with surgical resections not recovering by the end of the study period.
The observed and predicted (as if the COVID-19 pandemic had not happened) monthly rates of people (A) reporting jaundice before the diagnosis, (B) receiving abdominal imagining assessment before the diagnosis, (C) receiving pancreatic enzyme supplementation after the diagnosis, and (D) pancreatic resection within after the diagnosis. Generalised linear models were used to predict monthly rates with the 95% confidence intervals to estimate the effect of the pandemic.
Figure 5
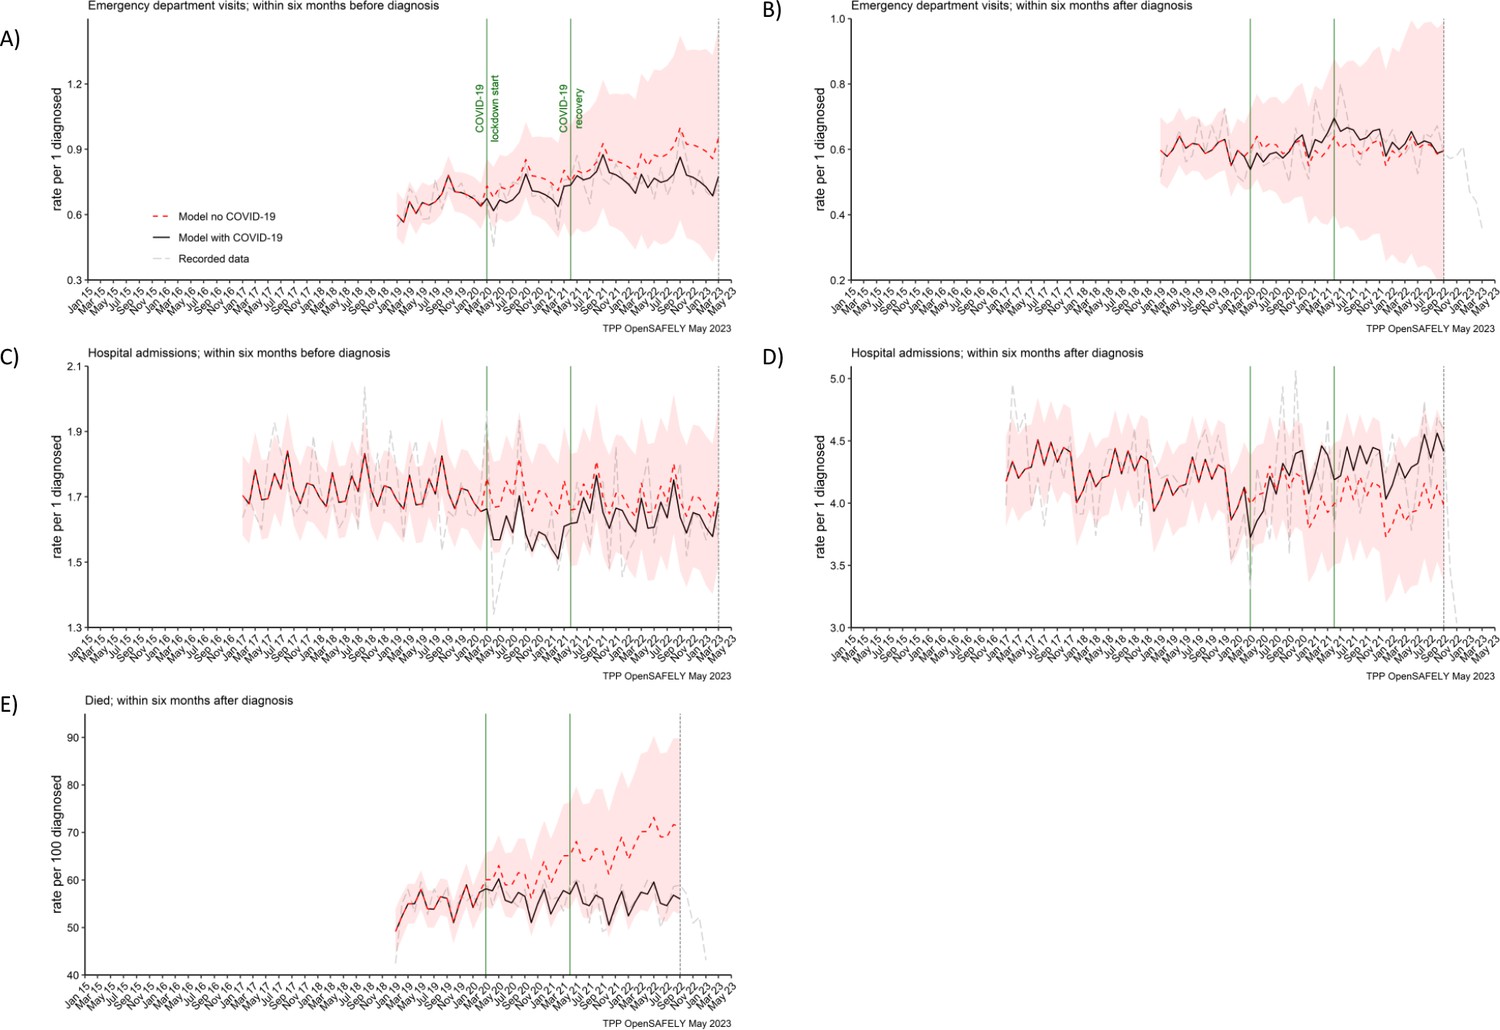
Emergency department visits, hospital admissions and deaths were not affected for people with pancreatic cancer.
The observed and predicted (as if the COVID-19 pandemic had not happened) monthly rates of episodes per 1 participant diagnosed with pancreatic cancer, (A) emergency department visits within 6 months before the diagnosis, (B) emergency department visits within 6 months after, (C) hospital admissions within 6 months before, (D) hospital admissions within 6 months after, and (E) deaths within 6 months after per 100 people diagnosed with pancreatic cancer. Generalised linear models were used to predict monthly rates with the 95% confidence intervals to estimate the effect of the pandemic.
Tables
Table 1
Healthcare services (contacts, appointments, diagnosis, diagnostic tests, routine assessments) and associated time windows for which they were extracted.
Pancreatic cancer diagnosis was an index date. Counts of healthcare services were presented as either monthly rates of people who were diagnosed that month and received a healthcare service within the time window per 100 people diagnosed that month, or number of episodes received within the time window per person diagnosed each month (except for the number of primary care contacts which was analysed per person in contact).
| Healthcare service | Time window | |
|---|---|---|
| Six months before pancreatic cancer diagnosis | Six months after pancreatic cancer diagnosis | |
| Primary care | ||
| Diabetes diagnoses | Any time | |
| Contacts with primary care (these include all contact events, not only healthcare appointments) | ✓ | ✓ |
| BMI assessments | ✓ | ✓ |
| HbA1c assessments | ✓ | ✓ |
| Liver function assessments | ✓ | ✓ |
| Reporting of jaundice | ✓ | ✗ |
| Pancreatic enzyme supplementation | ✗ | ✓ |
| Secondary care | ||
| Abdominal imaging | ✓ | ✗ |
| Pancreatic cancer resection (surgery) | ✗ | ✓ |
| Emergency department visits | ✓ | ✓ |
| Hospital admissions | ✓ | ✓ |
| National mortality register | ||
| Death (any cause) | ✗ | ✓ |
Table 2
Statistical significance of the differences between the observed and predicted monthly rates of healthcare services with 95% confidence intervals.
The pandemic values were predicted based on the pre-pandemic period from 1 January 2015 to 29 February 2020. The lockdown period was from 1 March 2020 to 31 March 2021. The recovery period (the period of easing restrictions) was from 1 April 2021 to 31 March 2023 (or to 30 September 2022 for healthcare services that were evaluated 6 months after diagnosis). The values are the average monthly rates over the period. Unless otherwise specified, the rates are per 100 people diagnosed with pancreatic cancer. *Indicates statistical significance with 95% confidence levels.
| Lockdown period: 1 March 2020 to 31 March 2021 (13 months) | Recovery period: 1 April 2021 to 31 March 2023 (24 months) or 30 September 2022 (18 months for services evaluated 6 months after diagnosis) | |||||
|---|---|---|---|---|---|---|
| Predicted rates (95% CI) | Observed rates | Difference | Predicted rates (95% CI) | Observed rates | Difference | |
| Pancreatic cancer diagnosis (rate per 100,000 people registered) | 1 (1–2) | 1 | 0 (2%) | 1 (1–2) | 1 | 0 (6%) |
| Diabetes diagnosis any time before or after pancreatic cancer diagnosis | 41 (38–44) | 41 | 0 (1%) | 42 (39–45) | 43 | 1 (3%) |
| People with ≥1 primary care contacts within 6 months before pancreatic cancer diagnosis | 92 (90–94) | 91 | −1 (1%) | 97 (95–99) | 95 | −2 (3%)* |
| People with ≥1 primary care contacts within 6 months after pancreatic cancer diagnosis | 87 (84–89) | 88 | 2 (2%) | 91 (89–94) | 91 | 0 (0%) |
| Number of primary care contacts within 6 months before pancreatic cancer diagnosis (per person in contact) | 11 (10–12) | 12 | 1 (8%)* | 11 (10–12) | 13 | 2 (15%) |
| Number of primary care contacts within 6 months after pancreatic cancer diagnosis (per person in contact) | 11 (10–11) | 13 | 2 (18%)* | 11 (10–12) | 12 | 2 (14%)* |
| People with ≥1 BMI assessments within 6 months before pancreatic cancer diagnosis | 55 (52–59) | 44 | −11 (20%)* | 57 (53–61) | 49 | −8 (14%)* |
| People with ≥1 BMI assessments within 6 months after pancreatic cancer diagnosis | 31 (28–34) | 25 | −6 (18%)* | 33 (30–36) | 31 | −2 (7%) |
| People with ≥1 HbA1c assessments within 6 months before pancreatic cancer diagnosis | 60 (57–64) | 55 | −6 (10%)* | 66 (62–70) | 61 | −5 (7%)* |
| People with ≥1 HbA1c assessments within 6 months after pancreatic cancer diagnosis | 19 (16–21) | 16 | −3 (13%) | 20 (17–22) | 18 | −1 (7%) |
| People with ≥1 liver function assessments within 6 months before pancreatic cancer diagnosis | 80 (77–82) | 76 | −3 (4%)* | 80 (77–83) | 78 | −2 (3%) |
| People with ≥1 liver function assessments within 6 months after pancreatic cancer diagnosis | 34 (31–36) | 33 | −1 (2%) | 33 (30–36) | 33 | 1 (2%) |
| People reporting jaundice ≥1 times within 6 months before pancreatic cancer diagnosis | 10 (9–11) | 7 | −3 (28%)* | 10 (9–12) | 9 | −1 (11%) |
| People receiving abdominal scan ≥1 times within 6 months before pancreatic cancer diagnosis | 30 (27–33) | 29 | −2 (5%) | 30 (26–34) | 29 | 0 (2%) |
| People receiving ≥1 prescriptions for enzyme supplements within 6 months after pancreatic cancer diagnosis | 55 (52–58) | 54 | −2 (3%) | 60 (56–63) | 57 | −3 (5%) |
| People receiving pancreatic cancer resection within 6 months after pancreatic cancer diagnosis | 8 (6–10) | 6 | −2 (25%)* | 9 (7–11) | 6 | −2 (28%)* |
| Number of emergency department visits within 6 months before pancreatic cancer diagnosis (per person diagnosed) | 1 (1–1) | 1 | 0 (9%) | 1 (0–1) | 1 | 0 (11%) |
| Number of emergency department visits within 6 months after pancreatic cancer diagnosis (per person diagnosed) | 1 (0–1) | 1 | 0 (1%) | 1 (0–1) | 1 | 0 (5%) |
| Number of hospital admissions within 6 months before pancreatic cancer diagnosis (per person diagnosed) | 2 (2–2) | 2 | 0 (7%) | 2 (1–2) | 2 | 0 (3%) |
| Number of hospital admissions within 6 months after pancreatic cancer diagnosis (per person diagnosed) | 4 (4–5) | 4 | 0 (2%) | 4 (3–5) | 4 | 0 (8%) |
| People who died within 6 months after pancreatic cancer diagnosis | 61 (53–69) | 56 | −5 (8%) | 68 (53–82) | 56 | −12 (17%) |
Additional files
-
MDAR checklist
- https://cdn.elifesciences.org/articles/85332/elife-85332-mdarchecklist1-v1.pdf
-
Supplementary file 1
Study flowchart diagram.
- https://cdn.elifesciences.org/articles/85332/elife-85332-supp1-v1.pdf
Download links
A two-part list of links to download the article, or parts of the article, in various formats.
Downloads (link to download the article as PDF)
Open citations (links to open the citations from this article in various online reference manager services)
Cite this article (links to download the citations from this article in formats compatible with various reference manager tools)
Healthcare in England was affected by the COVID-19 pandemic across the pancreatic cancer pathway: A cohort study using OpenSAFELY-TPP
eLife 12:e85332.
https://doi.org/10.7554/eLife.85332


