Megafaunal extinctions, not climate change, may explain Holocene genetic diversity declines in Numenius shorebirds
- Department of Biological Sciences, National University of Singapore, Singapore
- Naturalis Biodiversity Center, Netherlands
- BirdLife international, United Kingdom
- Department of Bioinformatics and Genetics, Swedish Museum of Natural History, Sweden
- Department of Biology, St. Mary's University, Canada
Figures
Figure 1 with 3 supplements
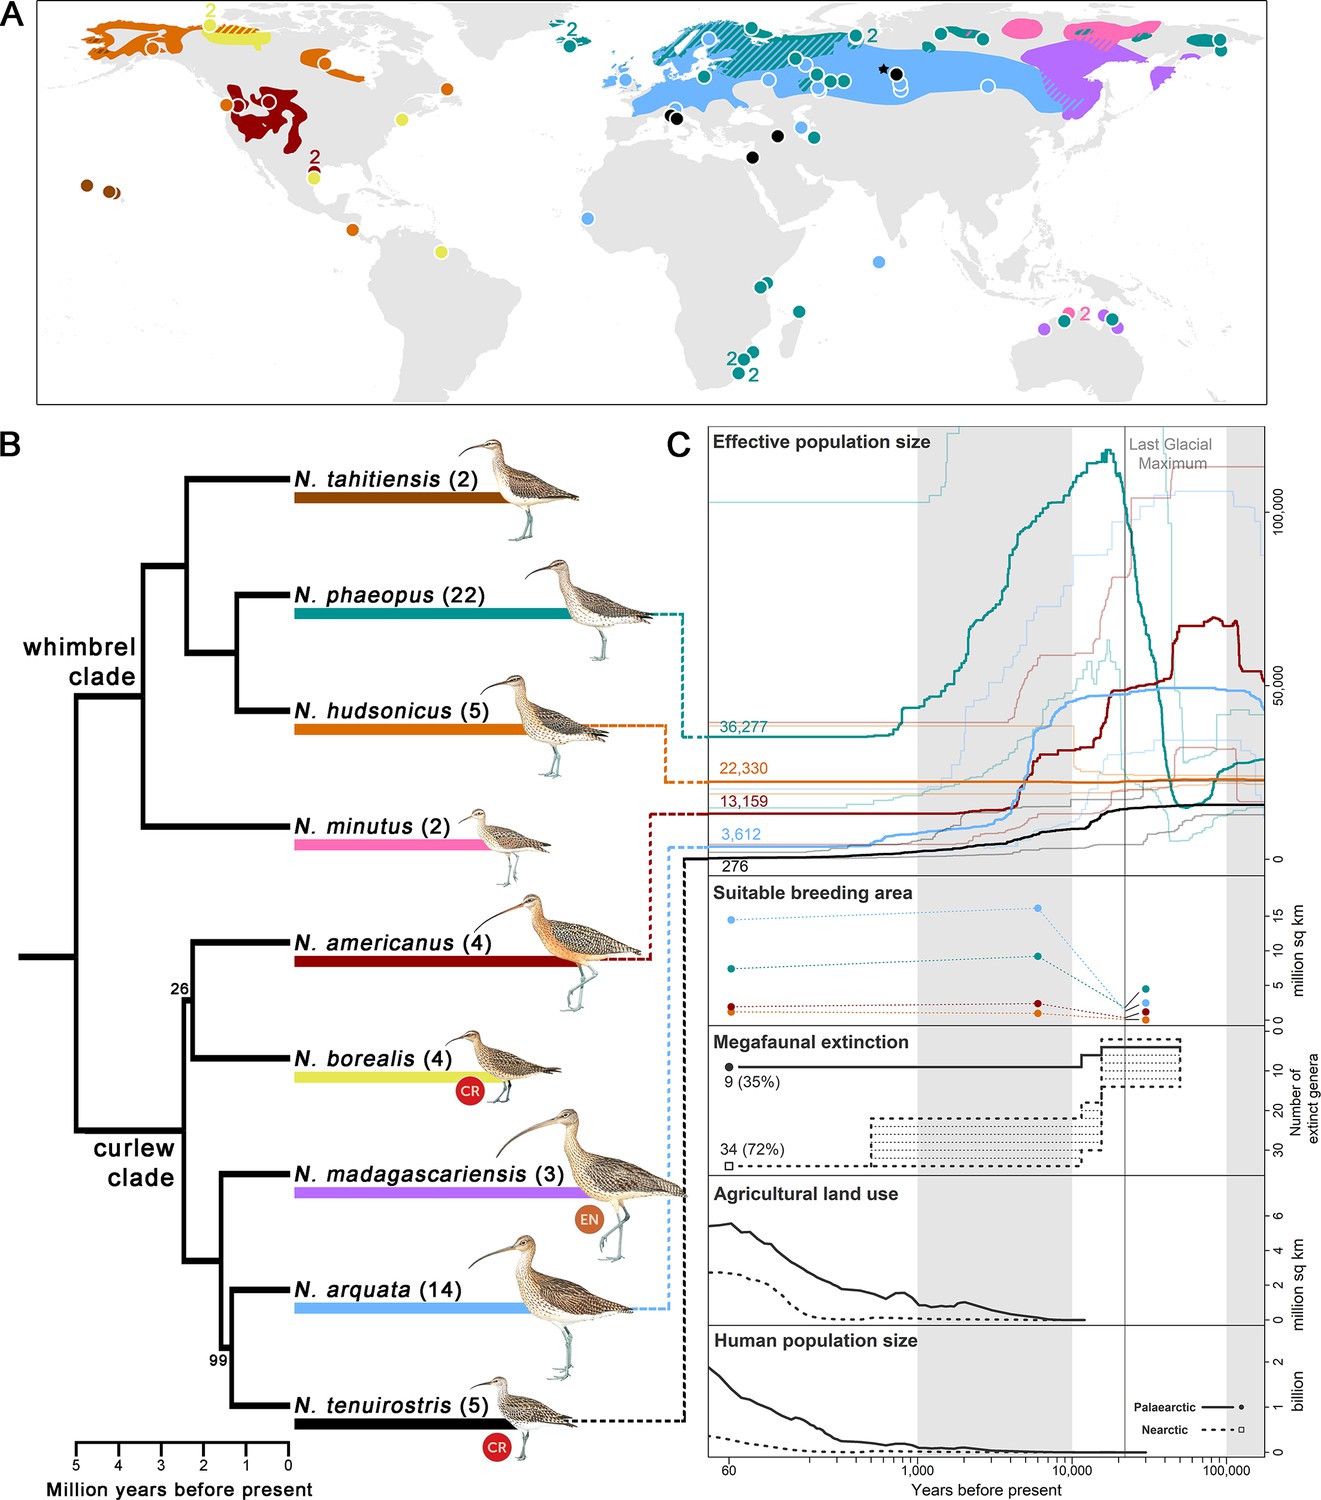
Numenius phylogenomic relationships and Quaternary population trajectories.
(A) Breeding distribution map and sampling localities of each Numenius species (BirdLife International and Handbook of the Birds of the World, 2017; Lappo et al., 2012); wintering and migratory ranges are not shown. Colors correspond to species identities in (B). Diagonal lines denote regions with co-distributed species. Each circle represents one sample unless otherwise specified by an adjacent number. The only known breeding records of N. tenuirostris were from near the village of Krasnoperova c.10 km south of Tara, Omsk (Russia), which is denoted by a black star (★), although this might not have been the core breeding area. (B) Phylogenomic tree constructed from an alignment of 514,771 bp across 524 sequence loci. Tree topology (including bootstrap support values) and divergence times were estimated with MP-EST and MCMCTree, respectively. Only bootstrap <100 is displayed. Sample sizes for each species are given in brackets. IUCN Red List status of critically endangered (CR) and endangered (EN) species is indicated. (C) Results of demographic history reconstruction using stairway plot for selected species displayed with key climatic, biotic, and anthropogenic events. Effective population size: Line colors correspond to species identities in the tree in (B) and numbers at present time represent present-day effective population sizes. Thick lines represent the median effective population size while thin lines represent the 2.5 and 97.5 percentile estimations. The vertical gray line denotes the Last Glacial Maximum (LGM) and panels are shaded to aid reference to the time axis. Suitable breeding area: predicted suitable breeding area at LGM (22,000 years ago), mid-Holocene (6,000 years ago), and present-day (1960–1990) using Maxent. Dot colors correspond to species identities in the tree in (B). Dotted lines connecting the dots are for visualization purposes and do not represent fluctuations in the breeding area. The following panels display the timings of key climatic, biotic and anthropogenic events, including megafaunal extinction (in terms of the number of extinct genera with dotted shading denoting uncertainty in estimates; Koch and Barnosky, 2006), agricultural land use, and human population size (HYDE 3.2; Klein Goldewijk et al., 2017; Klein Goldewijk et al., 2010). Line type corresponds to geographical area (Nearctic versus Palaearctic) as denoted in the ‘Human population size’ panel.
© 2023, Lynx Edicions. Illustrations of Numenius birds in Figure 1B were reproduced with permission from Lynx Edicions. The illustrations are not covered by a CC-BY 4.0 license and further reproduction of this panel would need permission from the copyright holder.
Figure 1—figure supplement 1
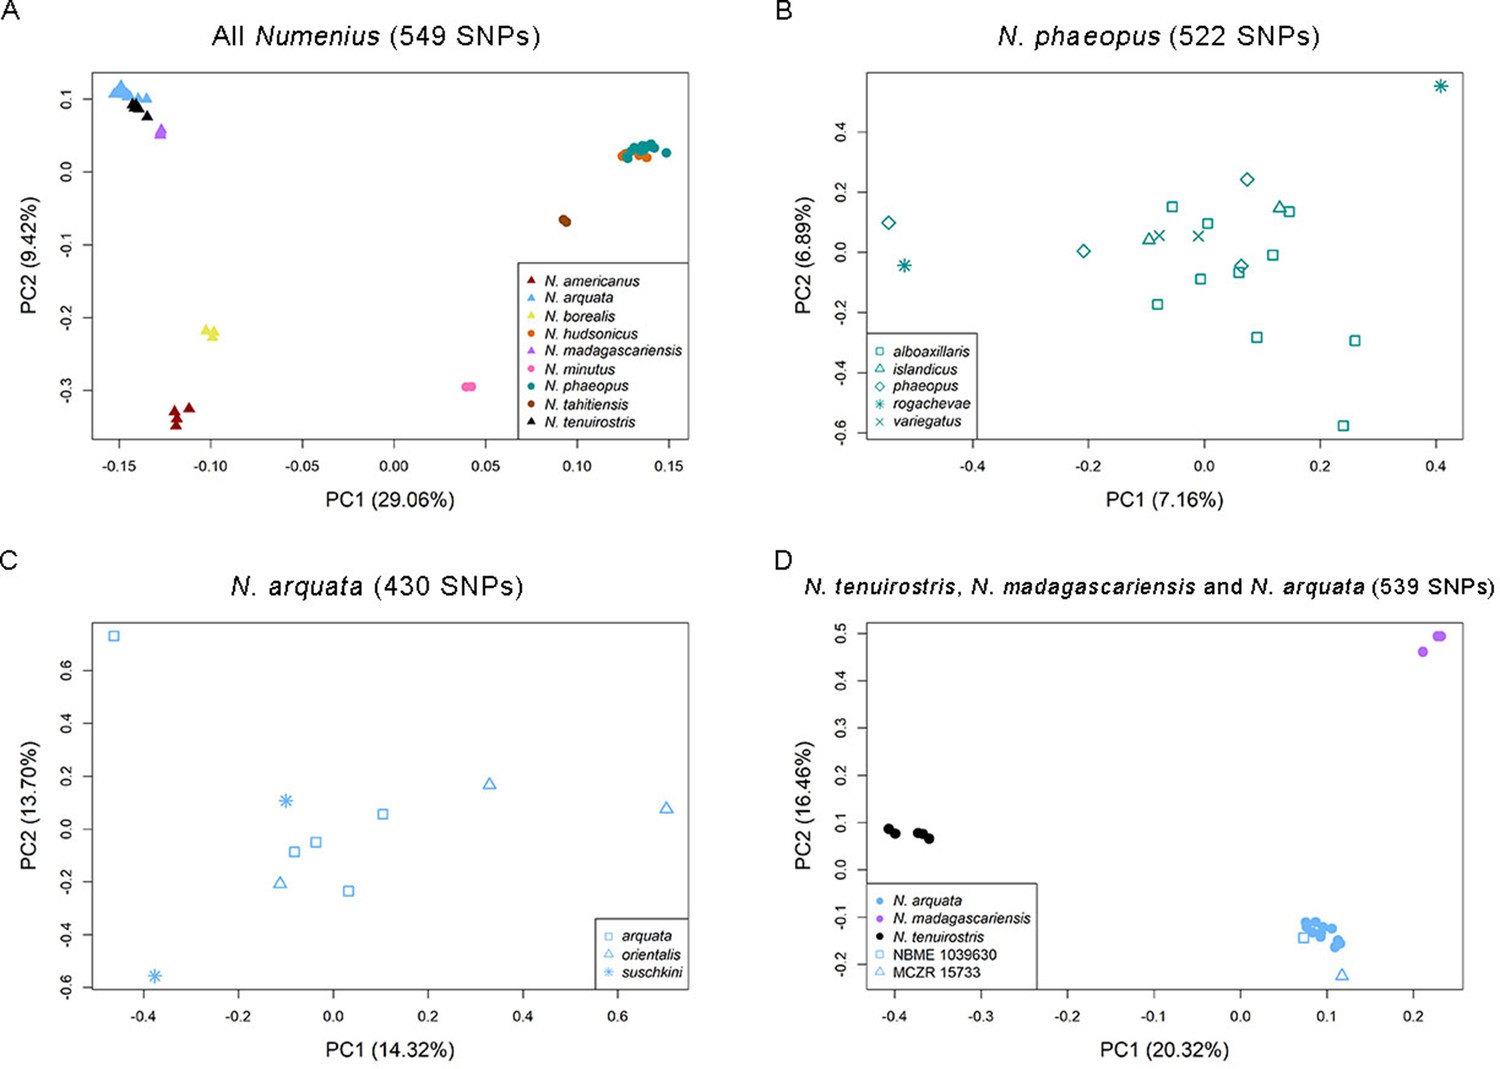
Principal component (PC) analysis of Numenius samples, with the percentage of variation of the two most important PCs displayed.
Colors correspond to species identities in Figure 1. The four plots display PC analyses of (A) all Numenius species, (B) Eurasian whimbrel N. phaeopus (broken down by subspecies), (C) Eurasian curlew N. arquata (broken down by subspecies), and (D) Palaearctic curlews N. tenuirostris, N. madagascariensis, and N. arquata.
Figure 1—figure supplement 2
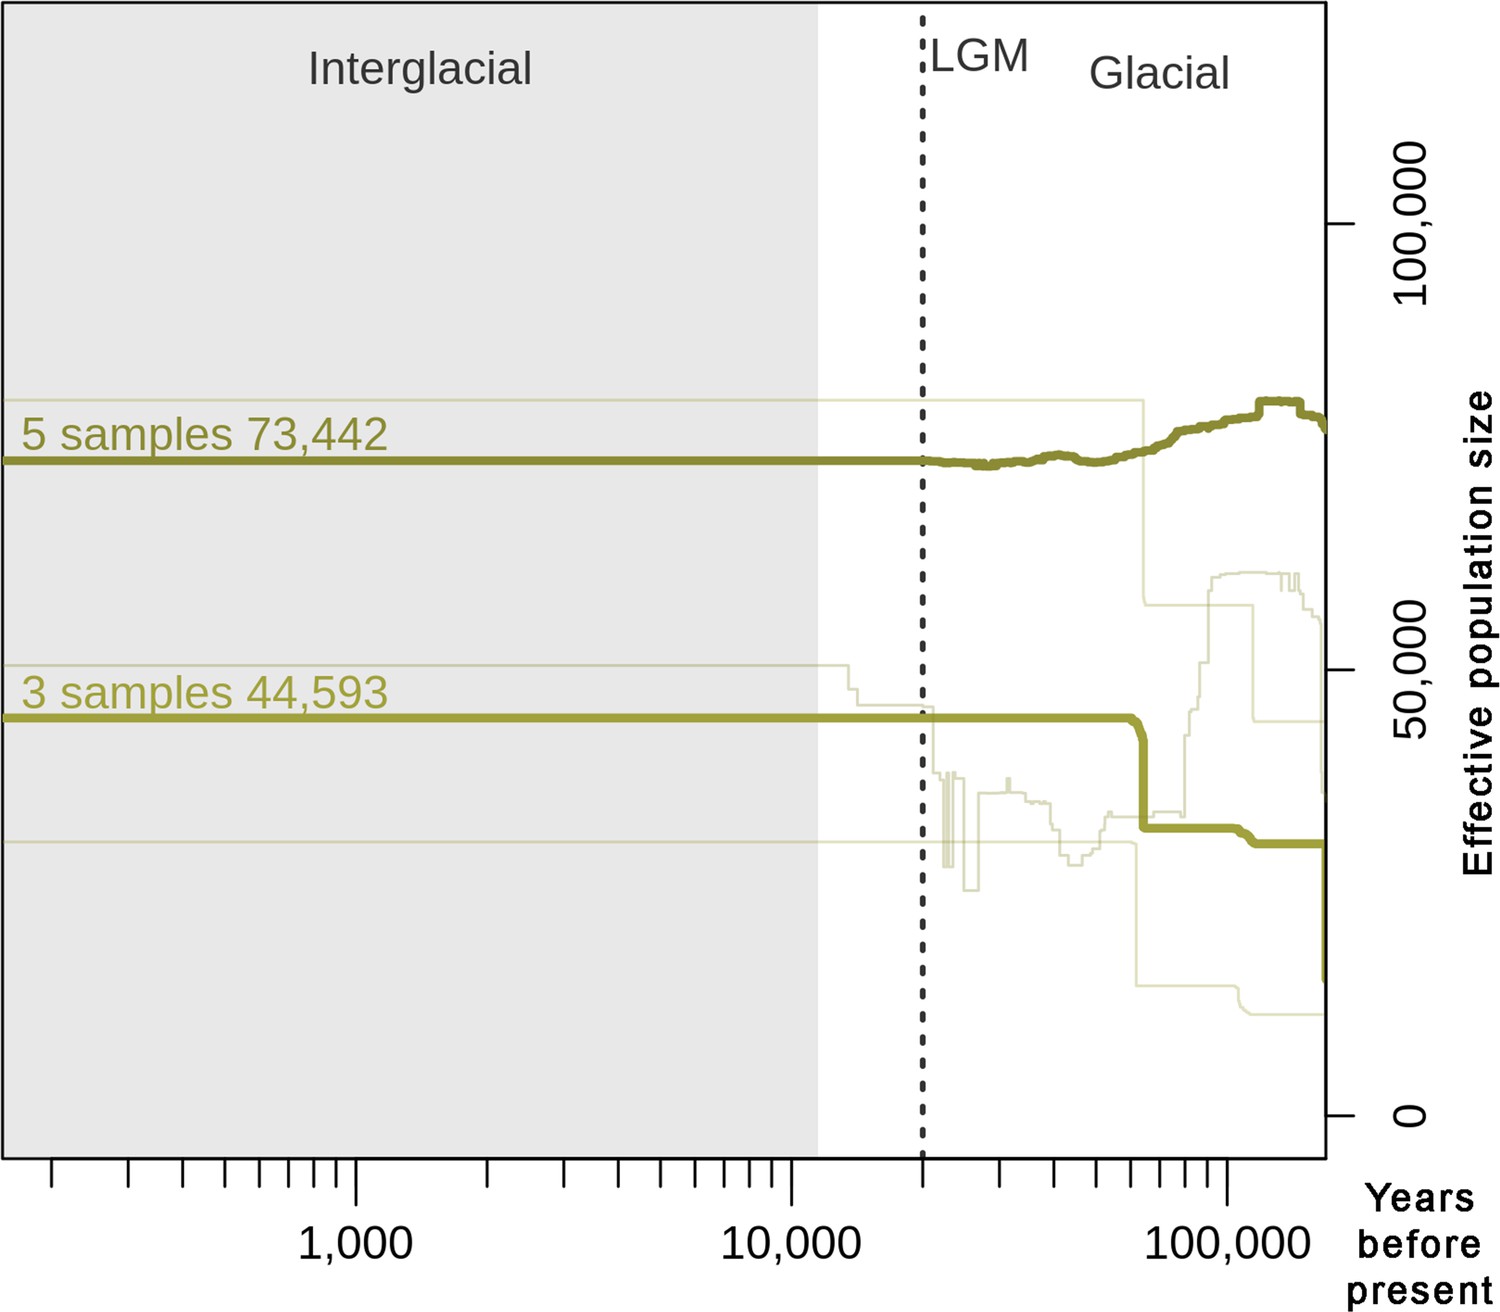
Demographic history reconstruction using stairway plot for N. borealis, showing results for two datasets, one containing all five samples and the other a subset of three samples with low missingness.
Present-day effective population size of each dataset is indicated above the lines.
Figure 1—figure supplement 3

Visualization of the ecological niche model results in green corresponding to a higher probability of presence and brown corresponding to a lower probability.
Gray areas show the area for which Maxent analyses were performed. Numbers below each plot represent the total suitable breeding area for each study species at the respective time periods.
Additional files
-
Supplementary file 1
Sampling information.
Legend: Details of samples collected for this study.
- https://cdn.elifesciences.org/articles/85422/elife-85422-supp1-v1.docx
-
Supplementary file 2
Evolutionary distinctness of Numenius species.
Legend: Evolutionary distinctness, phylogenetic diversity, and evolutionarily distinct and globally endangered (EDGE) scores of Numenius species.
- https://cdn.elifesciences.org/articles/85422/elife-85422-supp2-v1.docx
-
Supplementary file 3
Ecological niche modeling information.
Legend: Details of occurrence points, parameters, and results of ecological niche modeling using Maxent.
- https://cdn.elifesciences.org/articles/85422/elife-85422-supp3-v1.docx
-
MDAR checklist
- https://cdn.elifesciences.org/articles/85422/elife-85422-mdarchecklist1-v1.pdf
Download links
A two-part list of links to download the article, or parts of the article, in various formats.
Downloads (link to download the article as PDF)
Open citations (links to open the citations from this article in various online reference manager services)
Cite this article (links to download the citations from this article in formats compatible with various reference manager tools)
Megafaunal extinctions, not climate change, may explain Holocene genetic diversity declines in Numenius shorebirds
eLife 12:e85422.
https://doi.org/10.7554/eLife.85422


