The role of migration networks in the development of Botswana’s generalized HIV epidemic
- Center for Biomedical Modeling, Department of Psychiatry and Biobehavioral Sciences, Semel Institute for Neuroscience and Human Behavior, David Geffen School of Medicine, University of California, Los Angeles, United States
- The African Comprehensive HIV/AIDS Partnerships (ACHAP), Botswana
- Sorbonne Université, INSERM, Institut Pierre Louis d’Epidémiologie et de Santé Publique, France
Figures
Figure 1
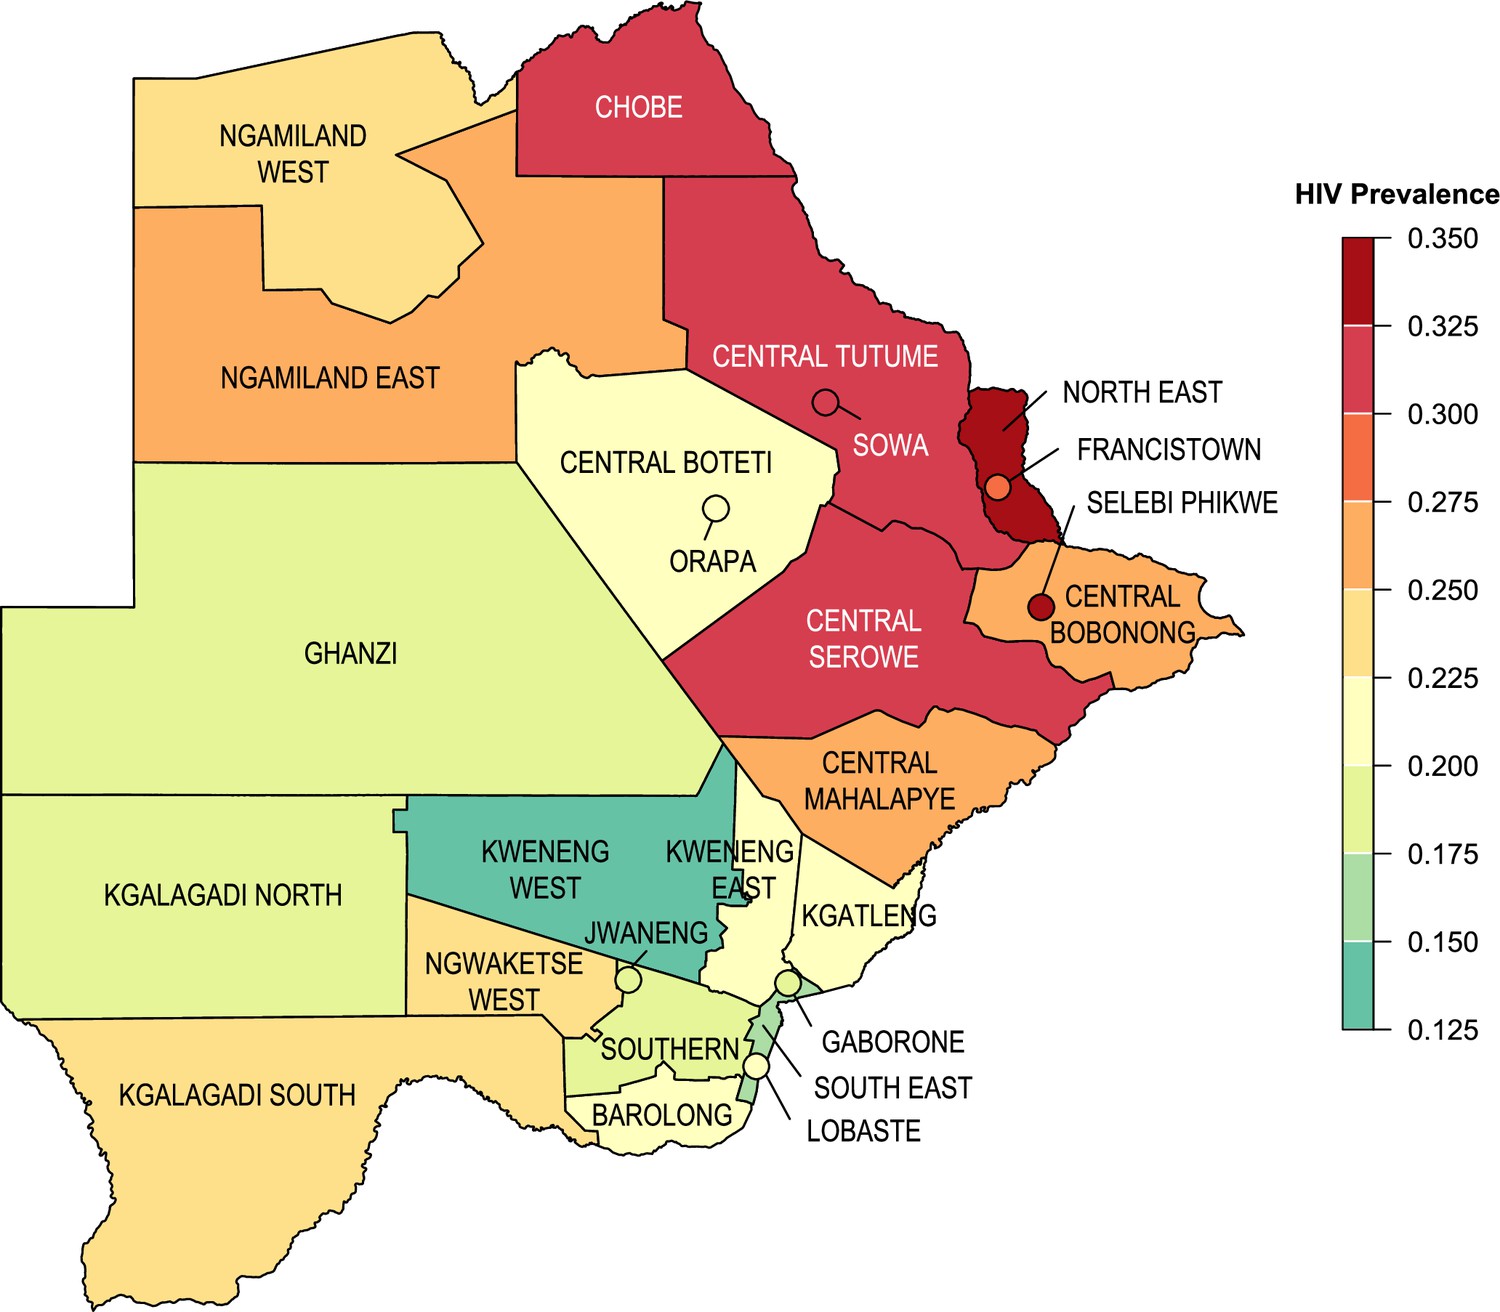
HIV prevalence at the district-level.
HIV prevalence estimated using BAIS III data (2008) for adults ages 15–69. Botswana’s two cities and five towns are denoted with circles. Districts for the Okavango Delta and Central Kgalagadi Game Reserve have been geographically incorporated into Ngamiland West and Ghanzi, respectively, due to their small population sizes.
Figure 2
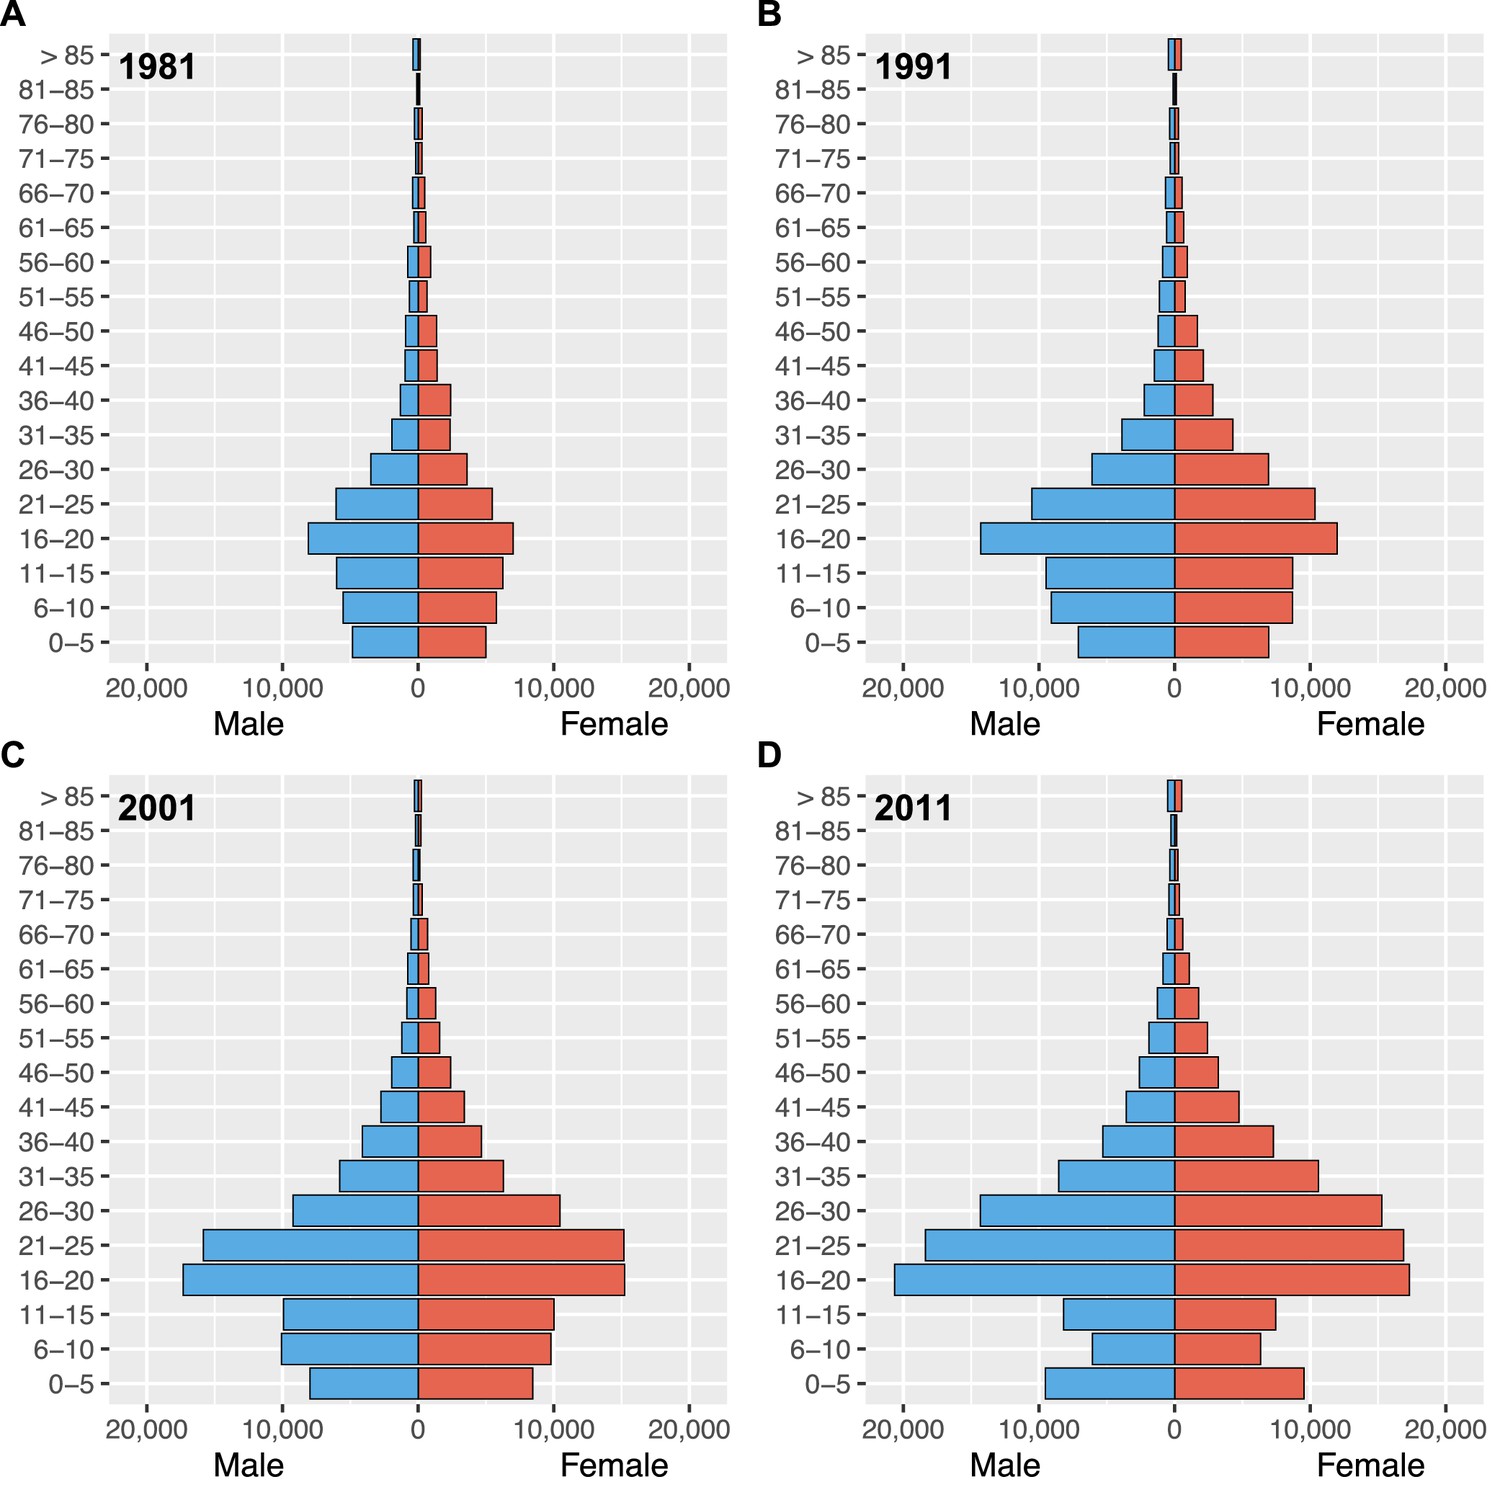
Gender-stratified age profiles of internal migrants by census year.
(A) 1981, (B) 1991, (C) 2001, and (D) 2011.
Figure 3 with 2 supplements
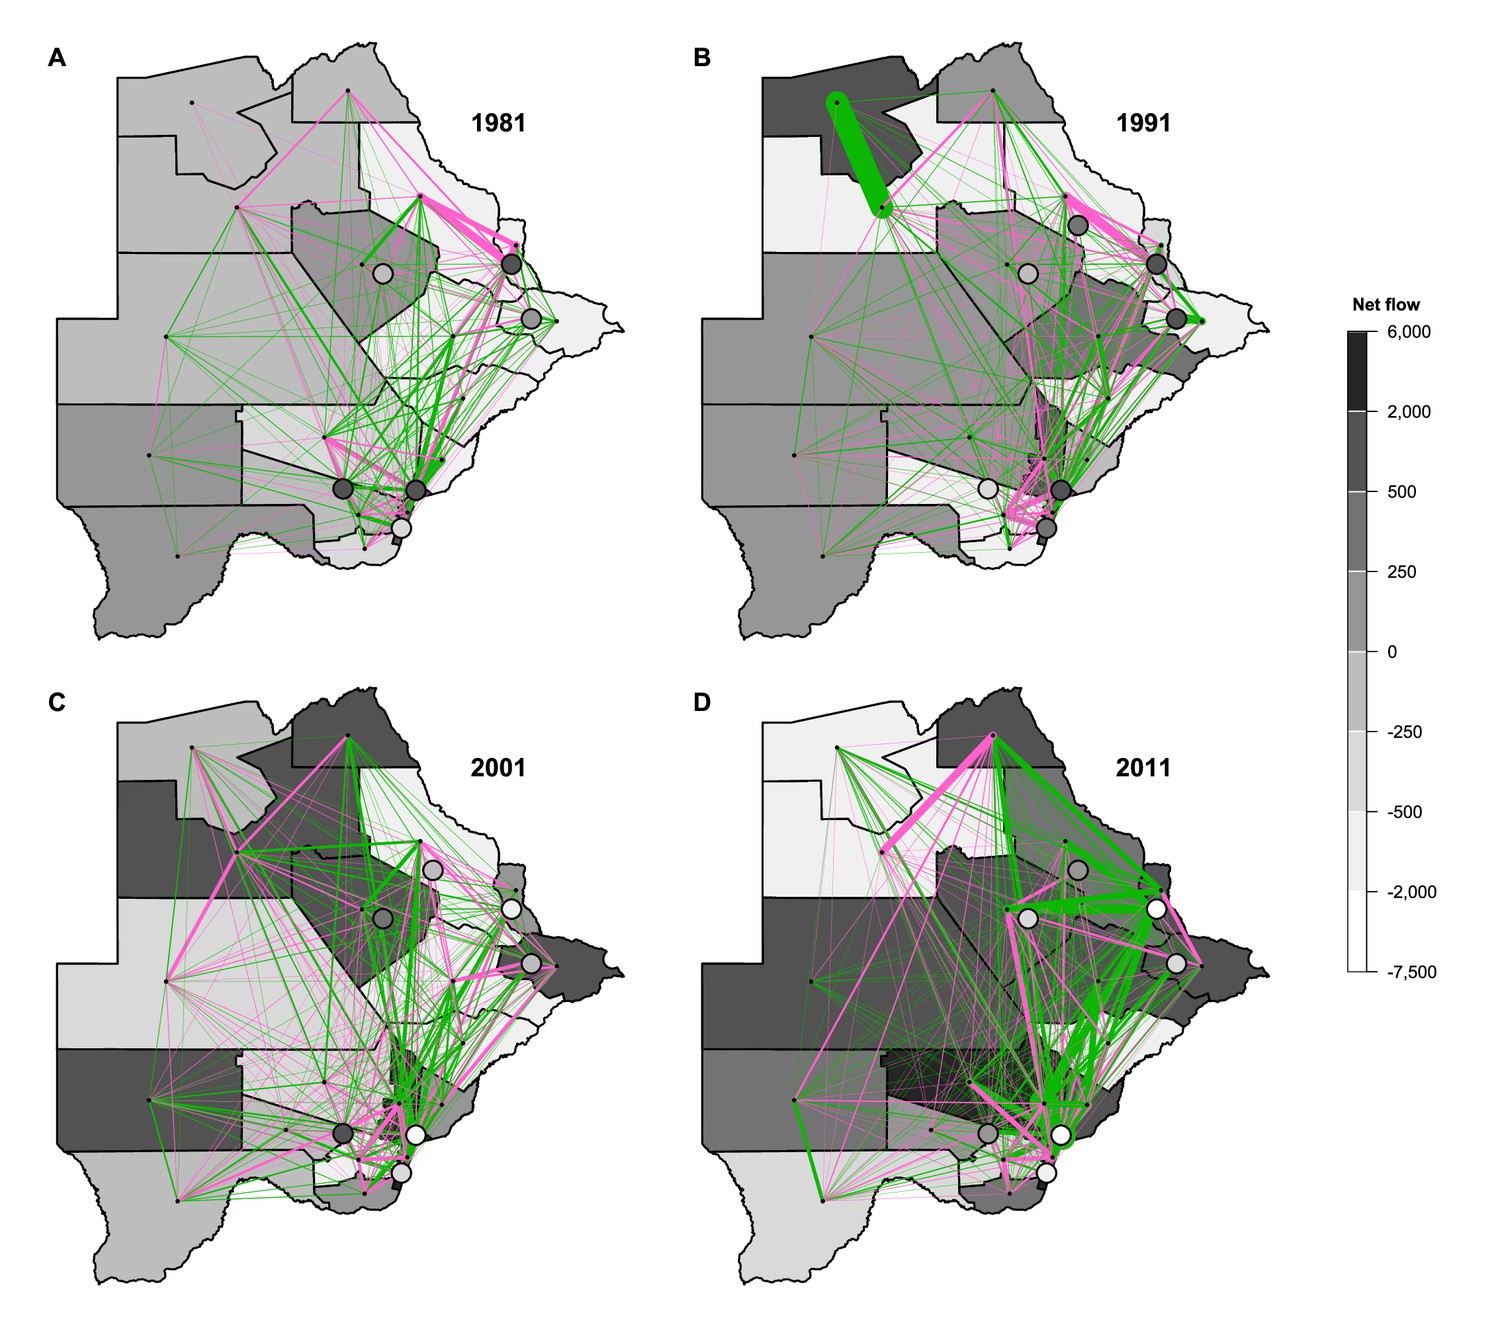
Maps of net migratory flows by census year.
(A) 1981, (B) 1991, (C) 2001, and (D) 2011. Maps show the net migratory flows between any two districts (pink and green lines). Line thickness indicates the magnitude of the flow between districts, line color indicates the flow direction. Pink lines denote eastward flows, green lines denote westward flows. For example, in 1991, the thickest green line indicates a large (westward) migratory flow from Ngamiland East to Ngamiland West. Each district is shaded to indicate the total net flow of all migrations into and out of it. Cities and towns are represented with circles. Districts for the Okavango Delta and Central Kgalagadi Game Reserve have been geographically incorporated into Ngamiland West and Ghanzi, respectively, due to their small population sizes.
Figure 3—figure supplement 1
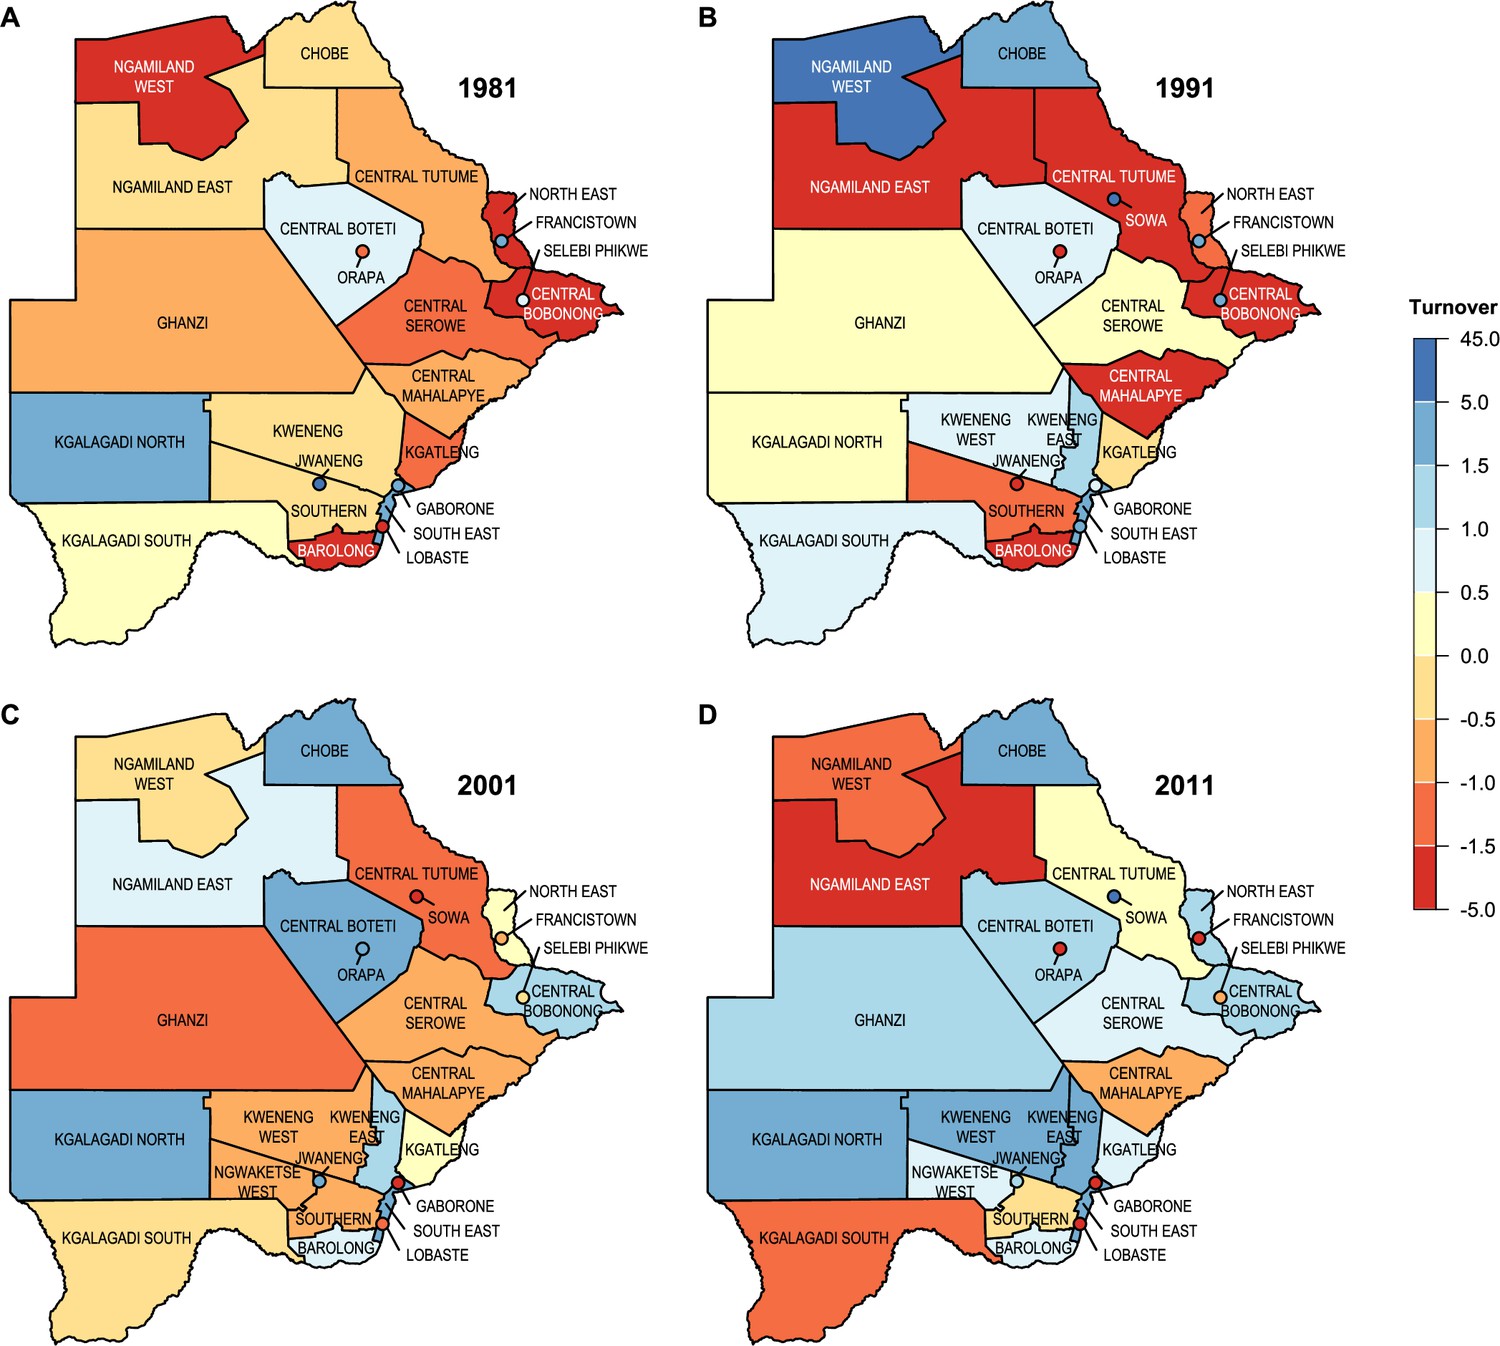
Maps of turnover by census year.
(A) 1981, (B) 1991, (C) 2001, and (D) 2011. The turnover rate provides a measure of net flow for a district per hundred residents. Botswana’s two cities and five towns are denoted with circles. Districts for the Okavango Delta and Central Kgalagadi Game Reserve have been geographically incorporated into Ngamiland West and Ghanzi, respectively, due to their small population sizes.
Figure 3—figure supplement 2
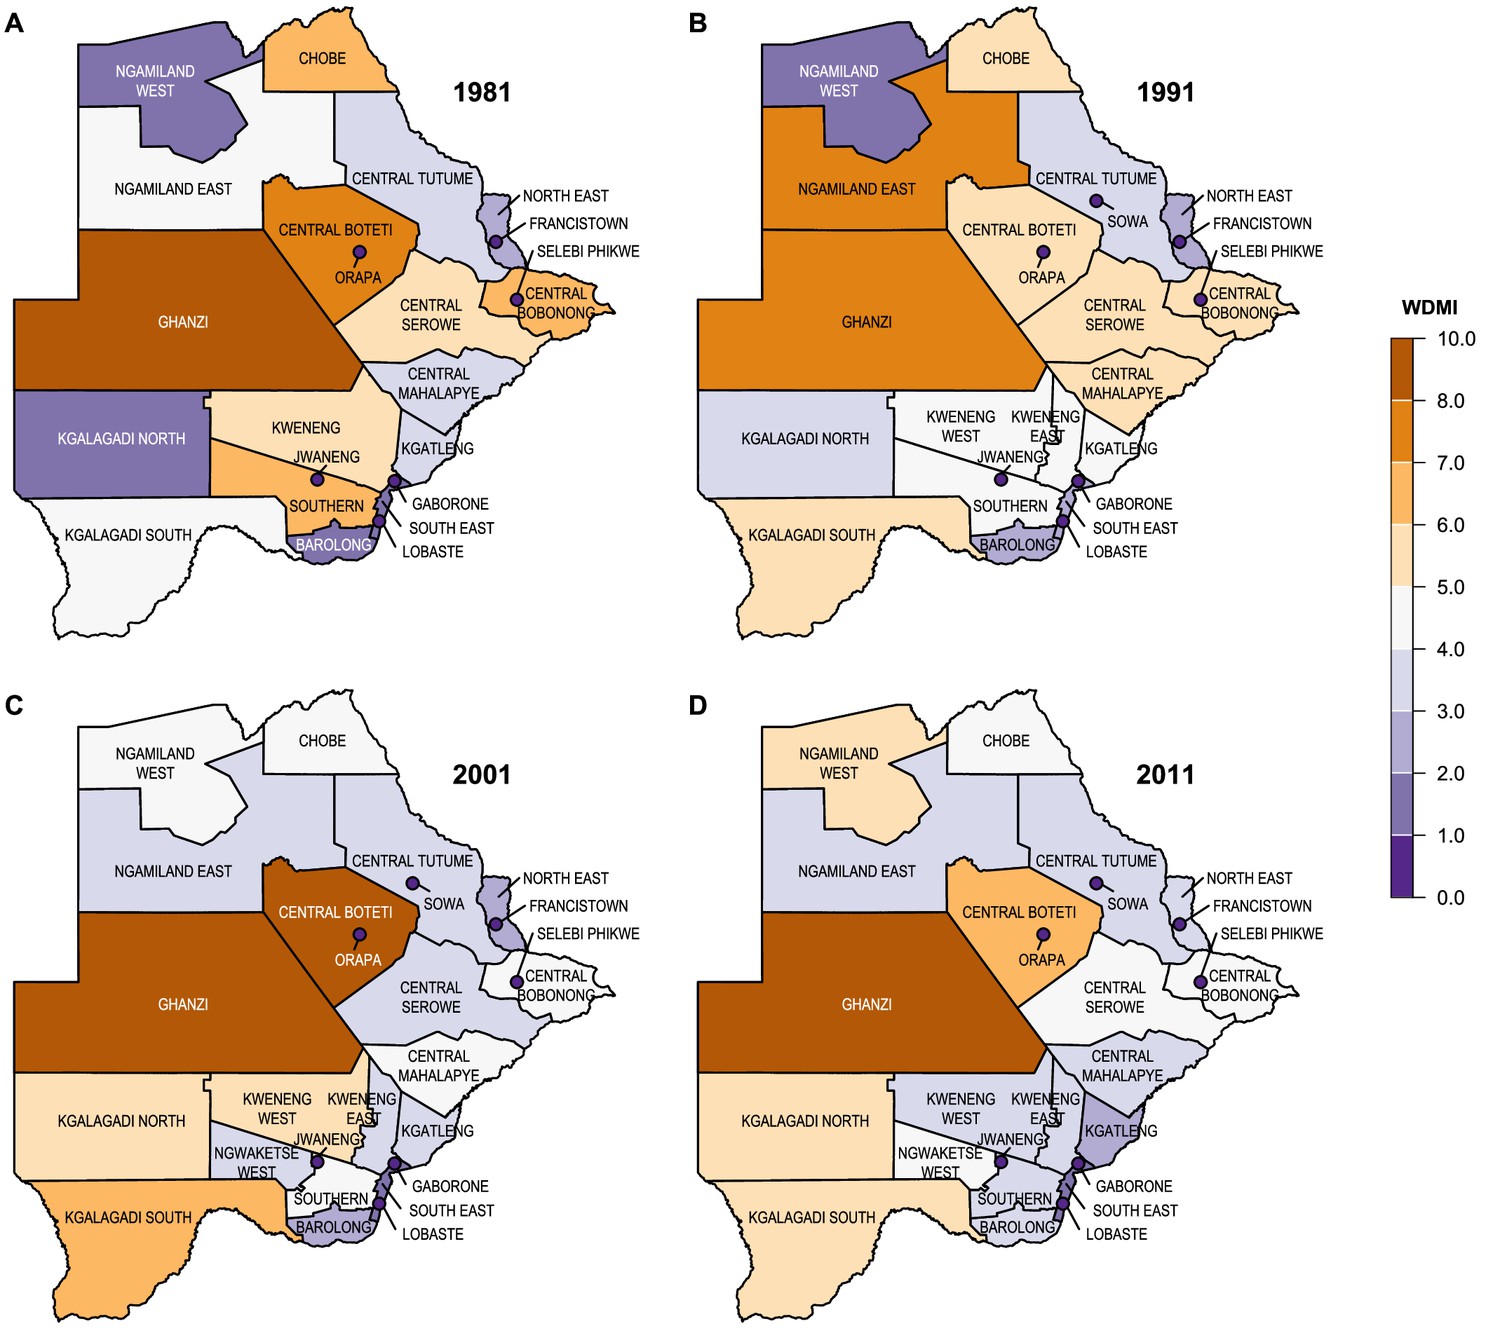
Maps of within district migration intensity (WDMI) by census year.
(A) 1981, (B) 1991, (C) 2001, and (D) 2011. The WDMI for each district is the number of internal movements per hundred residents. Botswana’s two cities and five towns are denoted with circles. Districts for the Okavango Delta and Central Kgalagadi Game Reserve have been geographically incorporated into Ngamiland West and Ghanzi, respectively, due to their small population sizes.
Figure 4
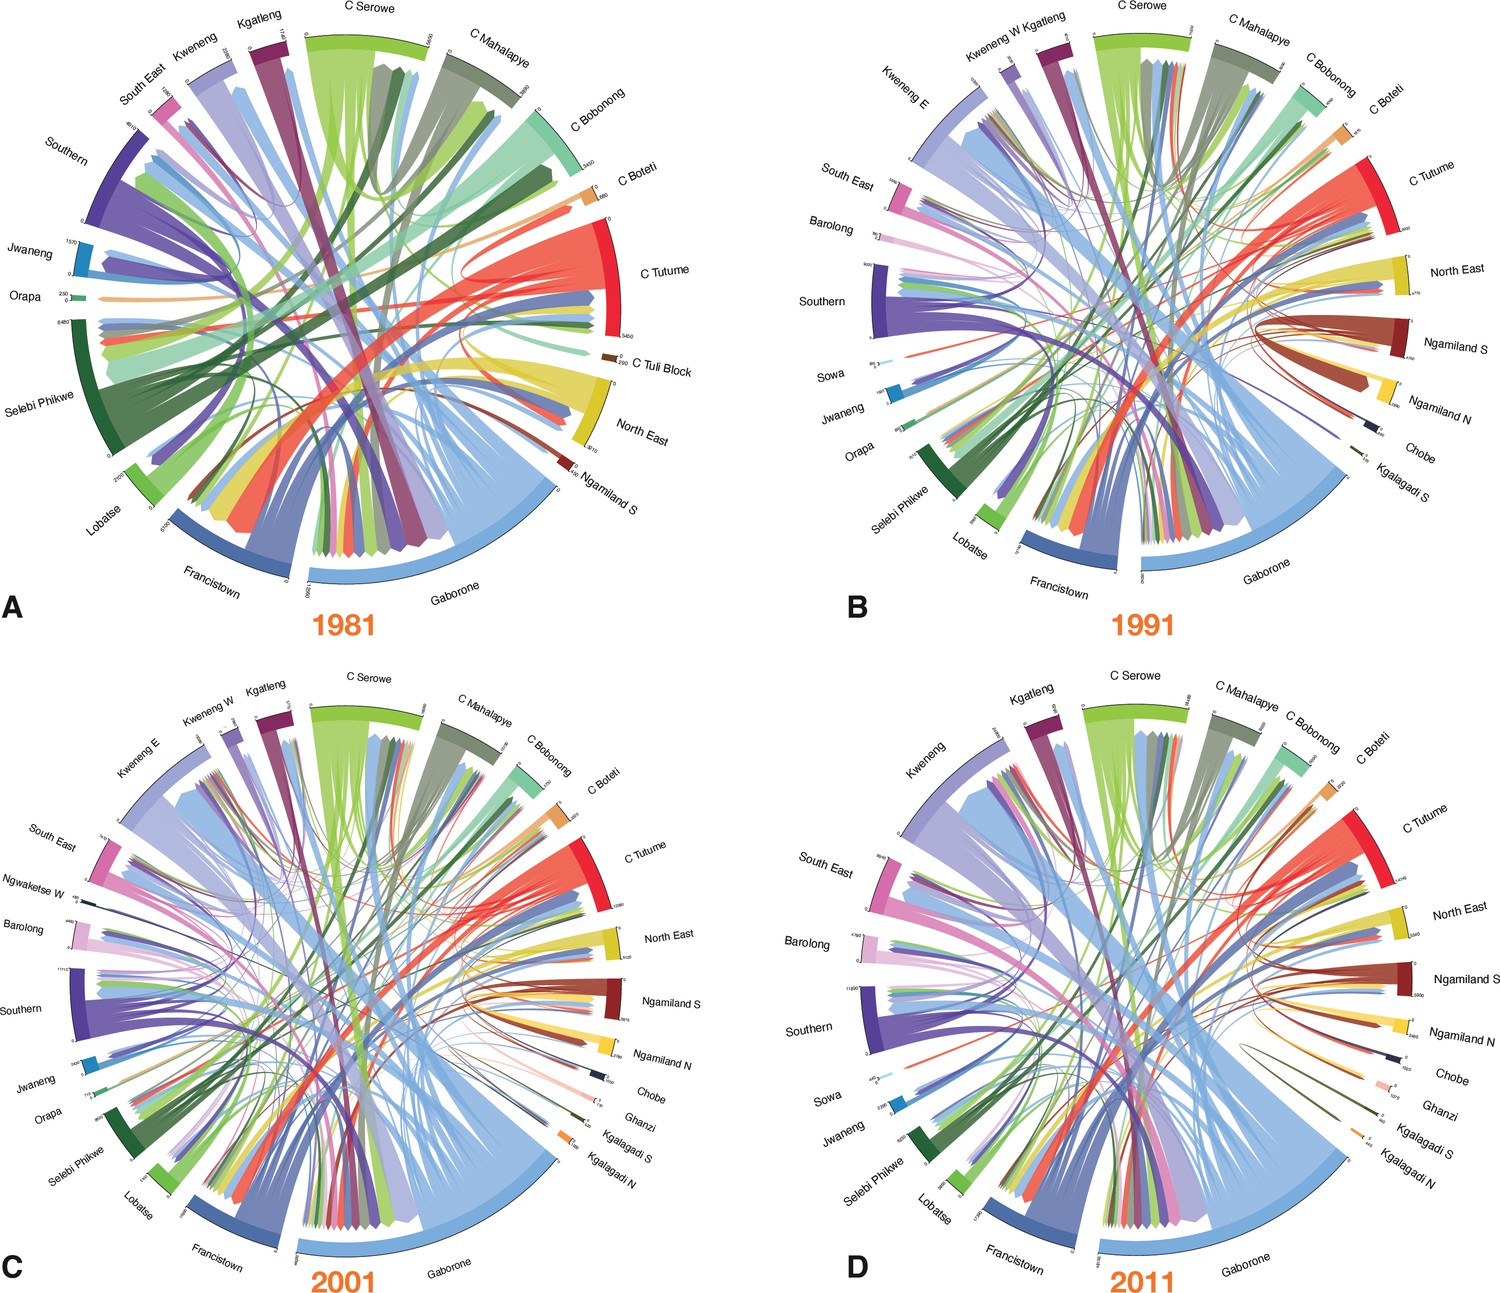
Chord diagrams by census year.
(A) 1981, (B) 1991, (C) 2001, and (D) 2011. Each diagram shows the internal migration network of the general population in the 12 mo prior to the census. Each color represents a different district. The thickness of each line is proportional to the number of migrants that moved between the two connected districts. The angular width of each district is proportional to the total number of migrants who moved into, or out of, that district. For clarity, in (A–C) only connections with greater than 200 migrants are shown, and in (D) only connections with greater than 400 migrants are shown. Consequently, some districts are not shown in the chord diagram. The total number of migrants (in and out) of every district is listed in Supplementary file 1.
Figure 5
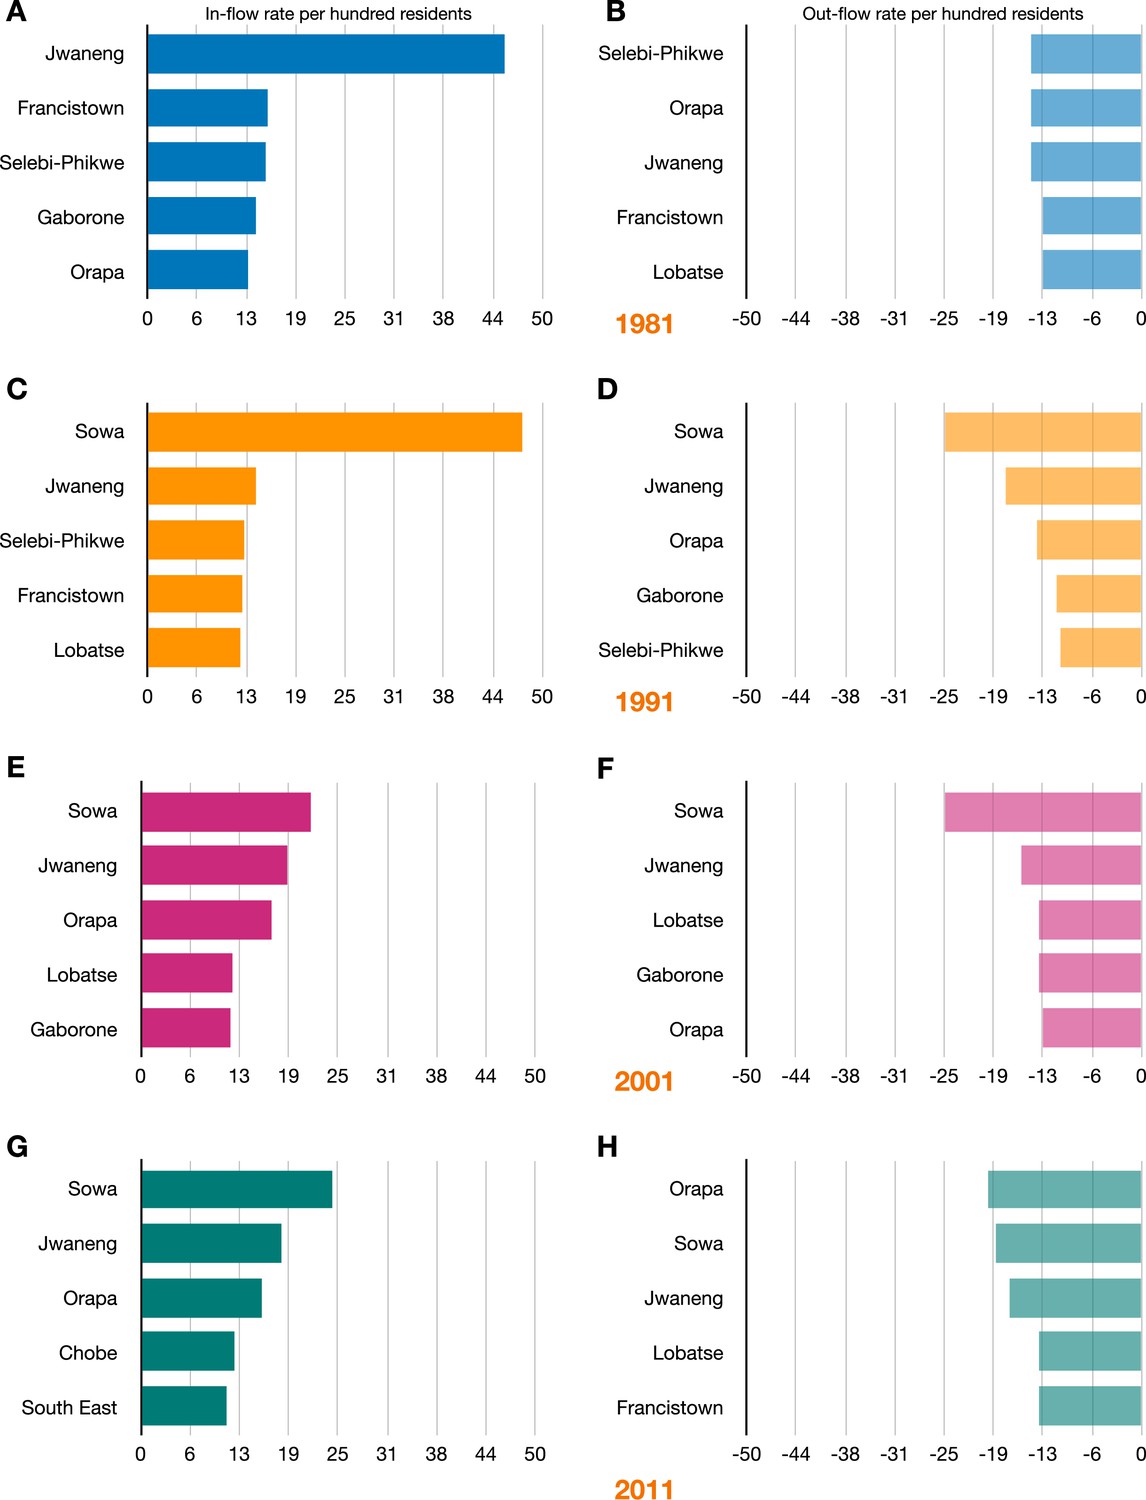
The top five in-flow and out-flow migration hubs by census year.
In-flow hubs are sorted by the rate per hundred residents of a district’s population that moves in from another district; out-flow hubs are sorted by the rate per hundred residents of a district’s population that moves out to another district. (A) Top in-flow hubs in 1981. (B) Top out-flow hubs in 1981. (C) Top in-flow hubs in 1991. (D) Top out-flow hubs in 1991. (E) Top in-flow hubs in 2001. (F) Top out-flow hubs in 2001. (G) Top in-flow hubs in 2011. (H) Top out-flow hubs in 2011.
Figure 6
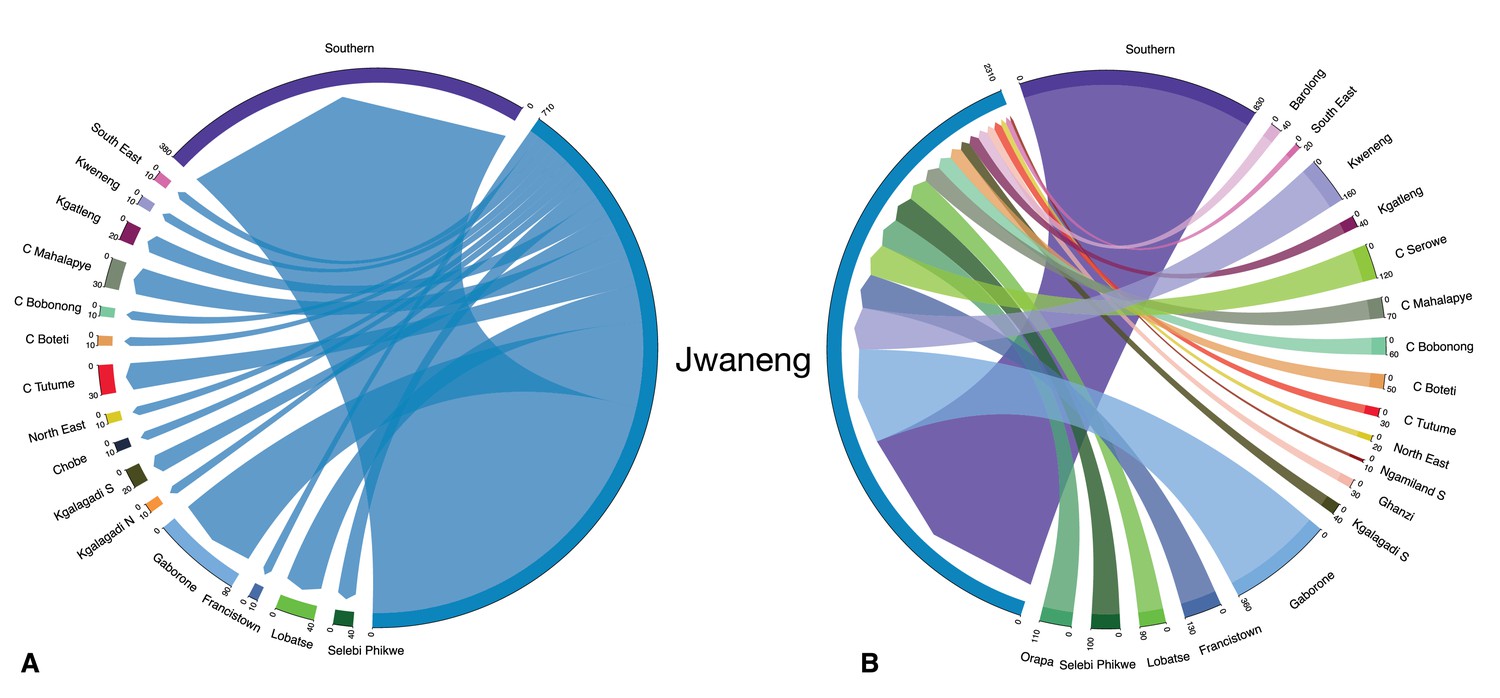
Ego network of Jwaneng.
The chord diagrams show migrants flowing (A) out of, and (B) into, the diamond mining town in 1981.
Figure 7
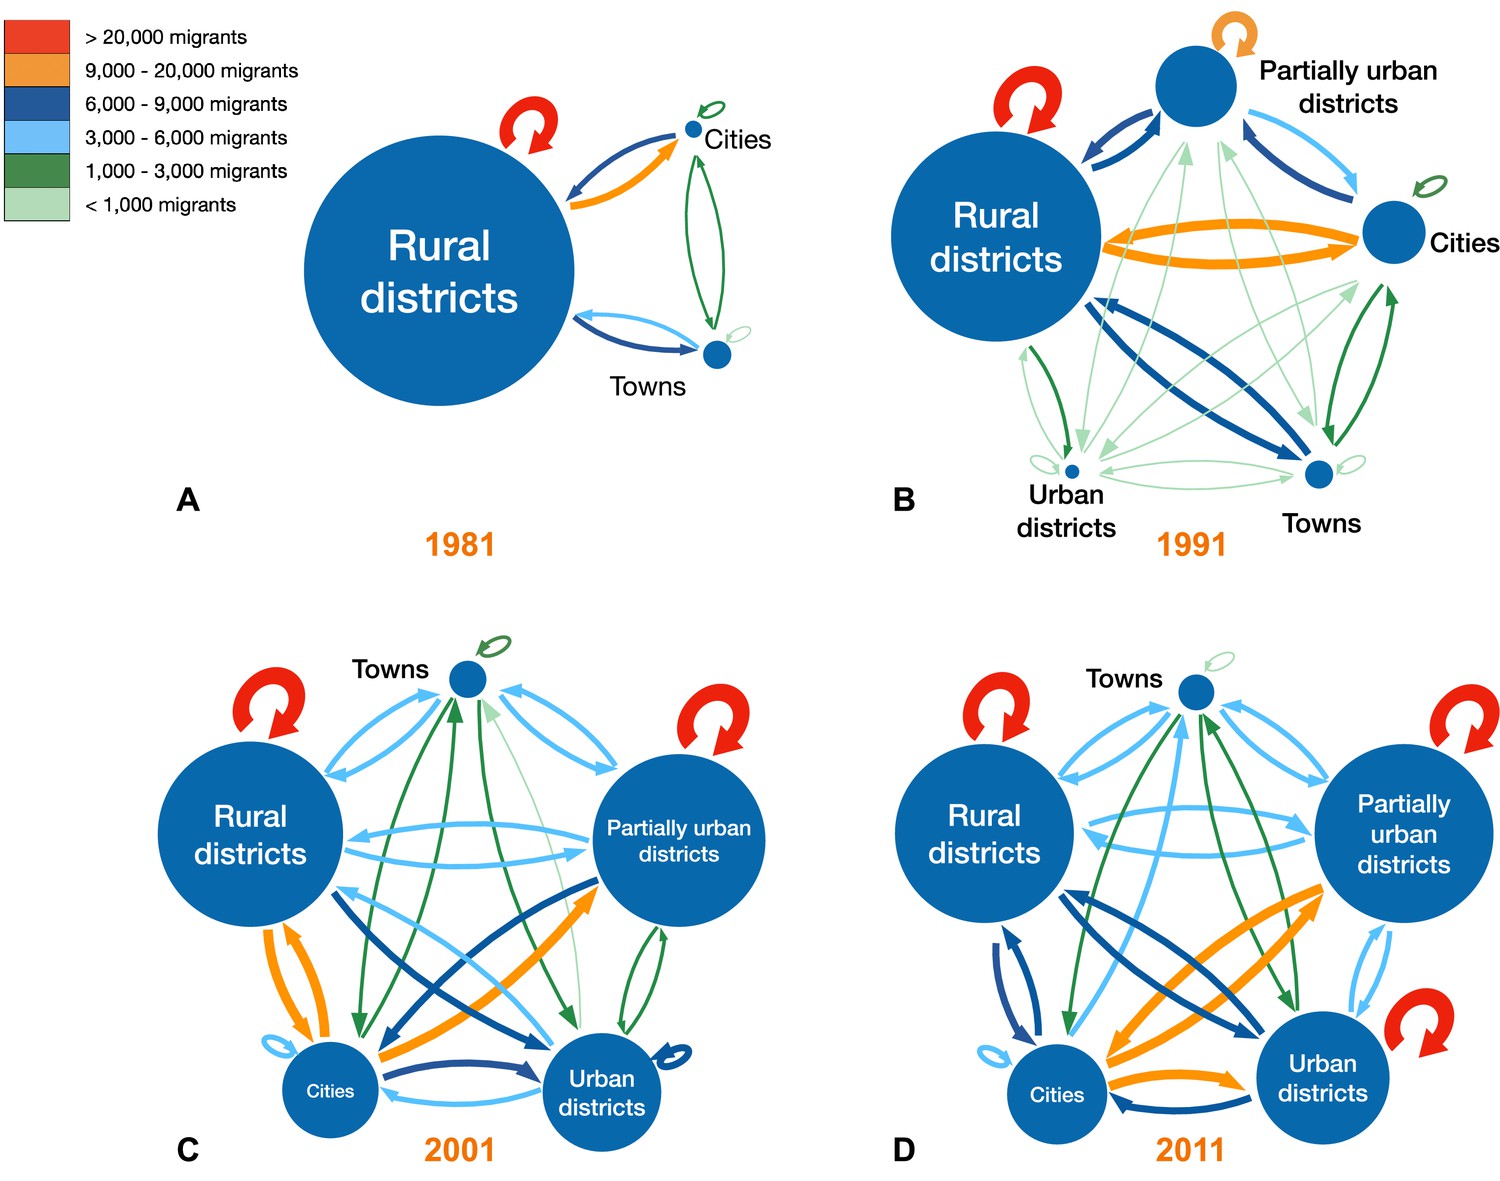
Schemata of migration-urbanization framework by census year.
(A) 1981, (B) 1991, (C) 2001, and (D) 2011. Circles represent the five classes based on an urban/rural classification (see ‘Methods’). The radius of each circle is proportional to the number of residents living in the districts in that specific class. The color of each arrow indicates the size of the net migration between classes, as does the thickness of the line: the thicker the line, the greater the number of migrants.
Figure 8
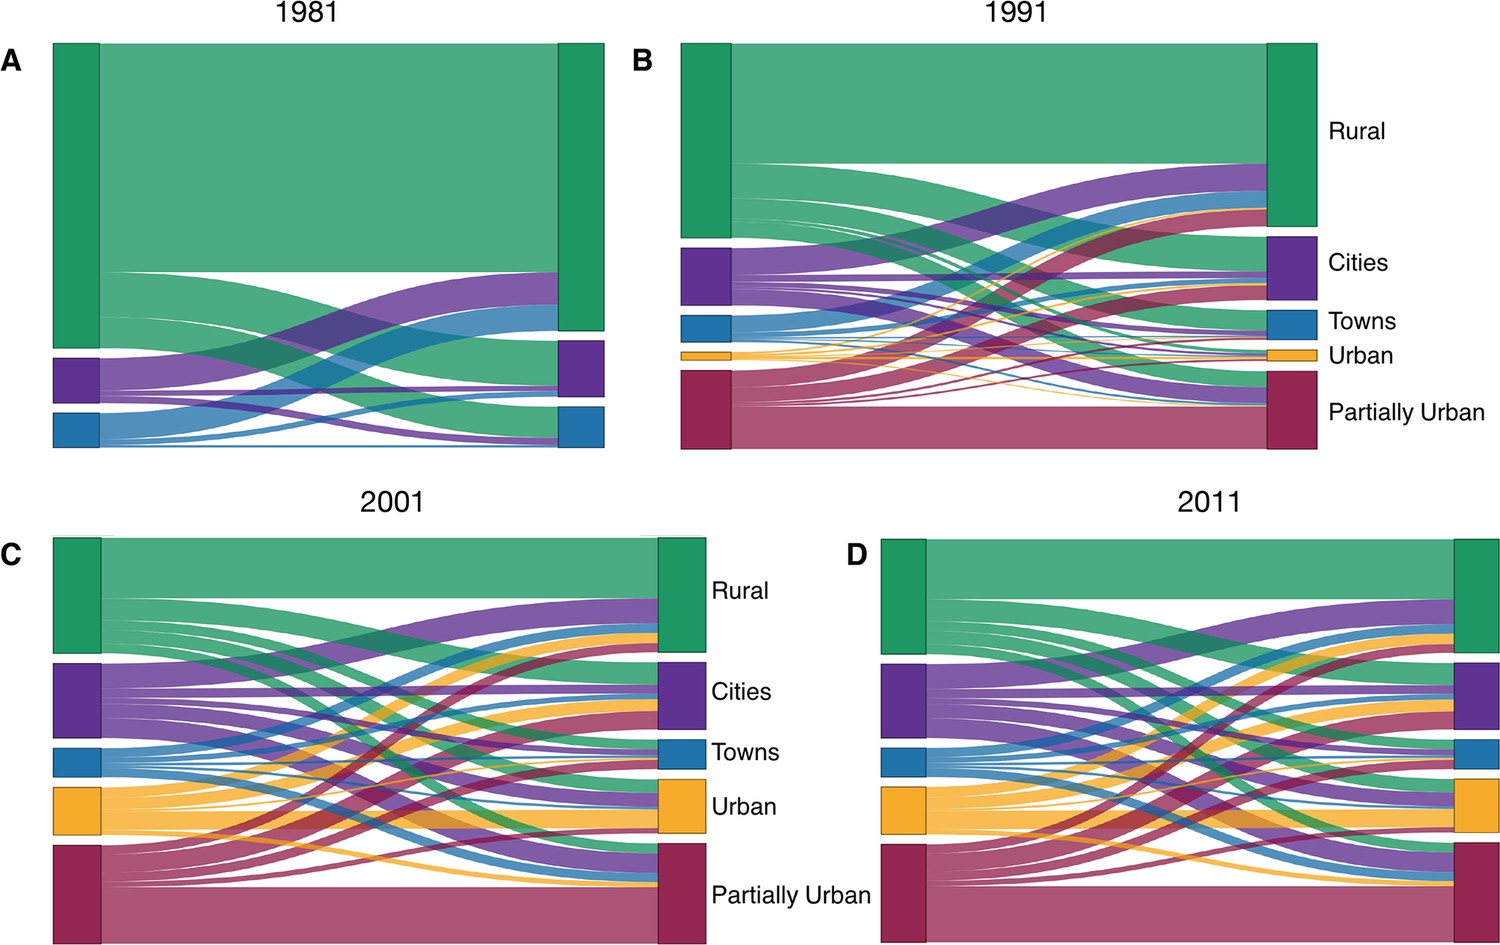
Sankey diagrams showing the migration-urbanization framework by census year.
(A) 1981, (B) 1991, (C) 2001, and (D) 2011. The diagrams show the relative magnitude of migratory flows between the five classes over time. Cities are shown in purple, towns in blue, predominantly urban districts in gold, partially urban districts in magenta, and predominantly rural districts in green.
Additional files
-
Supplementary file 1
Tables of migration metrics by district for (a) 1980–1981, (b) 1990–1991, (c) 2000–2001, and (d) 2010–2011.
These tables present each district’s urban/rural classification, population size, total number of migrants (both within and between districts), within district migration intensity per hundred residents (WDMI), and population turnover per hundred residents. The urban/rural classes were city (C), town (T), predominantly urban (U), partially urban (PU), and predominantly rural (R). Population sizes are tabulated for residents for whom there was 1-year migration data. In 2010–2011, the Central Kgalagadi Game Reserve district is denoted CKGR.
- https://cdn.elifesciences.org/articles/85435/elife-85435-supp1-v1.docx
-
MDAR checklist
- https://cdn.elifesciences.org/articles/85435/elife-85435-mdarchecklist1-v1.docx
Download links
A two-part list of links to download the article, or parts of the article, in various formats.
Downloads (link to download the article as PDF)
Open citations (links to open the citations from this article in various online reference manager services)
Cite this article (links to download the citations from this article in formats compatible with various reference manager tools)
The role of migration networks in the development of Botswana’s generalized HIV epidemic
eLife 12:e85435.
https://doi.org/10.7554/eLife.85435


