Chronic exposure to odors at naturally occurring concentrations triggers limited plasticity in early stages of Drosophila olfactory processing
- Division of Biology and Biological Engineering, California Institute of Technology, United States
Figures
Figure 1
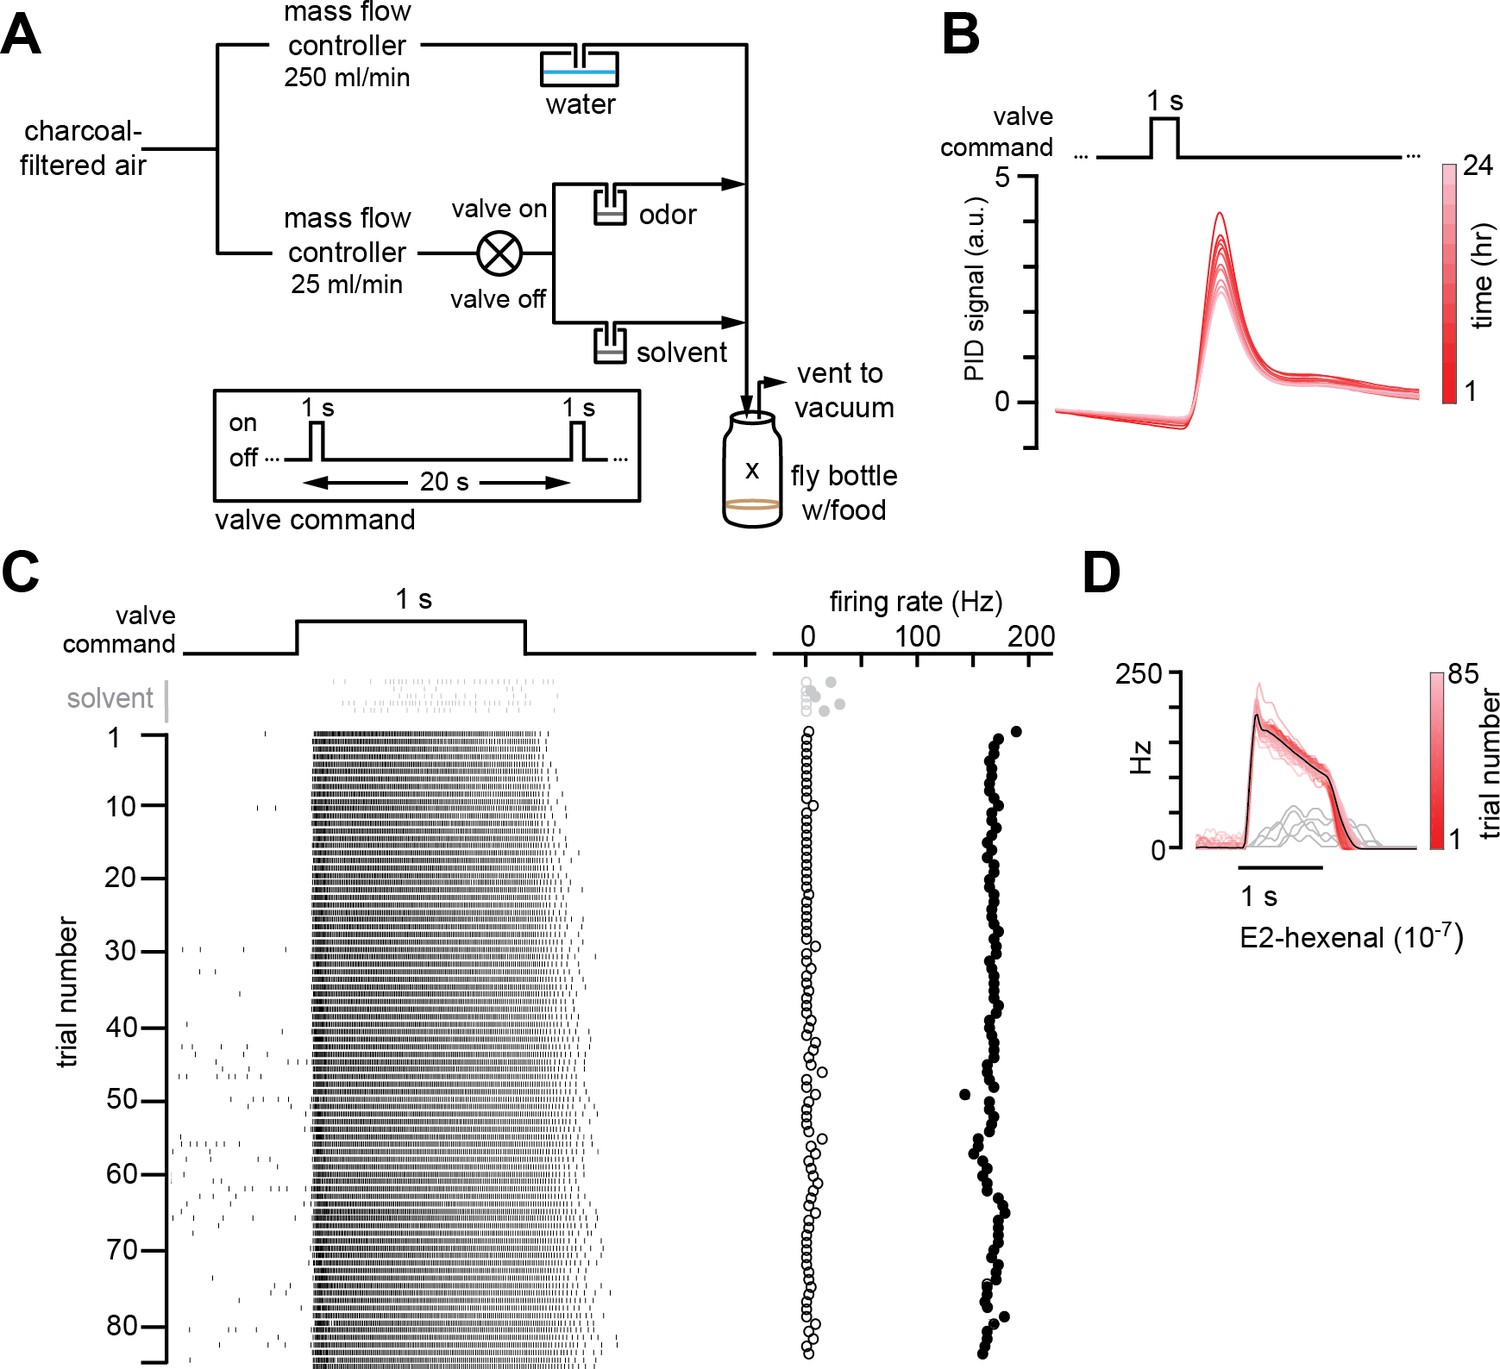
Chronic stimulation of olfactory neurons in a controlled odor environment.
(A) Schematic of experimental setup for chronic odor exposure. The valve was opened for 1 s every 20 s to deliver odor. See Materials and methods (chronic odor exposure) for details. (B) Photoionization detector measurement of odor concentration at the center of the fly bottle (“X” in A) during chronic odor exposure to 2-butanone (10–4) over the course of 24 hr. Each trace is the odor profile averaged across 45 consecutive odor pulses (collected over 15 min), sampled every 2 hr over a 24 hr period. (C) Raster plots of the spiking responses in an example DL5 projection neuron (PN) to a 1 s pulse of either solvent (paraffin oil, gray) or E2-hexenal (10–7, black) in consecutive trials spaced 20 s apart. Recordings were established from a fly immediately after 2 days of chronic exposure to E2-hexenal (10–7) as in (A). Spontaneous (open circles) and stimulus-evoked (filled circles) firing rates are plotted for each trial. (D) Peristimulus time histograms of measurements in (C) show that the odor environment reliably evokes high levels of PN firing across presentation trials. The average odor-evoked response across all trials is in black. Responses to presentation of solvent are overlaid in gray.
Figure 2
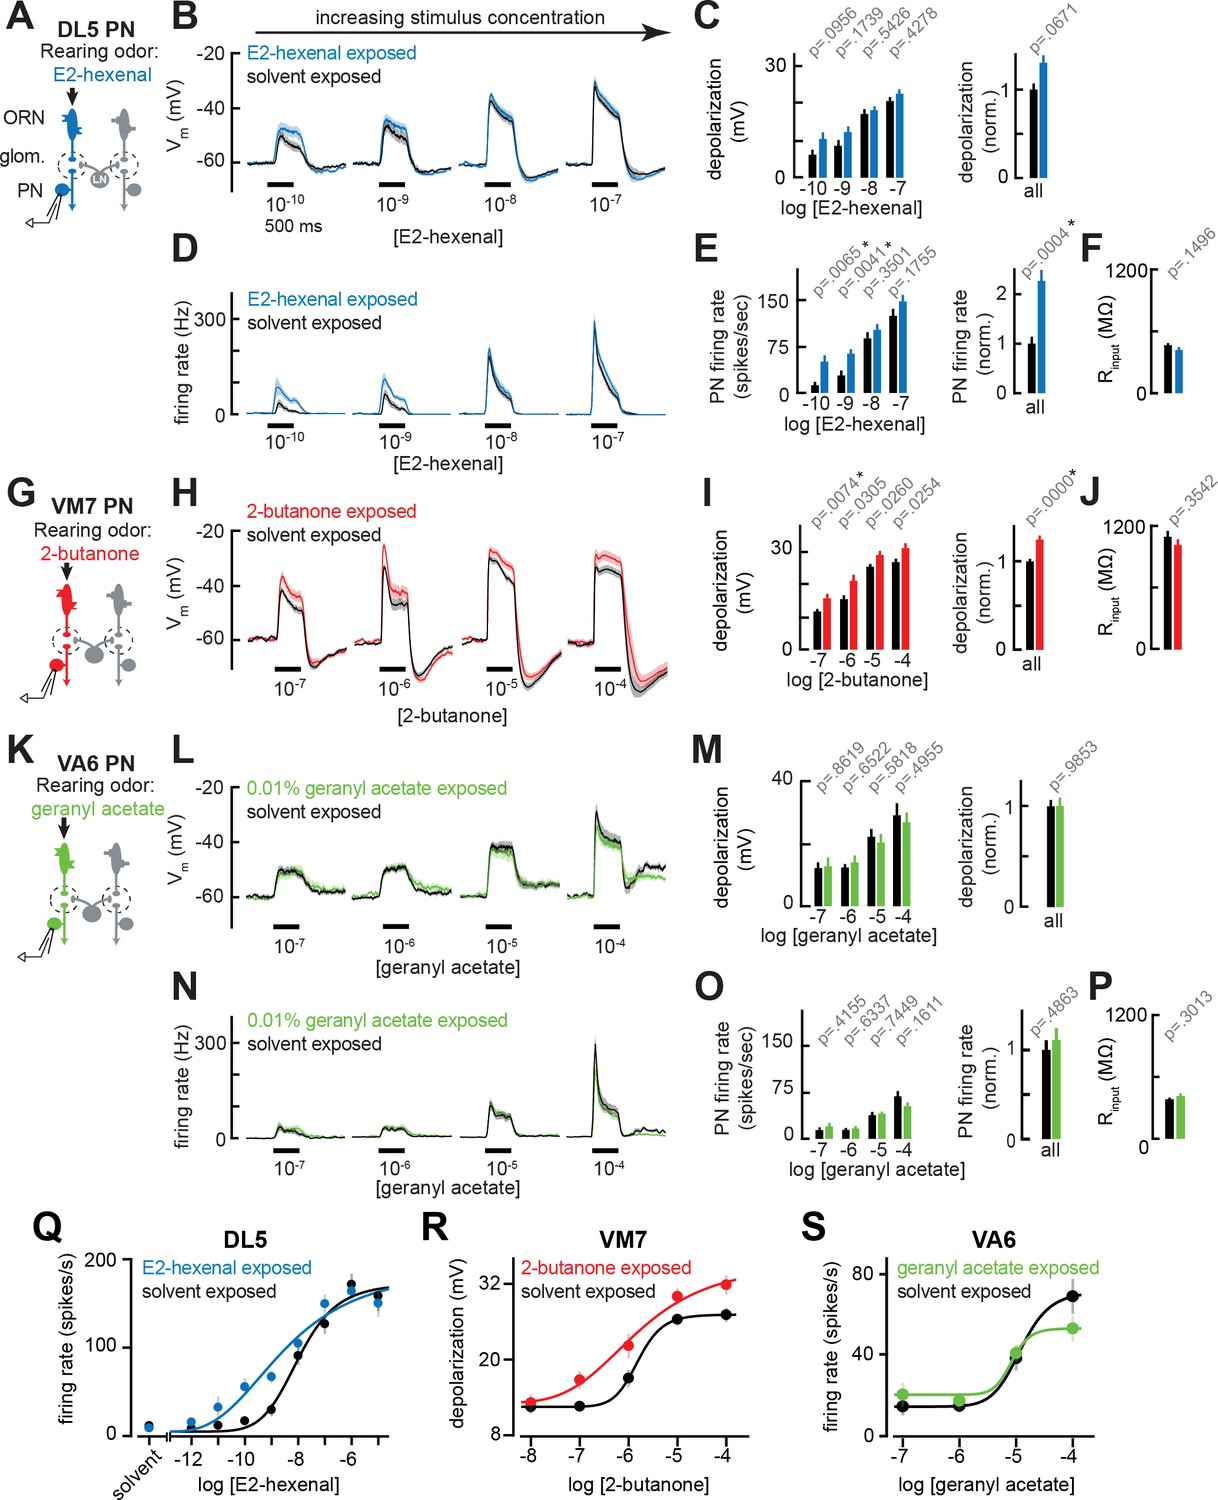
Chronic excitation of direct presynaptic olfactory receptor neuron (ORN) input can modestly enhance projection neuron (PN) sensitivity to weak stimuli.
(A) Schematic of experimental setup for (B–F). Recordings were established from DL5 PNs that receive direct presynaptic input from the ORN class (ab4a) chronically activated by the rearing odor (E2-hexenal, 10–7), n=7–19 cells. (B) Odor-evoked depolarization in DL5 PNs in response to varying concentrations of E2-hexenal from flies chronically exposed to E2-hexenal or solvent (paraffin oil). (C) Left: mean odor-evoked depolarization to each stimulus in (B) in the 500 ms after nominal stimulus onset. Right: mean normalized odor-evoked depolarization across all stimuli. Within each stimulus, responses were normalized to the mean odor-evoked depolarization in the solvent-exposed group. (D) Peristimulus time histograms of odor-evoked spiking responses in DL5 PNs from (B). (E) Left: mean odor-evoked firing rates to each stimulus from (D) in the 500 ms after nominal stimulus onset. Right: mean normalized odor-evoked firing rates across all stimuli, computed analogously as in (C). (F) Mean input resistance of DL5 PNs recorded from E2-hexenal- or solvent-exposed flies. (G) Experimental setup for (H–J). Recordings were established from VM7 PNs that receive direct presynaptic input from the ORN class (pb1a) chronically activated by the rearing odor (2-butanone, 10–4), n=6–11 cells. (H–I) As in (B–C) but describing odor-evoked depolarization in VM7 PNs in response to a concentration series of 2-butanone from flies chronically exposed to 2-butanone or solvent. (J) Mean input resistance of VM7 PNs recorded from 2-butanone- or solvent-exposed flies. (K) Experimental setup for (L–P). Recordings were established from VA6 PNs that receive direct presynaptic input from the ORN class (ab5a) chronically activated by the rearing odor (geranyl acetate, 10–4), n=7–11 cells. (L–P) As in (B–F) but describing odor-evoked responses to varying concentrations of geranyl acetate in VA6 PNs from flies chronically exposed to geranyl acetate or solvent. (Q–S) Response curves in DL5 (Q), VM7 (R), and VA6 (S) PNs from odor-exposed and control flies to a concentration series of the cognate odor for each glomerulus. Results from panels (A–P) are replotted here and extended with measurements at additional stimulus concentrations. n=3–19 cells. All plots are mean ± SEM across flies in each experimental condition. One cell was recorded per fly. Two-tailed p-values report the fraction of resampled absolute differences of means (between simulated experimental groups) which are greater than the absolute observed difference between the means of experimental groups (odor-exposed versus solvent-exposed; see Materials and methods). Starred (*) p-values are significant at the level of α=0.05, corrected for multiple comparisons (Bonferroni adjustment). See Supplementary file 1 for the full genotype and number of cells in every condition.
-
Figure 2—source data 1
Source data for Figure 2B–C, D–E, H–I, L–M and N–O.
- https://cdn.elifesciences.org/articles/85443/elife-85443-fig2-data1-v2.xlsx
Figure 3
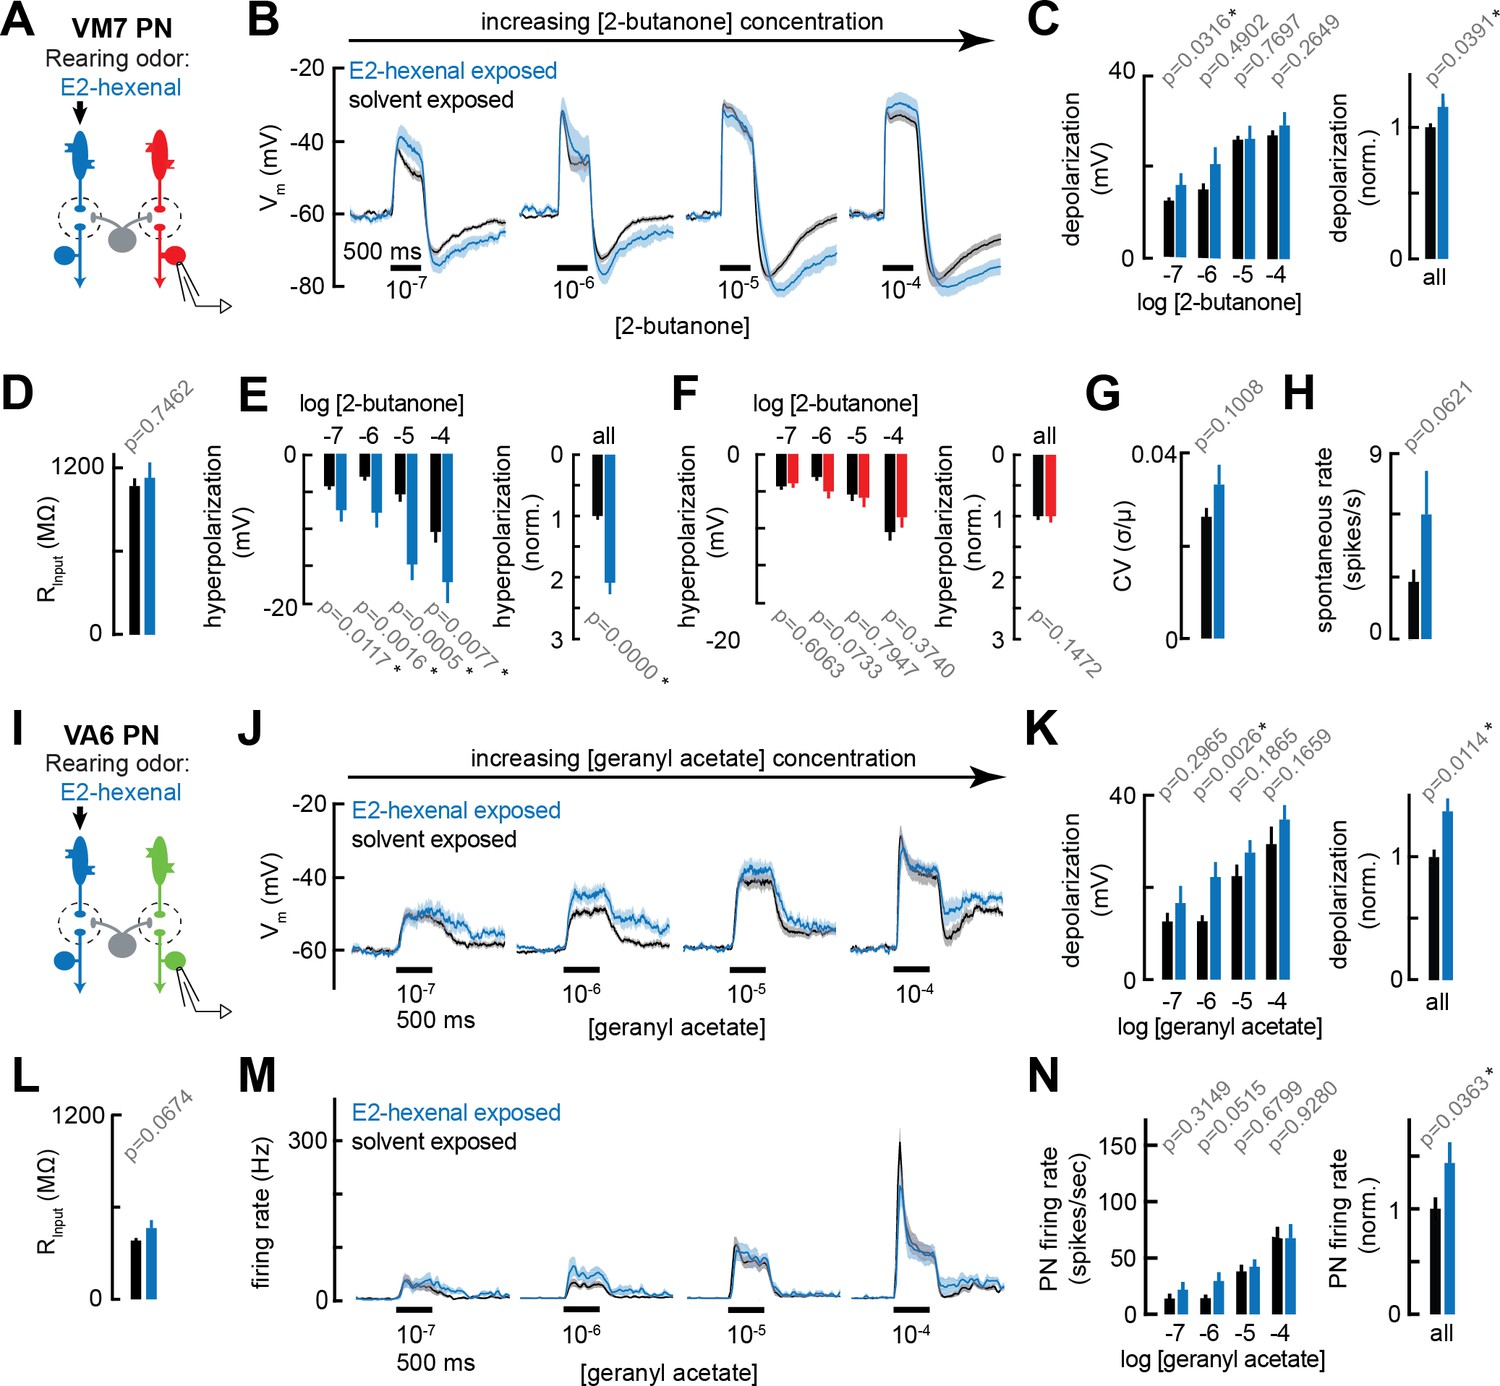
Chronic excitation of olfactory receptor neurons (ORNs) in other glomeruli alters projection neuron (PN) response properties.
(A) Experimental setup for (B–E) and (G–H). Recordings were established from VM7 PNs that receive indirect activity from the ORN class (ab4a) chronically activated by the rearing odor (E2-hexenal, 10–7), n=3–11 cells. (B) Odor-evoked depolarization in VM7 PNs in response to varying concentrations of 2-butanone from flies chronically exposed to E2-hexenal or solvent (paraffin oil). (C) Left: mean odor-evoked depolarization to each stimulus from (B) in the 500 ms after nominal stimulus onset. Right: mean normalized odor-evoked depolarization across all stimuli. Within each stimulus, responses were normalized to the mean odor-evoked depolarization in the solvent-exposed group. (D) Mean input resistance of VM7 PNs recorded from E2-hexenal- or solvent-exposed flies. (E) Left: mean post-stimulus hyperpolarization in VM7 PN responses to each stimulus from (B), calculated over a 2.5 s window after stimulus offset. Right: mean normalized post-stimulus hyperpolarization across all stimuli. Within each stimulus, responses were normalized to the mean post-stimulus hyperpolarization in the solvent-exposed group. (F) Same as (E), but for VM7 PNs from Figure 2H with chronic activation of direct ORN input. Measurements are from VM7 PN recordings in flies chronically exposed to 2-butanone (red) or solvent (black), n=6–11 cells. (G) Mean coefficient of variation (CV) of membrane potential in VM7 PNs (from B), computed over the 5 s window before stimulus onset, in E2-hexenal- or solvent-exposed flies. (H) Mean spontaneous firing rate of VM7 PNs (from B) during the 5 s window before stimulus onset in E2-hexenal- or solvent-exposed flies. (I) Experimental setup for (J–N). Recordings were established from VA6 PNs that receive indirect activity from the ORN class (ab4a) chronically activated by the rearing odor (E2-hexenal, 10–7), n=5–11. (J–K) As in (B–C) but for odor-evoked depolarization in VA6 PNs to varying concentrations of geranyl acetate. (L) As in (D) but for VA6 PNs. (M–N) As in (B–C) but for odor-evoked spiking in VA6 PNs in response to varying concentrations of geranyl acetate (corresponding to J), from flies chronically exposed to E2-hexenal (10–7) or solvent (paraffin oil). All plots are mean ± SEM across flies, one cell/fly, in each experimental condition. p-Values are as described in Figure 2. See Supplementary file 1 for the full genotype and number of flies in every condition.
-
Figure 3—source data 1
Source data for Figure 3B–C, E–F, J–K and M–N.
- https://cdn.elifesciences.org/articles/85443/elife-85443-fig3-data1-v2.xlsx
Figure 4
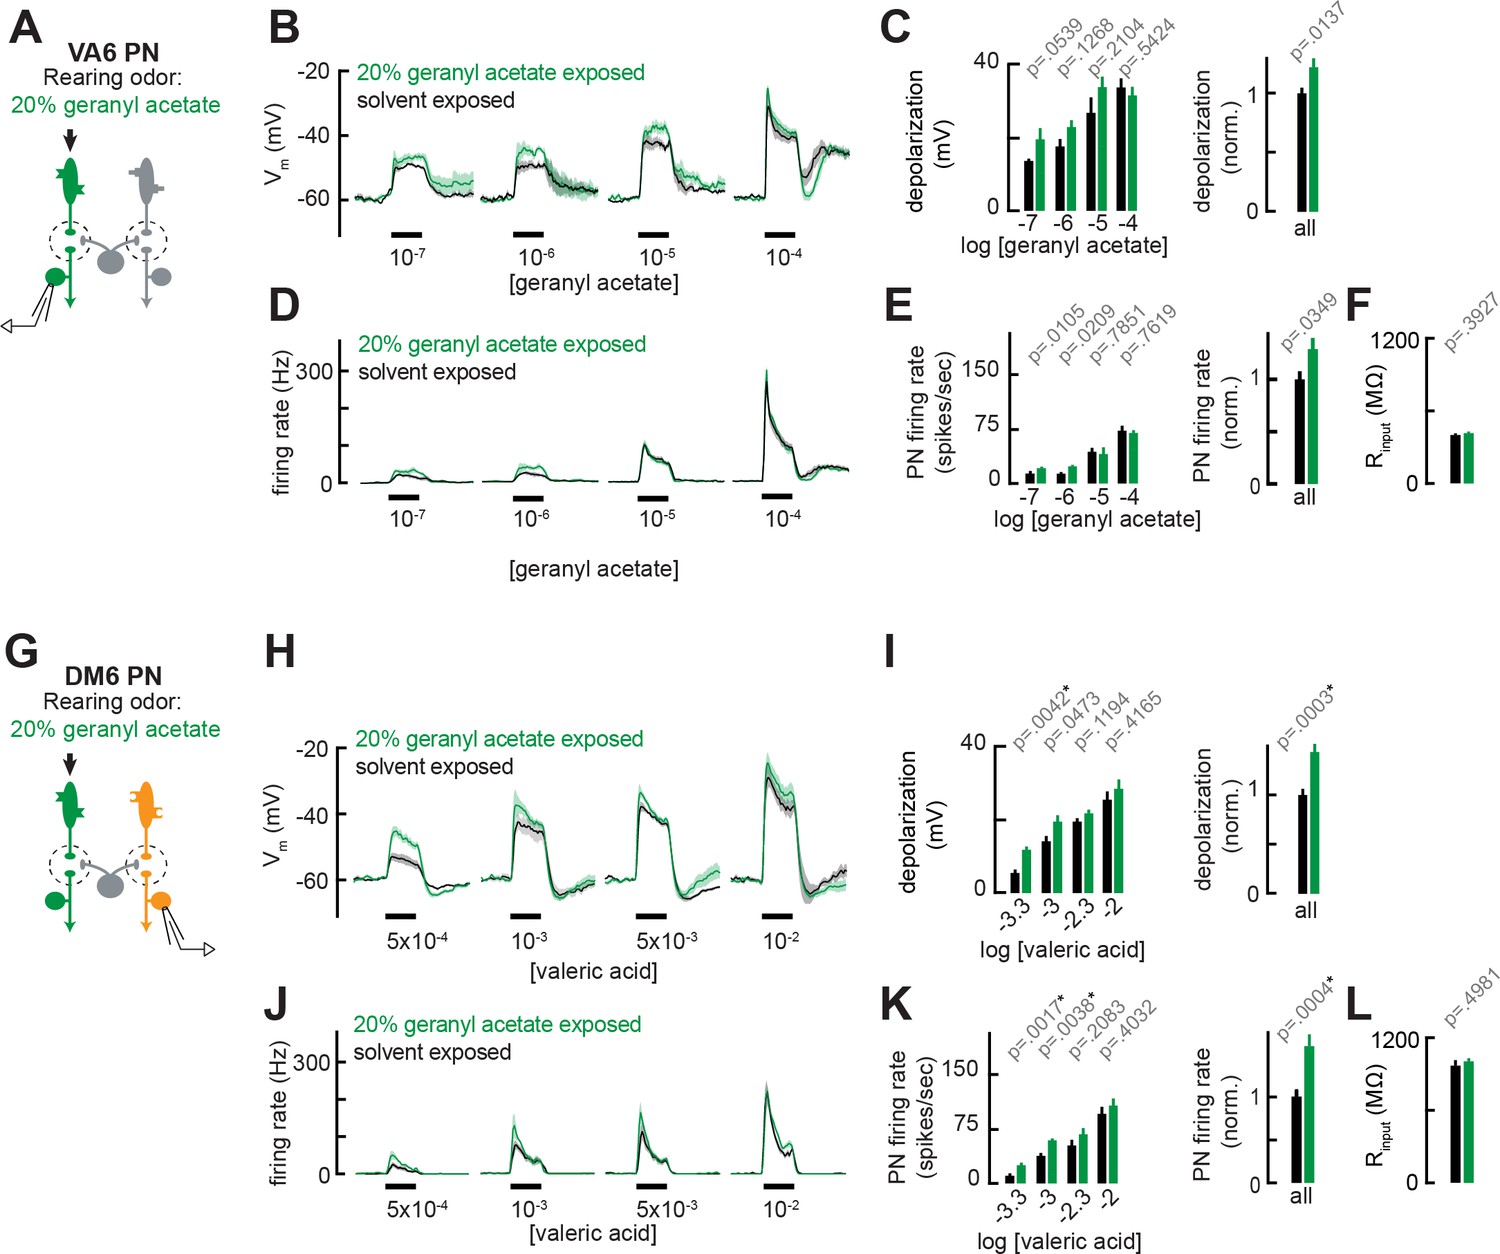
Chronic exposure to intense monomolecular odor can mildly enhance projection neuron (PN) responses to weak odor stimuli in PNs that receive either direct or indirect input from chronically active olfactory receptor neurons (ORNs).
(A) Schematic of experimental setup for (B–F). Recordings were established from VA6 PNs receiving direct presynaptic input from the ORN class (ab5a) chronically activated by the rearing odor (geranyl acetate, 20%), n=5–6. (B) Odor-evoked depolarization in VA6 PNs in response to varying concentrations of geranyl acetate from flies chronically exposed to 20% geranyl acetate or solvent (paraffin oil). (C) Left: mean odor-evoked depolarization to each stimulus in (B) in the 500 ms after nominal stimulus onset. Right: mean normalized odor-evoked depolarization across all stimuli. Within each stimulus, responses were normalized to the mean odor-evoked depolarization in the solvent-exposed group. (D) Peristimulus time histograms of odor-evoked spiking responses in VA6 PNs from (B). (E) Left: mean odor-evoked firing rates to each stimulus from (D) in the 500 ms after nominal stimulus onset. Right: mean normalized odor-evoked firing rates across all stimuli, computed analogously as in (C). (F) Mean input resistance of VA6 PNs recorded from 20% geranyl acetate- or solvent-exposed flies. (G) Experimental setup for (H–L). Recordings were established from DM6 PNs that receive indirect activity from the ORN class (ab5a) chronically activated by the rearing odor (geranyl acetate, 20%), n=5–6 cells. (H–L) As in (B–F), but for DM6 PNs in response to varying concentrations of valeric acid from flies chronically exposed to 20% geranyl acetate or solvent (paraffin oil).
-
Figure 4—source data 1
Source data for Figure 4B–C, D–E, H–I and J–K.
- https://cdn.elifesciences.org/articles/85443/elife-85443-fig4-data1-v2.xlsx
Figure 5 with 1 supplement
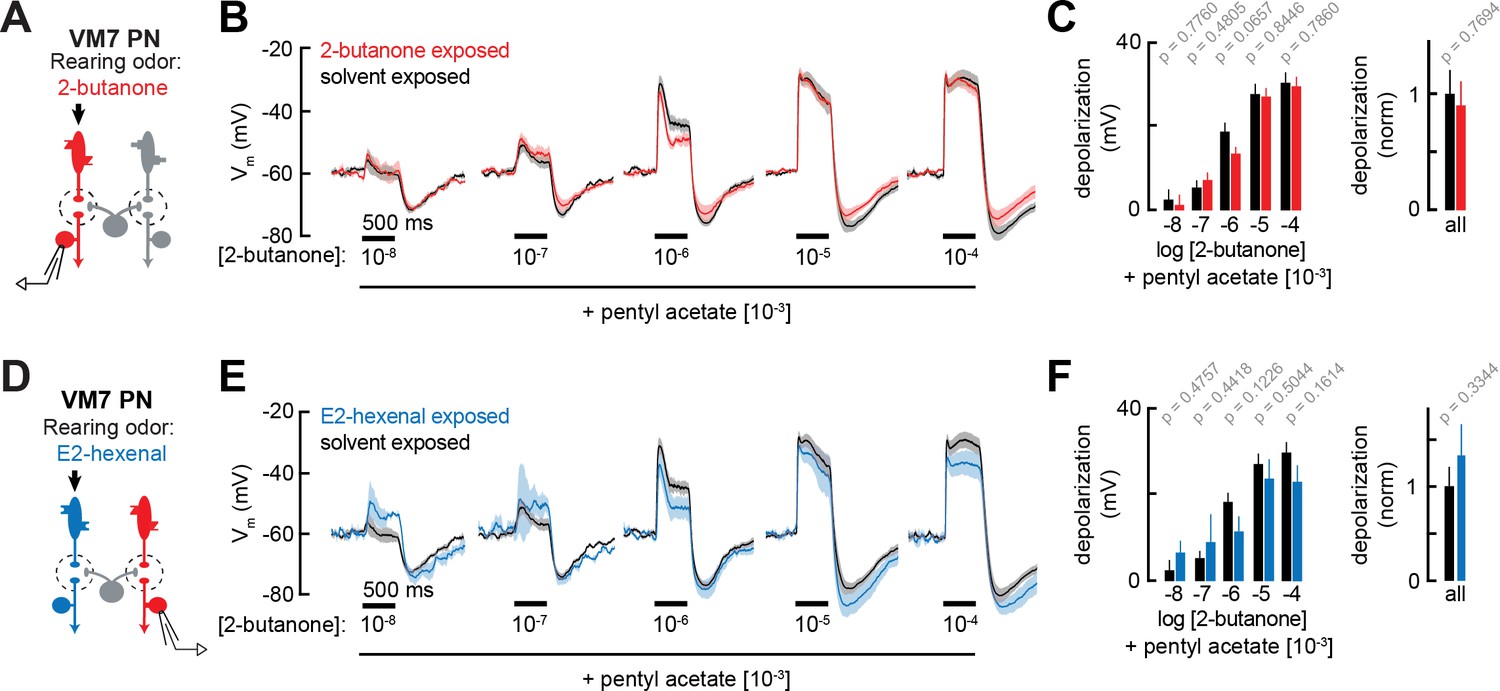
Projection neuron (PN) responses to odor mixtures are unaffected by chronic activation of direct or indirect olfactory receptor neuron (ORN) inputs.
(A) Experimental setup for (B–C), which is the same as in Figure 2G–J. Recordings were established from VM7 PNs that receive direct input from the ORNs (pb1a) chronically activated by the rearing odor (2-butanone, 10–4), n=3–7 cells. (B) Odor-evoked depolarization in VM7 PNs from 2-butanone- or solvent-exposed flies to binary mixtures composed of increasing levels of 2-butanone (10–8 through 10–4) blended with a fixed concentration of pentyl acetate (10–3). (C) Left: mean odor-evoked depolarization to each stimulus in (B) in the 500 ms after nominal stimulus onset. Right: mean normalized odor-evoked depolarization across all stimuli. Within each stimulus, responses were normalized to the mean odor-evoked depolarization in the solvent-exposed group. (D) Experimental setup for (E–F), which is the same as in Figure 3A–E. Recordings were established from VM7 PNs which receive indirect activity from the ORNs (ab4a) chronically activated by the rearing odor (E2-hexenal, 10–7), n=3–7 cells. (E–F) Same as in (B–C) but for VM7 PNs from E2-hexenal or solvent-exposed flies. All plots are mean ± SEM across flies (one cell/fly) in each experimental condition. p-Values are as described in Figure 2. See Supplementary file 1 for the full genotype and number of flies in every condition.
-
Figure 5—source data 1
Source data for Figure 5B–C and E–F.
- https://cdn.elifesciences.org/articles/85443/elife-85443-fig5-data1-v2.xlsx
Figure 5—figure supplement 1
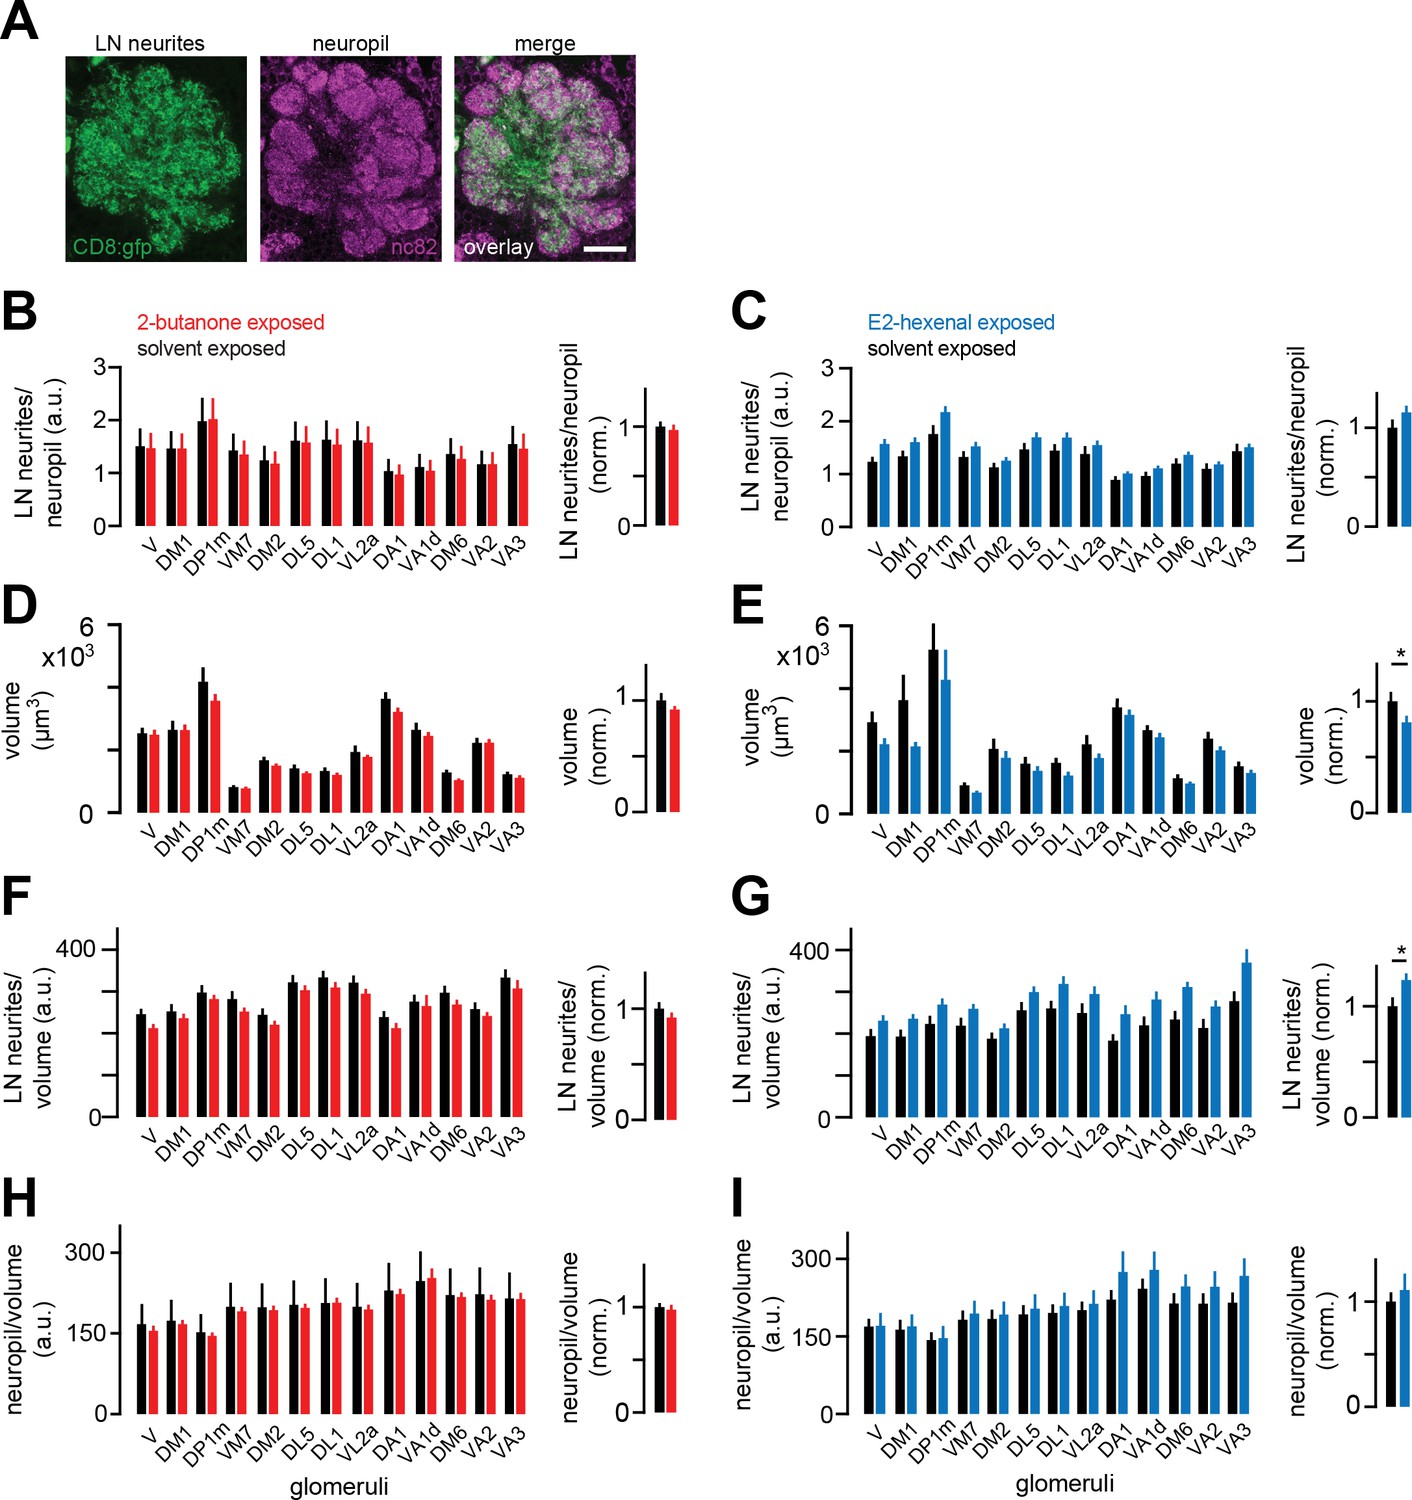
Local neuron (LN) innervation of antennal lobe glomeruli is unchanged by chronic excitation of a single olfactory receptor neuron (ORN) class.
(A) Single confocal section through the antennal lobe of a fly expressing membrane-targeted GFP (CD8:GFP, green) in a large subset of LNs. Synaptic neuropil was immunostained using the nc82 antibody (magenta) to visualize glomerular boundaries. Scale bar, 20 μm. (B–C) Left: ratios of mean LN neurite signal to mean synaptic neuropil signal in each indicated glomerulus in flies chronically exposed to solvent (paraffin oil) versus 2-butanone (10–4) (B), or to solvent (paraffin oil) versus E2-hexenal (10–7) (C) Right: mean normalized ratio of LN neurites to neuropil across glomeruli. Within each glomerulus, values were normalized to the mean ratio of the solvent-exposed group. (D–E) Same as (B–C) but for the volume of each glomerulus. (F–G) Same as (B–C) but for the volumetric density of LN neurite signal in each glomerulus. (H–I) Same as (B-C) but for the volumetric density of synaptic neuropil signal in each glomerulus. All plots are mean ± SEM across flies in each experimental condition, n=8–13 flies. *p<0.05, two-tailed Mann-Whitney U-test with Bonferroni multiple comparisons adjustment. See Supplementary file 1 for the full genotype and number of flies in every condition.
-
Figure 5—figure supplement 1—source data 1
Source data for Figure 5—figure supplement 1B-I.
- https://cdn.elifesciences.org/articles/85443/elife-85443-fig5-figsupp1-data1-v2.xlsx
Figure 6 with 1 supplement
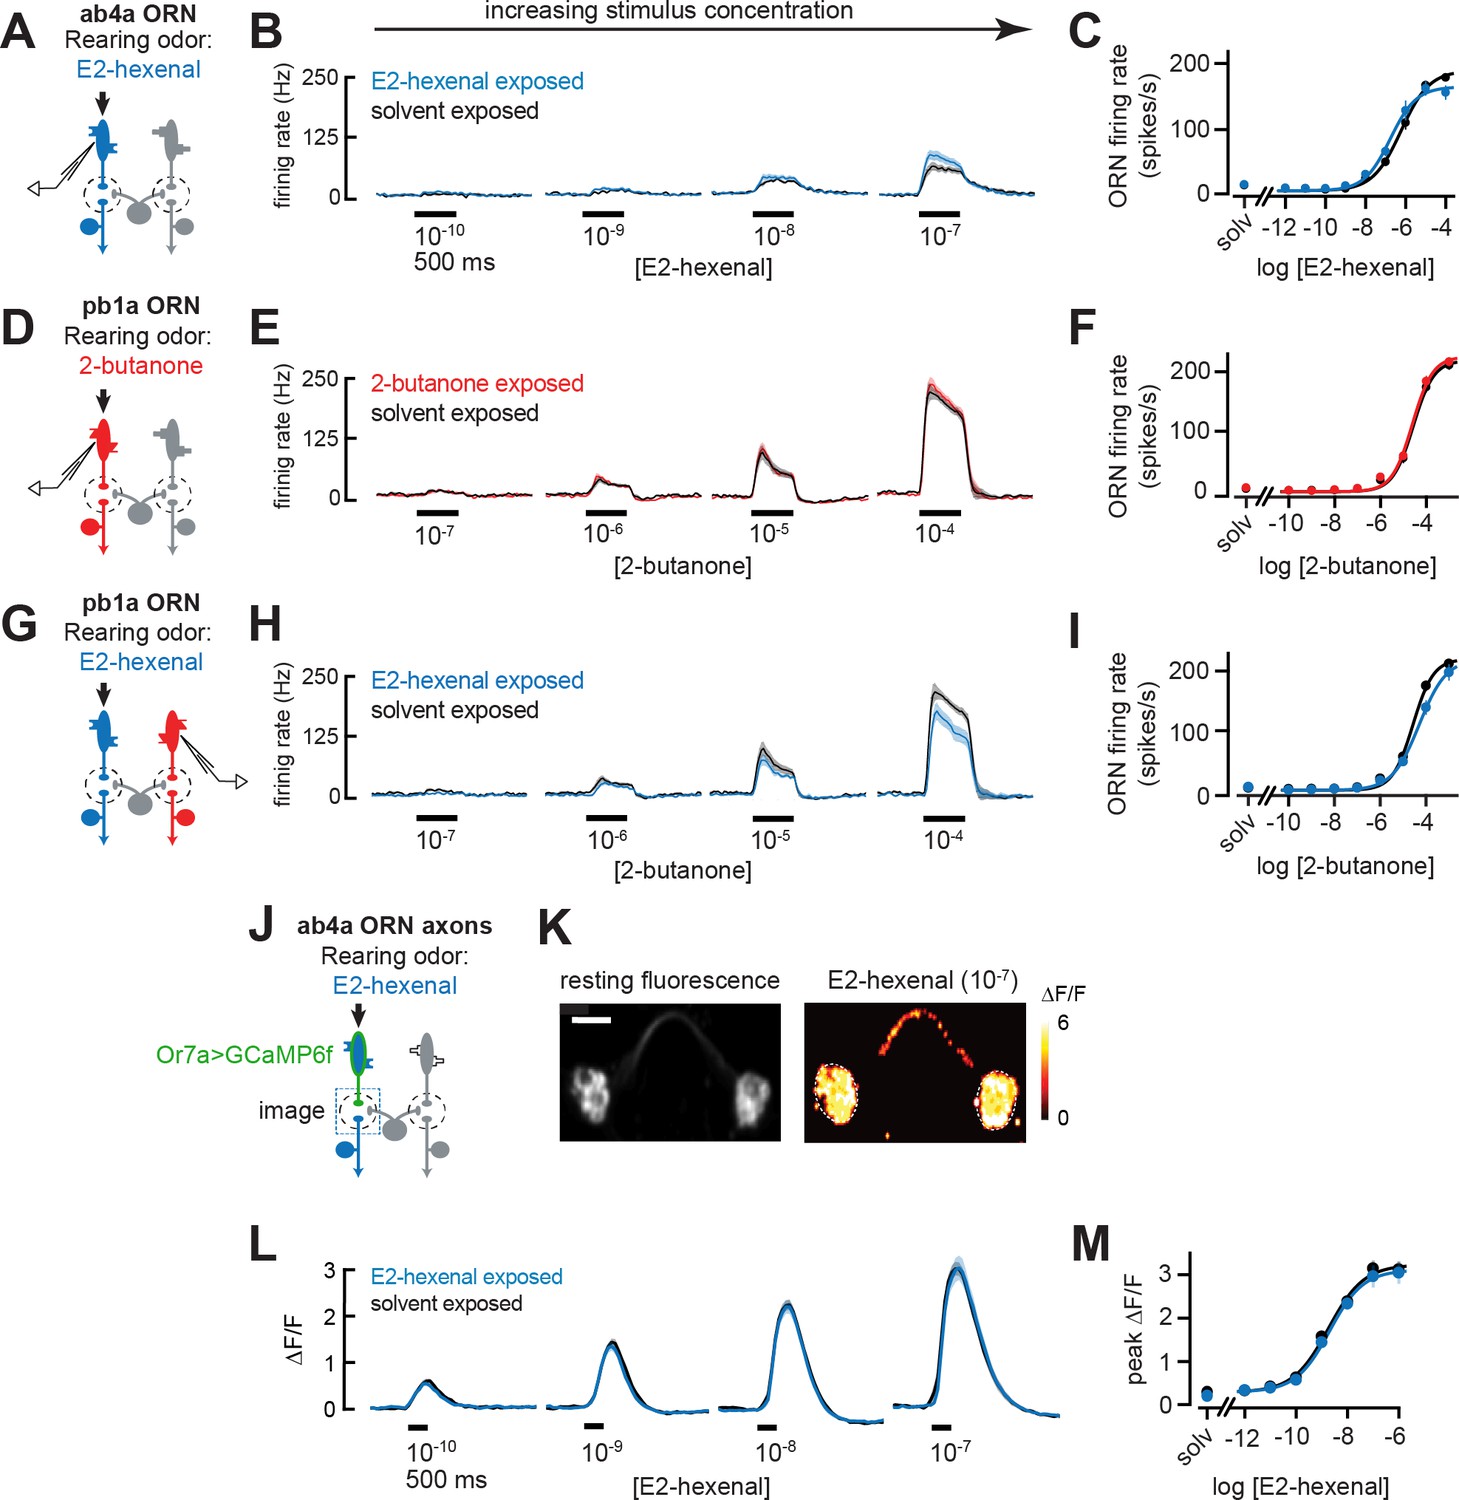
Odor responses in olfactory receptor neurons (ORNs) are unaffected by chronic odor exposure.
(A) Experimental setup for (B–C). Single-sensillum recordings (SSR) were established from ab4a ORNs, which are directly excited by the rearing odor E2-hexenal (10–7), n=6–12 cells. (B) Peristimulus time histograms of odor-evoked spiking in ab4a ORNs in response to varying concentrations of E2-hexenal from flies chronically exposed to E2-hexenal or solvent (paraffin oil). (C) Response curve of mean baseline-subtracted ab4a firing rates (calculated over the 500 ms window of stimulus presentation) to varying concentrations of E2-hexenal in E2-hexenal- or solvent-exposed flies. The concentration-response curve includes responses from (B), as well as measurements at additional stimulus concentrations. solv, solvent (paraffin oil). (D) Experimental setup for (E–F). SSR recordings from pb1a ORNs, which are directly excited by the rearing odor 2-butanone (10–7), n=6–11 cells. (E–F) Same as (B–C) but for pb1a ORNs responding to varying concentrations of 2-butanone in flies chronically exposed to 2-butanone or solvent. (G) Experimental setup for (H–I). SSR recordings from pb1a ORNs in flies chronically exposed to E2-hexenal (10–7), a stimulus which directly excites ab4a ORNs, n=5–11 cells. (H–I) Same as (B–C), but for pb1a ORNs responding to varying concentrations of 2-butanone in flies chronically exposed to E2-hexenal or solvent. (J) Experimental setup for (K–M). GCaMP6f was expressed in ab4a ORNs under the control of Or7a-Gal4. Flies were chronically exposed to E2-hexenal (10–7) or solvent, and odor-evoked calcium responses in ab4a ORN terminals were imaged in the DL5 glomerulus (dashed box) using two-photon microscopy, n=6–8 cells. (K) Left: maximum intensity projection of the imaging plane across the time series of an example stimulus presentation. Right: peak ΔF/F heat map from a single experiment evoked by a 500 ms pulse of E2-hexenal (10–7) in a solvent-exposed fly, averaged across three stimulus presentations. Scale bar is 5 μm. (L) Time courses of change in fluorescence in ab4a ORN terminals elicited by varying concentrations of E2-hexenal in E2-hexenal- and solvent-exposed flies. (M) Response curve of mean peak ΔF/F responses to varying concentrations of E2-hexenal in E2-hexenal- or solvent-exposed flies. The concentration-response curve includes responses from (L), as well as measurements at additional stimulus concentrations. solv, solvent. All plots are mean ± SEM across flies in each experimental condition (one cell or antennal lobe/fly). Statistical analysis was as in Figure 2 (see Figure 6—figure supplement 1 for p-values); none of the comparisons in Figure 6 between odor- and solvent-exposed groups are statistically significant at the α=0.05 level, with Bonferroni adjustment for multiple comparisons. See Supplementary file 1 for the full genotype and number of flies in every condition.
-
Figure 6—source data 1
Source data for Figure 6B–C, E–F, H–I and L–M.
- https://cdn.elifesciences.org/articles/85443/elife-85443-fig6-data1-v2.xlsx
Figure 6—figure supplement 1
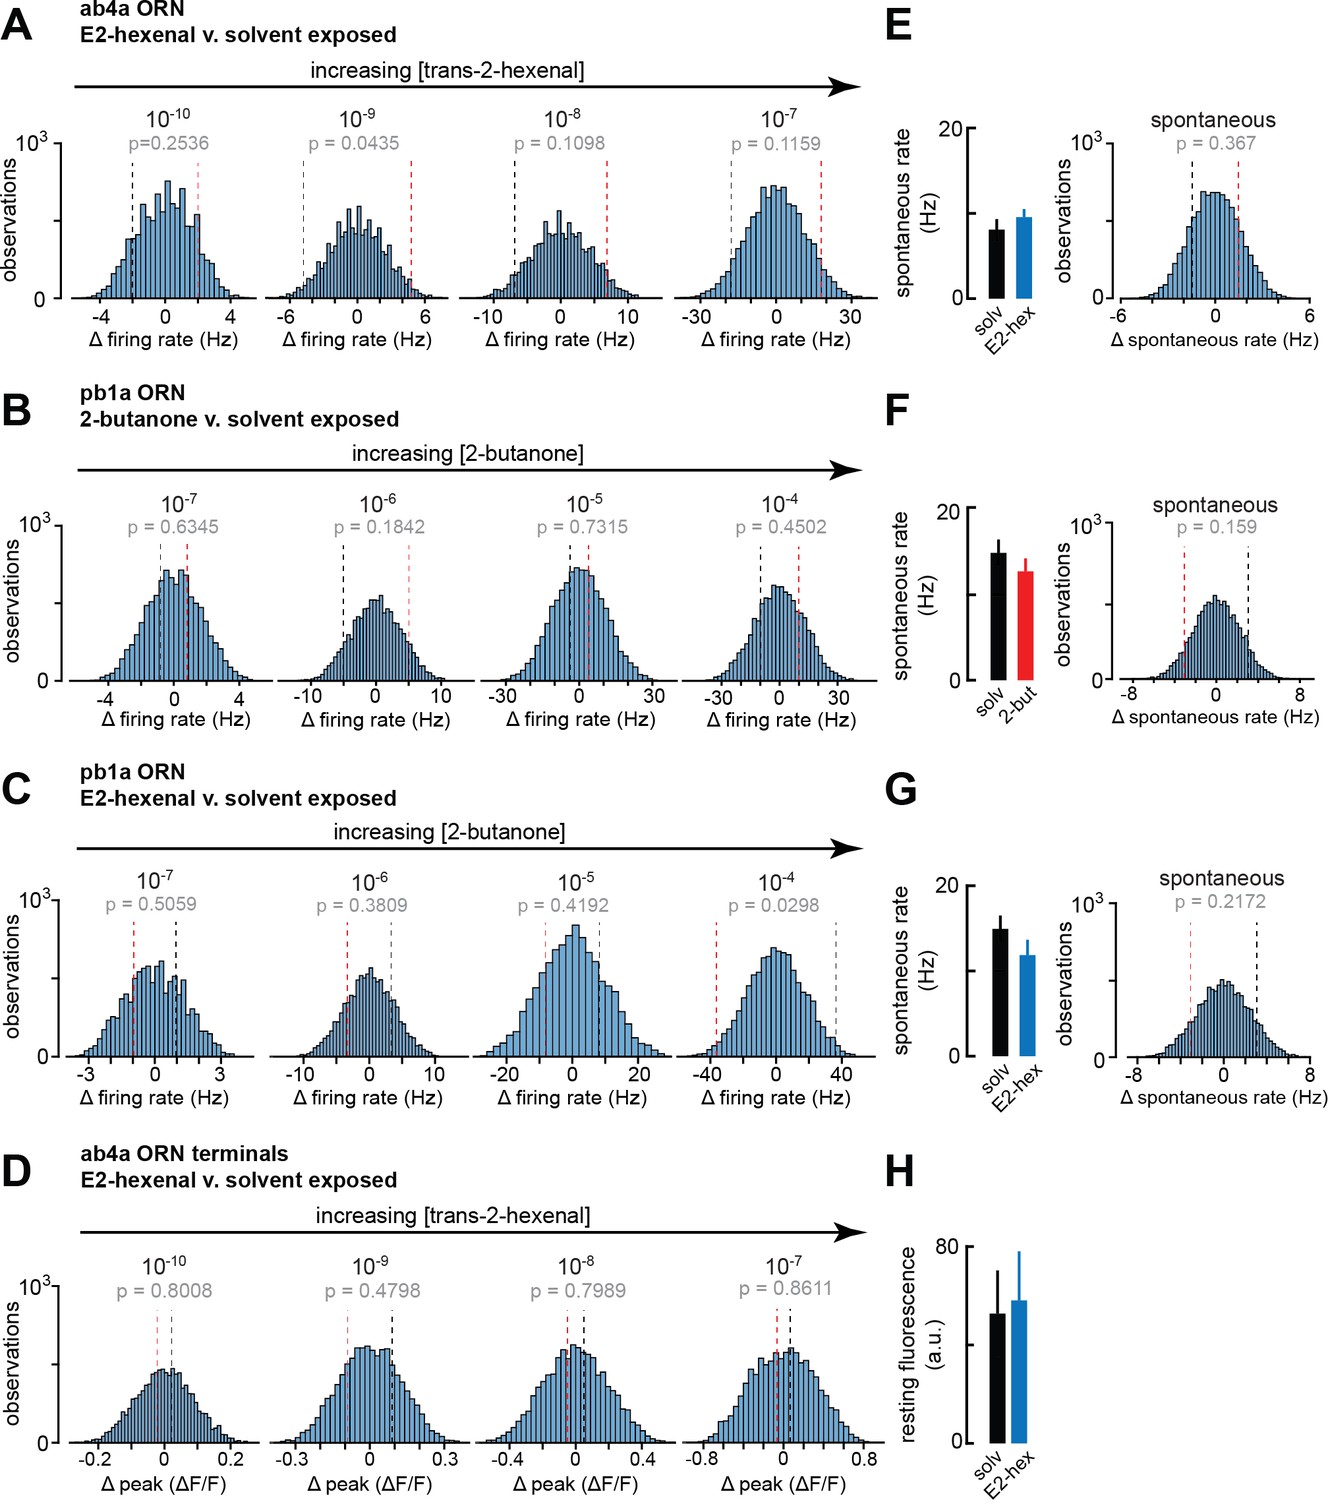
Statistical analysis of spontaneous and odor-evoked olfactory receptor neuron (ORN) firing rates in odor- and solvent-exposed flies.
(A–D) Histograms of the difference between group means in 10,000 permutations of the datasets for each indicated comparison of odor-evoked firing rates in (A) ab4a ORNs from E2-hexenal- or solvent-exposed flies (from Figure 6B); (B) pb1a ORNs from 2-butanone- or solvent-exposed flies (from Figure 6E); (C) pb1a ORNs from E2-hexenal- or solvent-exposed flies (from Figure 6H); and (D) odor-evoked calcium signals from ab4a ORN axon terminals in E2-hexenal- or solvent-exposed flies (from Figure 6L). The p-value for each comparison is computed as the fraction of absolute resampled differences larger than the absolute observed difference (e.g. the fraction of the distribution lying outside the dotted bounds). (E–G) Mean spontaneous firing rate, and statistical comparison of means, computed over a 5 s window prior to stimulus onset in ORNs corresponding to each condition in (A–C). (H) Mean resting fluorescence computed over a 5 s window prior to stimulus onset in ab4a ORN terminals in the DL5 glomerulus in E2-hexenal- and solvent-exposed flies. None of the comparisons in Figure 6 between odor- and solvent-exposed groups are statistically significant at the α=0.05 level (with Bonferroni adjustment for multiple comparisons).
Figure 7 with 1 supplement
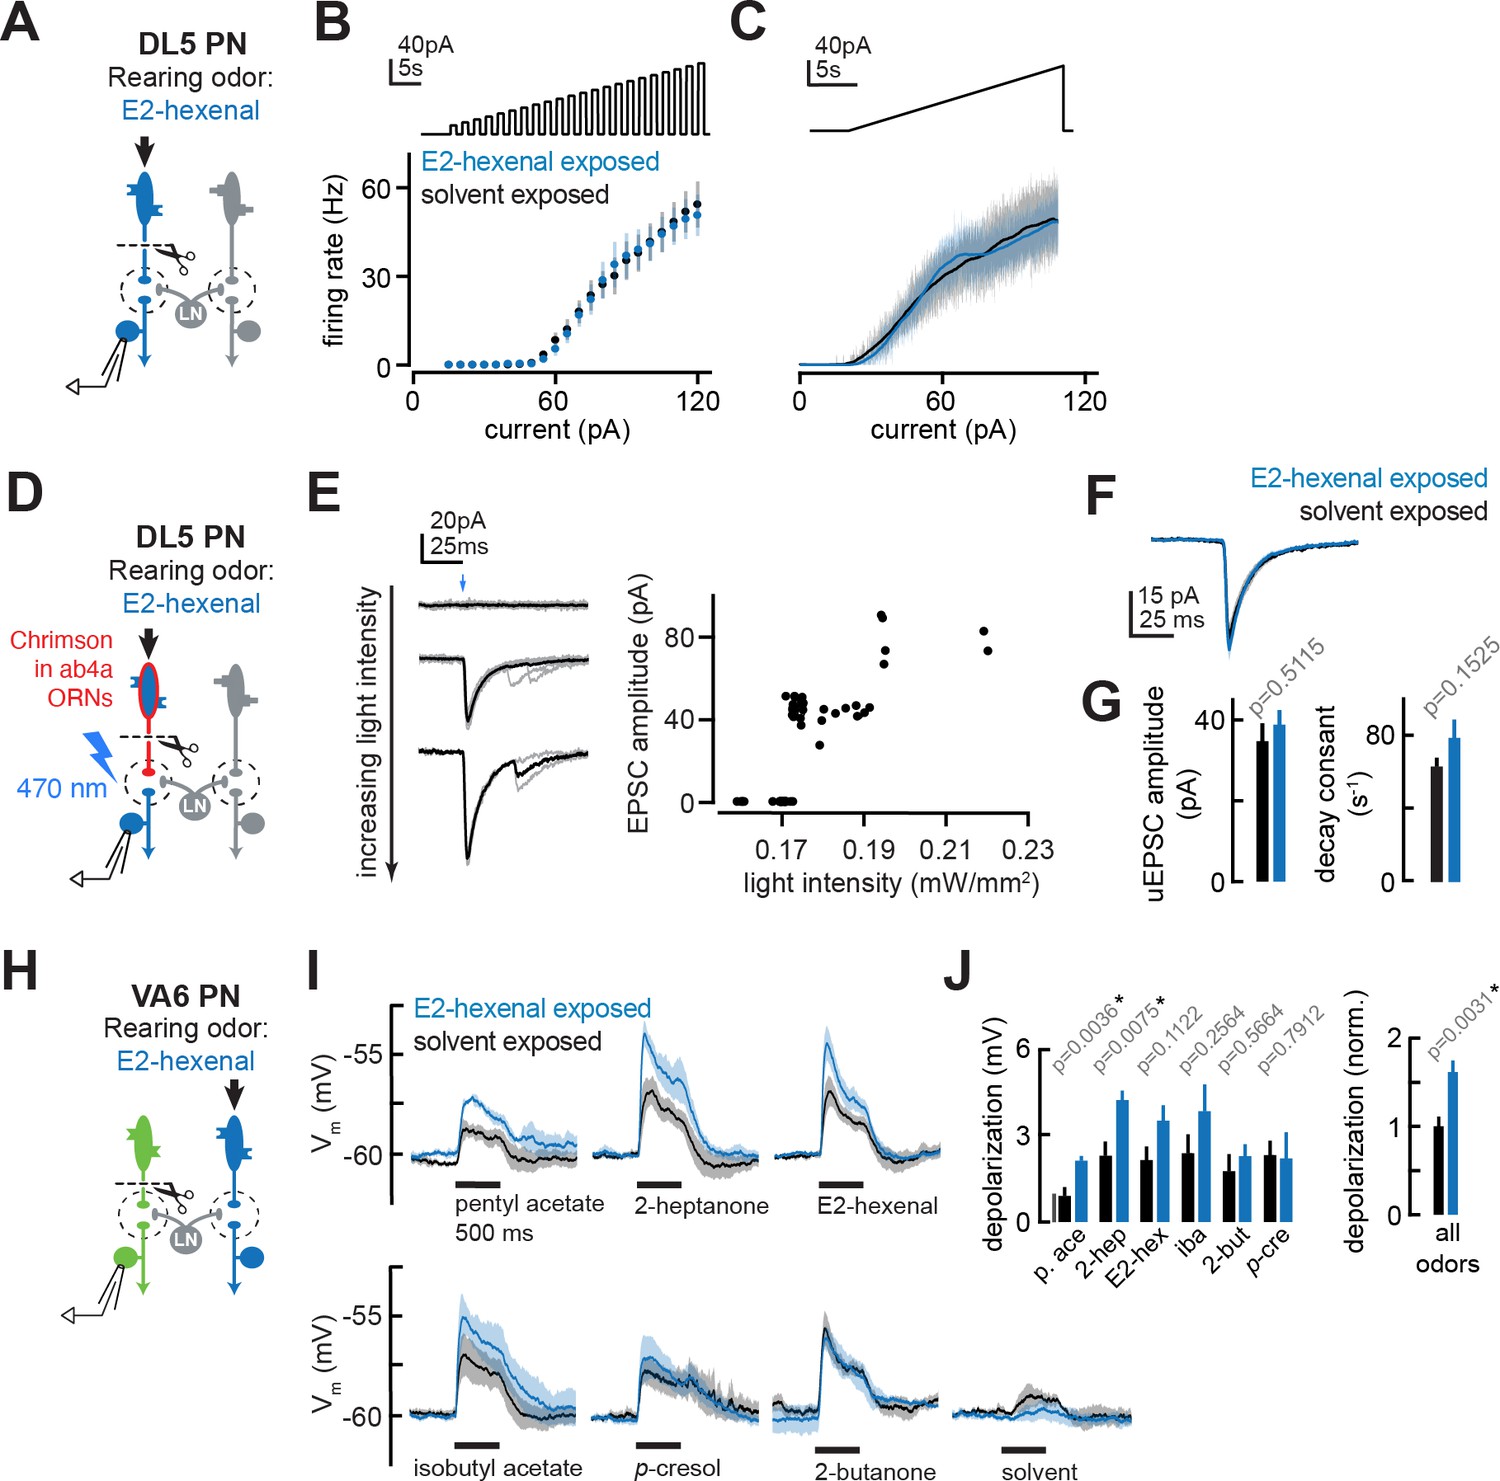
The effect of chronic olfactory receptor neuron (ORN) activation on projection neuron (PN) intrinsic properties, ORN-PN synapse strength, and lateral excitation in the antennal lobe.
(A) Experimental setup for (B–C). Recordings were established from DL5 PNs, which receive direct presynaptic input from the ORN class (ab4a) chronically activated by the rearing odor (E2-hexenal, 10–7), n=4 cells. Immediately prior to recording, PNs were deafferented by bilateral transection of the antennal nerves. (B) f-I curve of DL5 PNs from E2-hexenal- and solvent-reared flies plotting firing rates elicited by increasing levels of current injection (1 s pulses delivered at an interpulse interval of 1 s and increasing with a step size of 5 pA). (C) Same as (B) but plotting firing rates elicited by injection of a slow triangular current ramp (4.5 pA/s). Firing rate was calculated in 50 ms bins with 25 ms overlap. (D) Experimental setup for measurement of synaptic strength between ab4a ORNs and DL5 PNs in (E–G). Flies expressing the channelrhodopsin CsCrimson in ab4a ORNs under the control of or7a-Gal4 were chronically exposed to E2-hexenal (10–7) or solvent. Immediately prior to the experiment, PNs were deafferented by bilateral transection of the antennal nerves. Recordings were established from DL5 PNs, and unitary excitatory postsynaptic currents (EPSCs) were elicited in PNs by light-based minimal stimulation of presynaptic ORN terminals. n=5–7 cells. (E) A minimal stimulation protocol recruits unitary EPSCs. Left: EPSCs recorded in a DL5 PN (from a solvent-exposed fly) in response to increasing levels of light-based (488 nm) ORN stimulation (blue arrow). Individual trials are in gray; the average of all trials at a given light intensity is in black. Right: EPSC amplitude as a function of light intensity. Each dot represents the peak EPSC amplitude from a single trial. As light intensity is gradually increased, an evoked EPSC appears abruptly, and its amplitude remains constant as the light intensity is further increased. This range (~0.17–0.19 mW/mm2) likely corresponds to recruitment of an action potential in a single ab4a ORN axon presynaptic to the DL5 PN. As the level of light driven ORN stimulation further increases, the amplitude of the evoked EPSC suddenly doubles, likely reflecting the recruitment of a second axon. (F) Mean unitary EPSC recorded in DL5 PNs from E2-hexenal- or solvent-exposed flies. (G) Mean unitary EPSC amplitude (left) and decay rate (right) in DL5 PNs from E2-hexenal- or solvent-exposed flies. (H) Experimental setup for (I–J). Recordings were established from VA6 PNs in flies chronically exposed to E2-hexenal or solvent. Immediately prior to recording, PNs were deafferented by bilateral transection of the antennal nerves. Odors stimulate intact ORNs located in the palps and recruit lateral input to VA6 PNs (which normally receive direct input from ORNs in the antenna). n=3–5 cells. (I) Odor-evoked depolarization in deafferented VA6 PNs elicited by the indicated stimuli in flies chronically exposed to E2-hexenal or solvent (paraffin oil). Odors were presented at 10–2 dilution. (J) Left: mean odor-evoked depolarization to each stimulus in (I) in the 500 ms after nominal stimulus onset. Right: mean normalized odor-evoked depolarization across all stimuli. Within each stimulus, responses were normalized to the mean odor-evoked depolarization in the solvent-exposed group. All plots are mean ± SEM across flies in each experimental condition (one cell/fly). p-Values are as described in Figure 2. See Supplementary file 1 for the full genotype and number of flies in every condition.
-
Figure 7—source data 1
Source data for Figure 7B–C, F–G and I–J.
- https://cdn.elifesciences.org/articles/85443/elife-85443-fig7-data1-v2.xlsx
Figure 7—figure supplement 1
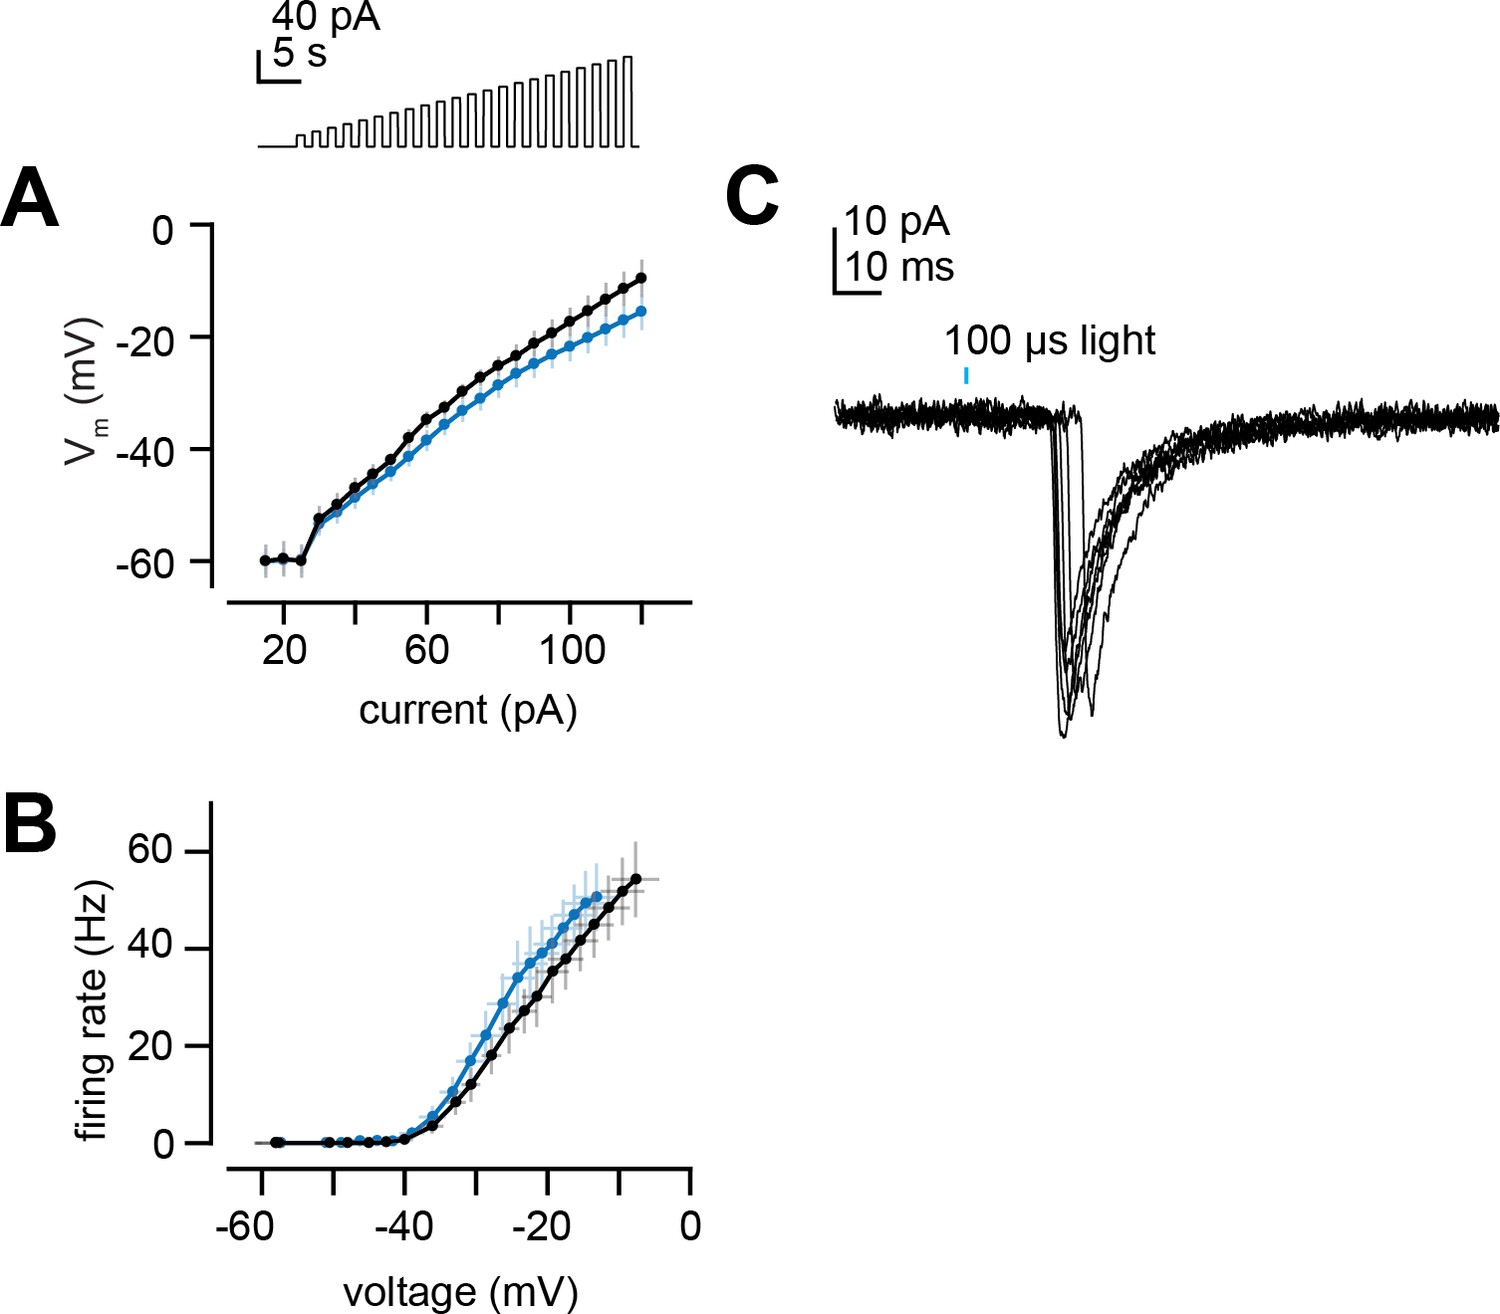
Projection neuron (PN) intrinsic properties and latency of light-evoked excitatory postsynaptic currents (EPSCs).
(A) Membrane potential versus current for increasing steps of current injection (from Figure 7B) in deafferented DL5 PNs from E2-hexenal- and solvent-exposed flies. (B) Same as (A) but plotting firing rate versus membrane potential at each current step. (C) EPSCs evoked by a 100 μs pulse of light (488 nm,~0.175 mW/mm2) in a deafferented DL5 PN from a solvent-reared fly expressing CsChrimson in presynaptic ab4a olfactory receptor neurons (ORNs). Note the variable latency to the peak of the evoked EPSC, which is consistent with the approximate latency of the first light-evoked spike in ORN recordings from in the antenna. EPSCs are aligned by their peaks for averaging across trials in Figure 7E–G.
Additional files
-
Supplementary file 1
Complete genotypes and n for all experiments.
Where only a subset of stimuli is plotted due to space constraints, bolded entries correspond to the stimuli represented in the figure. Solvent is paraffin oil.
- https://cdn.elifesciences.org/articles/85443/elife-85443-supp1-v2.docx
-
MDAR checklist
- https://cdn.elifesciences.org/articles/85443/elife-85443-mdarchecklist1-v2.pdf
Download links
A two-part list of links to download the article, or parts of the article, in various formats.
Downloads (link to download the article as PDF)
Open citations (links to open the citations from this article in various online reference manager services)
Cite this article (links to download the citations from this article in formats compatible with various reference manager tools)
Chronic exposure to odors at naturally occurring concentrations triggers limited plasticity in early stages of Drosophila olfactory processing
eLife 12:e85443.
https://doi.org/10.7554/eLife.85443


