Identification of a carbohydrate recognition motif of purinergic receptors
- State Key Laboratory of Drug Research, Carbohydrate-Based Drug Research Center and National Center for Drug Screening, Shanghai Institute of Materia Medica, Chinese Academy of Sciences, China
- University of Chinese Academy of Sciences, China
- School of Pharmaceutical Science and Technology, Hangzhou Institute of Advanced Study, China
Figures
Figure 1 with 1 supplement
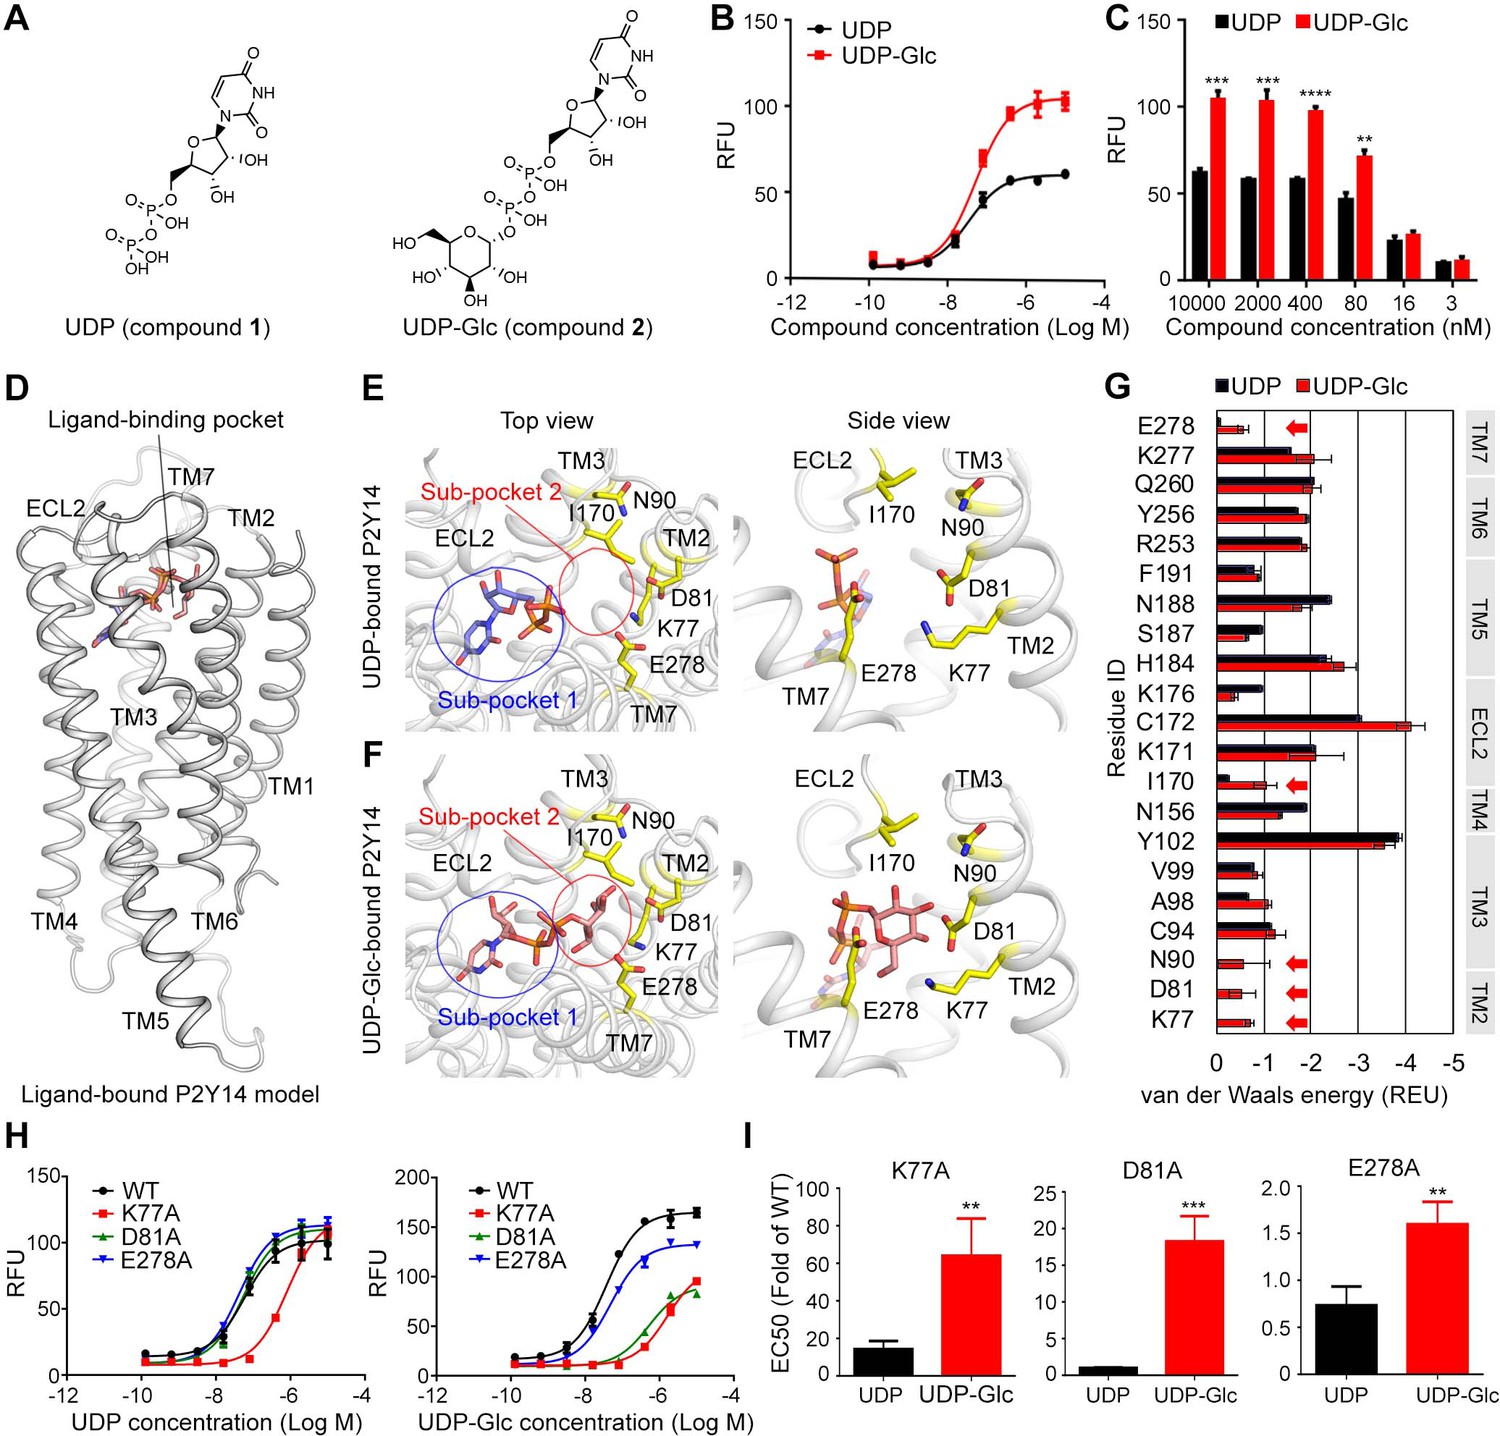
Identification of sugar-binding sites in P2Y purinoceptor 14 (P2Y14).
(A) Chemical structures of uridine diphosphate (UDP) and UDP-glucose (UDP-Glc). (B) Concentration-response curves of calcium mobilization for UDP or UDP-Glc in HEK293 cells transiently co-transfected with human P2Y14 and Gαqi5. Data are shown as mean ± SEM (n=3). See also Figure 1—source data 1 and Supplementary file 1. (C) Concentration-dependent comparison of calcium mobilization for UDP and UDP-Glc in HEK293 cells transiently co-transfected with human P2Y14 and Gαqi5 (n=3); **p<0.01, ***p<0.001, ****p<0.0001. (D) Ligand-bound model of P2Y14. Protein and compound are shown in cartoon and stick representations. (E, F) Docking models of UDP (E) and UDP-Glc (F) to P2Y14. Key residues are highlighted in yellow. Two sub-pockets for ligand binding are marked with circles. (G) Decomposition of ligand-binding energy for each receptor residue (n=10). (H) Calcium mobilization concentration-response curves for UDP or UDP-Glc in HEK293 expressing P2Y14 wild-type (WT) and mutants (n=3). See also Figure 1—source data 2 and Supplementary file 1. (I) Comparison of EC50s for UDP-Glc and UDP in HEK293 cells expressing P2Y14 mutants in calcium mobilization assay (n=3); **p<0.01, ***p<0.001. See also Figure 1—source data 3.
-
Figure 1—source data 1
Potency of uridine diphosphate (UDP) or UDP-glucose (UDP-Glc) in HEK293 cells expressing P2Y purinoceptor 14 (P2Y14).
- https://cdn.elifesciences.org/articles/85449/elife-85449-fig1-data1-v1.docx
-
Figure 1—source data 2
Potency of uridine diphosphate (UDP) or UDP-glucose (UDP-Glc) in HEK293 cells expressing P2Y purinoceptor 14 (P2Y14) wild-type (WT) and mutants.
- https://cdn.elifesciences.org/articles/85449/elife-85449-fig1-data2-v1.docx
-
Figure 1—source data 3
Comparison of EC50s for uridine diphosphate-glucose (UDP-Glc) and UDP in HEK293 cells expressing P2Y purinoceptor 14 (P2Y14) mutants.
- https://cdn.elifesciences.org/articles/85449/elife-85449-fig1-data3-v1.docx
Figure 1—figure supplement 1

The sub-pocket 1 of P2Y purinoceptor 14 (P2Y14) for uridine diphosphate (UDP) and UDP-glucose (Glc).
(A, B) Docking models of UDP (A) and UDP-Glc (B) to P2Y14 showing binding sites for UDP moieties. Protein is shown in cartoon representation. UDP (blue), UDP-Glc (salmon), and key residues (yellow) are shown in stick representation. (C, D) Calcium mobilization concentration-response curves for UDP (C) or UDP-glucose (D) in HEK293 expressing P2Y14 wild-type (WT) and mutants. Data are shown as mean ± SEM (n=3). See also Figure 1—source data 2.
Figure 2 with 1 supplement
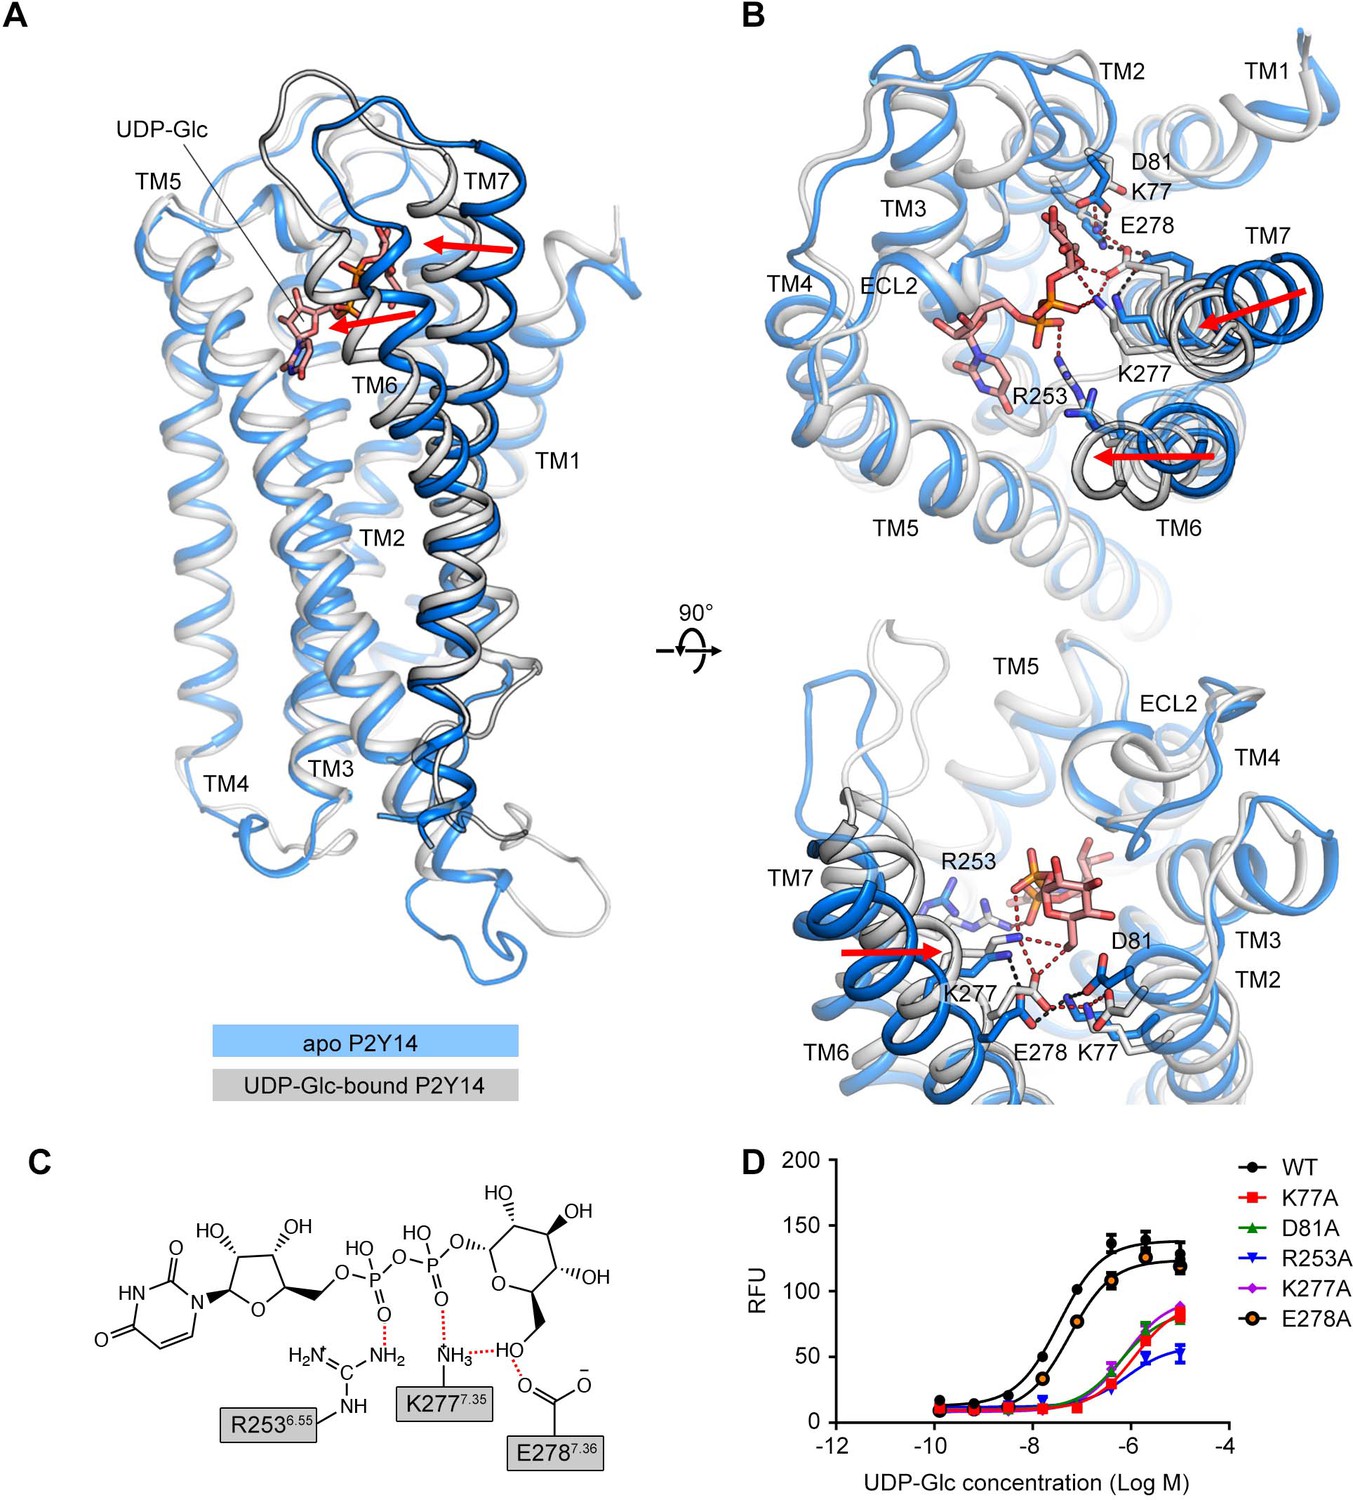
Comparison of the apo P2Y purinoceptor 14 (P2Y14) and uridine diphosphate-glucose (UDP-Glc)-bound P2Y14 simulation systems.
(A–B) Side (A) and top (B) views of representative models of apo P2Y14 and UDP-Glc-bound P2Y14. Receptor is shown as cartoon. Ligand and key residues are shown as sticks. Movement of the extracellular tips of transmembrane (TM)6 and TM7 toward the receptor core is shown by arrows. See Supplementary file 2 for computational characterization of conformational changes. (C) Key interactions between P2Y14 and UDP-Glc. Hydrogen bonds and salt bridges are displayed as red dashed lines. See Supplementary file 2 for pairwise interaction details. (D) Concentration-response curves of calcium mobilization for UDP-Glc in HEK293 expressing P2Y14 wild-type (WT) and mutants. Data are shown as mean ± SEM (n=3). See also Figure 2—source data 1 and Supplementary file 1.
-
Figure 2—source data 1
Potency of uridine diphosphate-glucose (UDP-Glc) in HEK293 expressing P2Y purinoceptor 14 (P2Y14) wild-type (WT) and mutants.
- https://cdn.elifesciences.org/articles/85449/elife-85449-fig2-data1-v1.docx
Figure 2—figure supplement 1

Transmembrane (TM)6 orientation in apo P2Y purinoceptor 14 (P2Y14) and uridine diphosphate-glucose (UDP-Glc)-bound P2Y14 simulation systems.
(A–B) Side (A) and top (B) views of representative models of apo P2Y14 and UDP-Glc-bound P2Y14. Receptor is shown as cartoon. Ligand and key residues are shown as sticks. Movement of the extracellular tip of TM6 toward TM5 is shown by arrows. See Supplementary file 2 for pairwise interaction details. (C) Concentration-response curves of calcium mobilization for UDP-Glc in HEK293 expressing P2Y14 wild-type (WT) and T257A mutant. Data are shown as mean ± SEM (n=3). See also Figure 2—source data 1 and Supplementary file 1.
Figure 3 with 4 supplements
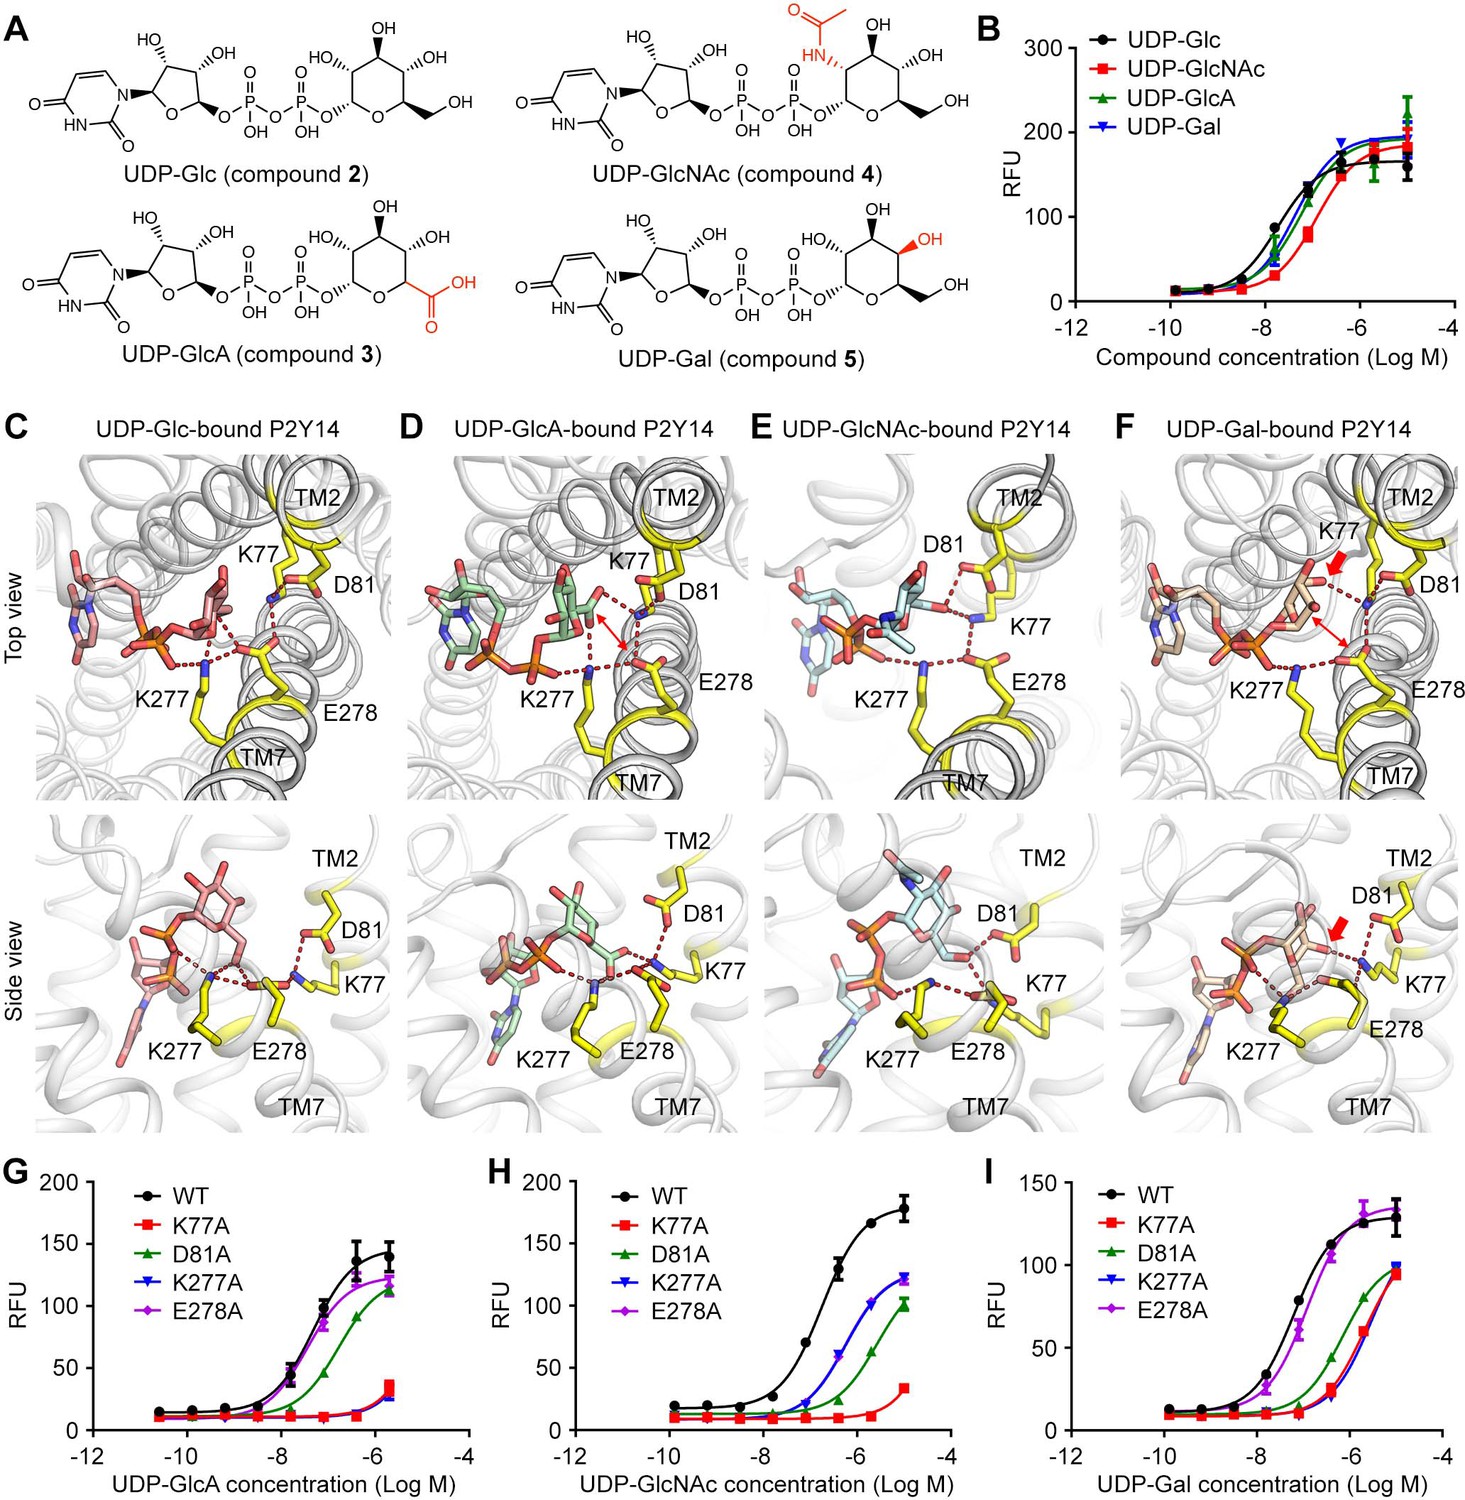
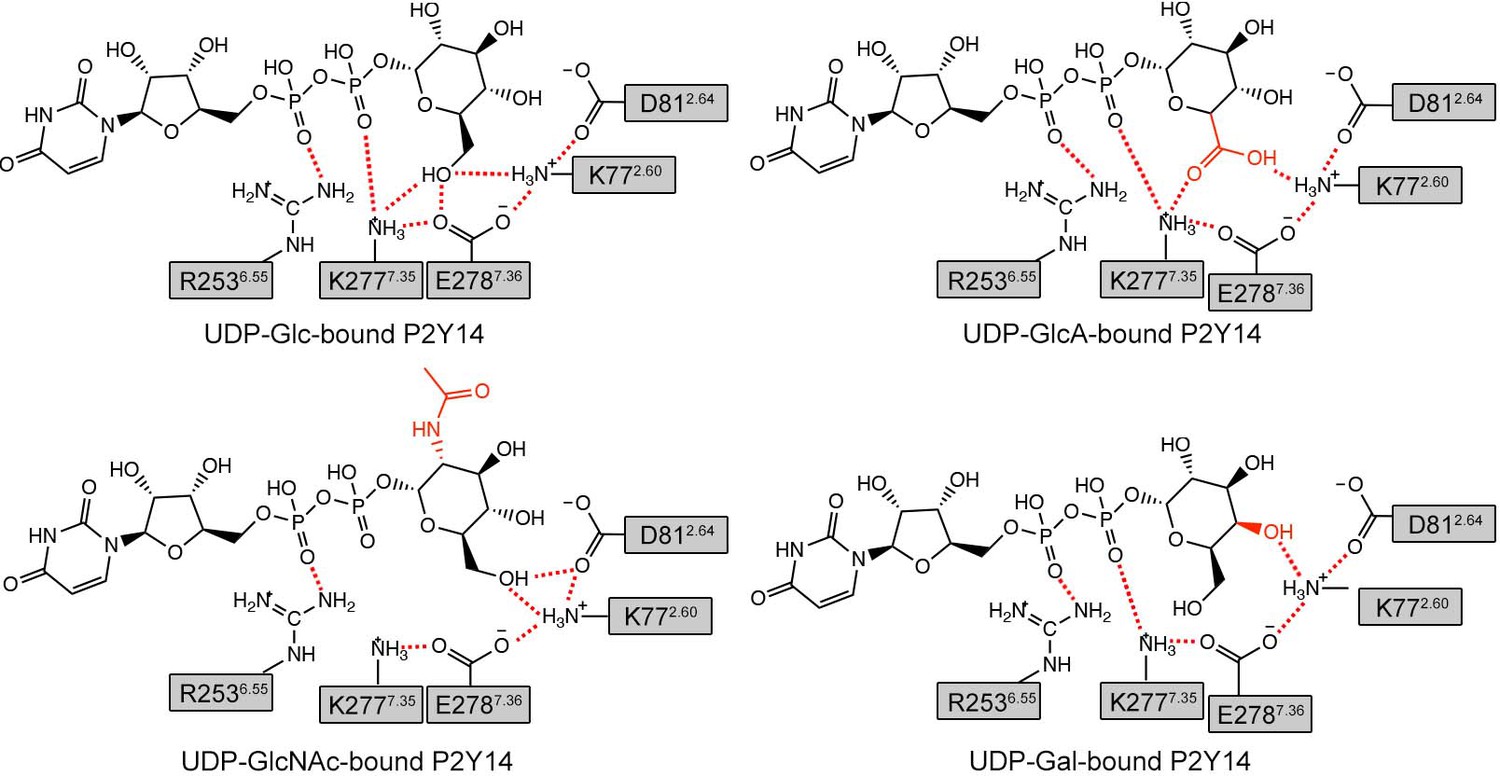
Sugar moiety recognition of P2Y purinoceptor 14 (P2Y14).
(A) Chemical structures of uridine diphosphate-glucose (UDP-Glc), UDP-glucuronic acid (GlcA), UDP-N-acetylglucosamine (GlcNAc), and UDP-galactose (Gal). (B) Concentration-response curves of calcium mobilization for different UDP-sugars in HEK293 cells transiently co-transfected with human P2Y14 and Gαqi5. Data are shown as mean ± SEM (n=3). See also Figure 3—source data 1. (C–F) Molecular recognition of P2Y14 for UDP-Glc (C), UDP-GlcA (D), UDP-GlcNAc (E), and UDP-Gal (F). Receptor, ligands, and key residues are shown in cartoon and stick representations. Hydrogen bonds and salt bridges are displayed as red dashed lines. See Supplementary file 2 for pairwise interaction details. (G–I) Concentration-response curves of calcium mobilization for UDP-GlcA (G), UDP-GlcNAc (H), and UDP-Gal (I) in HEK293 expressing P2Y14 wild-type (WT) and mutants. Data are shown as mean ± SEM (n=3). See also Figure 3—source data 2.
-
Figure 3—source data 1
Potency of uridine diphosphate-glucuronic acid (UDP-GlcA), UDP-N-acetylglucosamine (GlcNAc), and UDP-galactose (Gal) in HEK293 expressing P2Y purinoceptor 14 (P2Y14).
- https://cdn.elifesciences.org/articles/85449/elife-85449-fig3-data1-v1.docx
-
Figure 3—source data 2
Potency of uridine diphosphate-glucuronic acid (UDP-GlcA), UDP-N-acetylglucosamine (GlcNAc), and UDP-galactose (Gal) in HEK293 expressing P2Y purinoceptor 14 (P2Y14) wild-type (WT) and mutants.
- https://cdn.elifesciences.org/articles/85449/elife-85449-fig3-data2-v1.docx
Figure 3—figure supplement 1
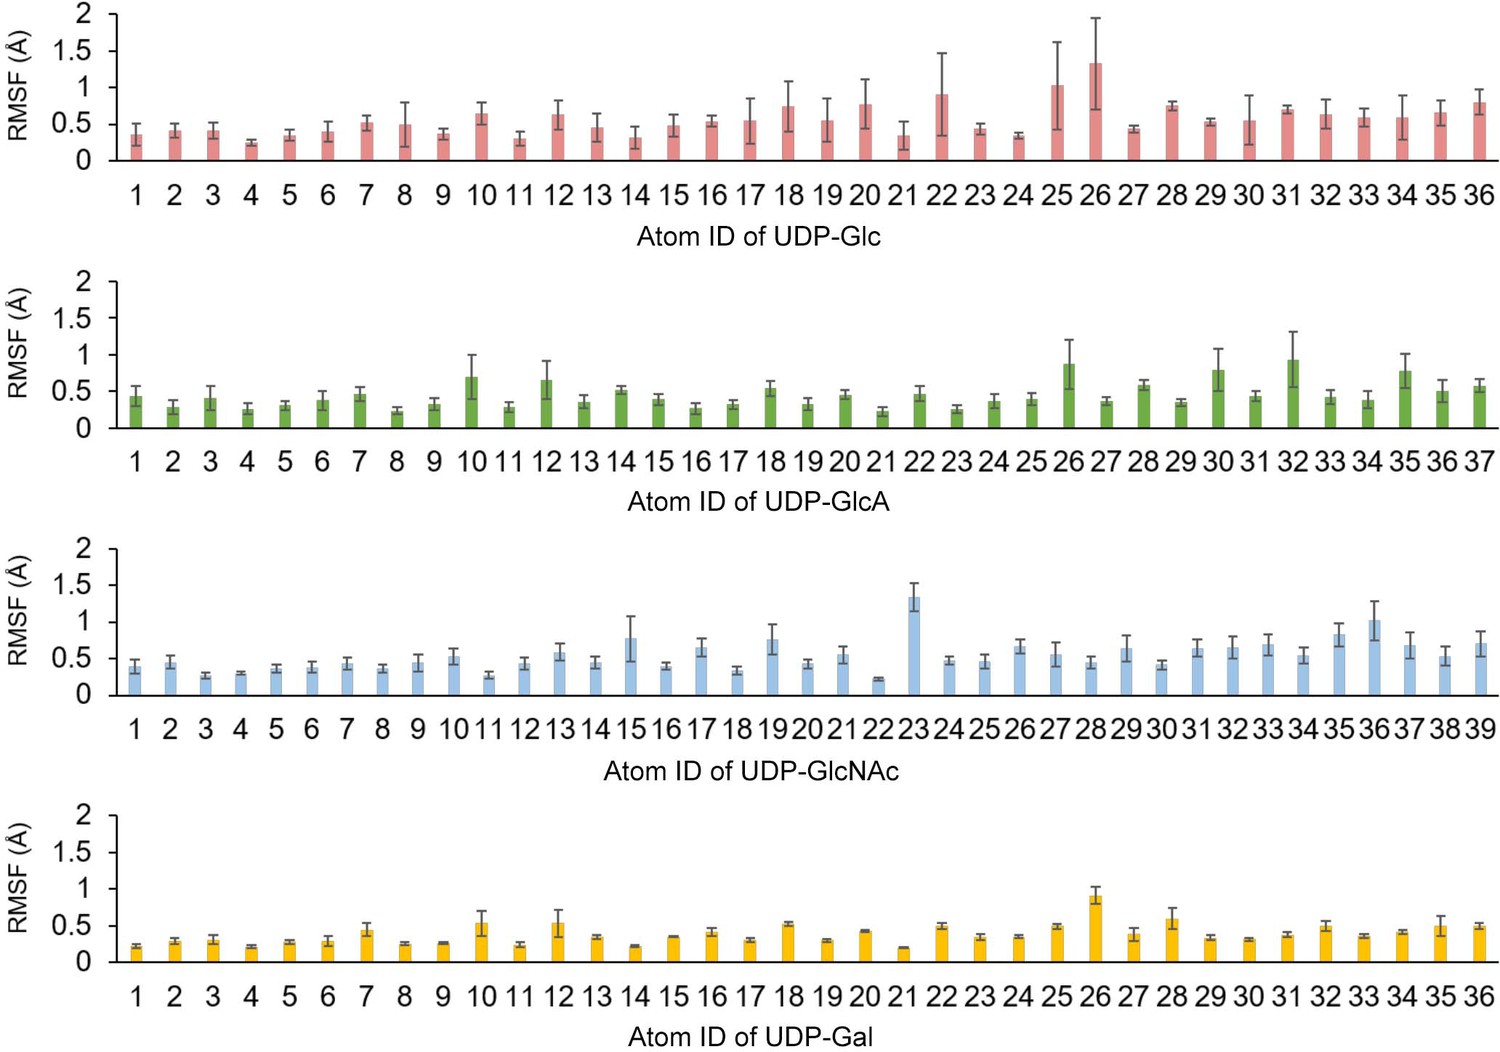
Root mean square fluctuation (RMSF) values of ligand massive atomic position in simulations.
Error bars indicate standard deviations involving three independent molecular dynamics (MD) simulation trajectories.
Figure 3—figure supplement 2
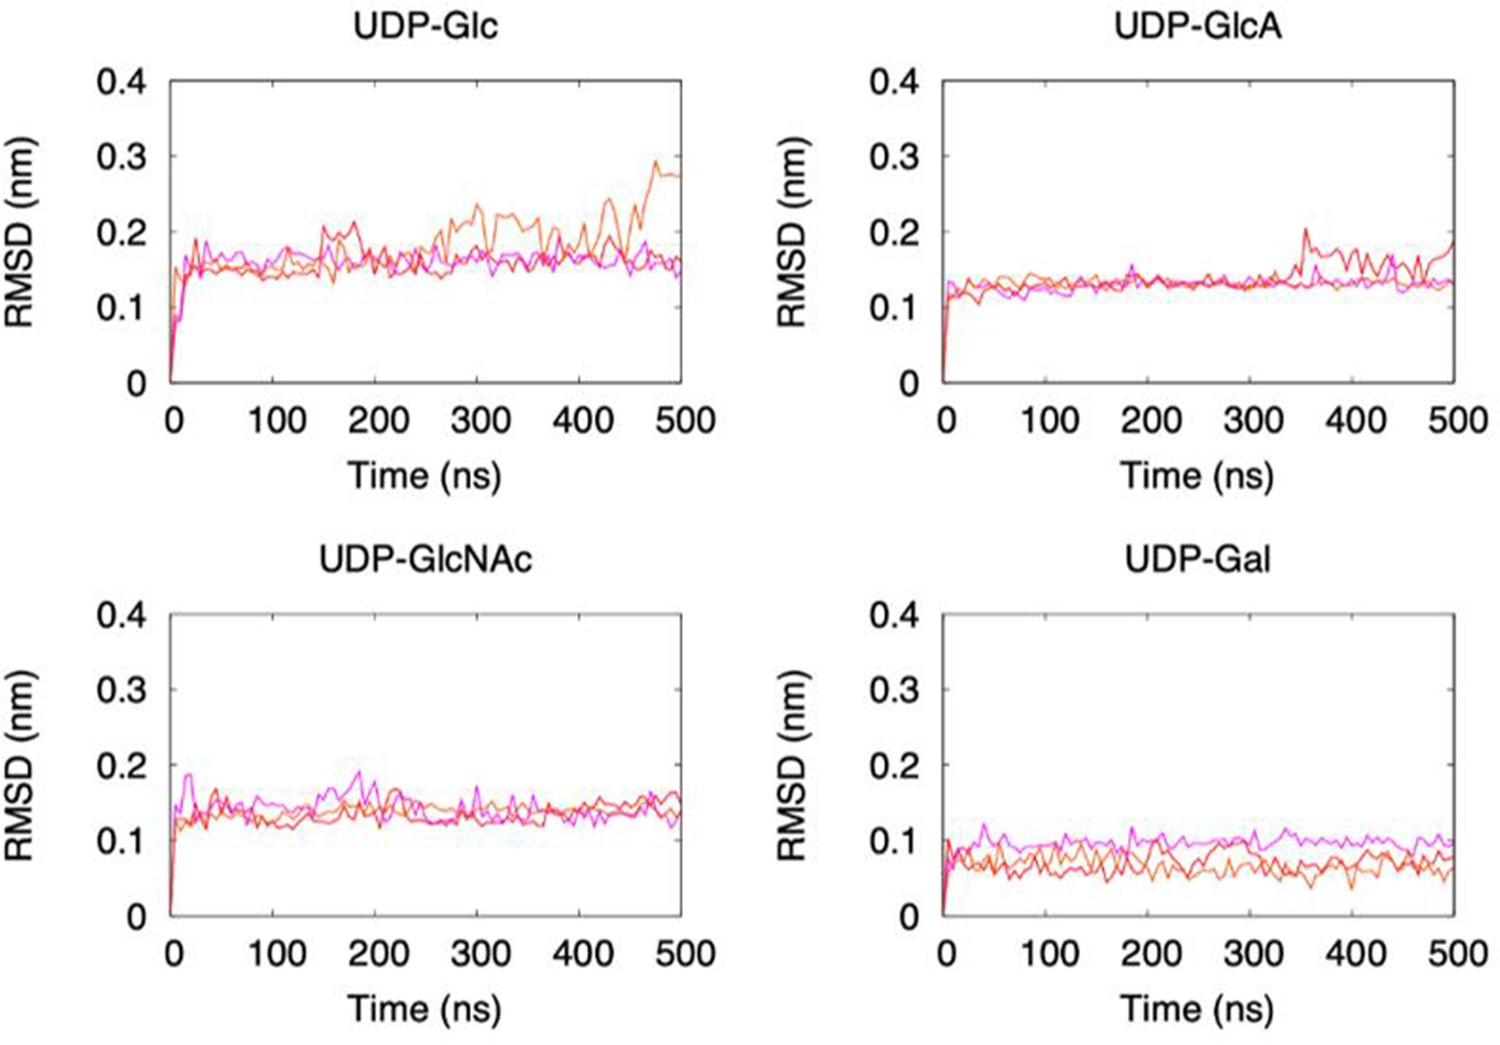
Root mean square deviations (RMSD) values of ligand massive atoms as a function of time in simulations.
Three replicated simulations were indicated by different colors.
Figure 3—figure supplement 3
Key interactions between P2Y purinoceptor 14 (P2Y14) and a uridine diphosphate (UDP)-sugar in simulations.
Putative hydrogen bonds and salt bridges are displayed as red dashed lines.
Figure 3—figure supplement 4
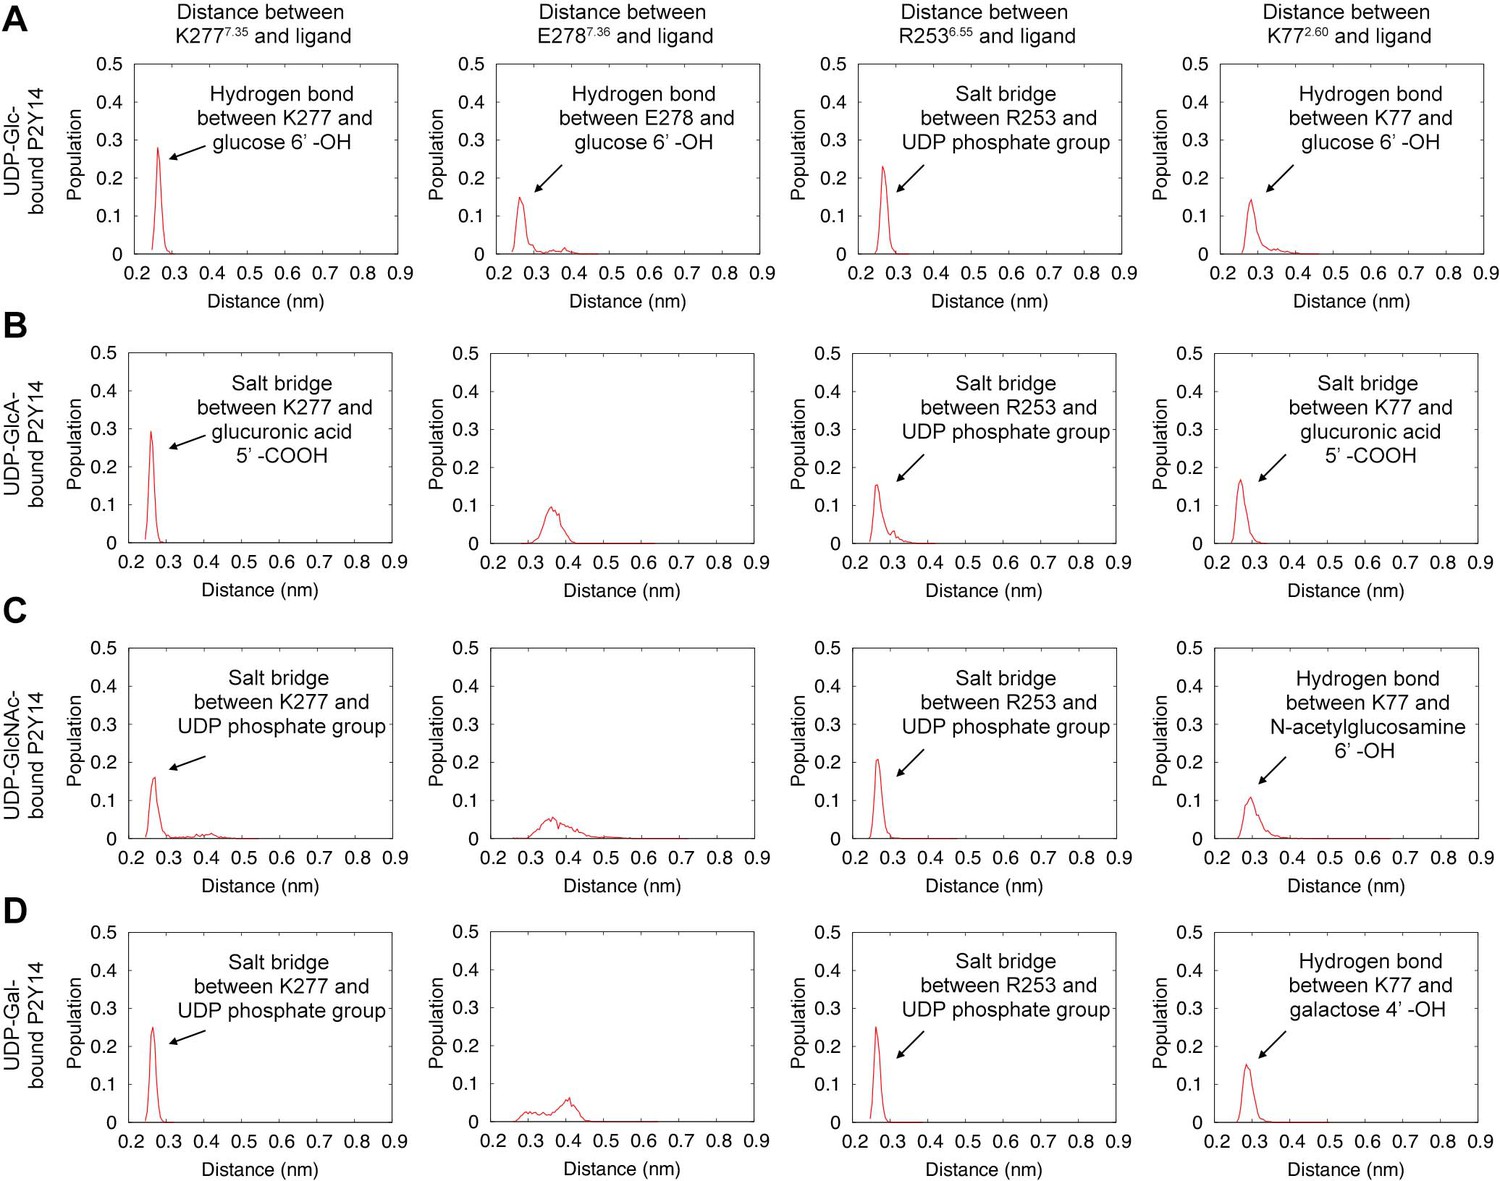
Interactions between a key residue of P2Y purinoceptor 14 (P2Y14) and a uridine diphosphate (UDP)-sugar in simulations.
(A–D) Distribution of distance between key residues (K277, E278, R253, and K77) and a group of UDP-glucose (Glc) (A), UDP-glucuronic acid (GlcA) (B), UDP-N-acetylglucosamine (GlcNAc) (C), or UDP-galactose (Gal) (D) in simulations.
Figure 4 with 4 supplements
Adenosine diphosphate (ADP)-sugars binding to P2Y purinoceptor 12 (P2Y12).
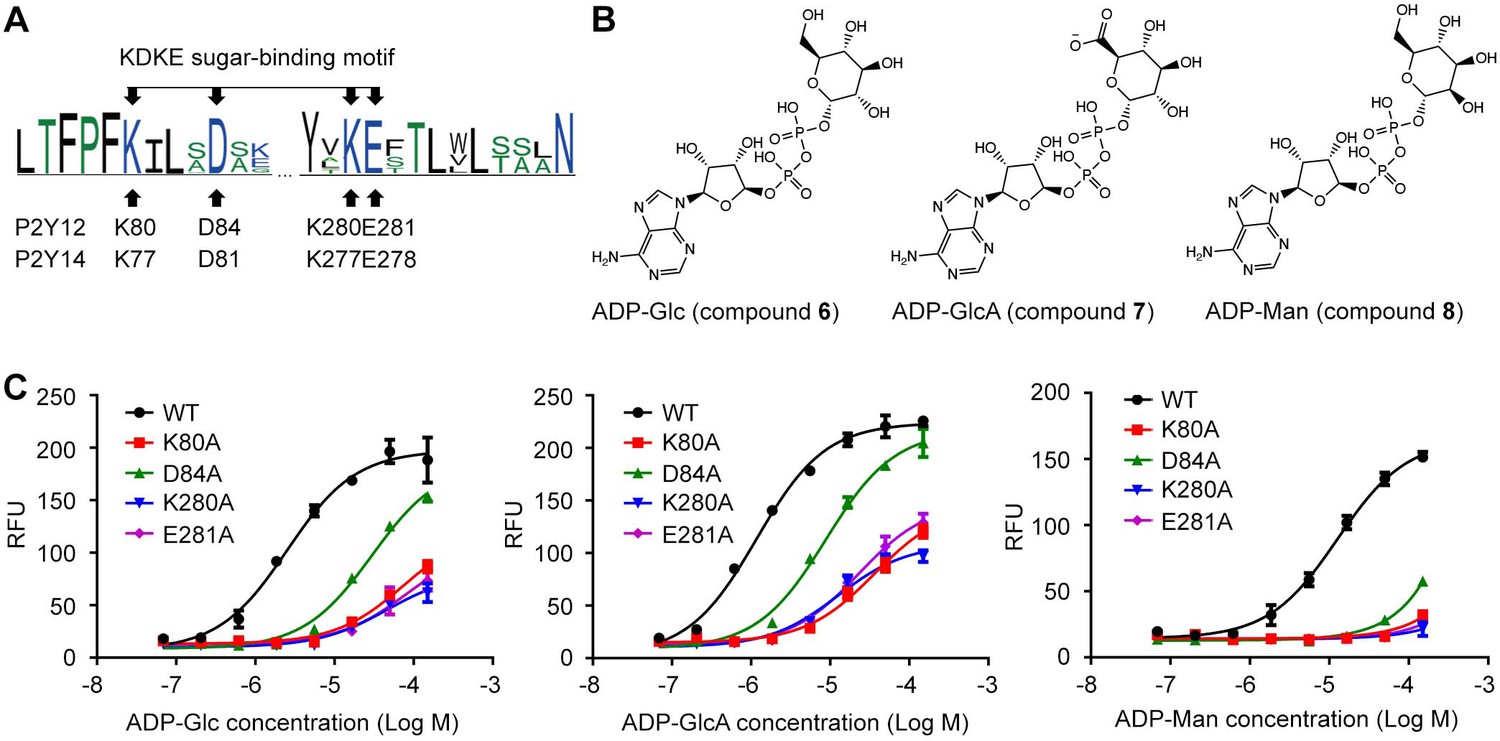
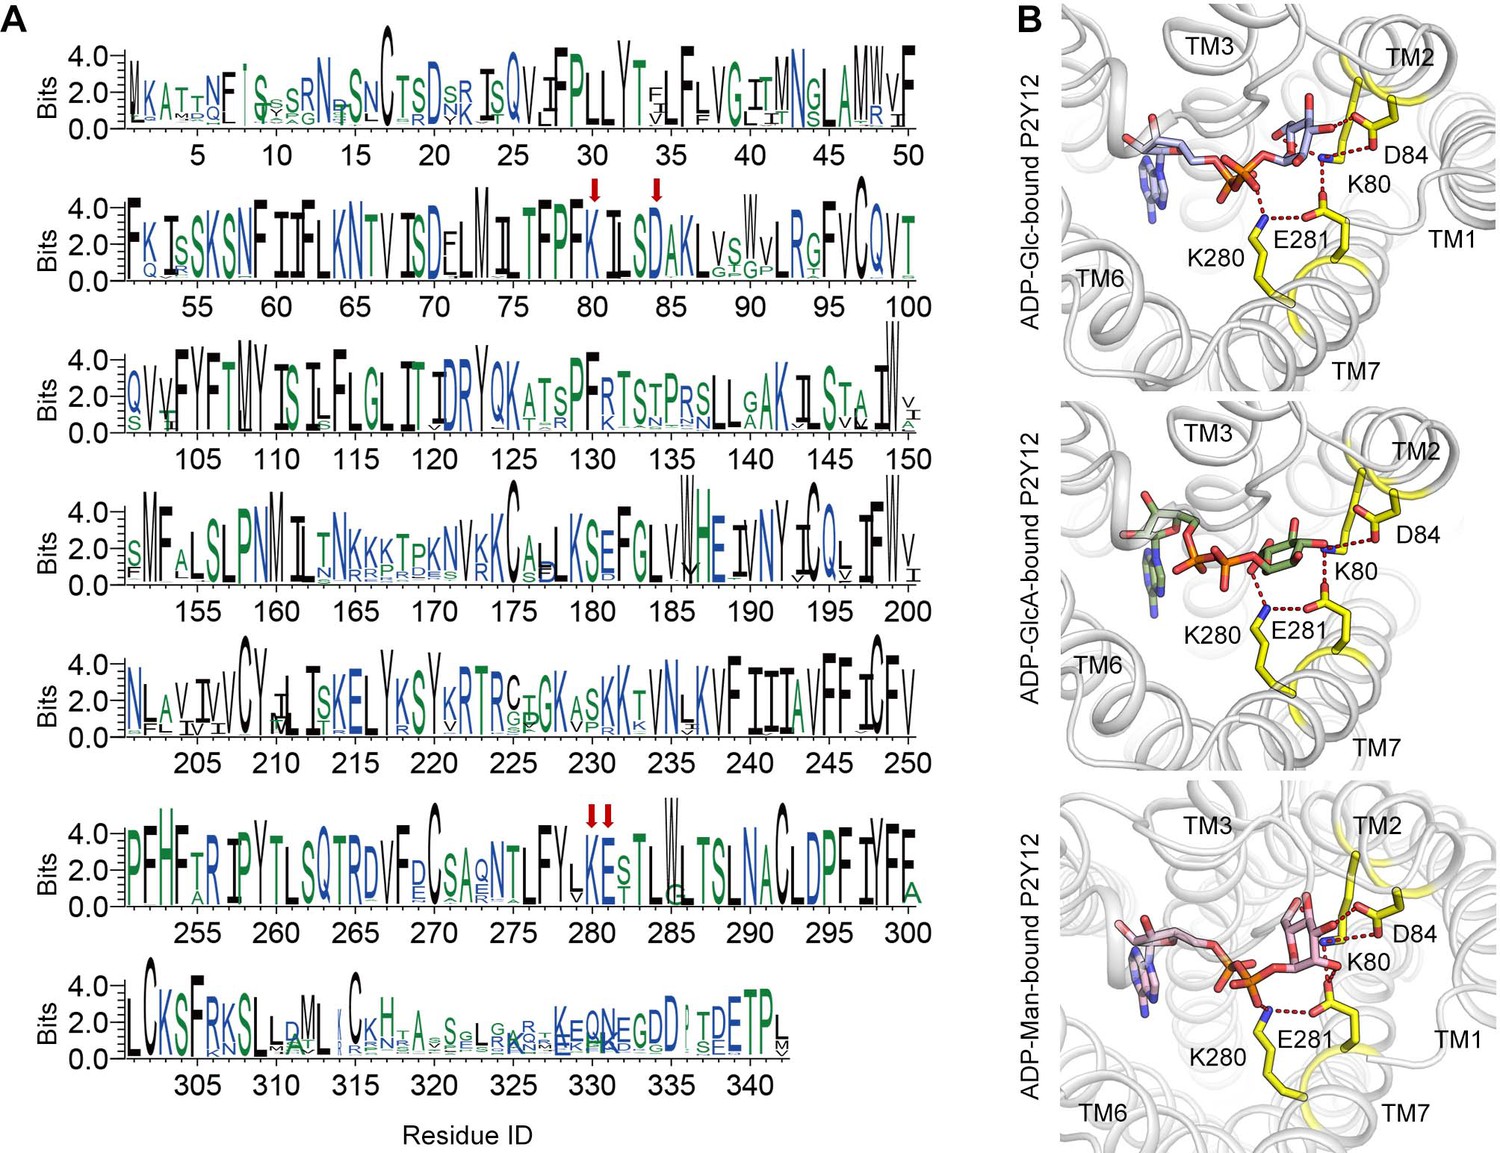
(A) Sequence log of the alignment between P2Y12 and P2Y14. Sequences of P2Y12 and P2Y14 involving 359 species were collected for making sequence alignments. See Supplementary file 3 and Figure 4—source data 1 for species repertoire information. The height of a letter is proportional to the relative frequency of that residue at a particular site. Four residues of K2.60-D2.64-K7.35-E7.36 (KDKE) sugar-binding motif are marked by arrows, with the corresponding residues in P2Y12 and P2Y14. (B) Chemical structure of ADP-glucose (Glc), ADP-glucuronic acid (GlcA), and ADP-mannose (Man). (C) Calcium mobilization concentration-response curves for ADP-Glc, ADP-GlcA, and ADP-Man in HEK293 expressing P2Y12 wild-type (WT) and mutants. Data are shown as mean ± SEM (n=3). See also Figure 4—source data 1 and Supplementary file 1.
-
Figure 4—source data 1
Potency of adenosine diphosphate-glucose (ADP-Glc), ADP-glucuronic acid (GlcA), and ADP-mannose (Man) in HEK293 expressing P2Y purinoceptor 12 (P2Y12) wild-type (WT) and mutants.
- https://cdn.elifesciences.org/articles/85449/elife-85449-fig4-data1-v1.docx
-
Figure 4—source data 2
The neighbor joining tree of P2Y purinoceptor 12 (P2Y12) showing evolutionary range of species.
- https://cdn.elifesciences.org/articles/85449/elife-85449-fig4-data2-v1.docx
-
Figure 4—source data 3
The neighbor joining tree of P2Y purinoceptor 13 (P2Y13) showing evolutionary range of species.
- https://cdn.elifesciences.org/articles/85449/elife-85449-fig4-data3-v1.docx
-
Figure 4—source data 4
The neighbor joining tree of P2Y purinoceptor 14 (P2Y14) showing evolutionary range of species.
- https://cdn.elifesciences.org/articles/85449/elife-85449-fig4-data4-v1.docx
-
Figure 4—source data 5
The neighbor joining tree of GPR87 showing evolutionary range of species.
- https://cdn.elifesciences.org/articles/85449/elife-85449-fig4-data5-v1.docx
Figure 4—figure supplement 1
Conserved sugar-binding site on P2Y purinoceptor 12 (P2Y12).
(A) Conservation of each residue on P2Y12. The height of a letter is proportional to the relative frequency of that residue at a particular site. Residues of K2.60-D2.64-K7.35-E7.36 (KDKE) sugar-binding motif are labeled with red arrows. See Supplementary file 3 for species repertoire information. (B) Docking models of adenosine diphosphate (ADP)-sugars to P2Y12. Receptor is shown as cartoon. Ligands and key residues are shown as sticks. Residues of KDKE sugar-binding motif are highlighted in yellow. Putative salt bridges are shown as red dashed lines.
Figure 4—figure supplement 2
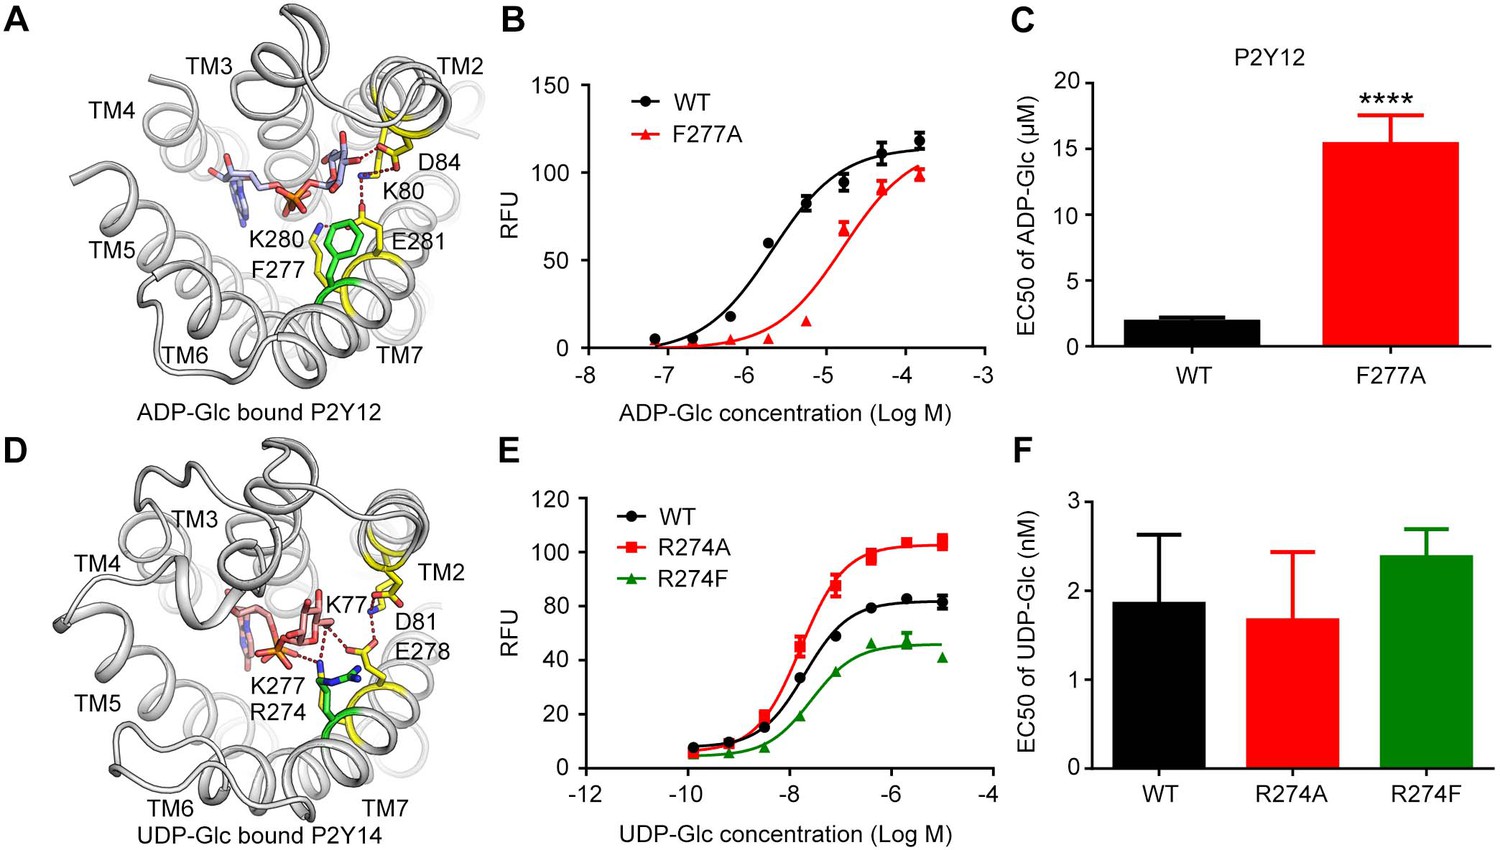
F2777.32 as a key residue in sugar recognition of P2Y purinoceptor 12 (P2Y12).
(A) Location of F2777.32 in the docking model of adenosine diphosphate-glucose (ADP-Glc)-bound P2Y12. Receptor is shown as cartoon. Ligands and key residues are shown as sticks. Residues of K2.60-D2.64-K7.35-E7.36 (KDKE) sugar-binding motif are highlighted in yellow. F2777.32 is highlighted in green. Putative salt bridges are shown as red dashed lines. (B, C) Calcium mobilization concentration-response curves (B) and EC50 values (C) for ADP-Glc in HEK293 expressing P2Y12 wild-type (WT) and mutants. Data are shown as mean ± SEM (n=3). **** indicates p value less than 0.0001. (D) Location of R2747.32 in the molecular dynamics (MD) model of uridine diphosphate (UDP)-Glc-bound P2Y14. R2747.32 is highlighted in green. (E, F) Calcium mobilization concentration-response curves (E) and EC50 values (F) for UDP-Glc in HEK293 expressing P2Y14 wild-type (WT) and mutants. See also Figure 4—source data 1 and Supplementary file 1.
Figure 4—figure supplement 3

Conservation of each residue on P2Y purinoceptor 13 (P2Y13).
The height of a letter is proportional to the relative frequency of that residue at a particular site. Residues of K2.60, D2.64, K7.35, and E7.36 sites are labeled with red arrows. N.S. indicates the conservation is not significant. See Supplementary file 3 for species repertoire information.
Figure 4—figure supplement 4

Conservation of each residue on GPR87.
The height of a letter is proportional to the relative frequency of that residue at a particular site. Residues of K/R2.60, D2.64, K/E7.35, and E7.36 sites are labeled with red arrows. See Supplementary file 3 for species repertoire information.
Author response image 1

Conservation of each residue on P2Y12 in 14 anamniotes.
The height of a letter is proportional to the relative frequency of that residue at a particular site. Residues of KDKE sugar-binding motif are labeled with red arrows. See Supplementary file 3 for species repertoire information.
Author response image 2

Conservation of each residue on P2Y13 in 20 anamniotes.
The height of a letter is proportional to the relative frequency of that residue at a particular site. Residues of KDKE sugar-binding motif are labeled with red arrows. See Supplementary file 3 for species repertoire information.
Author response image 3

Conservation of each residue on P2Y14 in 359 common species (left) and 56 anamniotes (right).
The height of a letter is proportional to the relative frequency of that residue at a particular site. Residues of KDKE sugar-binding motif are labeled with red arrows. See Supplementary file 3 for species repertoire information.
Author response image 4

Conservation of each residue on GPR87 in 14 anamniotes.
The height of a letter is proportional to the relative frequency of that residue at a particular site. Residues of KDKE sugar-binding motif are labeled with red arrows. See Supplementary file 3 for species repertoire information.
Author response image 5

Sequence log of the alignment between P2Y14 and P2Y12.
Sequences of P2Y14 and P2Y12 involving 359 species were collected for making sequence alignments. See Supplementary file 3 for species repertoire information. The height of a letter is proportional to the relative frequency of that residue at a particular site. Sugar nucleotide-binding residues are highlighted in yellow. Four residues of KDKE sugar-binding motif are marked by arrows, with the corresponding residues in P2Y14 and P2Y12.
Author response image 6

Binding of UDP to P2Y14 in MD simulations.
(A) A representative simulation model showing UDP in the sub-pocket of P2Y14. Key residues are highlighted in yellow. Two sub-pockets for ligand binding are marked with circles. (B) Massive atom distance between UDP and K77 in three independent simulations of UDP-bound P2Y14. Three replicated simulations were indicated by different colors.
Author response image 7

Decomposition of UDP-Glc-binding contribution for each receptor residue using MMPBSA.
Tables
Key resources table
| Reagent type (species) or resource | Designation | Source or reference | Identifiers | Additional information |
|---|---|---|---|---|
| Gene (Homo sapiens) | P2Y14 | GenBank | NM_001081455.2 | |
| Gene (Homo sapiens) | P2Y12 | GenBank | NM_022788.5 | Optimized |
| Strain, strain background (Escherichia coli) | Trans5α Chemically Competent Cell | TransGen Biotech | Cat.No: CD201-01 | |
| Cell line (Homo sapiens) | HEK293 | ATCC | CRL-1573 | |
| Antibody | Anti-HA primary antibody (Rabit monoclonal) | Cell Signaling Technology | Cat.No: 3724. | FCM (1:800) |
| Antibody | Goat anti-rabbit IgG(H+L) FITC conjugate secondary antibody (Goat monoclonal) | TransGen Biotech | Cat.No: HS111 | FCM (1:200) |
| Recombinant DNA reagent | pCDNA3-HA(plasmid) | This paper | HA version of pCDNA3 | |
| Sequence-based reagent | P2Y14-K77A-F | This paper | PCR primers | GACTTTTCCT TTCGCGATCC TTGGTGAC |
| Sequence-based reagent | P2Y14-K77A-R | This paper | PCR primers | GTCACCAAGG ATCGCGAAAG GAAAAGTC |
| Sequence-based reagent | P2Y14-D81A-F | This paper | PCR primers | CAAGATCCT TGGTGCCTC AGGCCTTGG |
| Sequence-based reagent | P2Y14-D81A-R | This paper | PCR primers | GACCAAGGCC TGAGGCACCAA GGATCTTG |
| Sequence-based reagent | P2Y14-N90A-F | This paper | PCR primers | GTCCCTGGCA GCTGGCCGTG TTTGTGTGCAG |
| Sequence-based reagent | P2Y14-N90A-R | This paper | PCR primers | CTGCACACAAA CACGGCCAGCT GCCAGGGAC |
| Sequence-based reagent | P2Y14-I170A-F | This paper | PCR primers | GAGGTTACACA AGCAAAATGTA TAGAACTG |
| Sequence-based reagent | P2Y14-I170A-R | This paper | PCR primers | GTTCTATACATT TTGCTTGTGTAA CCTC |
| Sequence-based reagent | P2Y14-R274A-F | This paper | PCR primers | CAAAAGAAA TCTTGGCGT ATATGAAAG AATTC |
| Sequence-based reagent | P2Y14-R274A-R | This paper | PCR primers | GAATTCTTTC ATATACGCCA AGATTTCTTTT G |
| Sequence-based reagent | P2Y14-K277A-F | This paper | PCR primers | CTTGCGGTAT ATGGCAGAAT TCACTCTG |
| Sequence-based reagent | P2Y14-K277A-R | This paper | PCR primers | CAGAGTGAAT TCTGCCATAT ACCGCAAG |
| Sequence-based reagent | P2Y14-E278A-F | This paper | PCR primers | GCGGTATAT GAAAGCATT CACTCTGCT AC |
| Sequence-based reagent | P2Y14-E278A-R | This paper | PCR primers | GTAGCAGAG TGAATGCTTT CATATACCG |
| Sequence-based reagent | P2Y12-K80A-F | This paper | PCR primers | CACATTCCC ATTCGCGAT CCTGTCAGA TG |
| Sequence-based reagent | P2Y12-K80A-R | This paper | PCR primers | CATCTGACAG GATCGCGAAT GGGAATGTG |
| Sequence-based reagent | P2Y12-D84A-F | This paper | PCR primers | CAAGATCCTGT CAGCTGCCAAG CTCGGTAC |
| Sequence-based reagent | P2Y12-D84A-R | This paper | PCR primers | GTACCGAGCTT GGCAGCTGACA GGATCTTG |
| Sequence-based reagent | P2Y12-F277A-F | This paper | PCR primers | GAGAACACTC TGGCCTACGT CAAGGAATC |
| Sequence-based reagent | P2Y12-F277A-R | This paper | PCR primers | GATTCCTTGAC GTAGGCCAGAG TGTTCTC |
| Sequence-based reagent | P2Y12-K280A-F | This paper | PCR primers | CTGTTCTACGT CGCGGAATCCA CATTG |
| Sequence-based reagent | P2Y12-K280A-R | This paper | PCR primers | CAATGTGGATT CCGCGACGTAG AACAG |
| Sequence-based reagent | P2Y12-E281A-F | This paper | PCR primers | GTTCTACGTCA AGGCATCCACA TTGTGGC |
| Sequence-based reagent | P2Y12-E281A-R | This paper | PCR primers | GCCACAATGTG GATGCCTTGAC GTAGAAC |
| Commercial assay or kit | KOD-plus-Ver.2 | TOYOBO | Cat.No: KOD-211 | |
| Commercial assay or kit | MycoBlue Mycoplasma Detector | Vazyme | Cat.No: D101-01 | |
| Software, algorithm | GraphPad Prism 6 | GraphPad Prism 6 |
Additional files
-
Supplementary file 1
Expression of mutants in HEK293.
- https://cdn.elifesciences.org/articles/85449/elife-85449-supp1-v1.docx
-
Supplementary file 2
Computational characterization of conformational changes and pairwise interactions of simulation models.
- https://cdn.elifesciences.org/articles/85449/elife-85449-supp2-v1.docx
-
Supplementary file 3
Species repertoire information for receptors.
- https://cdn.elifesciences.org/articles/85449/elife-85449-supp3-v1.docx
-
MDAR checklist
- https://cdn.elifesciences.org/articles/85449/elife-85449-mdarchecklist1-v1.docx
Download links
A two-part list of links to download the article, or parts of the article, in various formats.
Downloads (link to download the article as PDF)
Open citations (links to open the citations from this article in various online reference manager services)
Cite this article (links to download the citations from this article in formats compatible with various reference manager tools)
Identification of a carbohydrate recognition motif of purinergic receptors
eLife 12:e85449.
https://doi.org/10.7554/eLife.85449


