Nested circuits mediate the decision to vocalize
- Department of Neurobiology, Duke University, United States
Figures
Figure 1 with 4 supplements
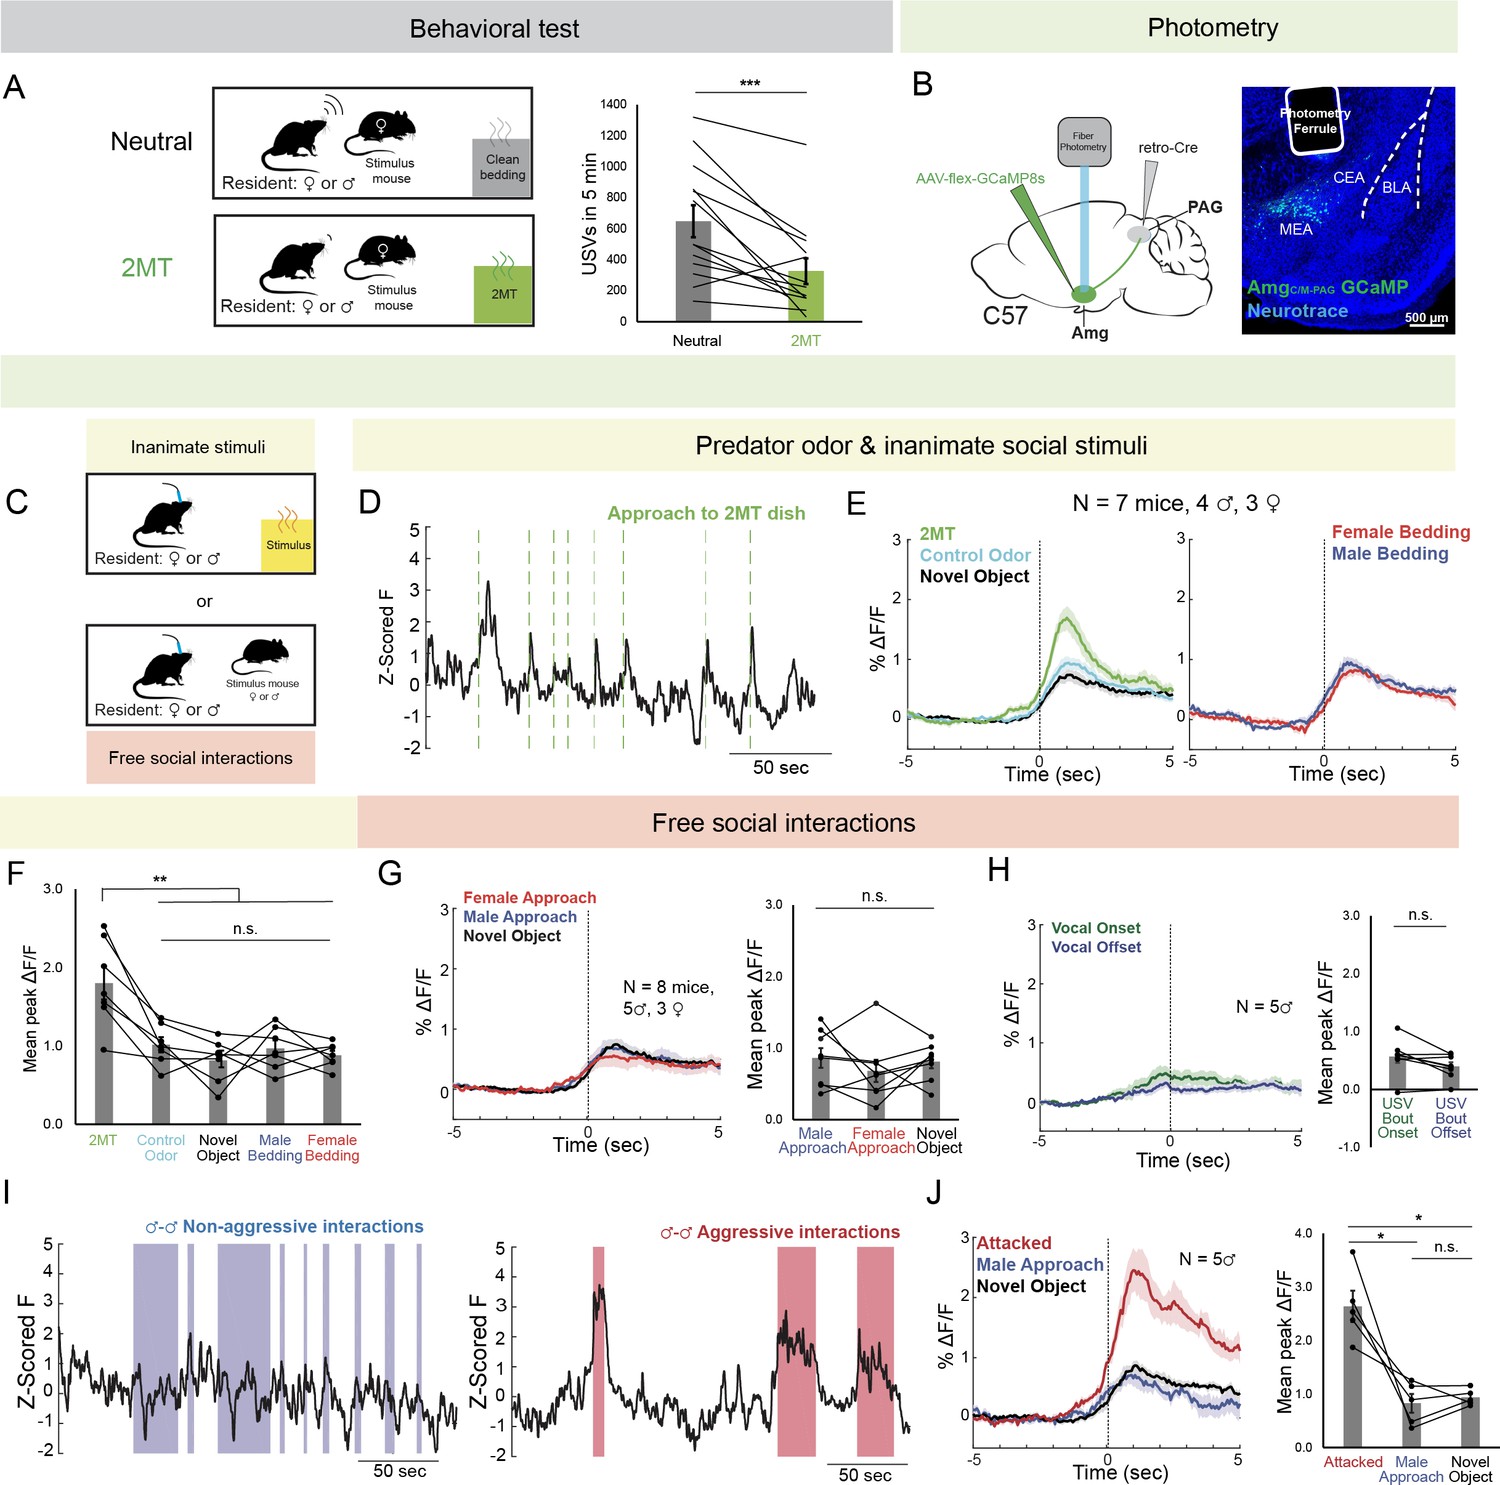
AmgC/M-PAG neurons are active in response to threatening stimuli.
(A) (Left) Schematic shows the behavioral paradigm: in the neutral condition, a stimulus female mouse along with a dish containing clean bedding was placed into the home cage of either a male or a female resident; in the 2MT condition, a stimulus female mouse along with a dish containing 2MT was placed into the home cage of either a male or a female resident. (Right) The number of USVs produced by male or previously isolated female mice during a 5-min encounter with a novel female conspecific in the presence or absence of 2MT. (N=13, 11 males, 2 females; ***p<0.001; paired t test). (B) (Left) Viral strategy for photometry recording of AmgC/M-PAG neurons. (Right) Confocal image showing photometry ferrule tract and GCaMP8s expression in AmgC/M-PAG neurons. (C) Schematic showing behavioral paradigm during photometry recordings: unlike the behavioral test shown in (A), here only one stimulus was presented at a time. (D) Calcium signal in AmgC/M-PAG neurons as a male mouse approached and investigated a dish containing 2MT. Dashed green lines indicate approach onset. (E) Average AmgC/M-PAG activity in males (N=4) and females (N=3) as the animal approached and investigated a dish containing either 2MT, a control odor (ethyl tiglate), or a novel plastic ‘toy’. (F) Mean peak AmgC/M-PAG activity when approaching a dish containing either 2MT, a control odor (ethyl tiglate) or a novel plastic ‘toy’ or the soiled bedding of male or female conspecifics (N=7, 4 males, 3 females; **p<0.01; n.s. p>0.05; one-way ANOVA followed by post-hoc pairwise Tukey’s HSD tests). Error bars represent S.E.M. (G) Average (left) and mean peak (right) AmgC/M-PAG activity in males (N=5) and females (N=3) during non-aggressive social encounters with male or female conspecifics, or with a mouse’s investigation of a novel object (n.s. p>0.05; one-way ANOVA followed by post-hoc pairwise Tukey’s HSD tests). Error bars represent S.E.M. (H) Average (left) and mean peak (right) AmgC/M-PAG activity aligned to vocal onset and offset (N=5 males; n.s. p>0.05; paired t test). (I) Calcium signal in AmgC/M-PAG neurons during non-aggressive (left) and aggressive (right) male-male interactions. (J) Average (left) and mean peak (right) AmgC/M-PAG activity in males (N=5) during attack, non-aggressive social encounters with male conspecifics, or with a mouse’s investigation of a novel object (*p<0.05; n.s. p>0.05; one-way ANOVA followed by post-hoc pairwise Tukey’s HSD tests). Error bars represent S.E.M.
-
Figure 1—source data 1
Source data for Figure 1, Figure 1—figure supplements 1 and 2.
- https://cdn.elifesciences.org/articles/85547/elife-85547-fig1-data1-v2.xlsx
Figure 1—figure supplement 1
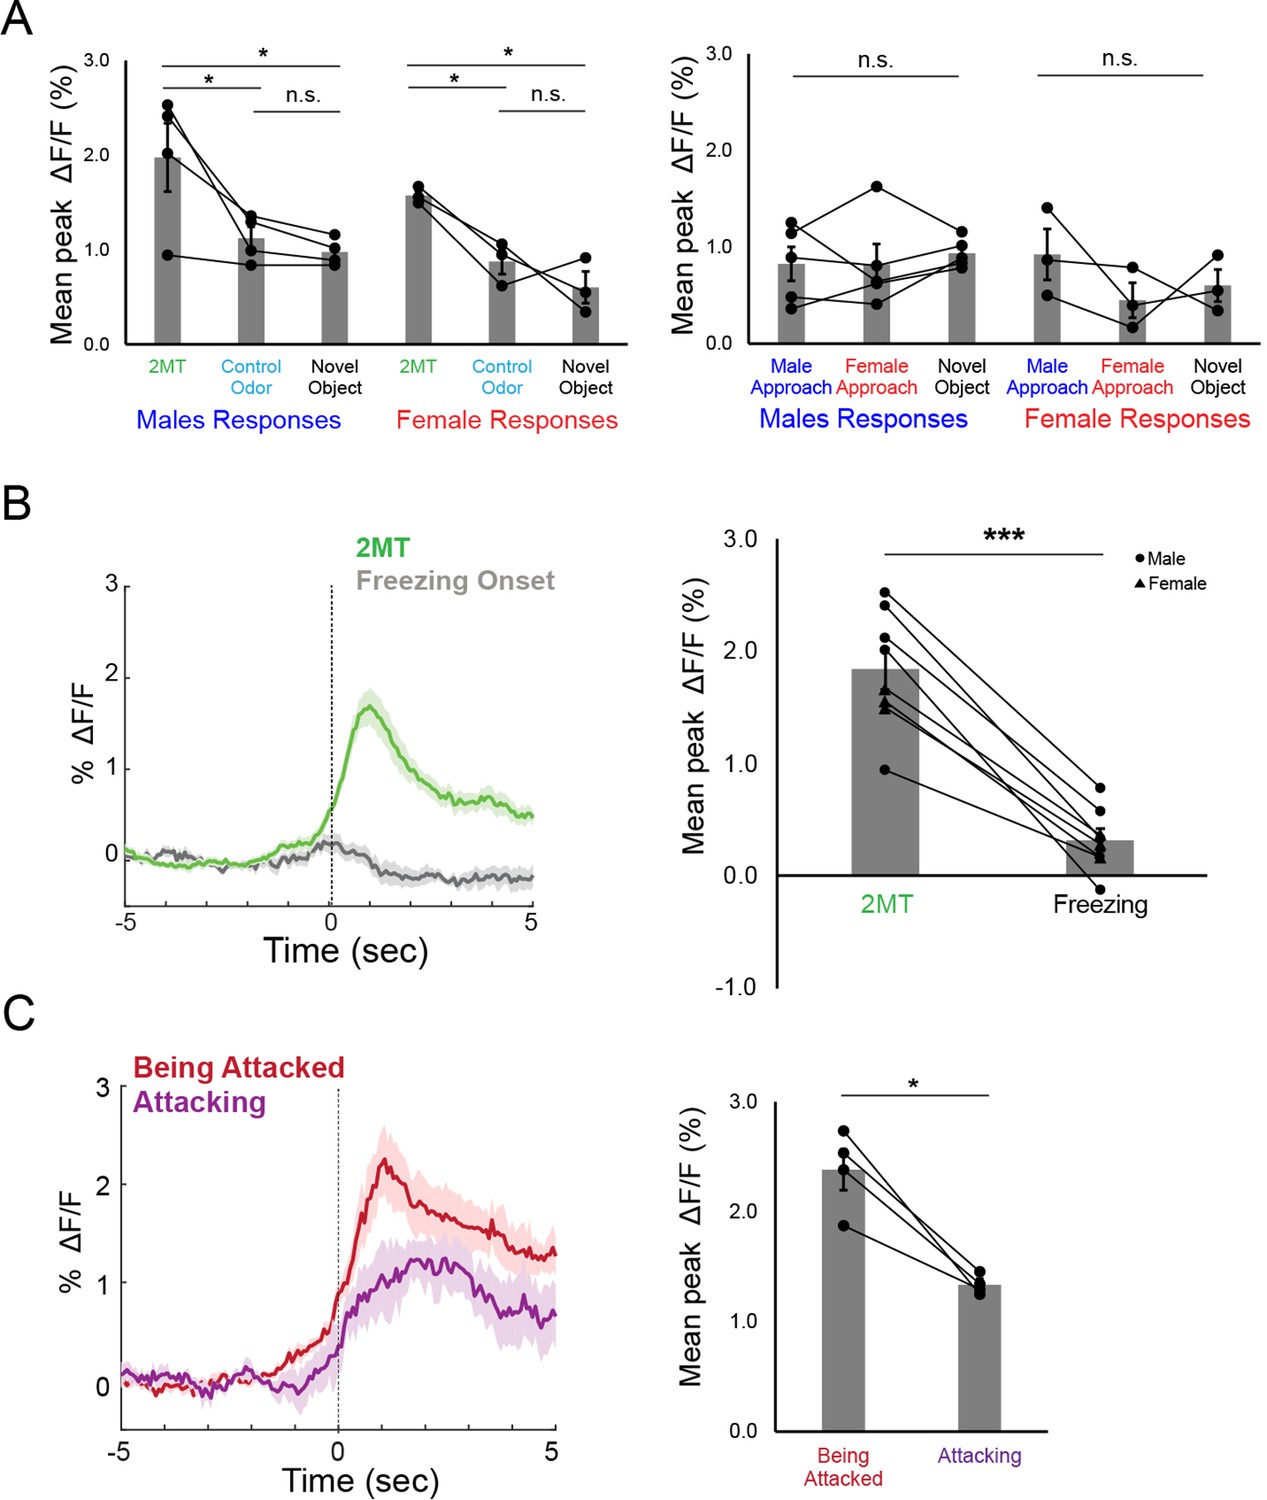
AmgC/M-PAG neurons are the most strongly activated by threatening stimuli.
(A) Mean peak AmgC/M-PAG activity in male and female mice as the animal approached and investigated a dish containing either 2MT, a control odor (ethyl tiglate) or a novel plastic “toy” (left; N=7 mice, 4 males, 3 females) or as the animal approached a conspecific male or a female (right; N=8 mice, 5 males, 3 females; *P<0.05; n.s. P>0.05; one-way ANOVA followed by post-hoc pairwise Tukey’s HSD tests). (B) Average AmgC/M-PAG activity (left) and mean peak AmgC/M-PAG activity (right) as the animal approached and investigated a dish containing 2MT or at the onset of freeze in the presence of 2MT (N=8 mice; ***p<0.001, paired t test). (C) Average AmgC/M-PAG activity (left) and mean peak AmgC/M-PAG activity (right) as the male attacked or got attacked (N=4 males; *p<0.05, paired t test).
Figure 1—figure supplement 2
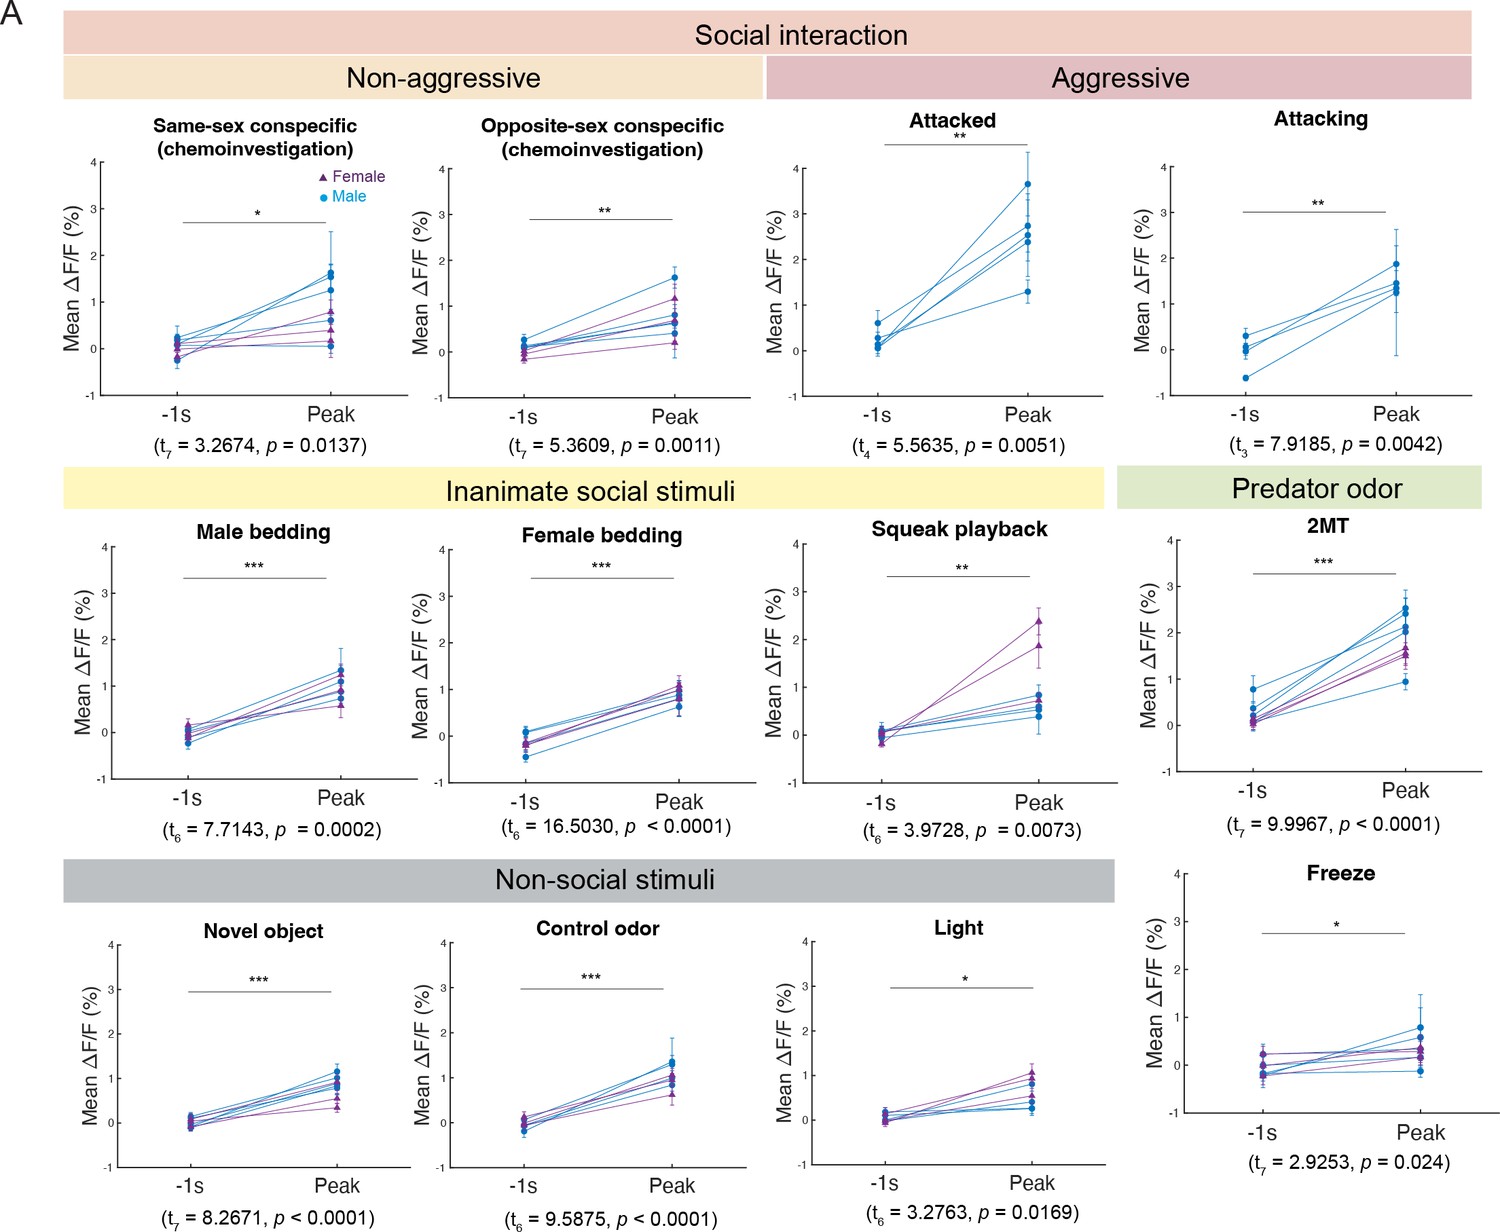
AmgC/M-PAG neurons respond to various stimuli.
(A) Comparison of mean dF/F (%) one second before behavior onset and mean peak dF/F (%) during behavior of interest during social interactions (chemoinvestigation of same-sex conspecific, chemoinvestigation of opposite sex-conspecific, non-aggressive between males and aggressive social interactions between males), interactions with inanimate social stimuli (male bedding, female bedding and squeak playback), investigation of predator odor and subsequent freezing, interactions with non-social stimuli (novel object, control odor ethyl tiglate and light). ***p<0.001; **p<0.01; *p<0.05; n.s. p>0.05; Paired t test for all comparisons.
Figure 1—video 1
Robust social vocalizations in the presence of neutral odor.
A resident male mouse produced robust USVs when pursuing a novel female in the presence of a dish containing clean bedding in his home cage. Video is shown at the top, with a synchronized spectrogram shown at the bottom.
Figure 1—video 2
Predator odor (2MT) suppresses social vocalizations.
The same resident male mouse shown in Figure 1—video 1 produced significantly fewer USVs to a novel female in the presence of a dish containing bedding with 2MT odor in his home cage. Video is shown at the top, with a synchronized spectrogram shown at the bottom.
Figure 2 with 1 supplement
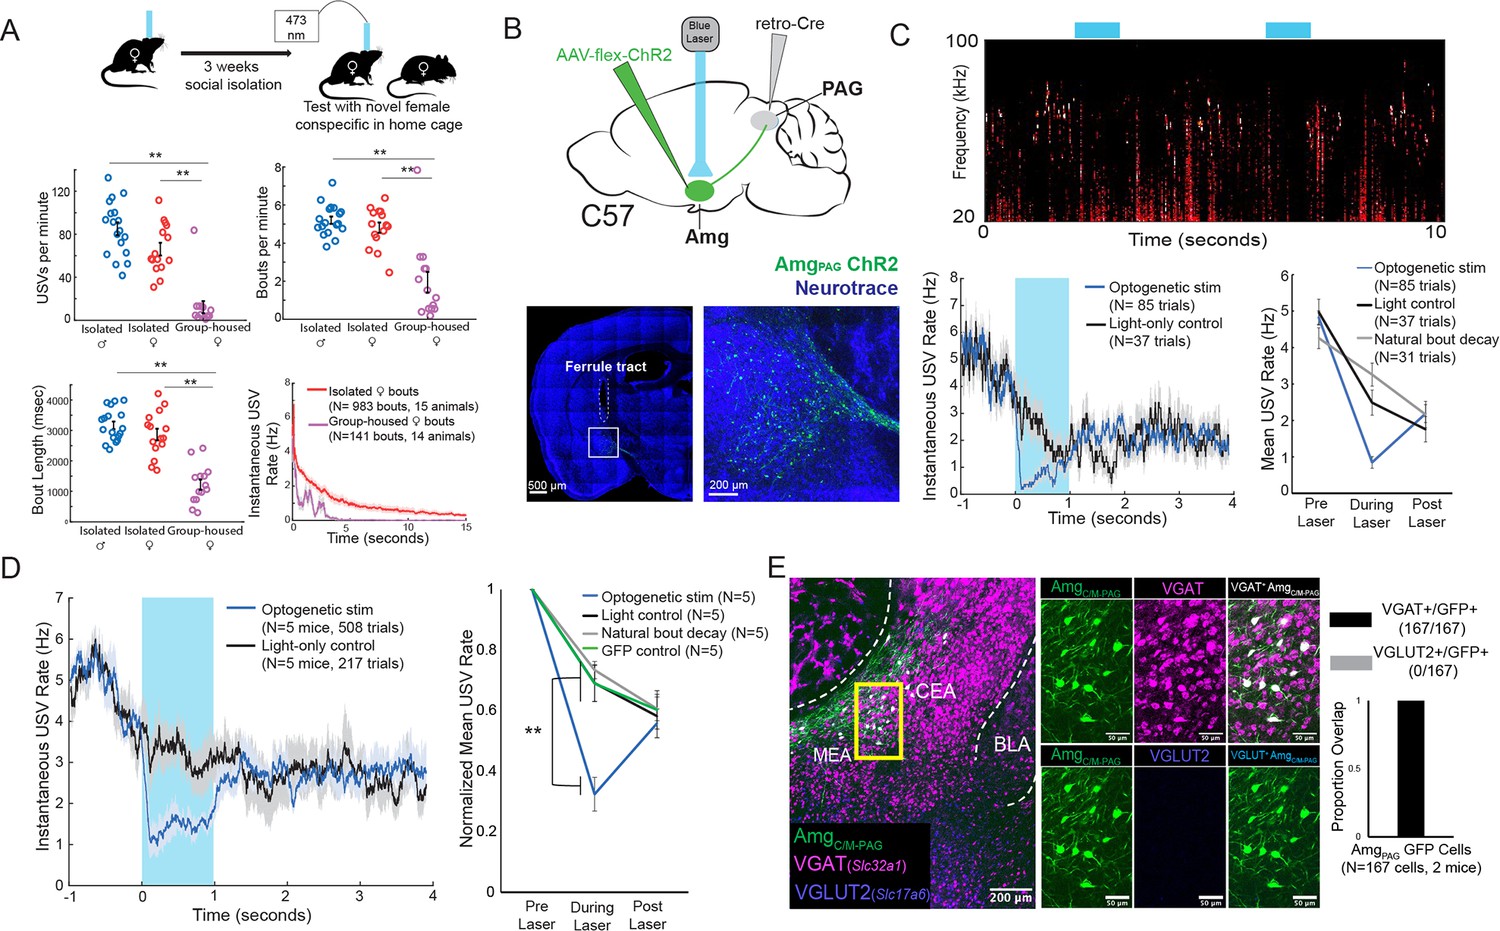
Activation of AmgC/M-PAG neurons suppresses vocalizations in female mice.
(A) (Top) Behavioral paradigm for inducing USV production from female mice. (Bottom) Isolated female mice had similar numbers of USVs produced per minute, number of USV bouts produced per minute, and bout lengths when compared to isolated male mice, while group-housed females produced significantly fewer USVs per minute and significantly fewer and shorter bouts (N=18 isolated males, 15 isolated females, and 14 group-housed females, one-way independent sample ANOVAs found a significant effect of condition on USVs/min, USV bouts/min, and USVs/bout, post hoc pairwise Tukey’s HSD tests found that for all three measures **p<0.01 for isolated males versus group housed females, **p<0.01 for isolated females versus group housed males, and no statistically significant difference between isolated males and isolated females). Error bars represent S.E.M. (B) (Top) Viral strategy for optogenetic activation of AmgC/M-PAG neurons in female mice (performed in N=5 females). (Bottom) Confocal image of representative AmgC/M-PAG cell body labeling and ferrule placement achieved with this strategy. (C) (Top) Example spectrogram showing a representative set of trials in which activation of AmgC/M-PAG neurons suppresses ongoing female USV production. (Bottom Left) Example traces of the USV rate during optogenetic stimulation vs a light-control condition for all trials (N=85 optogenetic trials and 37 light-only control trials) for a single representative animal. Error shading above and below the mean represents S.E.M. (Bottom Right) Quantification of the mean USV rate 1 s before laser stimulation, during a 1 s laser stimulation, and 1 s after laser stimulation (blue) compared to light-only control trials (black) and to the natural decay of vocal bouts with no stimulation (gray) for one representative animal. Error bars represent S.E.M. (D) (Left) Average USV rate traces during optogenetic stimulation and a light-only control for all animals (N=5 females). Error shading above and below the mean represents S.E.M. (Right) Group averages of the mean USV rate 1 s before laser stimulation, during a 1 s laser stimulation, and 1 s after laser stimulation (blue) compared to light-only control trials (black) and to the natural decay of vocal bouts with no stimulation (gray) for all optogenetic stimulation animals (N=5 females) and for a separate group of GFP control animals (N=5 females, green). Data for each mouse were normalized by dividing the mean USV rate pre, during, and post laser stimulation by the mean USV rate for the pre-laser period (p<0.01 for differences between ChR2 group vs. control groups during laser time; two-way ANOVA with repeated measures on one factor, **p<0.01 for interaction between group and time, followed by post-hoc pairwise Tukey’s HSD tests; n.s. p>0.05 for differences between groups in post-laser period). Error bars represent S.E.M. (E) (Left) Representative confocal image of in situ hybridization performed on AmgC/M-PAG neurons (labeled with GFP by injecting AAVretro-Cre in PAG and AAV-flex-GFP in amygdala, shown in green), showing overlap with expression of VGAT (Slc32a1; magenta) and VGLUT2 (Slc17a6; blue). (Right) Quantification of overlap between GFP-labeled AmgC/M-PAG neurons and VGAT and VGLUT2 (N=167 from 2 hemispheres from 2 female mice: 99 cells from five 80 μm coronal sections from one mouse; 68 cells from seven 80 μm coronal sections from the other).
-
Figure 2—source data 1
Source data for Figure 2.
- https://cdn.elifesciences.org/articles/85547/elife-85547-fig2-data1-v2.xlsx
Figure 2—video 1
Optogenetic activation of AmgC/M-PAG neurons transiently suppresses ultrasonic vocalizations (USVs) in a female mouse.
A previously isolated female resident mouse that expressed ChR2 in AmgC/M-PAG neurons is shown following and producing USVs to a female intruder. Optogenetic activation of AmgC/M-PAG neurons transiently suppresses USV production without causing obvious disruptions to non-vocal social interactions. Video is shown at the top, with synchronized spectrogram and optogenetic stimulations shown at the bottom.
Figure 3 with 1 supplement
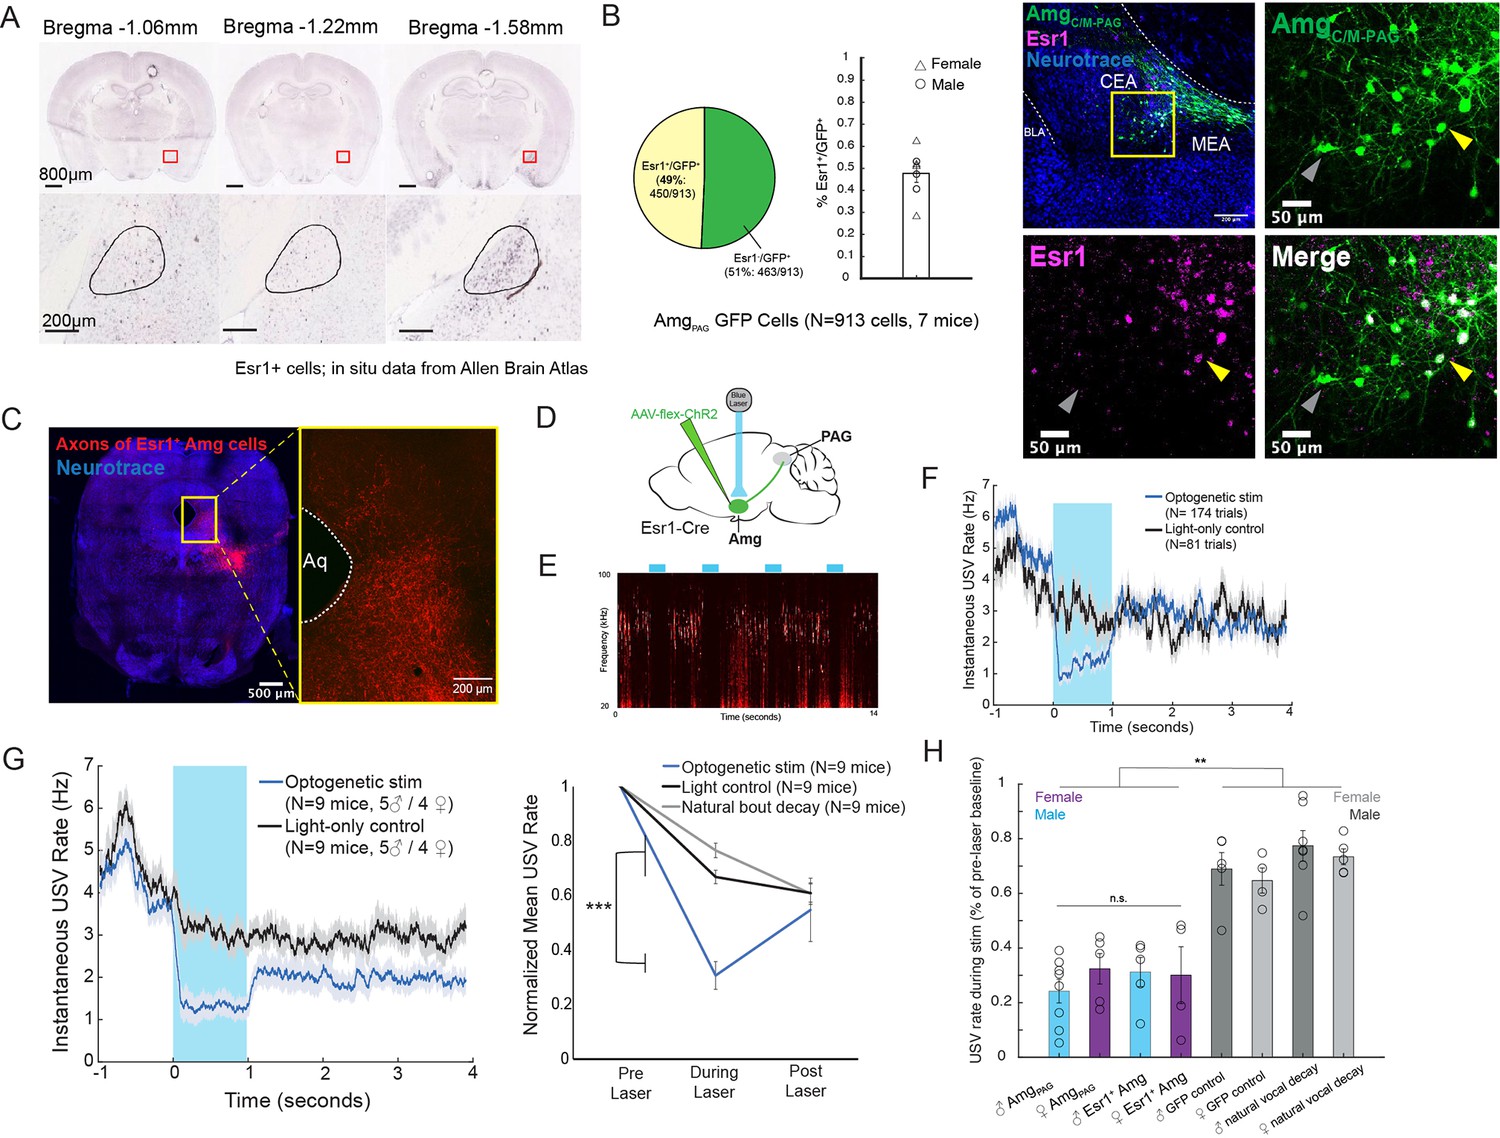
Activation of Esr1 +AmgCC/M neurons suppresses vocalizations.
(A) In situ hybridization data for Esr1 mRNA in wild-type male mouse. (Allen Institute for Brain Science. Allen Mouse Brain Atlas, available from: http://mouse.brain-map.org/experiment/show/79591677). (B) (Left) Quantification showing overlap of GFP-labeled AmgC/M-PAG neurons with Esr1 (N=913 cells from 7 hemispheres from 7 mice, on average seven 80 μm coronal sections or 130 cells per animal; 3 males and 4 females). Pie chart shows 450/913 GFP-labeled cells (49%) are Esr1+. Bar graph shows distribution of %Esr1+/GFP+ overlap for the seven mice examined (mean = 47.73%, with S.E. of 4.08%). (Right) Representative confocal image of immunofluorescent Esr1 protein antibody staining performed on AmgC/M-PAG neurons (labeled with GFP, shown in green), showing overlap with expression of Esr1 (magenta). Blue is NeuroTrace. Gray arrow points to an example Esr1- AmgC/M-PAG neuron; yellow arrow points to an example Esr1+ AmgC/M-PAG neuron. (C) Axonal projections of Esr1+ amygdala cells (labeled by tdTomato) in caudolateral PAG, the region that contains PAG-USV neurons. (D) Viral strategy used to express ChR2 in Esr1+ AmgC/M neurons. (E) Example spectrogram showing a representative set of trials in which activation of AmgC/M-PAG neurons suppresses ongoing USV production. (F) Example traces of the USV rate during optogenetic stimulation vs a light-control condition for all trials (N=174 optogenetic trials and 62 light-only control trials) for a single representative Esr1-Cre-ChR2 animal. Error shading above and below the mean represents S.E.M. (G) (Left) Average USV rate traces during optogenetic stimulation and a light-only control for all Esr1-Cre-ChR2 animals (N=9 mice, 5 males and 4 females). Error shading above and below the mean represents S.E.M. (Right) Group averages of the mean USV rate 1 s before laser stimulation, during a 1 s laser stimulation, and 1 s after laser stimulation (blue) compared to light-only control trials (black) and to the natural decay of vocal bouts with no stimulation (gray) for all optogenetic stimulation animals (N=9 mice, 5 males and 4 females). Data for each mouse were normalized by dividing the mean USV rate pre, during, and post laser stimulation by the mean USV rate for the pre-laser period (***p<0.001 for differences between optogenetic condition and both control conditions during the laser stimulation period, two-way ANOVA followed by post-hoc pairwise Tukey’s HSD tests). Error bars represent S.E.M. (H) Summary plots show USV rate normalized to pre-laser baseline during optogenetic stimulation (purple: females; blue: males) when stimulating (1) Amgc/m-PAG neurons in males (data were from Michael et al., 2020; Figure 4) vs. (2) Amgc/m-PAG neurons in females (Figure 2) vs. (3) Esr1+ Amgc/m neurons in males and (4) Esr1+ Amgc/m neurons in females (Figure 3). Gray bars include two controls: GFP controls and natural vocal decay controls (light gray: females; dark gray: males) (F=17.37, df = 7, p=1.105e-09, one-way ANOVA between all groups, with post-hoc Tukey’s HSD tests showing that each experimental condition was significantly different from control conditions at **p<0.01, while no significant difference was found between any two experimental conditions: p1,2=0.9538, p1,3=0.9801, p1,4=0.9954).
-
Figure 3—source data 1
Source data for Figure 3.
- https://cdn.elifesciences.org/articles/85547/elife-85547-fig3-data1-v2.xlsx
Figure 3—video 1
Optogenetic activation of Esr1+ AmgCC/M neurons transiently suppresses ultrasonic vocalizations (USVs).
A resident male mouse that expressed ChR2 in Esr1+ AmgC/M neurons is shown following and producing USVs to a female intruder. Optogenetic activation of Esr1+ AmgC/M neurons transiently suppresses USV production without causing obvious disruptions to non-vocal social interactions. Video is shown at the top, with synchronized spectrogram and optogenetic stimulations shown at the bottom.
Figure 4
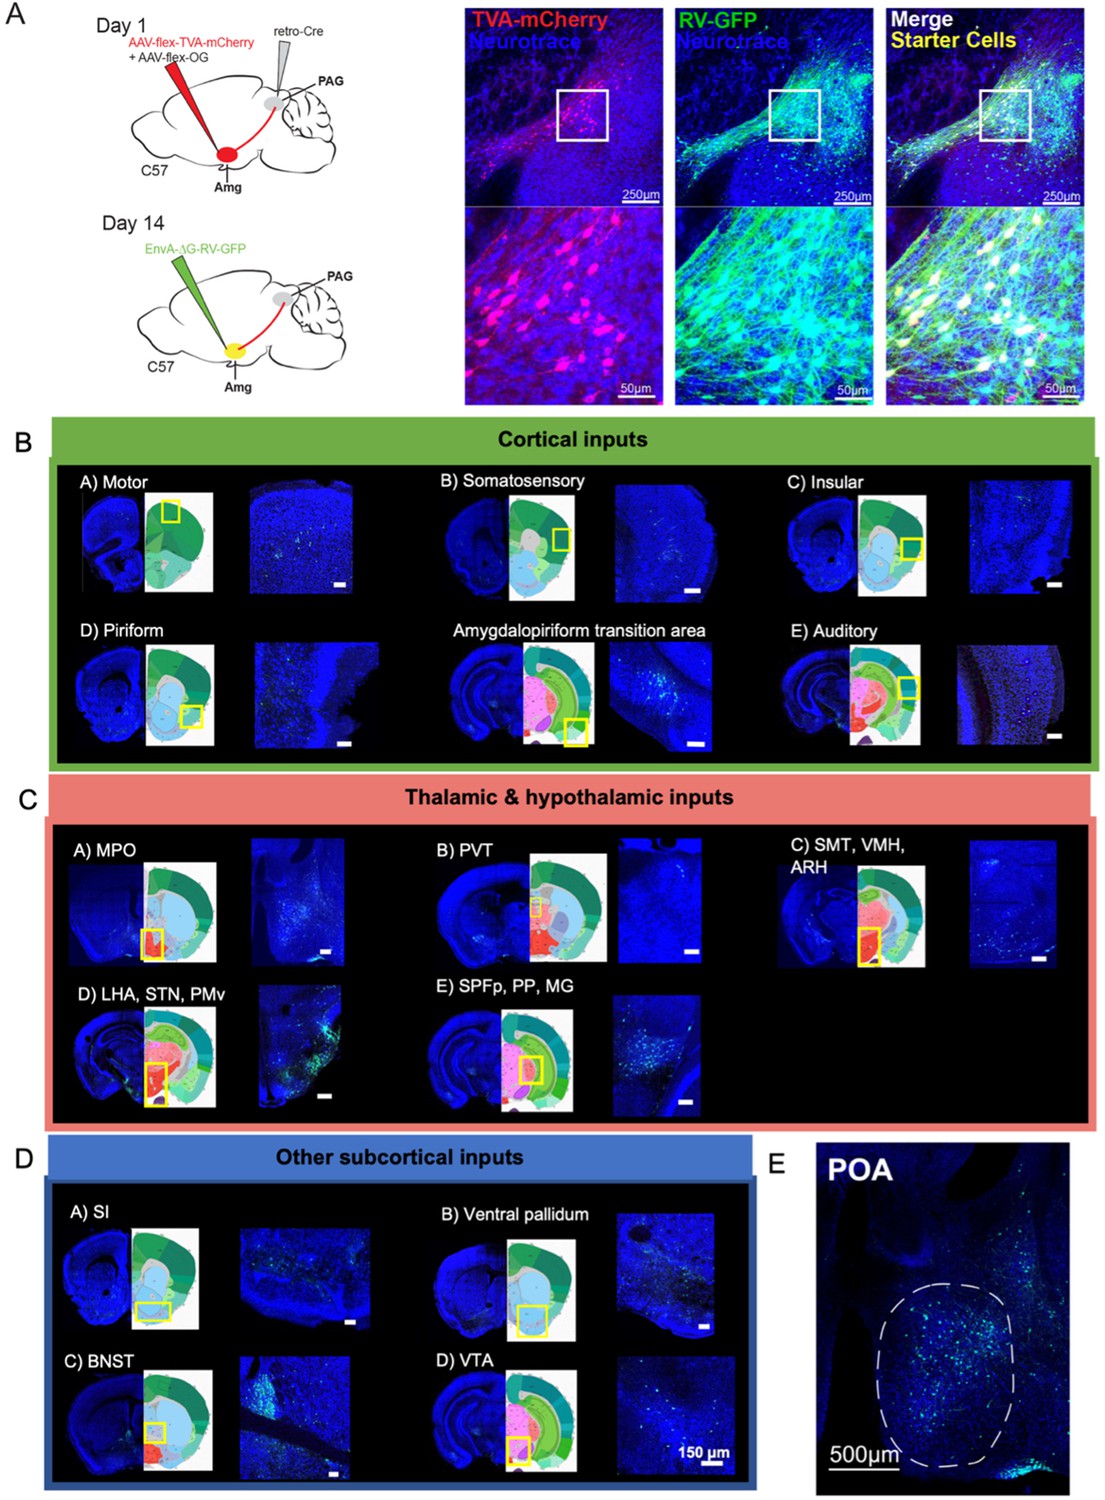
Monosynaptic inputs to AmgC/M-PAG neurons in male mice.
(A) (Left) Viral strategy shown for transsynaptic labeling of direct inputs to AmgC/M-PAG neurons (performed in N=4 males). (Right) Confocal images are shown of starter AmgC/M-PAG neurons. (B–E) Confocal images are shown of upstream neurons labeled in the cortical and subcortical areas, including the preoptic area of the hypothalamus (POA). Scale bars in B, C, D are 150 μm.
Figure 5
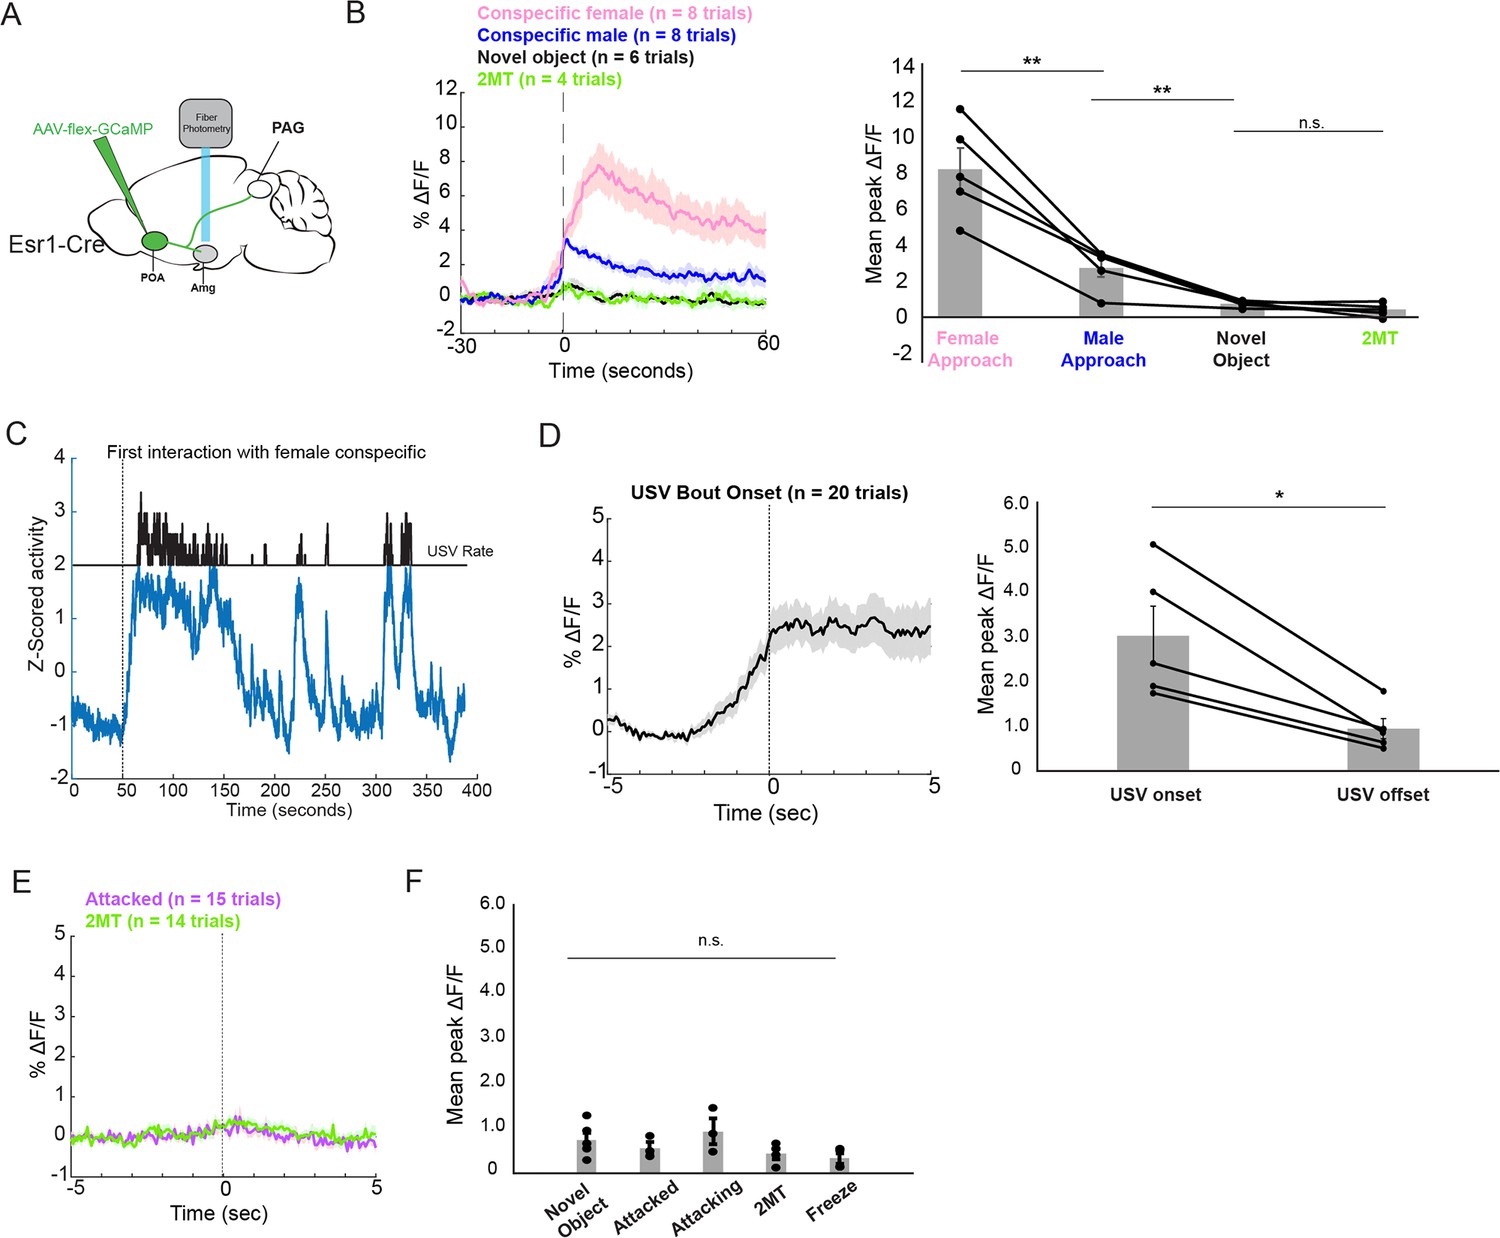
POA inputs to the AmgC/M are active during affiliative social encounters and USV production in male mice.
(A) Viral strategy for photometry recording of Esr1+ POA terminal activity in AmgC/M region (POAEsr1-Amg terminal activity). (B) Average POAEsr1-Amg activity in an example male mouse (left) and mean peak POAEsr1-Amg activity from 5 males (right) at the onset of approaching female mice, at the onset of non-aggressive social interactions with other male mice, and at the onset of or during trials where the mouse encountered a dish containing 2MT or a novel plastic toy (N=5 males; **p<0.01; n.s. p>0.05; one-way ANOVA followed by post-hoc pairwise Tukey’s HSD tests). Error bars represent S.E.M. (C) POAEsr1-Amg terminal activity as a male vocalized to a female. (D) Average POAEsr1-Amg terminal activity in an example male mouse (left) and mean peak POAEsr1-Amg activity from 5 males (right) at USV bout onset (N=5 males; n.s. p<0.05, paired t test). (E) Average POAEsr1-Amg terminal activity in an example male mouse during aggressive interactions with other males and investigation of a dish containing 2MT. (F) Mean peak POAEsr1-Amg activity from 5 males during aggressive interactions with other males, investigation of novel object or a dish containing 2MT, or during freezing in the presence of 2MT (n.s. p>0.05; one-way ANOVA test).
-
Figure 5—source data 1
Source data for Figure 5.
- https://cdn.elifesciences.org/articles/85547/elife-85547-fig5-data1-v2.xlsx
Figure 6 with 2 supplements
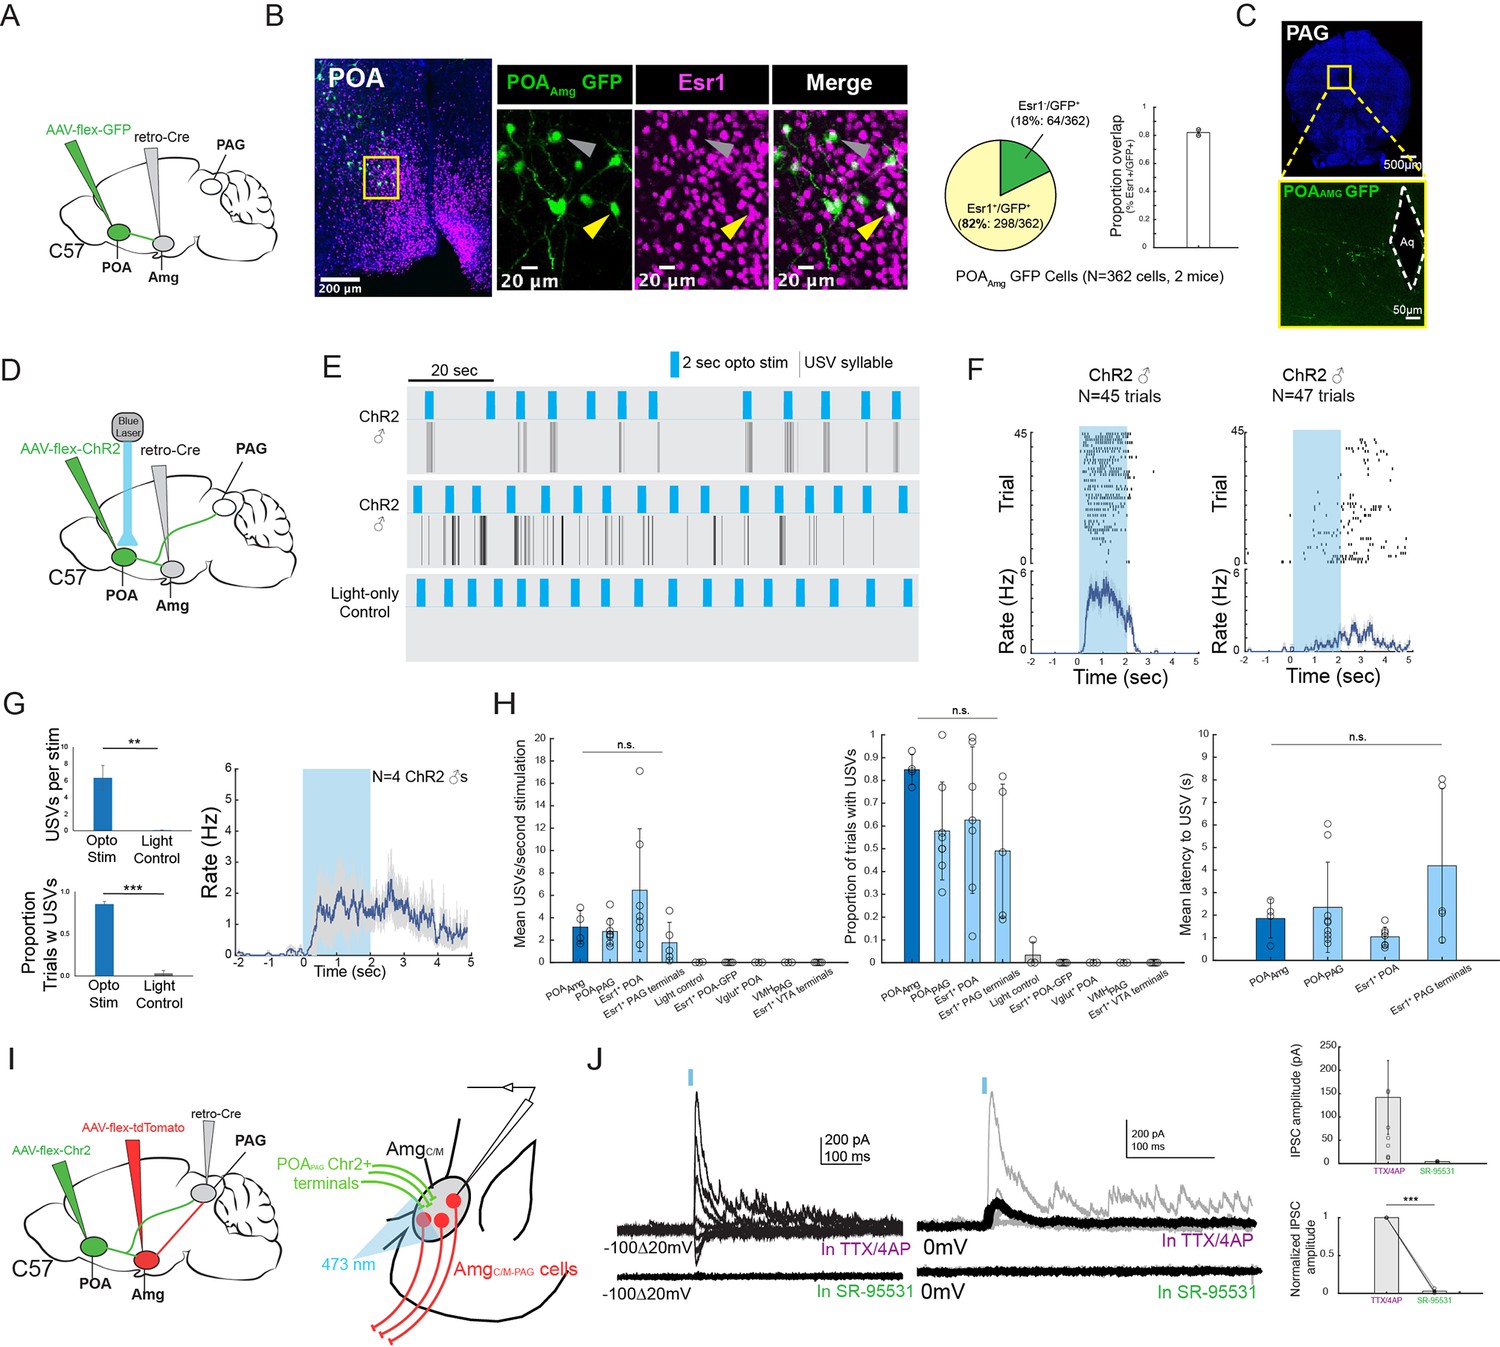
POAAmg cells are Esr1+, project to the PAG, promote USV production, and make inhibitory synapses onto AmgC/M-PAG neurons.
(A) Viral strategy for labeling AmgC/M-projecting POA neurons. (B) (Left) Confocal images showing GFP-labelled AmgC/M-projecting POA neurons and Esr1 staining. Gray arrow points to an example Esr1- POAAmg neuron; yellow arrow points to an example Esr1+ POAAmg neuron. (Right) Quantification of Esr1+ POAAmg neurons (N=362 cells from 2 hemispheres from 2 mice: 173 cells from 6 80 μm coronal sections from one mouse; 189 cells from 6 80 μm coronal sections from the other mouse). Pie chart shows 298/362 GFP-labeled cells are Esr1+ (82.32%). Bar graph shows distribution of %Esr1+ /GFP+ overlap in the two mice examined (mean = 82.32% with S.E. of 1.89%). (C) Axon terminals of GFP-labelled AmgC/M-projecting POA neurons in PAG. (D) Viral strategy for optogenetic activation of AmgC/M-projecting POA neurons in male mice (N=4). (E) Top two plots show USV syllables (black line) elicited in two representative mice following 2s-long, 10 Hz optogenetic activation (blue) of ChR2-expressing POAAMG cells. Stimulation was performed on an animal alone in his home cage. Bottom plot shows an absence of USVs during light control, where the 2s-long, 10 Hz laser (blue) shined above the mouse’s head but was not connected to the ferrule. (F) Raster plots show USVs elicited from all trials in the two representative mice shown in (E). (G) (Left) Bar plots compare the mean number of USVs elicited per stimulation (Top), and the success rate of eliciting USVs (**p<0.01; paired t test) (Bottom) during optogenetic stimulation and light control for N=4 male mice (***p<0.001; paired t test). (Right) Mean USV rate plotted for N=4 males following optogenetic stimulation of ChR2-expressing POAAMG cells in the absence of social cues (alone in home cage). Gray shading above and below the mean represents S.E.M. (H) Summary plots show comparison among four experimental approaches for eliciting USVs. Vocalizations elicited by optogenetically stimulating POAAmg neurons (current study; dark blue) did not differ significantly from those elicited by optogenetically stimulating (1) POAPAG neurons, (2) Esr1+ POA neurons or (3) Esr1+ POA terminals at PAG in terms of mean USV rate (Kruskal-Wallis test, Chi-sq=6.36, df = 3, p=0.0954), success rate (Kruskal-Wallis test, Chi-sq=5.1, df = 3, p=0.1645), and mean latency (Kruskal-Wallis test, Chi-sq=7.12, df = 3, p=0.0681). The four experimental approaches include POAAMG neurons (dark blue, N=4 males from current study), POAPAG neurons (light blue, N=9 males from Michael et al., 2020), Esr1+POA neurons (light blue, N=7 males from Michael et al., 2020), Esr1+ POA axon terminals within the PAG (light blue, N=5 males from Michael et al., 2020). For left and middle panels, the following controls were also shown for reference: light control (N=4 males from current study), GFP-expressing Esr1+ POA neurons (N=5 males from Michael et al., 2020), VGLUT2+ POA neurons (N=3 males from Michael et al., 2020), VMHPAG neurons (N=3 males from Michael et al., 2020), and Esr1+ POA axon terminals within the ventral tegmental area (VTA) (N=4 males from Michael et al., 2020). Error bars show S.D. (I) Viral strategy for in vitro whole-cell voltage clamp recordings from visually identified AmgC/M-PAG neurons while optogenetically activating POAPAG axon terminals in brain slices containing the amygdala. (J) (Left) Light-evoked IPSCs recorded in TTX/4AP (observed in N=9 of 13 td-Tomato-tagged AmgC/M-PAG neurons from N=5 males) were abolished by application of gabazine (N=4 cells also recorded in gabazine). IPSC amplitude refers to the peak of the light-evoked current at 0 mV holding potential. (Right) (Top) Mean IPSC amplitude recorded in TTX/4AP (N=9; one cell with an IPSC amplitude 757.79 pA not shown on the plot) and SR-95531 (N=4). (Bottom) Comparison of IPSC amplitude for the four cells recorded in both TTX/4AP and SR-95531, normalized to IPSC amplitude in TTX/4AP (***p=6.32e-06; paired t test,). Error bars represent S.E.M.
-
Figure 6—source data 1
Source data for Figure 6.
- https://cdn.elifesciences.org/articles/85547/elife-85547-fig6-data1-v2.xlsx
Figure 6—figure supplement 1

Cannula placement and ChR2 expression in POAAmg neurons.
(A) Confocal images show histology for ChR2 expression in POAAmg cells and cannula placement (N=4 males).
Figure 6—video 1
Optogenetic activation of POAAmg neurons elicits ultrasonic vocalizations (USVs).
The video shows an isolated male mouse that expressed ChR2 in POAAmg neurons. Optogenetic stimulation of these neurons elicits USVs. Video is shown at the top, with synchronized spectrogram and optogenetic stimulations shown at the bottom.
Figure 7
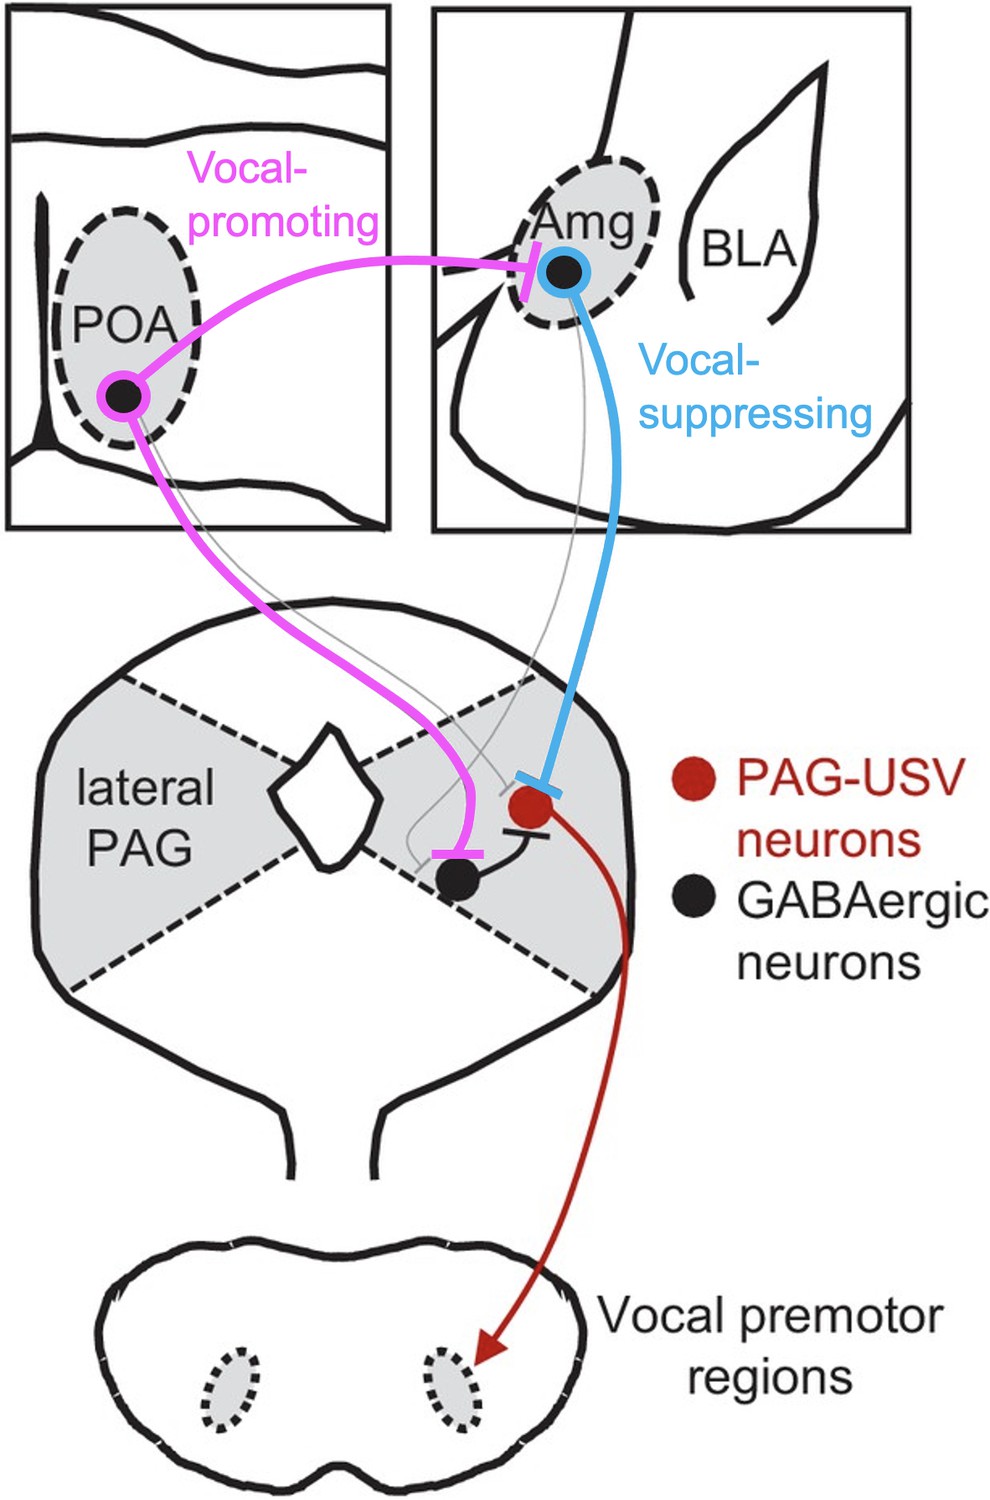
Model of nested circuits that mediate the decision to vocalize.
Inhibitory neurons within the AmgC/M encode threatening stimuli and suppress vocalizations via their direct inhibitory input to PAG-USV neurons, which gate USV production via their excitatory input to downstream vocal premotor neurons. At the same time, AmgC/M-PAG neurons receive direct input from inhibitory neurons in the POA, which encode social stimuli and promote vocalizations via their axon collaterals that disinhibit PAG-USV neurons. Together, AmgC/M-PAG neurons, along with POAPAG and PAG-USV neurons, form a nested hierarchical circuit in which environmental and social information converges to influence the decision to vocalize.
Additional files
Download links
A two-part list of links to download the article, or parts of the article, in various formats.
Downloads (link to download the article as PDF)
Open citations (links to open the citations from this article in various online reference manager services)
Cite this article (links to download the citations from this article in formats compatible with various reference manager tools)
Nested circuits mediate the decision to vocalize
eLife 12:e85547.
https://doi.org/10.7554/eLife.85547


