Steroidogenesis and androgen/estrogen signaling pathways are altered in in vitro matured testicular tissues of prepubertal mice
- Univ Rouen Normandie, Inserm, Normandie Univ, NorDiC UMR 1239, Adrenal and Gonadal Pathophysiology team, F-76000, France
- Department of General Biochemistry, Rouen University Hospital, France
- Normandie Univ, UNICAEN, OeReCa, France
Figures
Figure 1 with 1 supplement
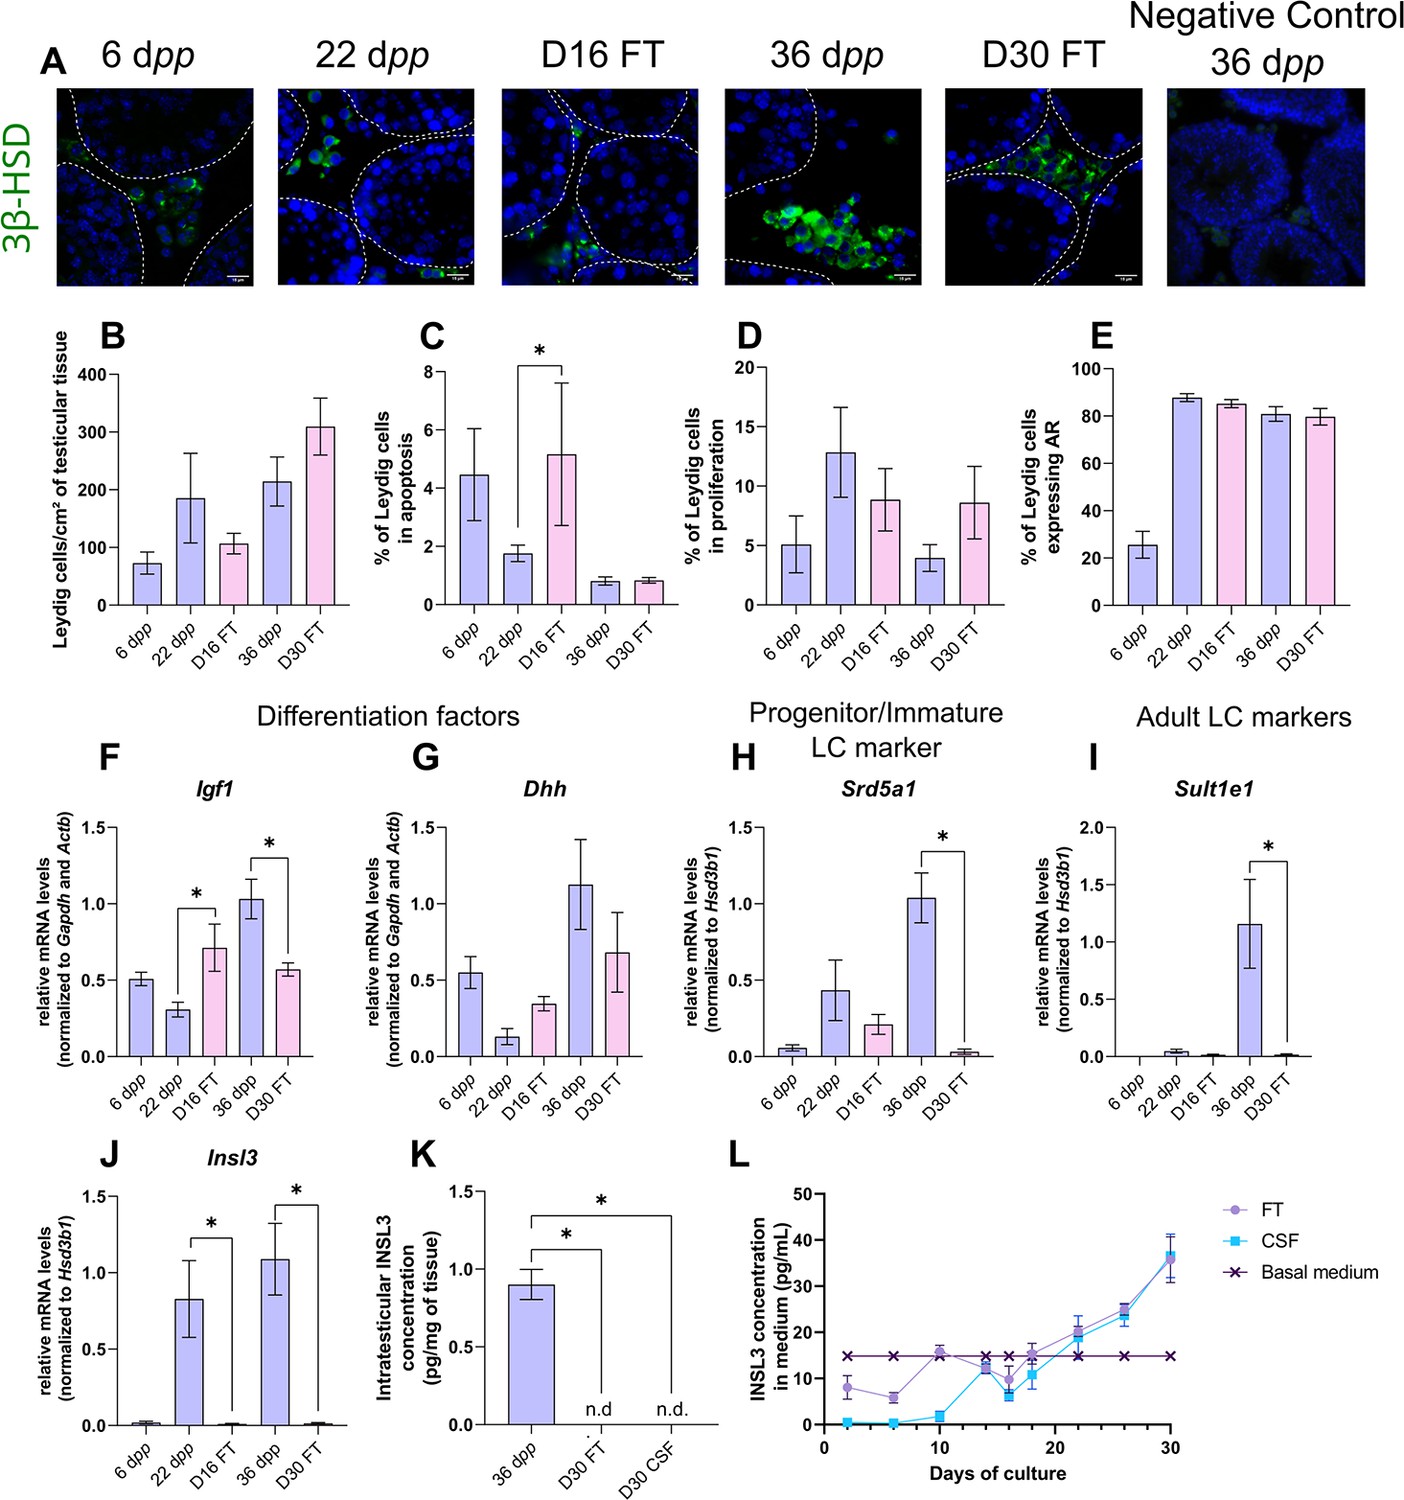
Leydig cells are partially mature after 30 days of organotypic culture.
(A) Representative images of 3β-hydroxysteroid dehydrogenase (3β-HSD) expression by Leydig cells during mouse postnatal development (6 dpp, 22 dpp, and 36 dpp) and in in vitro cultured tissues after 16 days of culture (D16) or 30 days (D30). A representative image of a negative control, carried out by omitting the primary antibody, is also shown. Testicular tissue sections were counterstained with Hoechst (blue). Dotted lines delineate seminiferous tubules. Scale: 15 µm. (B) Number of 3β-HSD + Leydig cells per cm² of testicular tissue during mouse postnatal development (6 dpp, 22 dpp, and 36 dpp) and in in vitro cultured tissues (D16 and D30). (C–D) Percentage of Leydig cells (C) in apoptosis (3β-HSD and cleaved caspase 3 positive) or (D) in proliferation (3β-HSD and Ki67 positive) in in vivo and in vitro matured tissues. (E) Percentage of 3β-HSD positive Leydig cells expressing AR in in vivo and in vitro matured tissues. (F–J) Relative mRNA levels of Leydig cell differentiation factors (Igf1, Dhh), progenitor/immature Leydig cell (Srd5a1), and adult Leydig cell markers (Sult1e1, Insl3) (normalized to Gapdh and Actb or to Hsd3b1). (K–L) Intratesticular concentration of INSL3 (pg/mg of tissue, K) or in the culture medium (pg/mL, L). Data are presented as means ± SEM with n=4 biological replicates for each group. A value of *p<0.05 was considered statistically significant. n.d.: not determined (under the detection limit) FT: Fresh Tissue; CSF: Controlled Slow Freezing.
-
Figure 1—source data 1
Source data of Figure 1.
- https://cdn.elifesciences.org/articles/85562/elife-85562-fig1-data1-v1.xlsx
Figure 1—figure supplement 1

Impact of controlled slow freezing on Leydig cells in organotypic cultures.
(A) Representative images of 3β-hydroxysteroid dehydrogenase (3β-HSD) expression in Leydig cells at 6 dpp and in in vitro cultured frozen/thawed (CSF) testicular tissues (D16 and D30). Testicular tissue sections were counterstained with Hoechst (blue). Dotted lines delineate seminiferous tubules. Scale: 15 µm. (B) Number of 3β-HSD positive Leydig cells per cm² of FT or CSF testicular tissue. (C–D) Percentage of Leydig cells (C) in apoptosis (3β-HSD and cleaved caspase 3 positive) or (D) in proliferation (3β-HSD and Ki67 positive) in in vivo and in vitro matured FT or CSF tissues. (E) Percentage of 3β-HSD positive Leydig cells expressing AR in in vivo and in vitro matured FT or CSF tissues. (F–J) Relative mRNA levels of Leydig cell differentiation factors (Igf1, Dhh), progenitor/immature Leydig cell (Srd5a1) and of adult Leydig cell markers (Sult1e1, Insl3) (normalized to Gapdh and Actb or to Hsd3b1). Data are presented as means ± SEM with n=4 biological replicates for each group. A value of *p<0.05 was considered statistically significant. FT: Fresh Tissue, CSF: Controlled Slow Freezing.
-
Figure 1—figure supplement 1—source data 1
Source data of Figure 1—figure supplement 1.
- https://cdn.elifesciences.org/articles/85562/elife-85562-fig1-figsupp1-data1-v1.xlsx
Figure 2
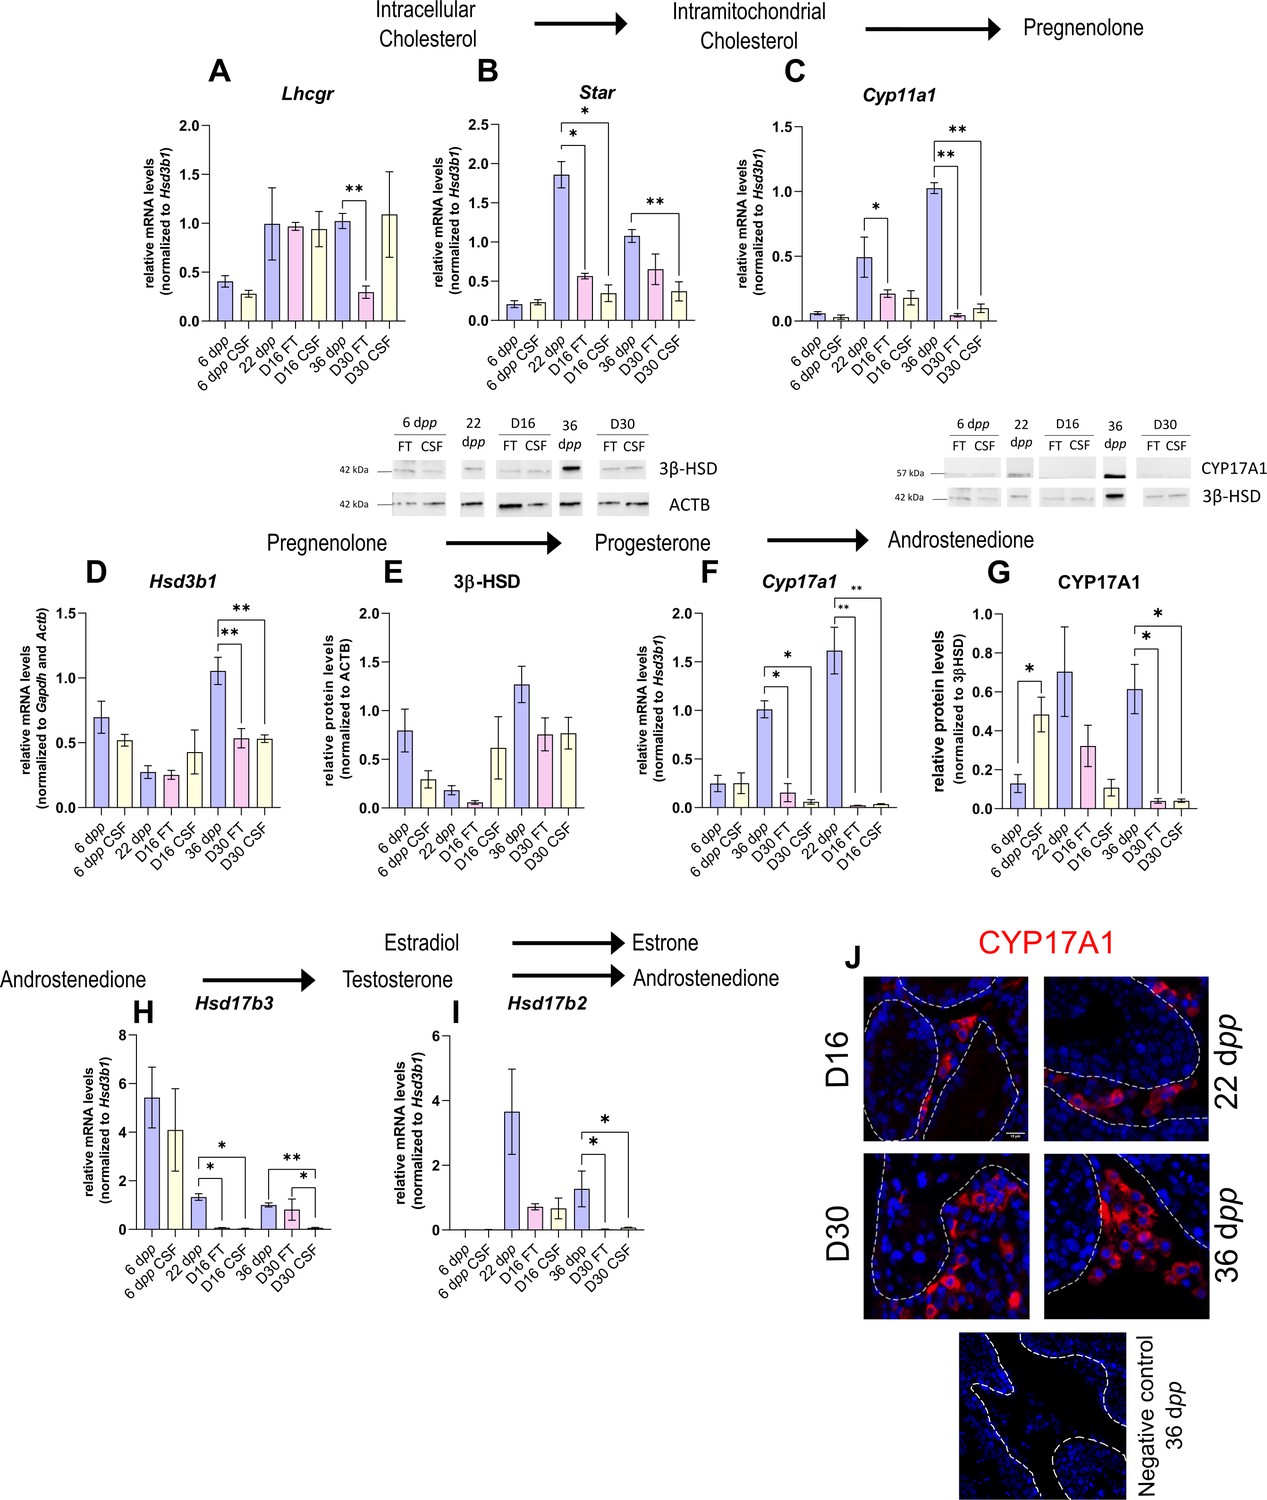
The expression of several actors of steroidogenesis is downregulated in 30 day organotypic cultures.
(A–I) Relative mRNA levels of Lhcgr, Star, Cyp11a1, Hsd3b1, Cyp17a1, Hsd17b3, and Hsd17b2 (normalized to Gapdh and Actb or to Hsd3b1) and relative protein levels of 3β-hydroxysteroid dehydrogenase (3β-HSD) (normalized to ACTB) and CYP17A1 (normalized to 3β-HSD) during mouse postnatal development (6 dpp, 22 dpp, and 36 dpp) and in in vitro cultured fresh testicular tissues (FT) or controlled slow freezing (CSF) tissues (D16 and D30). (J) Representative images of CYP17A1 expression during mouse postnatal development (22 dpp and 36 dpp) and in in vitro cultured tissues (D16 and D30). A representative image of a negative control, carried out by omitting the primary antibody, is also shown. Testicular tissue sections were counterstained with Hoechst (blue). Dotted lines delineate seminiferous tubules. Scale: 15 µm. Data are presented as means ± SEM with n=4 biological replicates for each group. A value of *p<0.05 and **p<0.01 were considered statistically significant.
-
Figure 2—source data 1
Source data of Figure 2.
- https://cdn.elifesciences.org/articles/85562/elife-85562-fig2-data1-v1.xlsx
Figure 3 with 1 supplement
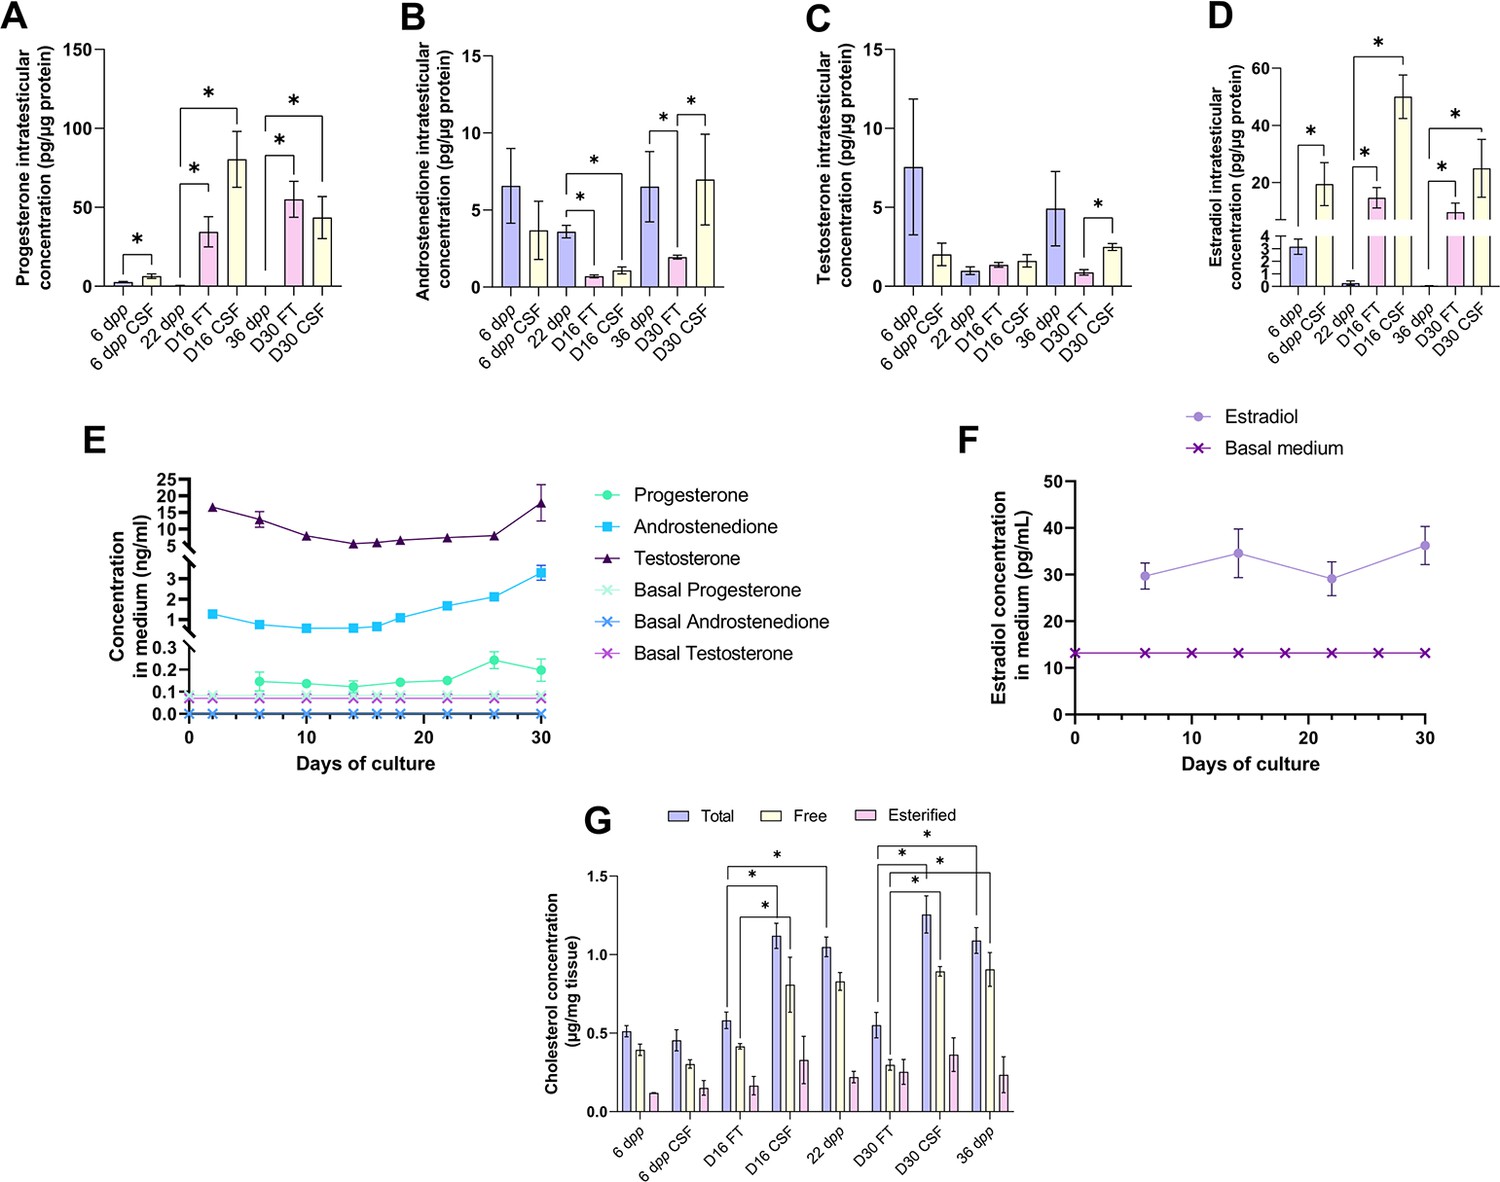
An increased production of progesterone and estradiol and a decreased production of androstenedione are observed after 16 and 30 days of culture of prepubertal mouse testicular tissues.
Intratesticular concentrations of (A) progesterone, (B) androstenedione, (C) testosterone, and (D) estradiol during mouse postnatal development (6 dpp, 22 dpp, and 36 dpp) and in in vitro cultured fresh (FT) or frozen/thawed (CSF) tissues (D16 and D30). Steroid concentrations were normalized to protein levels. (E–F) Concentrations of (E) progesterone, androstenedione, testosterone, and (F) estradiol in the culture medium of FT tissues. (G) Intratesticular concentrations of total, free, and esterified cholesterol normalized to tissue mass. Data are presented as means ± SEM with n=4 biological replicates for each group. A value of *p<0.05 was considered statistically significant.
-
Figure 3—source data 1
Source data of Figure 3.
- https://cdn.elifesciences.org/articles/85562/elife-85562-fig3-data1-v1.xlsx
Figure 3—figure supplement 1
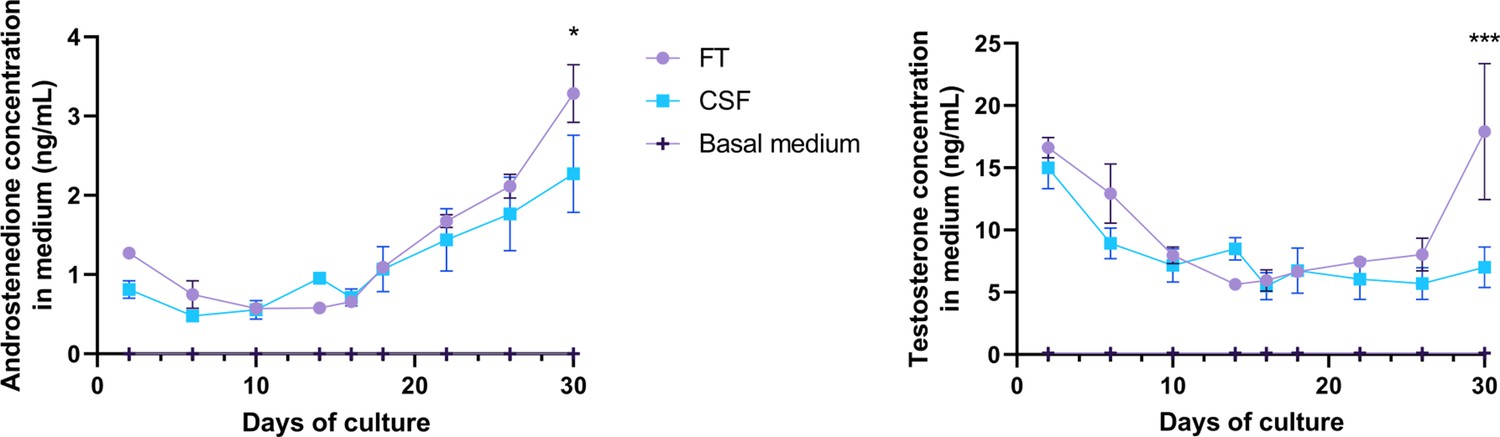
Impact of controlled slow freezing on steroids production by Leydig cells in organotypic cultures.
Concentrations of androgens (androstenedione and testosterone) in the culture medium of fresh (FT) or frozen/thawed (CSF) testicular tissues. Data are presented as means ± SEM with n=4 biological replicates for each group. A value of *p<0.05 and ***p<0.001 were considered statistically significant.
-
Figure 3—figure supplement 1—source data 1
Source data of Figure 3—figure supplement 1.
- https://cdn.elifesciences.org/articles/85562/elife-85562-fig3-figsupp1-data1-v1.xlsx
Figure 4
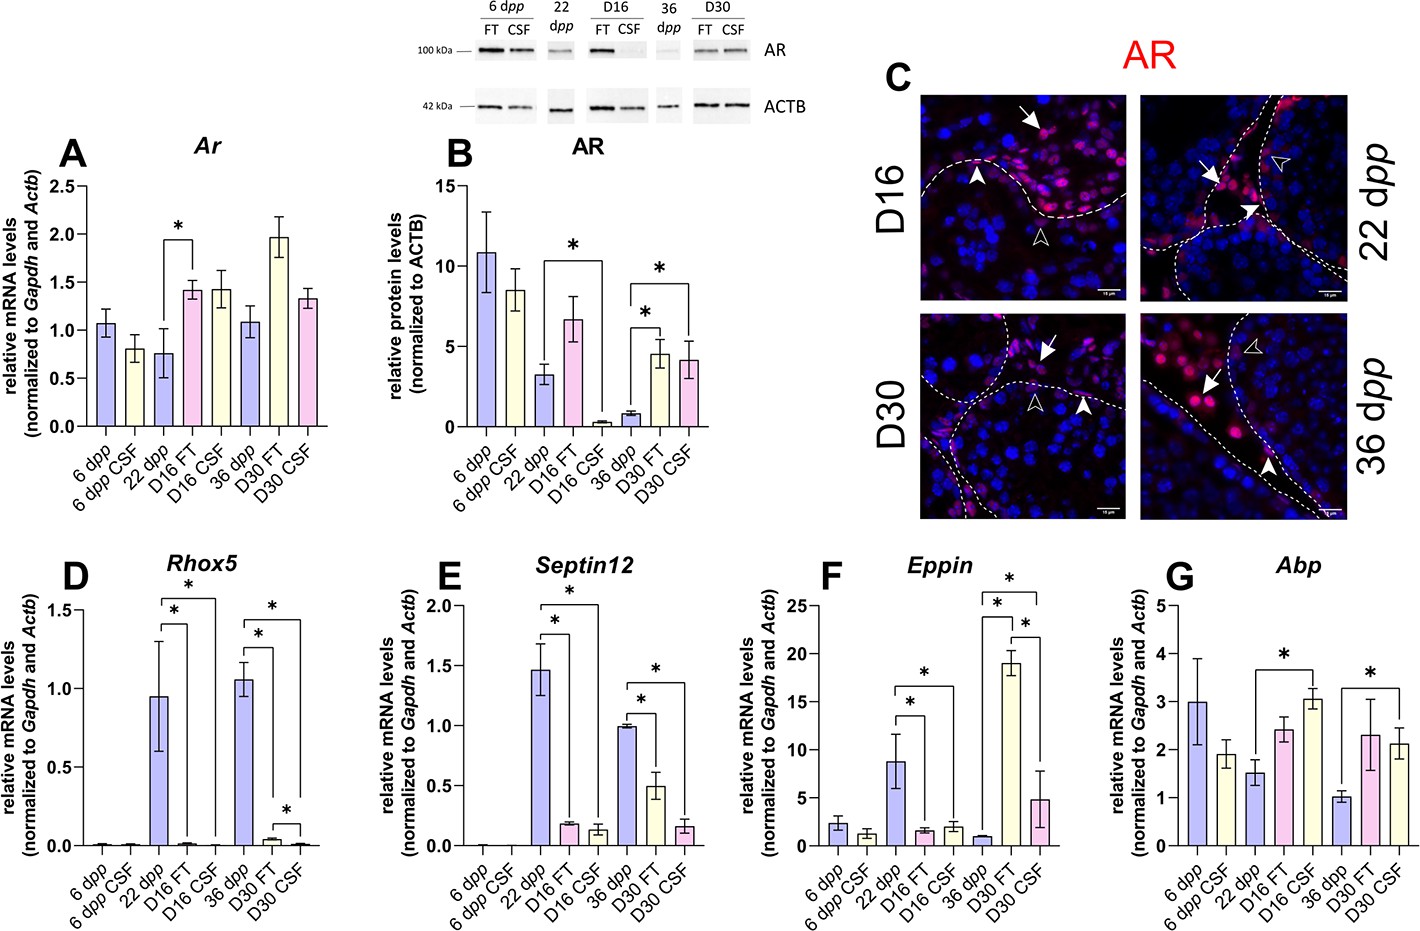
Androgen signaling is altered in 30 days organotypic cultures.
(A) Relative mRNA levels of Ar (normalized to Gapdh and Actb) and (B) relative protein levels of androgen receptor (AR) (normalized to ACTB) during mouse postnatal development (6 dpp, 22 dpp, and 36 dpp) and in in vitro cultured fresh testicular tissues (FT) or controlled slow freezing (CSF) tissues (D16 and D30). (C) Representative images of AR expression at 22 dpp and 36 dpp and at corresponding in vitro time points (D16 and D30). A representative image of a negative control is shown in Figure 2J (same secondary antibody as for CYP17A1). Testicular tissue sections were counterstained with Hoechst (blue). Solid arrowheads: peritubular myoid cells. Open arrowheads: Sertoli cells. Arrows: Leydig cells. Dotted lines delineate seminiferous tubules (ST). Scale: 15 µm. (D–G) Relative mRNA levels of Rhox5, Septin12, Eppin, and Abp (normalized to Gapdh and Actb). Data are presented as means ± SEM with n=4 biological replicates for each group. A value of *p<0.05 was considered statistically significant.
-
Figure 4—source data 1
Source data of Figure 4.
- https://cdn.elifesciences.org/articles/85562/elife-85562-fig4-data1-v1.xlsx
Figure 5
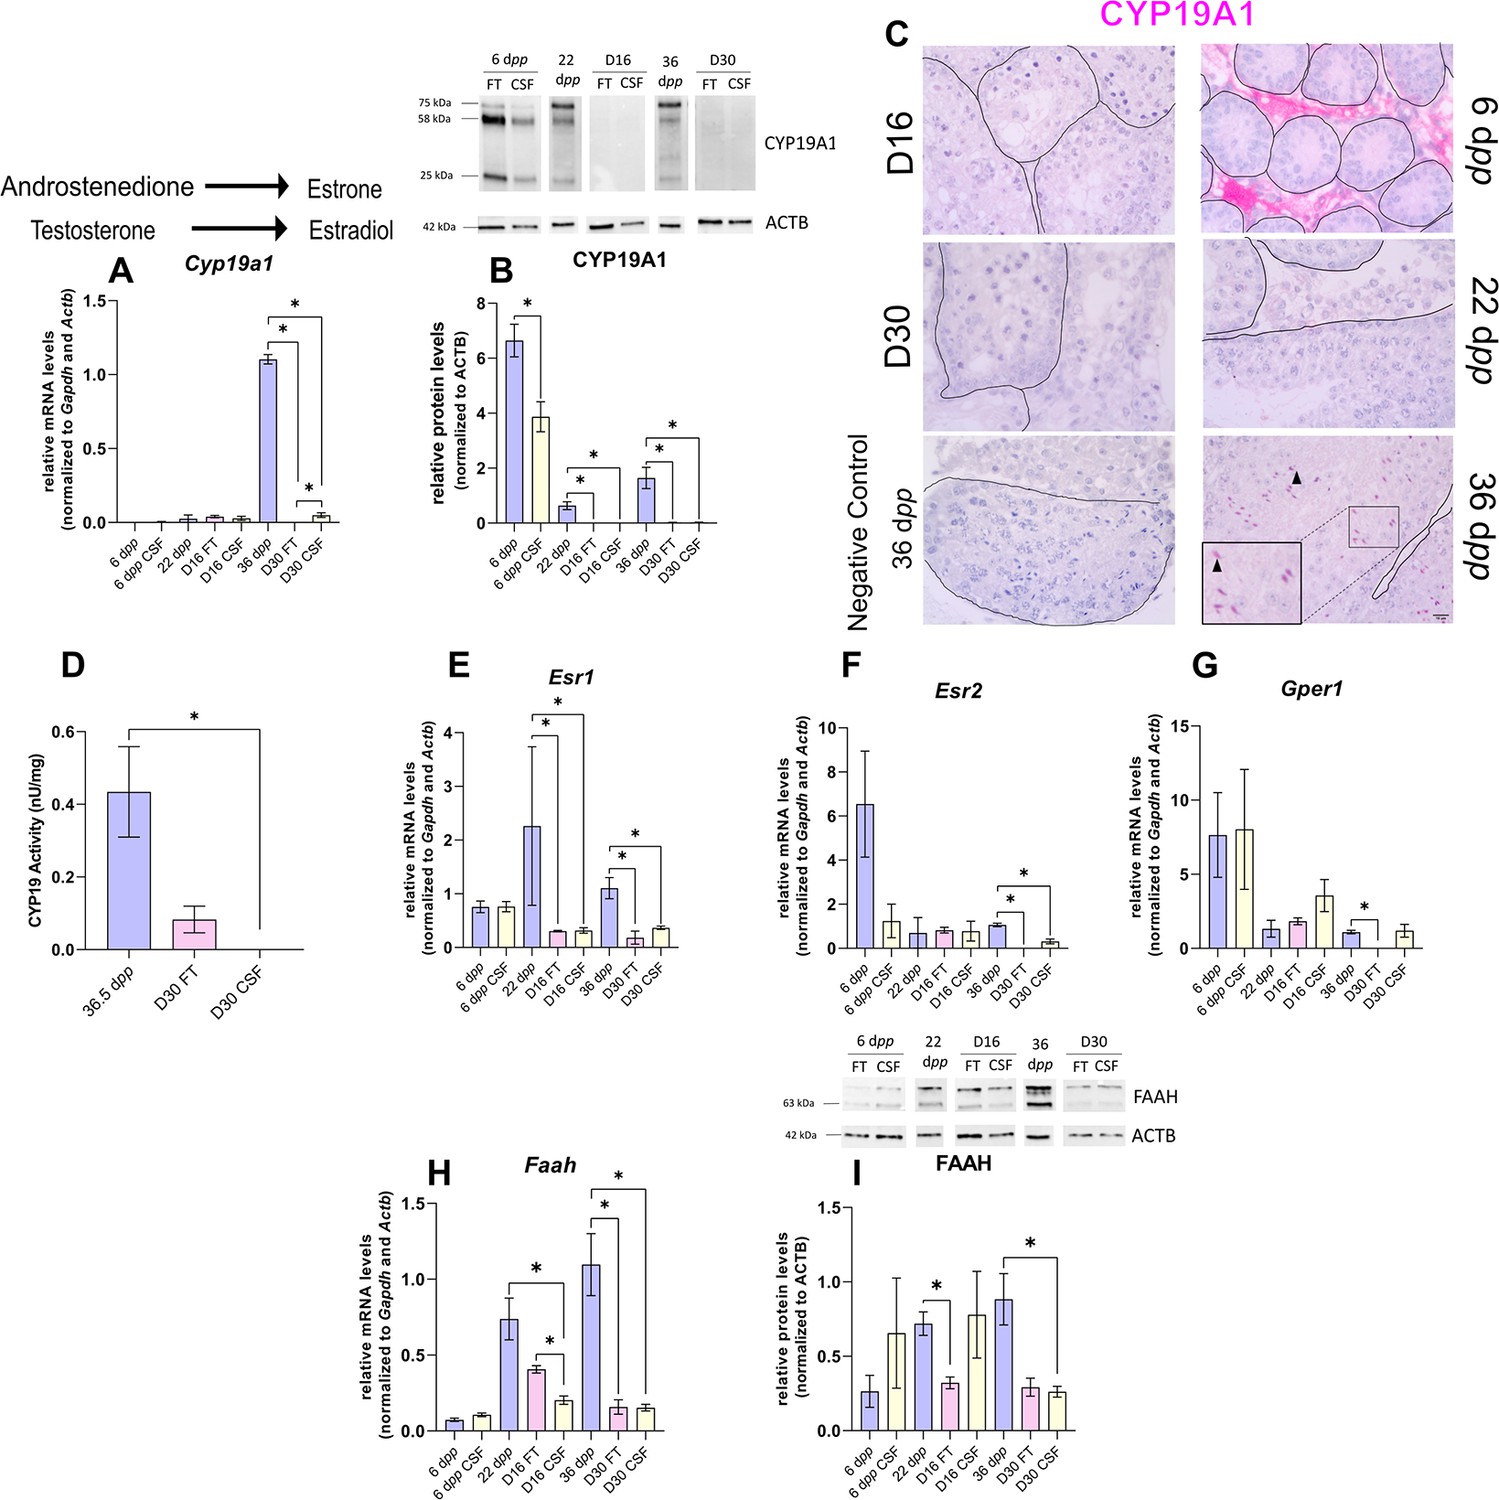
The expression of aromatase and estrogen signaling is impaired after 30 days of organotypic culture.
(A) Relative mRNA levels of Cyp19a1 (normalized to Gapdh and Actb) and (B) relative protein levels of CYP19A1 (normalized to ACTB) during mouse postnatal development (6 dpp, 22 dpp, and 36 dpp) and in in vitro cultured fresh testicular tissues (FT) or controlled slow freezing (CSF) tissues (D16 and D30). The bands on the western blot correspond to different isoforms of CYP19. (C) Representative images of CYP19A1 expression at 6 dpp, 22 dpp, and 36 dpp and at corresponding in vitro time points (D16 and D30). A representative image of a negative control, carried out by omitting the primary antibody, is also shown. Testicular tissue sections were counterstained with Hematoxylin. Scale: 15 µm. Arrow: Leydig cells. Arrowheads: elongated spermatids. (D) Aromatase activity (normalized to tissue weight). (E–G) Relative mRNA levels of Esr1, Esr2, and Gper1 (normalized to Gapdh and Actb). (H) Relative mRNA levels of Faah (normalized to Gapdh and Actb) and (I) relative protein levels of fatty acid amide hydrolase (FAAH) (normalized to ACTB). The second band at 80 kDa is an isoform of FAAH (Q8BRM1, UniProtKB). Data are presented as means ± SEM with n=4 biological replicates for each group. A value of *p<0.05 was considered statistically significant.
-
Figure 5—source data 1
Source data of Figure 5.
- https://cdn.elifesciences.org/articles/85562/elife-85562-fig5-data1-v1.xlsx
Figure 6 with 2 supplements
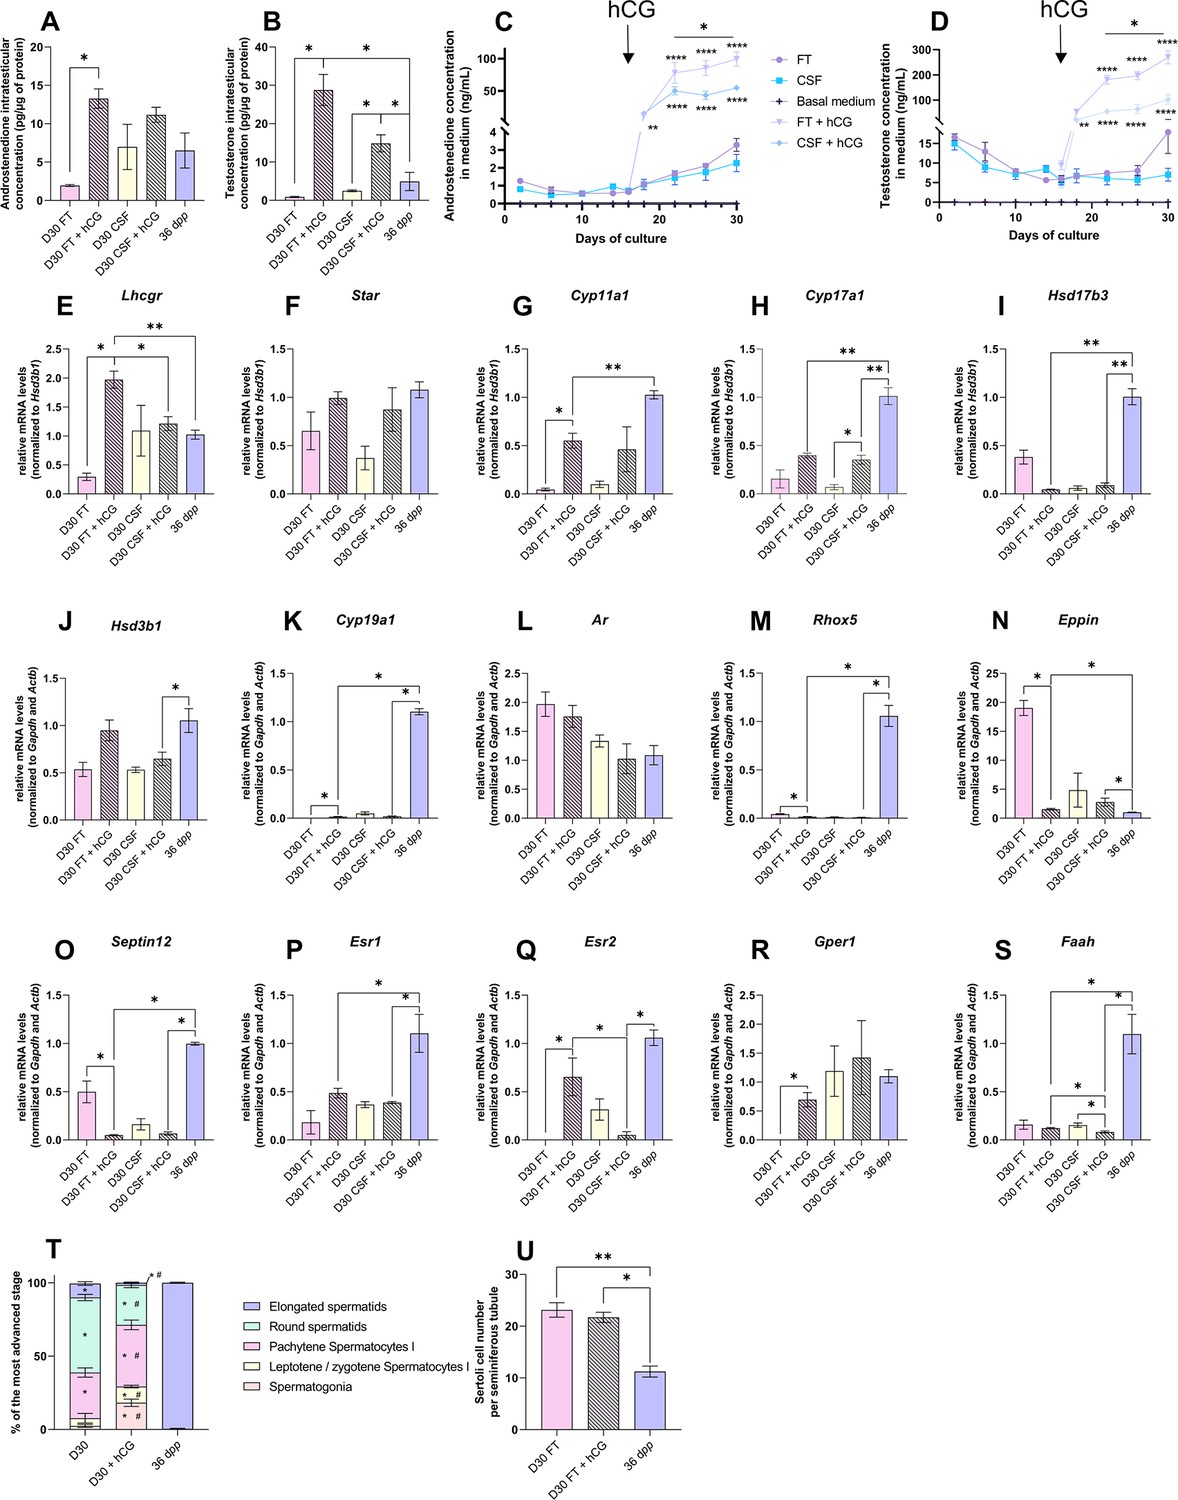
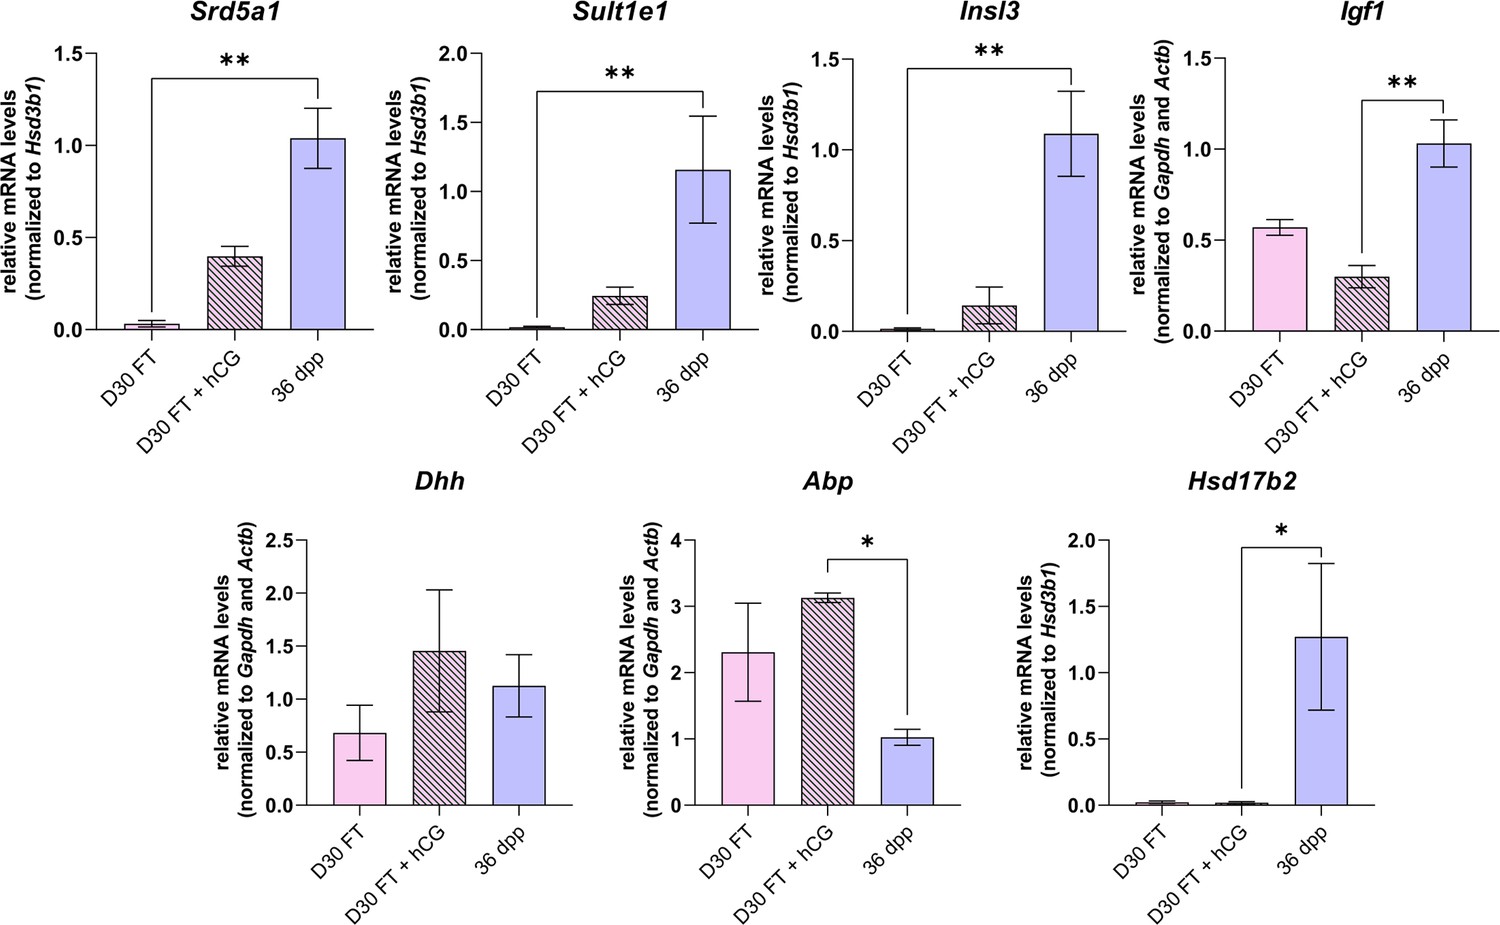
Human chorionic gonadotropin (hCG) is insufficient to stimulate Leydig cell differentiation and restore steroidogenesis and steroid hormone signaling.
(A–D) Levels of androgens (androstenedione and testosterone) (A–B) in testicular tissues and (C–D) in culture medium with 1 nM hCG or without supplementation. (E–S) Relative mRNA levels of genes involved in steroidogenesis and androgen/estrogen signaling pathways (normalized to Gapdh and Actb or to Hsd3b1) with or without hCG supplementation. (T) Proportion of seminiferous tubules containing the most advanced type of germ cells after in vitro culture with or without hCG. p<0.05: * vs 36 dpp and # vs D30 FT. (U) Sertoli cell number in seminiferous tubules after in vitro culture with or without hCG. Data are presented as means ± SEM with n=4 biological replicates for each group. A value of *p<0.05, **p<0.01 and ****p<0.0001 were considered statistically significant. FT: Fresh Tissue; CSF: Controlled Slow Freezing.
-
Figure 6—source data 1
Source data of Figure 6.
- https://cdn.elifesciences.org/articles/85562/elife-85562-fig6-data1-v1.xlsx
Figure 6—figure supplement 1
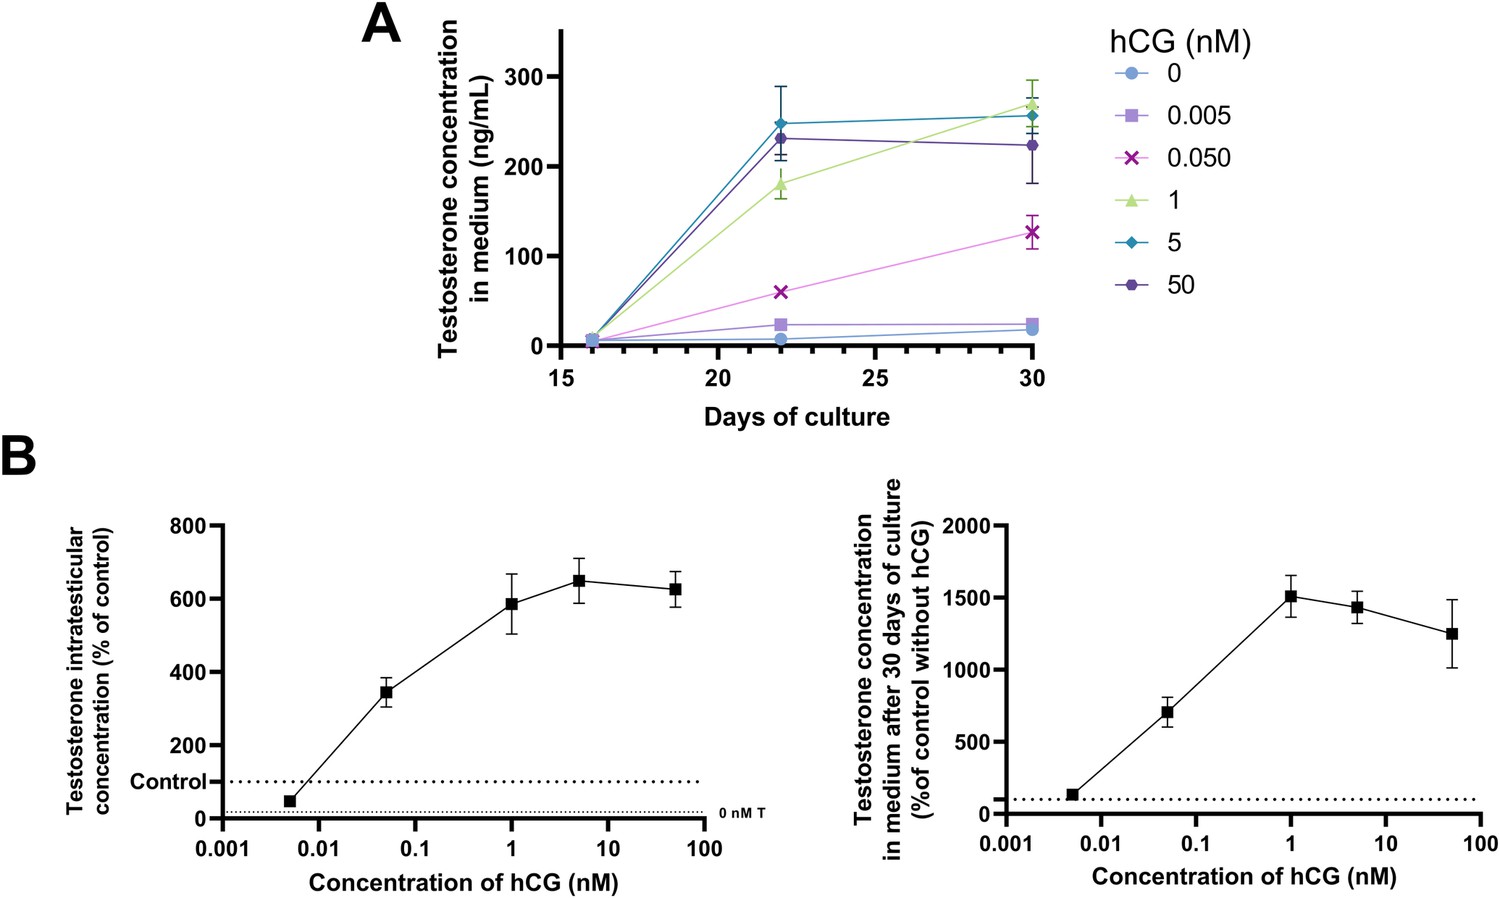
Impact of different human chorionic gonadotropin (hCG) concentrations on testosterone production in organotypic cultures.
(A) Concentrations of testosterone in the culture medium after supplementation with different hCG concentrations (5 pM, 50 pM, 1 nM, 5 nM, 50 nM) from D16 to D30. (B) Concentrations of testosterone in FT testicular tissues (D30) normalized to in vivo control (36 dpp) and in culture medium at D30 normalized to in vitro control without hCG, after supplementation with different hCG concentrations (5 pM, 50 pM, 1 nM, 5 nM, 50 nM). Data are presented as means ± SEM with n=4 biological replicates for each group. A value of *p<0.05 was considered statistically significant.
-
Figure 6—figure supplement 1—source data 1
Source data of Figure 6—figure supplement 1.
- https://cdn.elifesciences.org/articles/85562/elife-85562-fig6-figsupp1-data1-v1.xlsx
Figure 6—figure supplement 2
Impact of human chorionic gonadotropin (hCG) supplementation on mRNA levels of genes involved in steroidogenesis and androgen signaling in organotypic cultures.
Relative mRNA levels of Leydig cell markers, actors of steroidogenesis, and androgen signaling (normalized to Gapdh and Actb or to Hsd3b1) after supplementation with 1 nM hCG. Data are presented as means ± SEM with n=4 biological replicates for each group. A value of *p<0.05 and **p<0.01 were considered statistically significant.
-
Figure 6—figure supplement 2—source data 1
Source data of figure 6 – figure supplement 2.
- https://cdn.elifesciences.org/articles/85562/elife-85562-fig6-figsupp2-data1-v1.xlsx
Figure 7
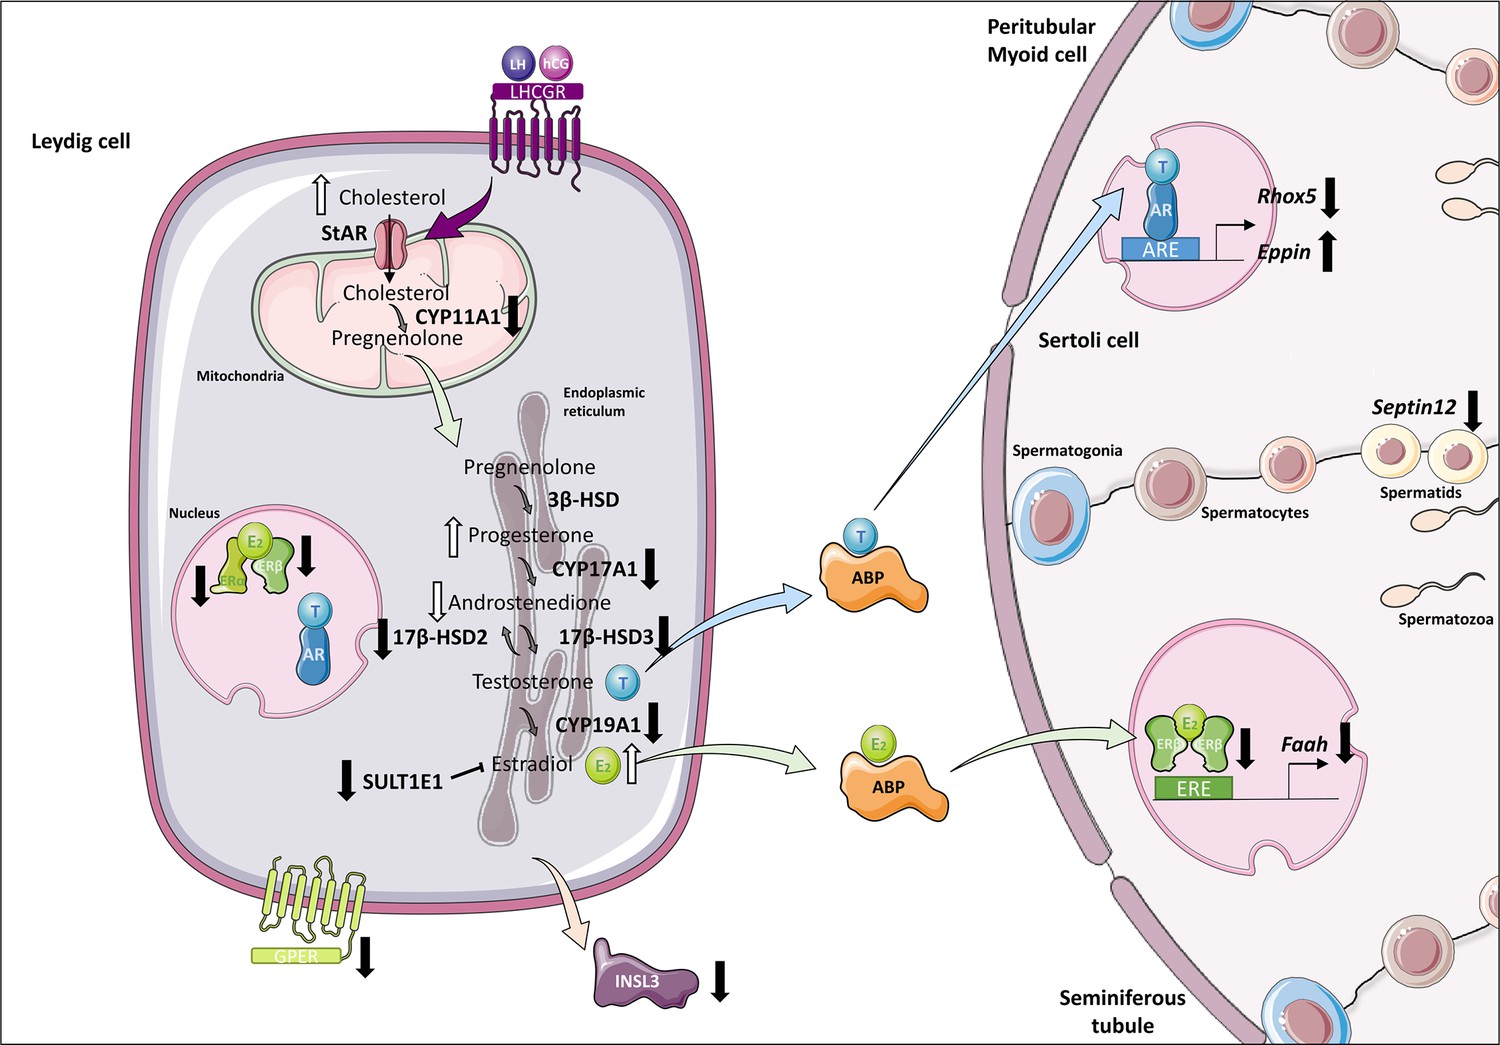
Altered steroidogenesis and androgen/estrogen signaling pathways in in vitro matured testicular tissues of prepubertal mice.
A similar density of Leydig cells is found after 30 days of organotypic culture (D30) and at 36 days postpartum, the corresponding in vivo time point. However, Leydig cells are partially mature in vitro with a decrease in Sult1e1 and Insl3 mRNA levels (adult Leydig cell markers). The mRNA levels of Cyp11a1, Cyp17a1, and Hsd17b3 encoding steroidogenic enzymes and the protein levels of CYP17A1 are decreased in vitro. Increased amounts of cholesterol, progesterone and estradiol, and decreased androstenedione intratesticular levels are observed at D30. Furthermore, despite testosterone levels similar to in vivo, the expression of the androgen receptor (AR) and of the androgen binding protein (Abp), androgen signaling is altered at D30, with decreased transcript levels of the androgen target gene Rhox5 and of Septin12. Moreover, with decreased expression and activity of aromatase and decreased estrogen receptor expression, estrogen signaling is impaired at D30, leading to decreased transcript and protein levels of the estrogen target gene Faah.
Figure 8 with 1 supplement
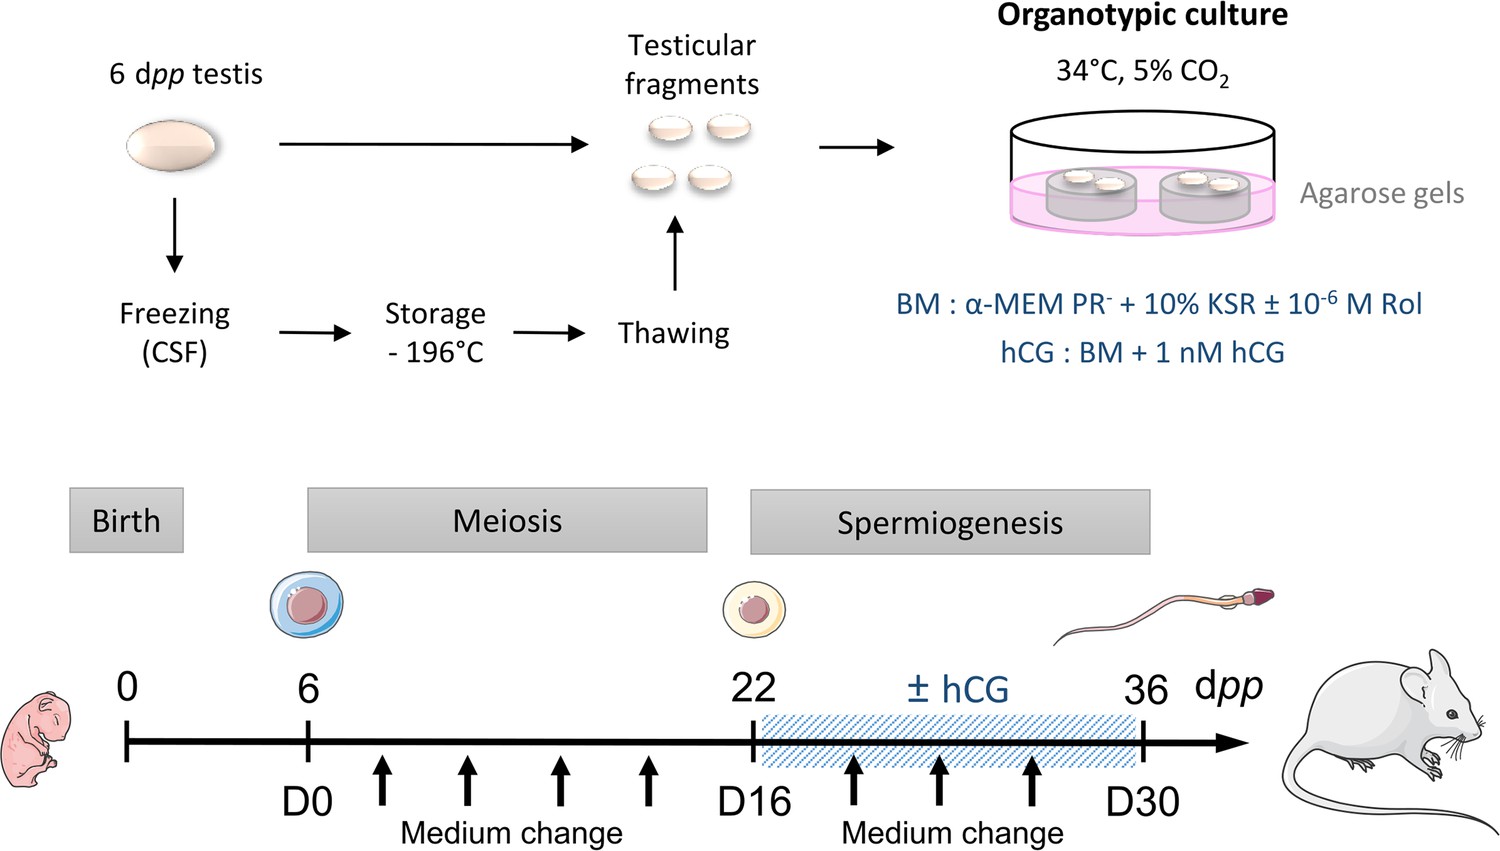
Scheme of the study design.
At 6 dpp (D0), the testis contains only spermatogonia and the initiation of meiosis occurs between 7 and 9 dpp. At 22 dpp (D16), meiosis ends and the first round of spermatids appear. At 36 dpp (D30), the first spermatozoa appear and this is the end of the first spermatogenic wave. Arrows represent times at which the medium was collected (D0, D2, D6, D10, D14, D18, D22, D26, and D30). BM: Basal Medium; CSF: Controlled Slow Freezing; dpp: days postpartum; hCG: human Chorionic Gonadotropin; KSR: KnockOut Serum replacement; PR-: without phenol red; Rol: retinol.
Figure 8—figure supplement 1
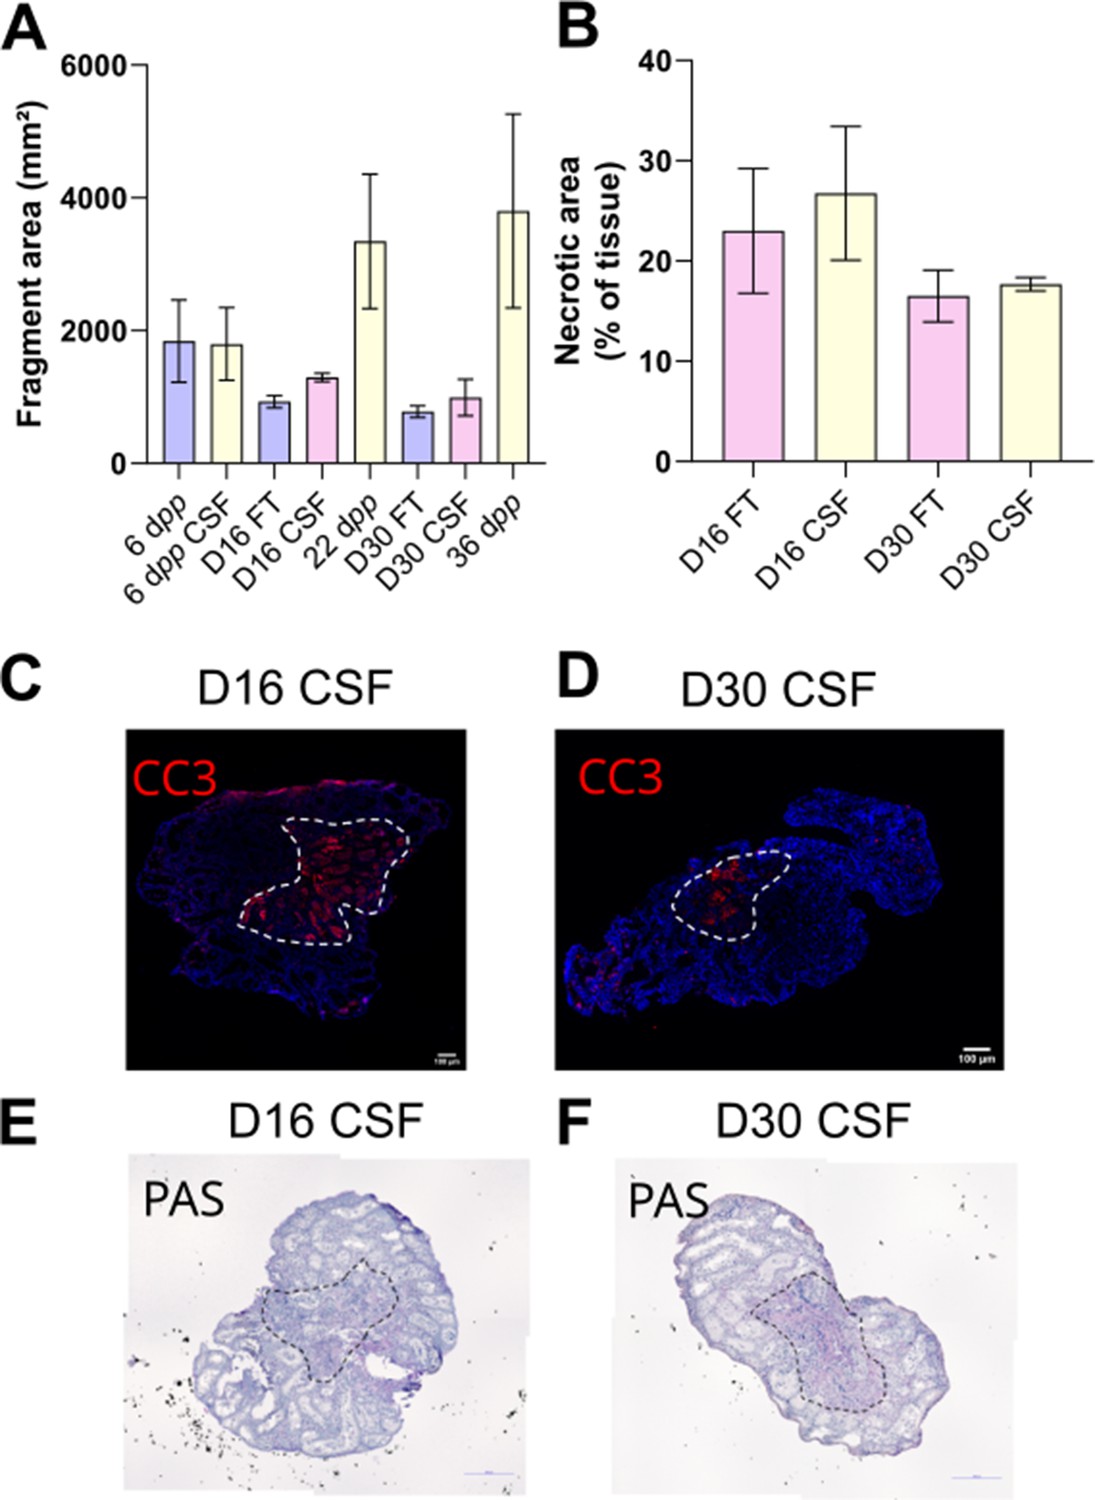
Morphological analysis of tissue sections after 16 or 30 days of organotypic cultures.
(A) Testicular tissue area (in mm²) measured on tissue sections from mice of different ages (6 dpp, 22 dpp, and 36 dpp) and after 16 days (D16) or 30 days (D30) of organotypic cultures. (B) Necrotic region (percentage of the tissue section area) at D16 and D30. (C–D) Representative images of cleaved caspase 3 (CC3) immunostaining, mostly detected in the central necrotic region (dotted lines). Testicular tissue sections were counterstained with Hoechst (blue). Scale: 100 µm. (E–F) Representative images of periodic acid schiff (PAS) staining, with the necrotic area delineated by dotted lines. Testicular tissue sections were counterstained with hematoxylin. Scale: 200 µm. Data are presented as means ± SEM with n=4 biological replicates for each group. A value of *p<0.05 was considered statistically significant. FT: Fresh Tissue; CSF: Controlled Slow Freezing.
-
Figure 8—figure supplement 1—source data 1
Source data of Figure 8—figure supplement 1.
- https://cdn.elifesciences.org/articles/85562/elife-85562-fig8-figsupp1-data1-v1.xlsx
Author response image 1
Tables
Key resources table
| Reagent type (species) or resource | Designation | Source or reference | Identifiers | Additional information |
|---|---|---|---|---|
| Biological sample (Mus musculus, male) | Testis | CD-1 Mice from Charles River | Freshly isolated from male Mus musculus (CD-1) | |
| Antibody | Anti-3β-HSD (mouse monoclonal) | Santa Cruz Biot. | sc-515120 (AF488) | IF (1:100), WB (1:1000) |
| Antibody | Anti-β-Actin (mouse monoclonal) | Abcam | ab8226 | WB (1:5000) |
| Antibody | Anti-AR (rabbit monoclonal) | Abcam | ab133273 | IF (1:100), WB (1:5000) |
| Antibody | Anti-CC3 (rabbit polyclonal) | Abcam | ab49822 | IF (1:200) |
| Antibody | Anti-CYP17A1 (rabbit polyclonal) | Abcam | ab231794 | IF (1:200), WB (1:10000) |
| Antibody | Anti-CYP19A1 (mouse monoclonal) | BioRad | MCA2077S | IHC (1:50), WB (1:250) |
| Antibody | Anti-FAAH (rabbit polyclonal) | Proteintech | 17909–1-AP | WB (1:1000) |
| Antibody | Anti-Ki67 (rabbit monoclonal) | Abcam | ab16667 | IF (1:100) |
| Antibody | Anti-mouse Alexa 488 (goat) | Abcam | ab150113 | IF (1:200) |
| Antibody | Anti-rabbit Alexa 488 (goat) | Abcam | ab150077 | IF (1:200) |
| Antibody | Anti-rabbit Alexa 594 (goat) | Abcam | ab150080 | IF (1:200) |
| Antibody | Anti-mouse HRP (goat) | Invitrogen | 31430 | WB (1:5000) |
| Antibody | Anti-rabbit HRP (goat) | Invitrogen | A16110 | WB (1:5000) |
| Commercial assay or kit | RNeasy Micro kit | Qiagen | 74004 | |
| Commercial assay or kit | qScript cDNA SuperMix | QuantaBio | 95048 | |
| Commercial assay or kit | Lipid Extraction kit | Abcam | ab211044 | |
| Commercial assay or kit | Cholesterol/Cholesteryl Ester assay kit | Abcam | ab65359 | |
| Commercial assay or kit | Progesterone ELISA kit | Cayman Chemical Company | 582601 | |
| Commercial assay or kit | Estradiol ELISA kit | Cayman Chemical Company | 501890 | |
| Commercial assay or kit | Aromatase (CYP19A) Activity assay kit | Abcam | ab273306 | |
| Commercial assay or kit | INSL3 RIA kit | Phoenix Pharmaceuticals | RK-035–27 | |
| Chemical compound, drug | KSR | Gibco by Life Technologies | 10828010 | (10%) |
| Chemical compound, drug | Retinol | Sigma-Aldrich | R7632 | 1 µM |
| Chemical compound, drug | hCG | MSD France | Ovitrelle | 1 nM |
| Chemical compound, drug | SYBR Green | Thermo Fisher Scientific | 4385616 |
Additional files
-
Supplementary file 1
Detailed tables of antibodies, primers and LC-MS/MS's parameters used.
(a) Detailed list of antibodies used in this study HRP: horseradish peroxidase; IF: immunofluorescence; IHC: immunohistochemistry; O/N: overnight; RT: room temperature; WB: western blot. (b) List of PCR primers used in this study. (c) Compound-specific MRM parameters for LC-MS/MS CE: collision energy; DHEA: Dehydroepiandrosterone; MRM: multiple reaction monitoring
- https://cdn.elifesciences.org/articles/85562/elife-85562-supp1-v1.docx
-
MDAR checklist
- https://cdn.elifesciences.org/articles/85562/elife-85562-mdarchecklist1-v1.pdf
-
Source data 1
Western Blot for 3β-HSD, CYP17A1, AR, CYP19A1, and FAAH.
- https://cdn.elifesciences.org/articles/85562/elife-85562-data1-v1.pdf
Download links
A two-part list of links to download the article, or parts of the article, in various formats.
Downloads (link to download the article as PDF)
Open citations (links to open the citations from this article in various online reference manager services)
Cite this article (links to download the citations from this article in formats compatible with various reference manager tools)
Steroidogenesis and androgen/estrogen signaling pathways are altered in in vitro matured testicular tissues of prepubertal mice
eLife 12:RP85562.
https://doi.org/10.7554/eLife.85562.4


