SIRT2 inhibition protects against cardiac hypertrophy and ischemic injury
- Feinberg Cardiovascular and Renal Research Institute, Northwestern University School of Medicine, United States
Figures
Figure 1 with 1 supplement

SIRT2 is upregulated in heart failure (HF).
(A) SIRT1, SIRT2, SIRT3, and SIRT6 in mouse hearts after trans-aortic constriction (TAC). (B) SIRT2 in human hearts from healthy patients and patients with dilated cardiomyopathy. (C) SIRT2 protein levels in the hearts of control individual and patients with ischemic heart failure. *p<0.05 by Student’s t-test. Data presented as mean ± SEM.
-
Figure 1—source data 1
SIRT1, -2, -3, and -6 after sham and trans-aortic constriction (TAC) surgery as shown in Figure 1A.
- https://cdn.elifesciences.org/articles/85571/elife-85571-fig1-data1-v2.csv
-
Figure 1—source data 2
SIRT2 in non-failing and failing human hearts as shown in Figure 1B.
- https://cdn.elifesciences.org/articles/85571/elife-85571-fig1-data2-v2.csv
-
Figure 1—source data 3
SIRT2 in non-failing and ischemic human hearts as shown in Figure 1C.
- https://cdn.elifesciences.org/articles/85571/elife-85571-fig1-data3-v2.csv
-
Figure 1—source data 4
Full gels for Figure 1A–C.
- https://cdn.elifesciences.org/articles/85571/elife-85571-fig1-data4-v2.pptx
-
Figure 1—source data 5
Full gels for Figure 1A–C unedited.
- https://cdn.elifesciences.org/articles/85571/elife-85571-fig1-data5-v2.pptx
-
Figure 1—source data 6
Full gels for Figure 1A–C unedited.
- https://cdn.elifesciences.org/articles/85571/elife-85571-fig1-data6-v2.zip
Figure 1—figure supplement 1
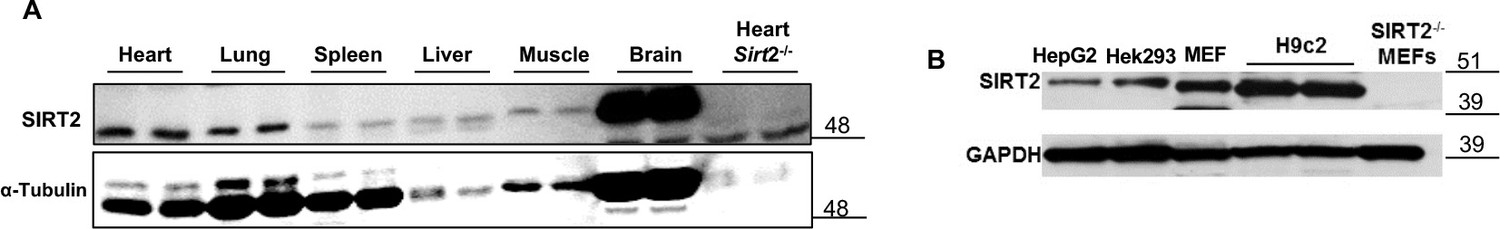
SIRT2 protein in different mouse tissues, including the heart (A), and in various cell lines, including H9c2 cells (B).
-
Figure 1—figure supplement 1—source data 1
Full gels for Figure 1—figure supplement 1.
- https://cdn.elifesciences.org/articles/85571/elife-85571-fig1-figsupp1-data1-v2.pptx
-
Figure 1—figure supplement 1—source data 2
Full gels for Figure 1—figure supplement 1 unedited.
- https://cdn.elifesciences.org/articles/85571/elife-85571-fig1-figsupp1-data2-v2.pptx
Figure 2 with 1 supplement
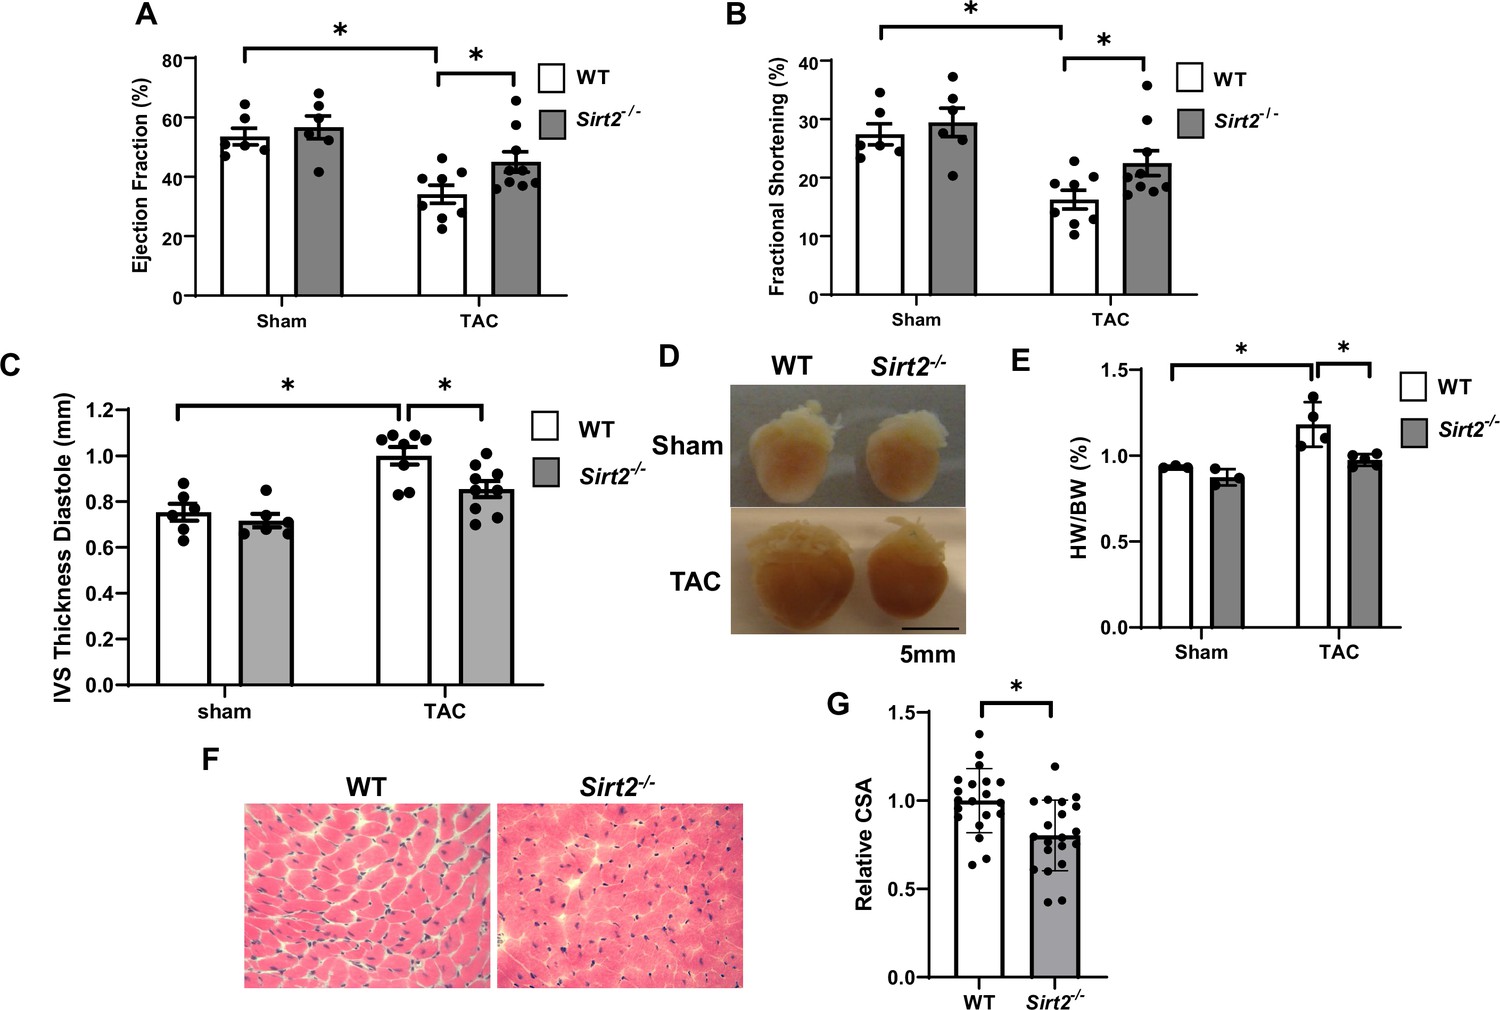
Sirt2 deficiency protects the heart against cardiac dysfunction after trans-aortic constriction (TAC).
Sirt2-/- and wild-type (WT) littermates were subjected to TAC and ejection fraction (EF) (A), fractional shortening (FS) (B), and interventricular septal thickness during diastole (C) were assessed 4 weeks later (N=6–9). (D–F) Representative hearts (D), HW/BW (E) (N=3–5), H&E staining, (F) and the summary of cross-sectional area of cardiomyocytes (G) in WT and Sirt2-/- hearts (N=20 cardiomyocytes), *p<0.05 by one-way ANOVA and post hoc Tukey analysis (A, B, C, and E) and unpaired Student’s t-test (G). Bars represent group mean.
-
Figure 2—source data 1
Ejection fraction (EF) in wild-type (WT) and Sirt2-/- mice after sham or trans-aortic constriction (TAC) as shown in Figure 2A.
- https://cdn.elifesciences.org/articles/85571/elife-85571-fig2-data1-v2.csv
-
Figure 2—source data 2
Fractional shortening (FS) in wild-type (WT) and Sirt2-/- mice after sham or trans-aortic constriction (TAC) as shown in Figure 2B.
- https://cdn.elifesciences.org/articles/85571/elife-85571-fig2-data2-v2.csv
-
Figure 2—source data 3
Interventricular septal (IVS) thickness diastole in wild-type (WT) and Sirt2-/- mice after sham or trans-aortic constriction (TAC) as shown in Figure 2C.
- https://cdn.elifesciences.org/articles/85571/elife-85571-fig2-data3-v2.csv
-
Figure 2—source data 4
HW/BW in wild-type (WT) and Sirt2-/- mice after sham or trans-aortic constriction (TAC) as shown in Figure 2E.
- https://cdn.elifesciences.org/articles/85571/elife-85571-fig2-data4-v2.csv
-
Figure 2—source data 5
CSA in wild-type (WT) and Sirt2-/- hearts as shown in Figure 2G.
- https://cdn.elifesciences.org/articles/85571/elife-85571-fig2-data5-v2.csv
Figure 2—figure supplement 1
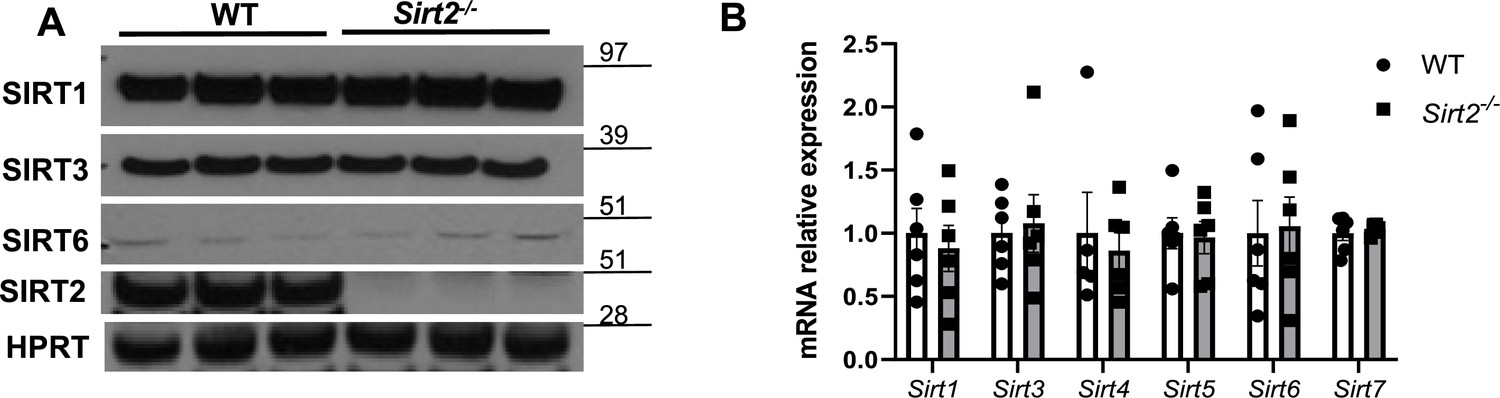
Expression of protein (A) and mRNA (B) of other sirtuin family members in the hearts of Sirt2-/- mice.
N=6. Data presented as mean ± SEM.
-
Figure 2—figure supplement 1—source data 1
mRNA levels of sirtuin proteins in wild-type (WT) and Sirt2-/- hearts as shown in Figure 2—figure supplement 1.
- https://cdn.elifesciences.org/articles/85571/elife-85571-fig2-figsupp1-data1-v2.csv
-
Figure 2—figure supplement 1—source data 2
Full gels for Figure 2—figure supplement 1.
- https://cdn.elifesciences.org/articles/85571/elife-85571-fig2-figsupp1-data2-v2.pptx
-
Figure 2—figure supplement 1—source data 3
Full gels for Figure 2—figure supplement 1 unedited.
- https://cdn.elifesciences.org/articles/85571/elife-85571-fig2-figsupp1-data3-v2.pptx
Figure 3
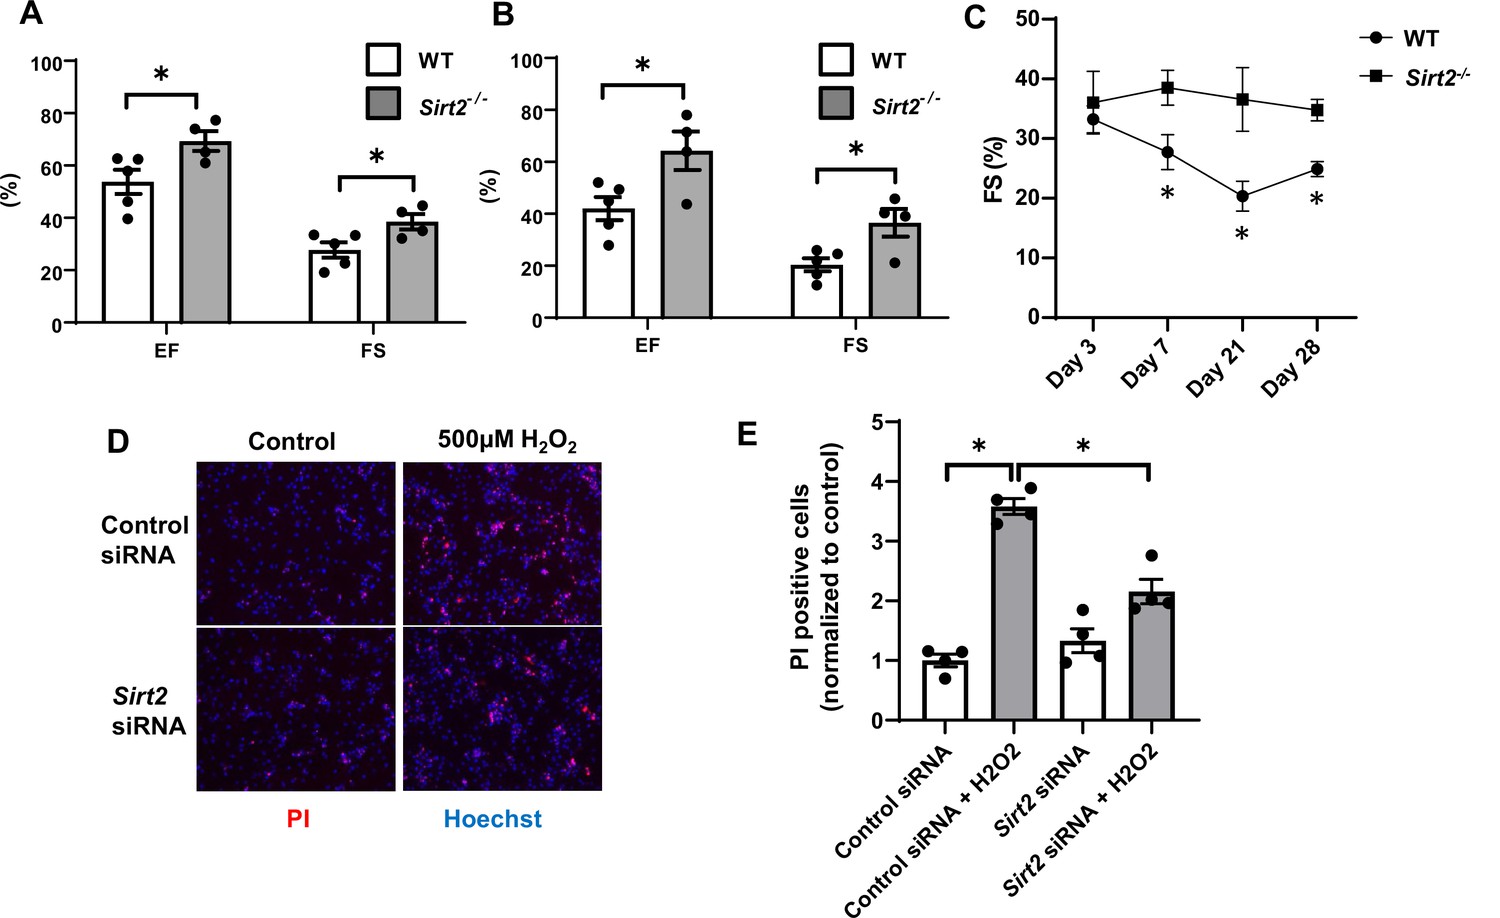
Hearts from Sirt2-/- mice are protected against ischemia-reperfusion (I/R) injury.
Ejection fraction (EF) and fractional shortening (FS) in wild-type (WT) and Sirt2-/- mice 7 (A) and 21 days (B) after I/R (N=4–5). (C) Time course of FS in Sirt2-/- mice after I/R injury (N=4–5). (D, E) Cell death assessed by propidium iodide (PI), in neonatal rat cardiomyocyte (NRCM) treated with control or Sirt2 siRNA and with 500 µM of H2O2. *p<0.05 by ANOVA for all panels expect for panel C, where Student’s t-test was used for comparison between the two time points. Bars represent mean (A, B), and data presented as mean ± SEM.
-
Figure 3—source data 1
Ejection fraction (EF) and fractional shortening (FS) in wild-type (WT) and Sirt2-/- mice after ischemia-reperfusion (I/R) as shown in Figure 3A.
- https://cdn.elifesciences.org/articles/85571/elife-85571-fig3-data1-v2.csv
-
Figure 3—source data 2
Ejection fraction (EF) and fractional shortening (FS) in wild-type (WT) and Sirt2-/- mice after ischemia-reperfusion (I/R) as shown in Figure 3B.
- https://cdn.elifesciences.org/articles/85571/elife-85571-fig3-data2-v2.csv
-
Figure 3—source data 3
Time course of fractional shortening (FS) in wild-type (WT) and Sirt2-/- mice after ischemia-reperfusion (I/R) as shown in Figure 3C.
- https://cdn.elifesciences.org/articles/85571/elife-85571-fig3-data3-v2.csv
-
Figure 3—source data 4
Propidium iodide (PI) positive cells as shown in Figure 3E.
- https://cdn.elifesciences.org/articles/85571/elife-85571-fig3-data4-v2.csv
Figure 4 with 2 supplements
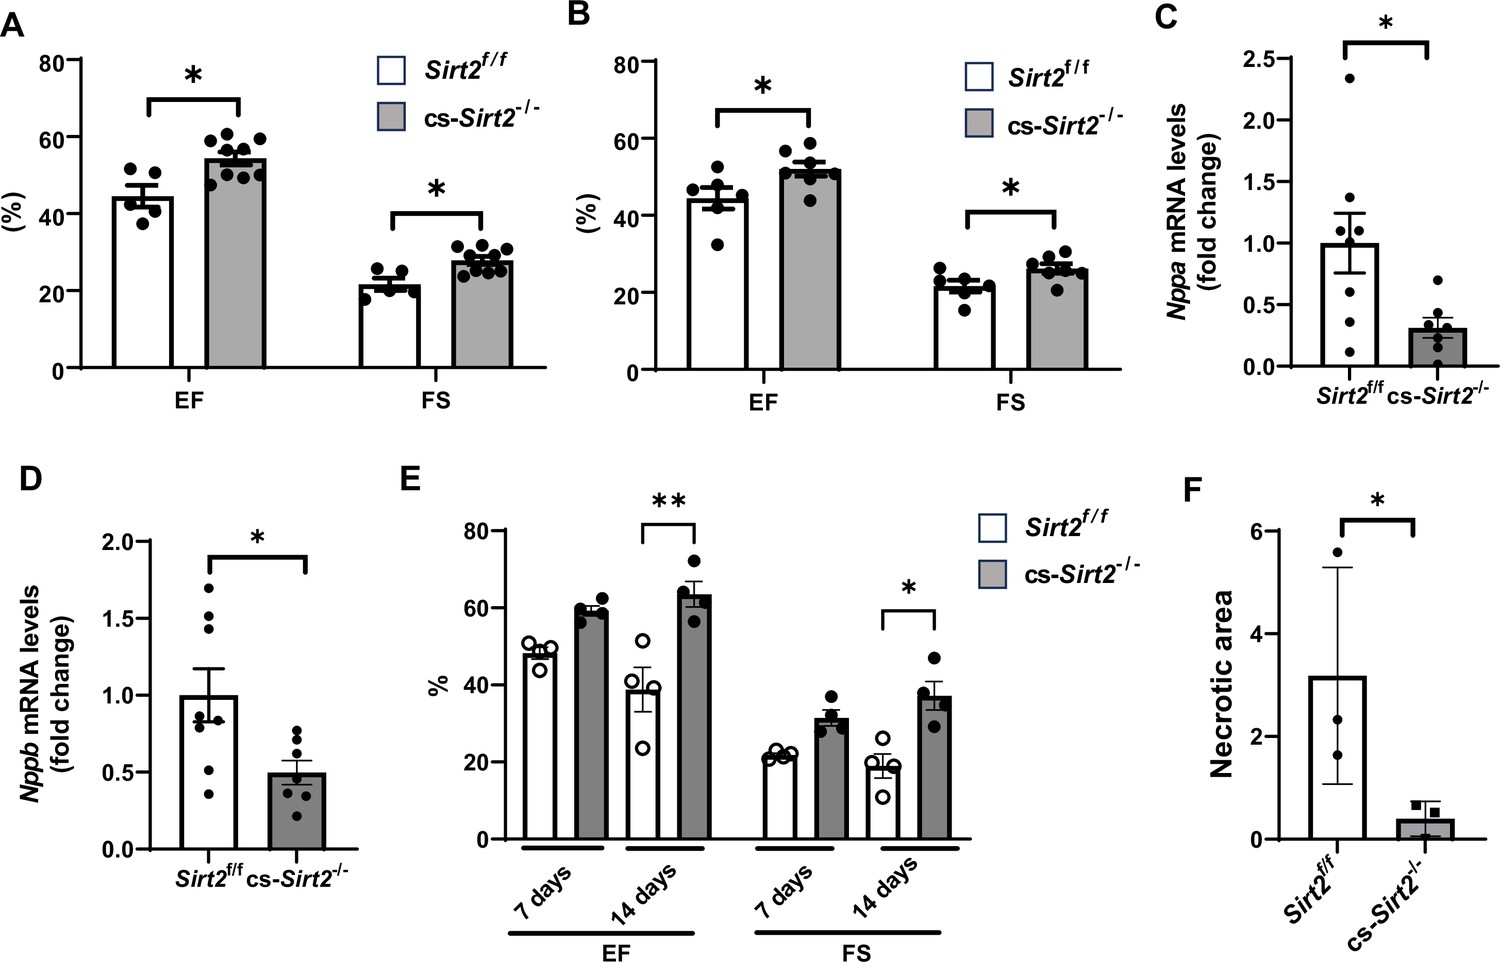
cs-Sirt2-/- hearts are protected against trans-aortic constriction (TAC) and ischemia-reperfusion (I/R).
Ejection fraction (EF) and fractional shortening (FS) in Sirt2f/f and cs-Sirt2-/- mice 7 (A) and 14 days (B) after TAC (N=5–9). (C,D) mRNA levels of Anf (C) and Bnp (D) in the hearts of Sirt2f/f and cs-Sirt2-/- mice 4 weeks after TAC (N=7–8). (E) EF and FS in Sirt2f/f and cs-Sirt2-/- mice 7 and 14 days after I/R (N=4). (F) Necrotic area (representing the degree of ischemic damage) in Sirt2f/f and cs-Sirt2-/- mice 14 days after MI. *p<0.05 by ANOVA for panels A and B, and Student’s t-test was used for panels C and D. Data are presented as mean ± SEM.
-
Figure 4—source data 1
Ejection fraction (EF) and fractional shortening (FS) in Sirt2f/f and cs-Sirt2-/- mice 7 days after ischemia-reperfusion (I/R) as shown in Figure 4A.
- https://cdn.elifesciences.org/articles/85571/elife-85571-fig4-data1-v2.csv
-
Figure 4—source data 2
Ejection fraction (EF) and fractional shortening (FS) in Sirt2f/f and cs-Sirt2-/- mice 14 days after ischemia-reperfusion (I/R) as shown in Figure 4B.
- https://cdn.elifesciences.org/articles/85571/elife-85571-fig4-data2-v2.csv
-
Figure 4—source data 3
Nppa mRNA in Sirt2f/f and cs-Sirt2-/- hearts as shown in Figure 4C.
- https://cdn.elifesciences.org/articles/85571/elife-85571-fig4-data3-v2.csv
-
Figure 4—source data 4
Nppb mRNA in Sirt2f/f and cs-Sirt2-/- hearts as shown in Figure 4D.
- https://cdn.elifesciences.org/articles/85571/elife-85571-fig4-data4-v2.csv
-
Figure 4—source data 5
Echo parameters in Sirt2f/f and cs-Sirt2-/- hearts as shown in Figure 4E.
- https://cdn.elifesciences.org/articles/85571/elife-85571-fig4-data5-v2.xlsx
Figure 4—figure supplement 1
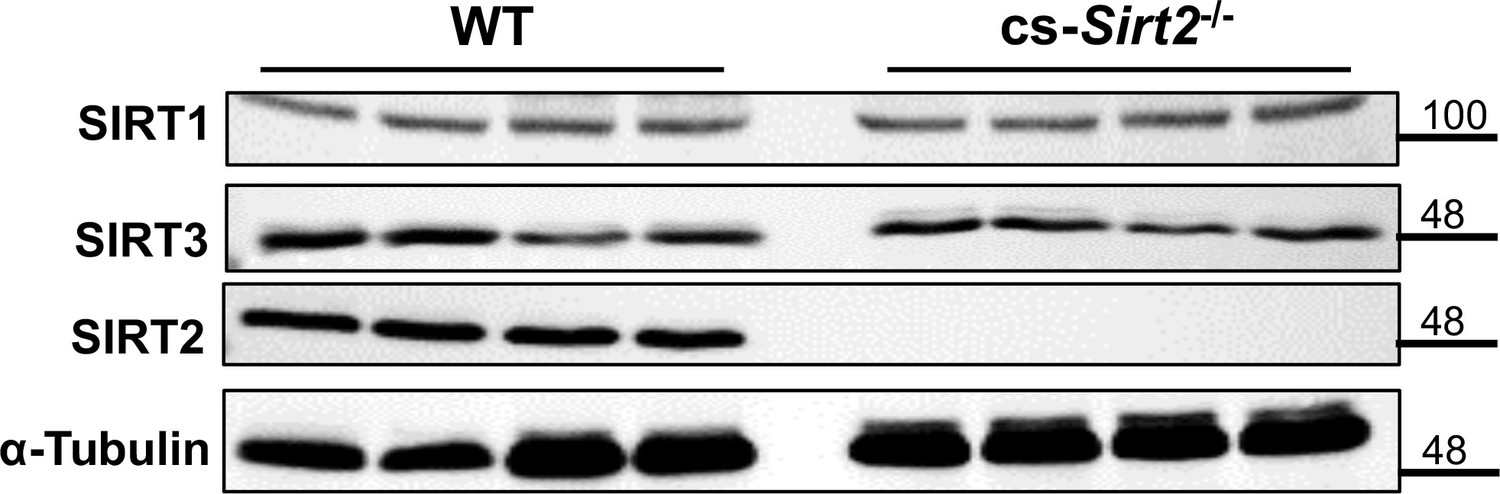
SIRT1, SIRT3, and SIRT2 protein in the hearts of cs-Sirt2-/- mice.
-
Figure 4—figure supplement 1—source data 1
Uncropped gels for Figure 4—figure supplement 1.
- https://cdn.elifesciences.org/articles/85571/elife-85571-fig4-figsupp1-data1-v2.pptx
-
Figure 4—figure supplement 1—source data 2
Uncropped gels for Figure 4—figure supplement 1 unedited.
- https://cdn.elifesciences.org/articles/85571/elife-85571-fig4-figsupp1-data2-v2.pptx
Figure 4—figure supplement 2
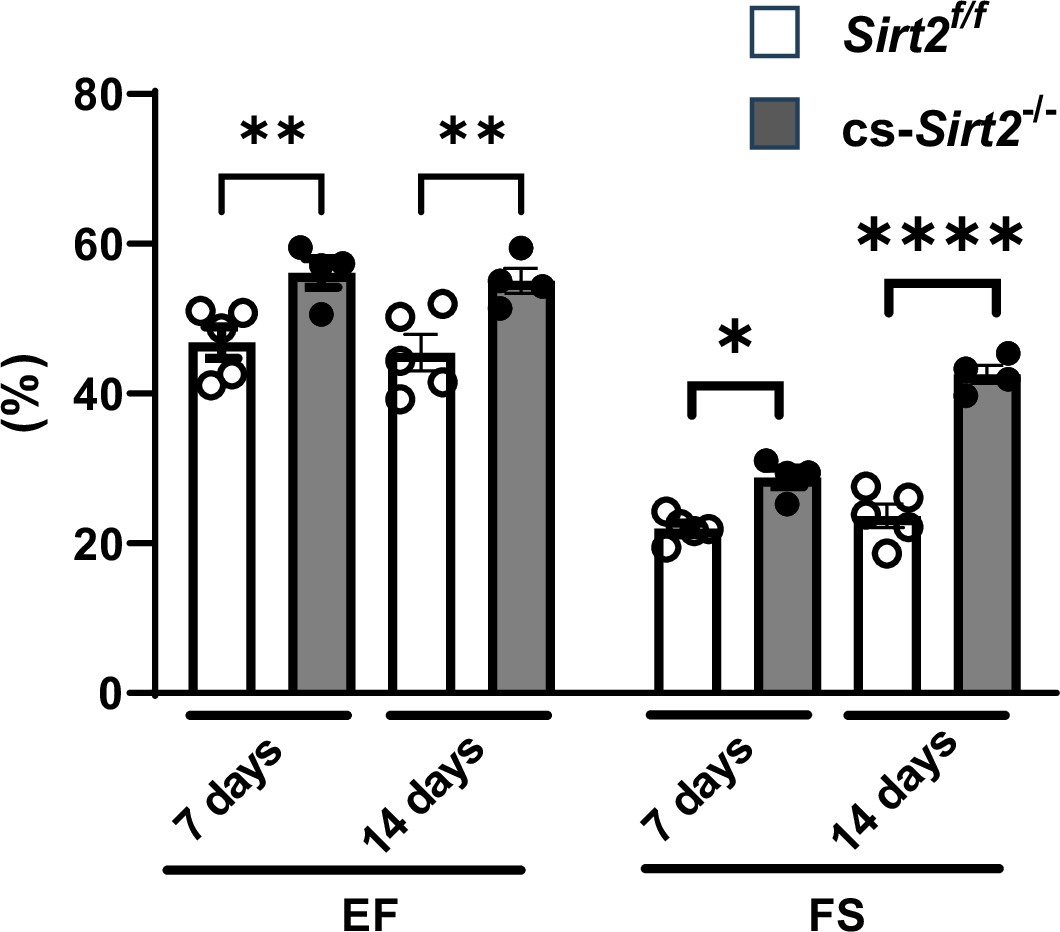
cs-Sirt2-/- hearts from female mice are protected against trans-aortic constriction (TAC).
Ejection fraction (EF) and fractional shortening (FS) in female wild-type (WT) and cs-Sirt2-/- mice 7 and 14days after TAC (N=4).
-
Figure 4—figure supplement 2—source data 1
Ejection fraction (EF) and fractional shortening (FS) in female wild-type (WT) and cs-Sirt2-/- mice 7 and 14 days after TAC as shown in Figure 4—figure supplement 2.
- https://cdn.elifesciences.org/articles/85571/elife-85571-fig4-figsupp2-data1-v2.xlsx
Figure 5 with 3 supplements
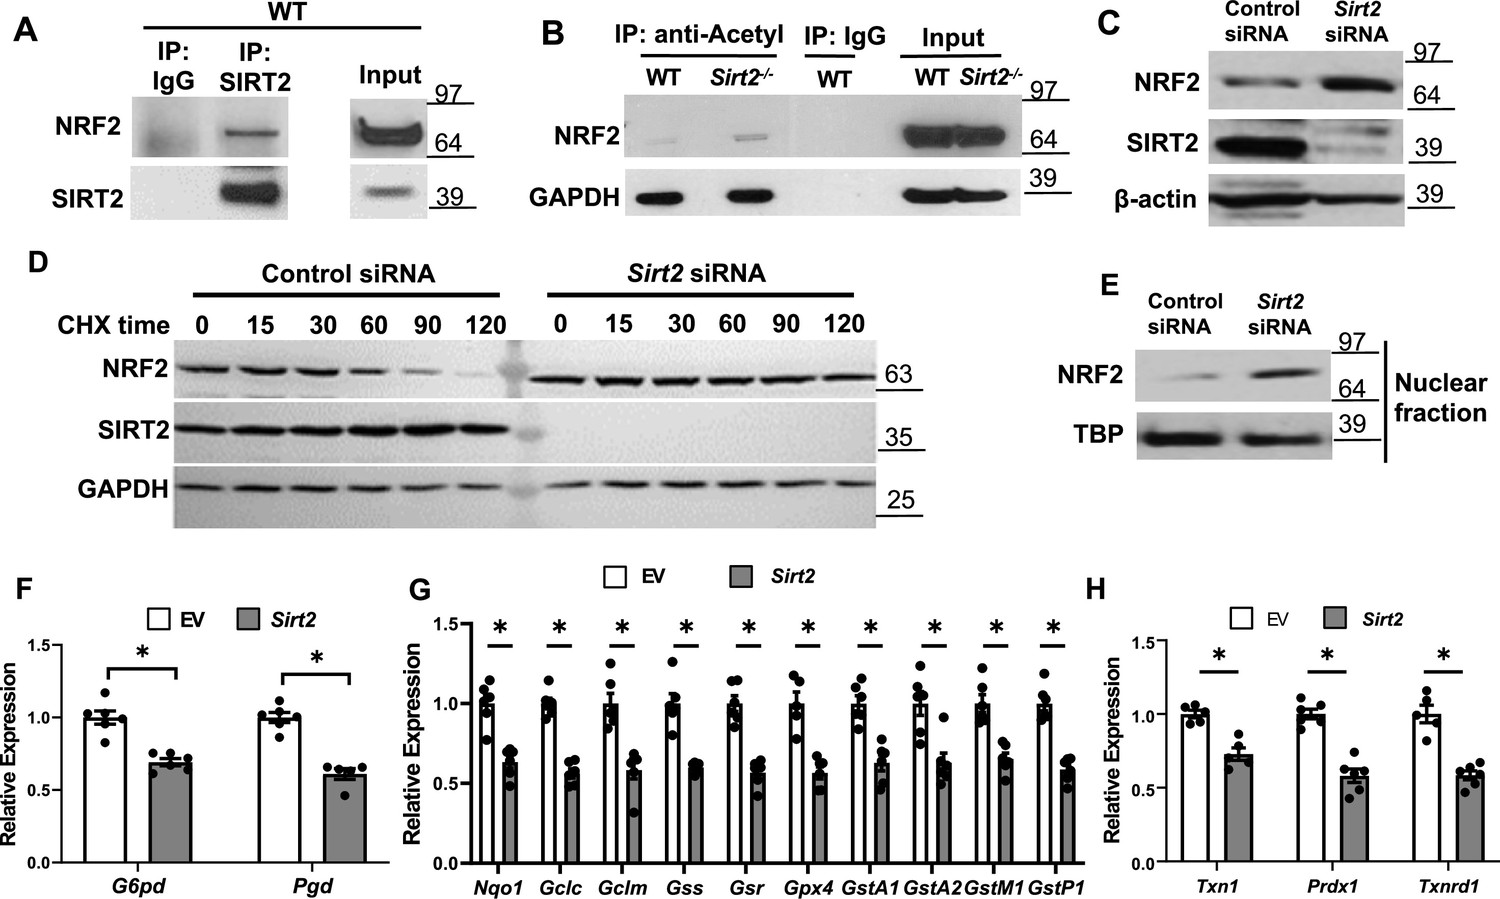
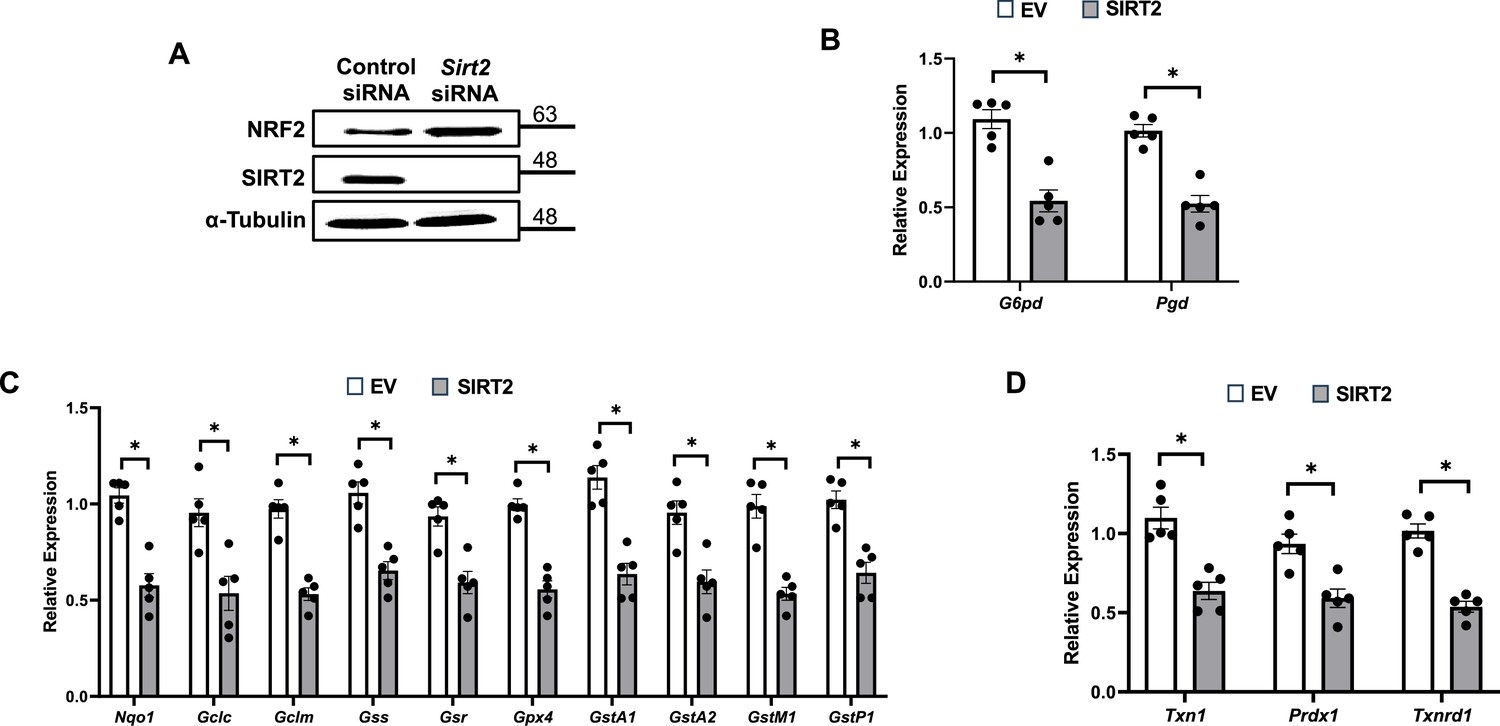
SIRT2 interacts with nuclear factor (erythroid-derived 2)-like 2 (NRF2) and regulates its activity in the heart.
(A) Co-immunoprecipitation (IP) of SIRT2 and NRF2 in extracts of hearts from wild-type (WT) mice. (B) Endogenous NRF2 acetylation levels in the hearts of WT and Sirt2-/- mice at the baseline. Acetylated proteins were IPed by anti-acetyl antibody followed by immunoblotting with anti-NRF2 antibody. (C) NRF2 protein levels in neonatal rat cardiomyocytes (NRCMs) treated with Sirt2 siRNA. (D) NRF2 protein levels in H9c2 cells treated with control or Sirt2 siRNA and harvested at different time points after treatment with 100 µg/ml of CHX. (E) NRF2 protein levels in the nucleus in NRCMs treated with control or Sirt2 siRNA. (F–H) mRNA levels of NRF2 target genes in pentose phosphate pathway (F), quinone and glutathione-based detoxification (G), thioredoxin production (H) in H9c2 cells overexpressing empty vector (white bars) or SIRT2 (gray bars). *p<0.05 by Student’s t-test.
-
Figure 5—source data 1
mRNA with overexpression of EV or SIRT2 as shown in Figure 5F.
- https://cdn.elifesciences.org/articles/85571/elife-85571-fig5-data1-v2.csv
-
Figure 5—source data 2
mRNA with overexpression of EV or SIRT2 as shown in Figure 5G.
- https://cdn.elifesciences.org/articles/85571/elife-85571-fig5-data2-v2.csv
-
Figure 5—source data 3
mRNA with overexpression of EV or SIRT2 as shown in Figure 5H.
- https://cdn.elifesciences.org/articles/85571/elife-85571-fig5-data3-v2.csv
-
Figure 5—source data 4
Uncropped gels for Figure 5.
- https://cdn.elifesciences.org/articles/85571/elife-85571-fig5-data4-v2.pptx
-
Figure 5—source data 5
Uncropped gels for Figure 5 unedited.
- https://cdn.elifesciences.org/articles/85571/elife-85571-fig5-data5-v2.pptx
-
Figure 5—source data 6
Uncropped gels for Figure 5 unedited.
- https://cdn.elifesciences.org/articles/85571/elife-85571-fig5-data6-v2.zip
Figure 5—figure supplement 1

Effects of SIRT2 overexpression on mRNA levels of non-nuclear factor (erythroid-derived 2)-like 2 (NRF2) targeted antioxidant genes.
N=5–6. Data presented as mean ± SEM.
-
Figure 5—figure supplement 1—source data 1
mRNA with overexpression of EV or SIRT2 as shown in Figure 5—figure supplement 1.
- https://cdn.elifesciences.org/articles/85571/elife-85571-fig5-figsupp1-data1-v2.csv
Figure 5—figure supplement 2
SIRT2 regulates nuclear factor (erythroid-derived 2)-like 2 (NRF2) and its target proteins.
(A) NRF2 protein levels in HL-1 cells treated with Sirt2 siRNA. (B–D) mRNA levels of NRF2 target genes in pentose phosphate pathway (B), quinone and glutathione-based detoxification (C), thioredoxin production (D) in HL-1 cells overexpressing empty vector (white bars) or SIRT2 (gray bars). *p<0.05 by Student’s t-test.
-
Figure 5—figure supplement 2—source data 1
Uncropped gels for Figure 5—figure supplement 2A.
- https://cdn.elifesciences.org/articles/85571/elife-85571-fig5-figsupp2-data1-v2.pptx
-
Figure 5—figure supplement 2—source data 2
Uncropped gels for Figure 5—figure supplement 2A unedited.
- https://cdn.elifesciences.org/articles/85571/elife-85571-fig5-figsupp2-data2-v2.pptx
-
Figure 5—figure supplement 2—source data 3
mRNA with overexpression of EV or SIRT2 as shown in Figure 5—figure supplement 2B–D.
- https://cdn.elifesciences.org/articles/85571/elife-85571-fig5-figsupp2-data3-v2.xlsx
Figure 5—figure supplement 3
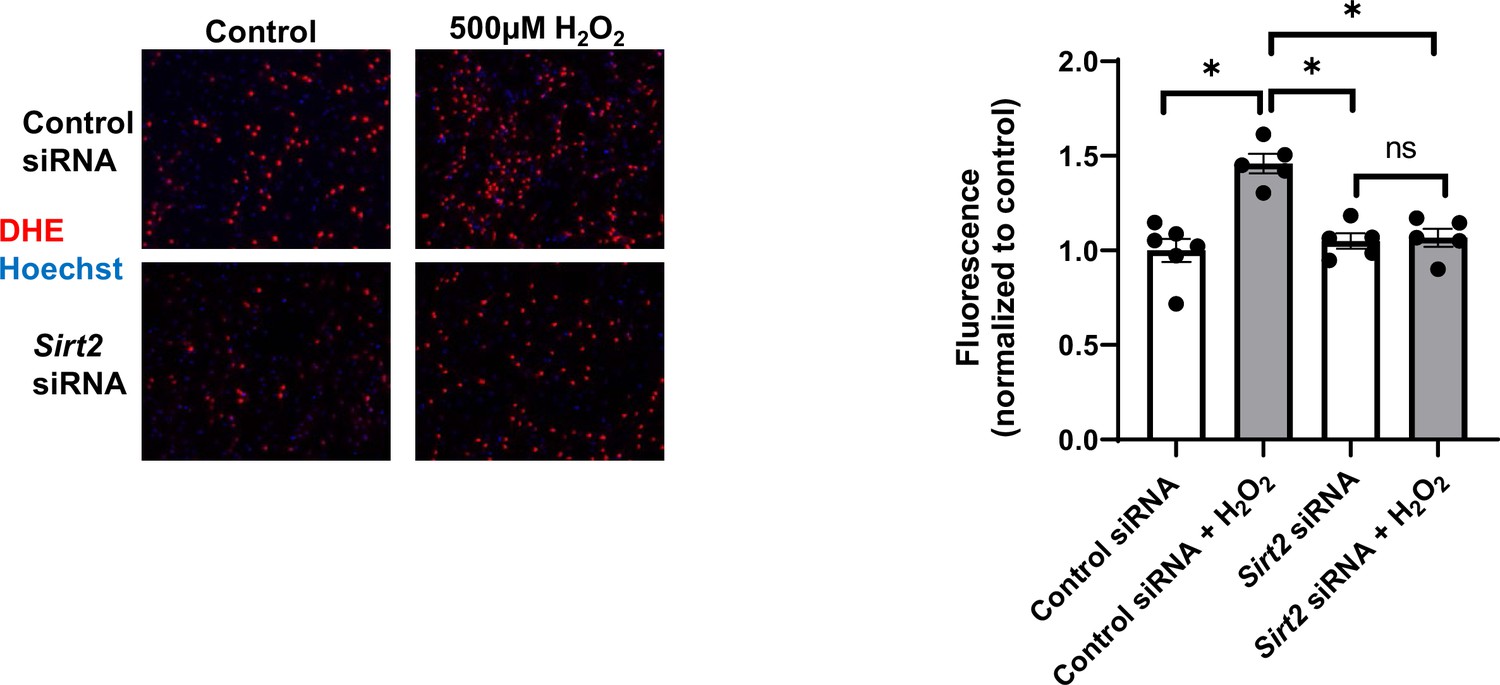
Reactive oxygen species (ROS) levels as assessed by dihydroethidium (DHE) staining in neonatal rat cardiomyocytes (NRCMs) treated with control or Sirt2 siRNA after treatment with 500 µM H2O2.
N=5–6. Data presented as mean ± SEM.
-
Figure 5—figure supplement 3—source data 1
Fluorescence of cell death for Figure 5—figure supplement 3.
- https://cdn.elifesciences.org/articles/85571/elife-85571-fig5-figsupp3-data1-v2.csv
Figure 6

Nrf2 deletion and SIRT2 inhibitors protected against cardiac damage and cardiac hypertrophy.
Ejection fraction (EF) (A) and fractional shortening (FS) (B) in wild-type (WT), Sirt2-/-, and Sirt2-/-/Nrf2-/- double knockout (KO) mice 28 days after ischemia-reperfusion (I/R) (N=4–5). (C) Protocol for treatment of mice with SIRT2 inhibitor, AGK2. (D) Echo images of hearts from WT mice treated with either vehicle or AGK2. (E–J) EF (E), FS (F), left ventricular diameter during diastole (LVDd) (G), left ventricular diameter during systole (LVDs) (H), IVSd (I), and posterior wall thickness during diastole (PWTd) (J) in WT mice treated with AGK after trans-aortic constriction (TAC) according to the protocol in panel C (N=6–10). *p<0.05 by ANOVA for panels A–B or Student’s t-test for panels E–J.
-
Figure 6—source data 1
Ejection fraction (EF) in wild-type (WT), Sirt2-/-, and Sirt2-/-/Nrf2-/- mice after ischemia-reperfusion (I/R) as shown in Figure 6A.
- https://cdn.elifesciences.org/articles/85571/elife-85571-fig6-data1-v2.csv
-
Figure 6—source data 2
Fractional shortening (FS) in wild-type (WT), Sirt2-/-, and Sirt2-/-/Nrf2-/- mice after ischemia-reperfusion (I/R) as shown in Figure 6B.
- https://cdn.elifesciences.org/articles/85571/elife-85571-fig6-data2-v2.csv
-
Figure 6—source data 3
Ejection fraction (EF) with AGK2 as shown in Figure 6E.
- https://cdn.elifesciences.org/articles/85571/elife-85571-fig6-data3-v2.csv
-
Figure 6—source data 4
Fractional shortening (FS) with AGK2 as shown in Figure 6F.
- https://cdn.elifesciences.org/articles/85571/elife-85571-fig6-data4-v2.csv
-
Figure 6—source data 5
Left ventricular diameter during diastole (LVDd) with AGK2 as shown in Figure 6G.
- https://cdn.elifesciences.org/articles/85571/elife-85571-fig6-data5-v2.csv
-
Figure 6—source data 6
LVDs with AGK2 as shown in Figure 6H.
- https://cdn.elifesciences.org/articles/85571/elife-85571-fig6-data6-v2.csv
-
Figure 6—source data 7
IVSd with AGK2 as shown in Figure 6I.
- https://cdn.elifesciences.org/articles/85571/elife-85571-fig6-data7-v2.csv
-
Figure 6—source data 8
Posterior wall thickness during diastole (PWTd) with AGK2 as shown in Figure 6J.
- https://cdn.elifesciences.org/articles/85571/elife-85571-fig6-data8-v2.csv
Tables
Appendix 1—table 1
Primer sequences.
| Genes | Forward primer | Reverse primer | Species |
|---|---|---|---|
| Nppa | GGGTAGGATTGACAGGATTGG | CCTCCTTGGCTGTTATCTTC | Mouse |
| 18 s | AGTCCCTGCCCTTTGTACACA | CGATCCGAGGGCCTCACTA | |
| Actb | CTAAGGCCAACCGTGAAAAG | ACCAGAGGCATACAGGGACA | Mouse |
| Nppb | ATCCGTCAGTCGTTTGGG | CAGAGTCAGAAACTGGAGTC | Mouse |
| G6pd | GGCCAACCGTCTGTTCTACCT | CCACTATGATGCGGTTCCAGC | Rat |
| Pgd | CGGGTCATACTGCTCGTGAA | AGGTCCTGGCATCTTCTTGTCG | Rat |
| Nqo1 | CACTACGATCCGCCCCCAAC | GCGTGGGCCAATACAATCAGG | Rat |
| Gclc | GTCAAGGACCGGCACAAGGA | GAACATCGCCGCCATTCAGT | Rat |
| Gclm | TGCCACCAGATTTGACTGCATTT | TCCTGGAAACTTGCCTCAGAGAG | Rat |
| Gss | GAGGTCCGCAAAGAACCCCA | GAGCGTGAATGGGGCATACG | Rat |
| Gsr | TCACCCCGATGTATCACGCT | GCCCTGAAGCATCTCATCGC | Rat |
| Gpx4 | AGCAACAGCCACGAGTTCCT | ATCGATGTCCTTGGCTGCGA | Rat |
| Gsta1 | ACTTCGATGGCAGGGGGAGAA | TGGAACATCAAACTCCCATCATTCC | Rat |
| Gsta2 | TTGACGGGATGAAGCTGGCA | GTCAGATCTAAAATGCCTTCGGTGT | Rat |
| Gstm1 | CCAAGTGCCTGGACGCCTTC | ATAGGTGTTGAGAGGTAGCGGC | Rat |
| Gstp1 | CGTCCACGCAGCTTTGAGT | GTAACCACCTCCTCCTTCCAGC | Rat |
| Txn1 | AGTAGACGTGGATGACTGCCA | AGCACCAGAGAACTCCCCAAC | Rat |
| Prdx1 | TCAGATCCCAAGCGCACCAT | AGCGGCCAACAGGAAGATCA | Rat |
| Txnrd1 | AATGCTGGAGAGGTGACGCA | GATGTCTCCCCCAGAACGCT | Rat |
| Sirt1 | CAGTGTCATGGTTCCTTTGC | CACCGAGGAACTACCTGAT | Mouse |
| Sirt3 | GCTGCTTCTGCGGCTCTATAC | GAAGGACCTTCGACAGACCGT | Mouse |
| Sirt4 | GTGGAAGAATAAGAATGAGCGGA | GGCACAAATAACCCCGAGG | Mouse |
| Sirt5 | CCACCGACAGATTCAGGTTT | TTCCCGTTAGTGCCCTGCTTTA | Mouse |
| Sirt6 | ATGTCGGTGAATTATGCAGCA | GCTGGAGGACTGCCACATTA | Mouse |
| Sirt7 | CAGGTGTCACGCATCCTGAG | GCCCGTGTAGACAACCAAGT | Mouse |
| Cat | CCAGCCAGCGACCAGATGAA | CCTATTGGGTTCCCGCCTCC | Rat |
| Sod1 | AACTGAAGGCGAGCATGGGTT | ATGCCTCTCTTCATCCGCTGG | Rat |
| Sod2 | GGGGCCATATCAATCACAGCA | GAACCTTGGACTCCCACAGAC | Rat |
| Sod3 | ACGTTCTTGGGAGAGCTTGT | CTGCTAAGTCGACACCGGAC | Rat |
| Actb | GGCTCCTAGCACCATGAAGA | CAGTGAGGCCAGGATAGAGC | Rat |
| Hprt 1 | CCCTCAGTCCCAGCGTCGTG | CGAGCAAGTCTTTCAGTCCTGTCC | Rat |
| B2m | CCGTGATCTTTCTGGTGCTTG | GAGACACGTAGCAGTTGAGGA | Rat |
| G6pd | GTCTTTGCTCGGTGCTTGTC | AGCATAGAGGGCCTTACGGA | Mouse |
| Nqo1 | TCTCTGGCCGATTCAGAGTG | CCAGACGGTTTCCAGACGTT | Mouse |
| Gclm | ATGACCCGAAAGAACTGCTC | TGGGTGTGAGCTGGAGTTAAG | Mouse |
| Gclc | ACTGAATGGAGGCGATGTTCTT | CAGAGGGTCGGATGGTTGG | Mouse |
| Gss | GCACCGACACGTTCTCAATG | TAGCACCACCGCATTAGCTG | Mouse |
| Gsr | ATGTTGACTGCCTGCTCTGG | ATCCGTCTGAATGCCCACTT | Mouse |
| Gpx4 | GTACTGCAACAGCTCCGAGT | ATGCACACGAAACCCCTGTA | Mouse |
| Gsta2 | CCAGGACTCTCACTAGACCGT | CCCGGGCATTGAAGTAGTGA | Mouse |
| gstm1 | ATACACCATGGGTGACGCTC | TCCATCCAGGTGGTGCTTTC | Mouse |
| Gstp1 | GTCTACGCAGCACTGAATCC | GGGAGCTGCCCATACAGACA | Mouse |
| Txn1 | GCGCTCCGCCCTATTTCTAT | CCTCCTGAAAAGCTTCCTTGC | Mouse |
| Prdx1 | ACTGACAAACATGGTGAAGTGTG | TACAAGAGTTTCTTCTGGCTGC | Mouse |
| Txnrd1 | GAATGGACAGTCCCATCCCG | AAGCCCACGACACGTTCATC | Mouse |
| Actb | TAAAACCCGGCGGCGCA | GTCATCCATGGCGAACTGGT | Mouse |
| Hprt1 | AGAGCGTTGGGCTTACCTCA | TGGTTCATCATCGCTAATCACG | Mouse |
| B2m | ACGCCTGCAGAGTTAAGCAT | TGATCACATGTCTCGATCCCAG | Mouse |
Appendix 1—key resources table
| Reagent type (species) or resource | Designation | Source or reference | Identifiers | Additional information |
|---|---|---|---|---|
| Strain, strain background (Mus musculus, male, C57BL/6) | Sirt2 knockout mice | Dr. Gius Lab | refer to: SIRT2 Maintains Genome Integrity and Suppresses Tumorigenesis through Regulating APC/C Activity. | |
| Strain, strain background (Mus musculus, male, C57BL/6) | Sirt2 flox/flox mince | Dr. Gius Lab | refer to: SIRT2 deletion enhances KRAS-induced tumorigenesis in vivo by regulating K147 acetylation status | |
| Strain, strain background (Mus musculus, male, C57BL/6) | Nrf2 knockout mice | the Jackson Laboratory | RRID:IMSR_JAX:017009 | |
| Strain, strain background (Rattus norvegicus domestica, female) | Sprague–Dawley rat | Charles River | ||
| Antibody | Rabbit polyclonal SIRT1 antibody | Sigma | 07–131 | WB (1:1000) |
| Antibody | Rabbit polyclonal SIRT2 antibody | Sigma | S8447 | WB (1:1000) |
| Antibody | Rabbit mAb SIRT3 antibody | Cell Signaling Technology | Rabbit mAb #5490 | WB (1:1000) |
| Antibody | Rabbit polyclonal anti-HPRT antibody | Proteintech | 150-59-1-AP | WB (1:5000) |
| Antibody | Mouse monoclonal anti-GAPDH antibody | Proteintech | 60004–1-Ig | WB (1:10000) |
| Antibody | Rabbit mAb NRF2 antibody | Cell Signaling Technology | Rabbit mAb #20733 | WB (1:1000) |
| Antibody | Rabbit polycloncal NRF2 antibody | Abcam | ab31163 | WB (1:1000) |
| Antibody | HRP-conjugated donkey polyclonal anti-mouse IgG antibody | Jackson ImmunoResearch | 715-035-150 | WB (1:5000) |
| Antibody | HRP-conjugated donkey polyclonal anti-rabbit IgG antibody | Jackson ImmunoResearch | 711-035-152 | WB (1:5000) |
| Antibody | Rabbit Anti beta Actin antibody | Abcam | ab8227 | WB (1:2000) |
| Antibody | RabbTBP antibody | Abcam | ab63766 | WB (1:2000) |
| Antibody | Rabbit mAb SIRT6 antibody | Cell Signaling Technology | Rabbit mAb #12486 | WB (1:1000) |
| Antibody | Mouse Flag-M2 monoclonal antibody | Sigma | F1804 | WB: (1:2000); IP(1:xxx) |
| Antibody | Acetyl Lysine Antibody, Agarose | immunechem | ICP0388-2MG | IP: 1:10 |
| Chemical compound, drug | Propodium Iodine | Sigma | P4170-10MG | |
| Chemical compound, drug | Hoechst 34432 | Life Technology | 62249 | |
| Chemical compound, drug | Cycloheximide | Sigma | 1810 | |
| Chemical compound, drug | Paraformaldehyde | Thermo Fisher Scientific | AC416780250 | |
| Chemical compound, drug | RIPA Buffer | Thermo Fisher Scientific | 89901 | |
| Chemical compound, drug | ProteaseArrest Protease Inhibitor | G-Biosciences | 786–437 | |
| Chemical compound, drug | 10% formalin | Fisher Scientific | FLSF1004 | |
| Chemical compound, drug | BrdU | Sigma | 19–160 | |
| Chemical compound, drug | vitamin B12 | Sigma | V2876 | |
| Chemical compound, drug | FBS | Bio-Techne | S11550 | |
| Chemical compound, drug | penicillin–streptomycin | Cytiva | SV30010 | |
| Chemical compound, drug | Lipofectamine 2000 Transfection Reagent | Invitrogen, Thermo Fisher Scientific | 11668027 | |
| Chemical compound, drug | Dharmafect transfection reagent | Horizon | 2001–03 | |
| Chemical compound, drug | AGK2 | Selleckchem | S7577 | |
| Chemical compound, drug | hydrogen peroxide | Fisher Scientific | H324-500 | |
| Chemical compound, drug | Normal Rabbit IgG | Sigma | 12–370 | |
| Chemical compound, drug | DMSO | Sigma | D4540 | |
| Cell line | H9c2 | ATCC | CRL-1446 | |
| Other | DMEM | Corning | 10-013CV | |
| Commercial assay or kit | RNA-STAT60 | Teltest | Cs-502 | |
| Commercial assay or kit | DNAse I | Ambion | AM2222 | |
| Commercial assay or kit | PerfeCTa SYBR Green FastMix | Quanta | 95074–05 K | |
| Commercial assay or kit | qScript cDNA Synthesis Kit | Quanta | 95047–500 | |
| Commercial assay or kit | SuperSignal West Pico PLUS Chemiluminescent Substrate | Pierce | 34579 | |
| Commercial assay or kit | BCA Protein Assay Kit | Pierce | 23225 | |
| Commercial assay or kit | NE-PER Nuclear and Cytoplasmic Extraction Reagents | Pierce | PI78835 | |
| Commercial assay or kit | Trichrome Stain (Masson) Kit | Sigma | HT15-1KT | |
| Commercial assay or kit | Protein A Agarose | Roche | 11719408001 | |
| Commercial assay or kit | dihydroethidium (DHE) assay | Thermo Fisher Scientific | D11347 | |
| Sequence-based reagent | Rat Sirt2 siRNA | Horizon Discovery | M-082072-01-0005 | siGENOME Rat Sirt2 (361532) siRNA |
| Recombinant DNA reagent | Wildtype SIRT2 plasmid | Dr. Gius Lab | refer to: SIRT2 Maintains Genome Integrity and Suppresses Tumorigenesis through Regulating APC/C Activity | |
| Software, algorithm | GraphPad Prism | GraphPad | Version 9 | |
| Software, algorithm | ImageJ | NIH | 1.53 c |
Additional files
Download links
A two-part list of links to download the article, or parts of the article, in various formats.
Downloads (link to download the article as PDF)
Open citations (links to open the citations from this article in various online reference manager services)
Cite this article (links to download the citations from this article in formats compatible with various reference manager tools)
SIRT2 inhibition protects against cardiac hypertrophy and ischemic injury
eLife 12:e85571.
https://doi.org/10.7554/eLife.85571


