Phantasus, a web application for visual and interactive gene expression analysis
- ITMO University, Computer Technologies Laboratory, Russian Federation
- Washington University in St. Louis School of Medicine, Department of Pathology and Immunology, United States
Figures
Figure 1
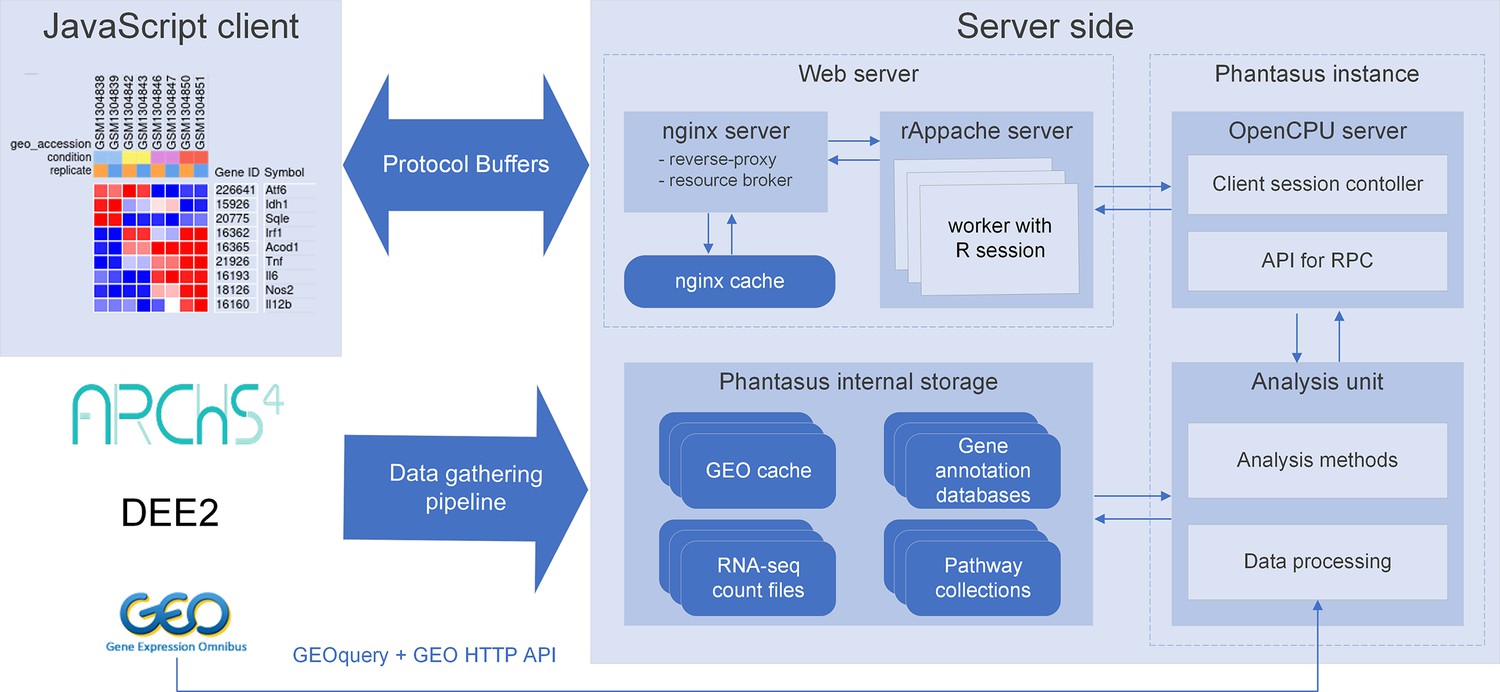
Overview of Phantasus architecture.
The front-end interface is a JavaScript application that requests the web server to load the data and perform resource-consuming tasks. The core element of the back-end is the OpenCPU-based server, which triggers the execution of R-based analysis methods. Protocol Buffers are used for efficient client-server dataset synchronization.
Figure 2

Dataset availability in Phantasus.
For fully supported datasets, gene expression data is accompanied by gene annotations in a standardized format. Partial support datasets have either incomplete gene expression matrix or gene annotations.
-
Figure 2—source data 1
Source file for table shown in Figure 2.
- https://cdn.elifesciences.org/articles/85722/elife-85722-fig2-data1-v2.xlsx
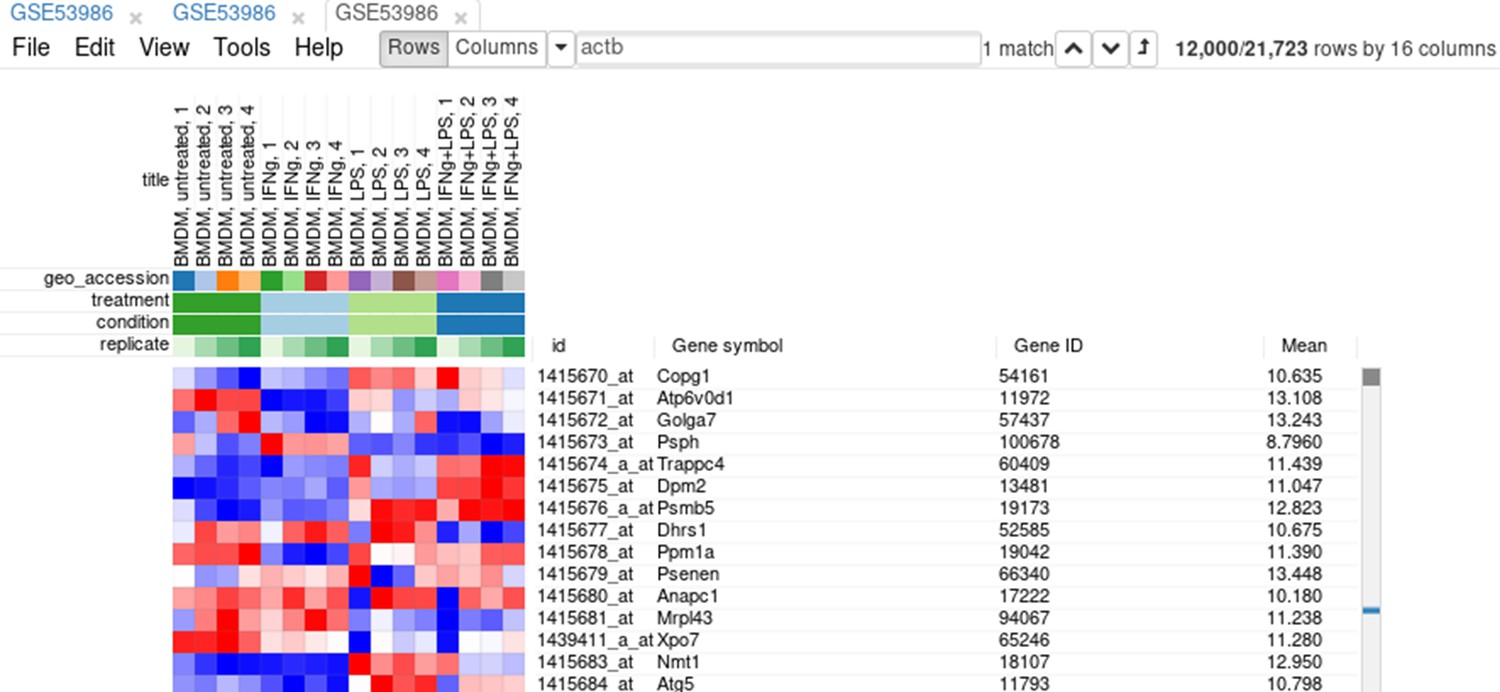
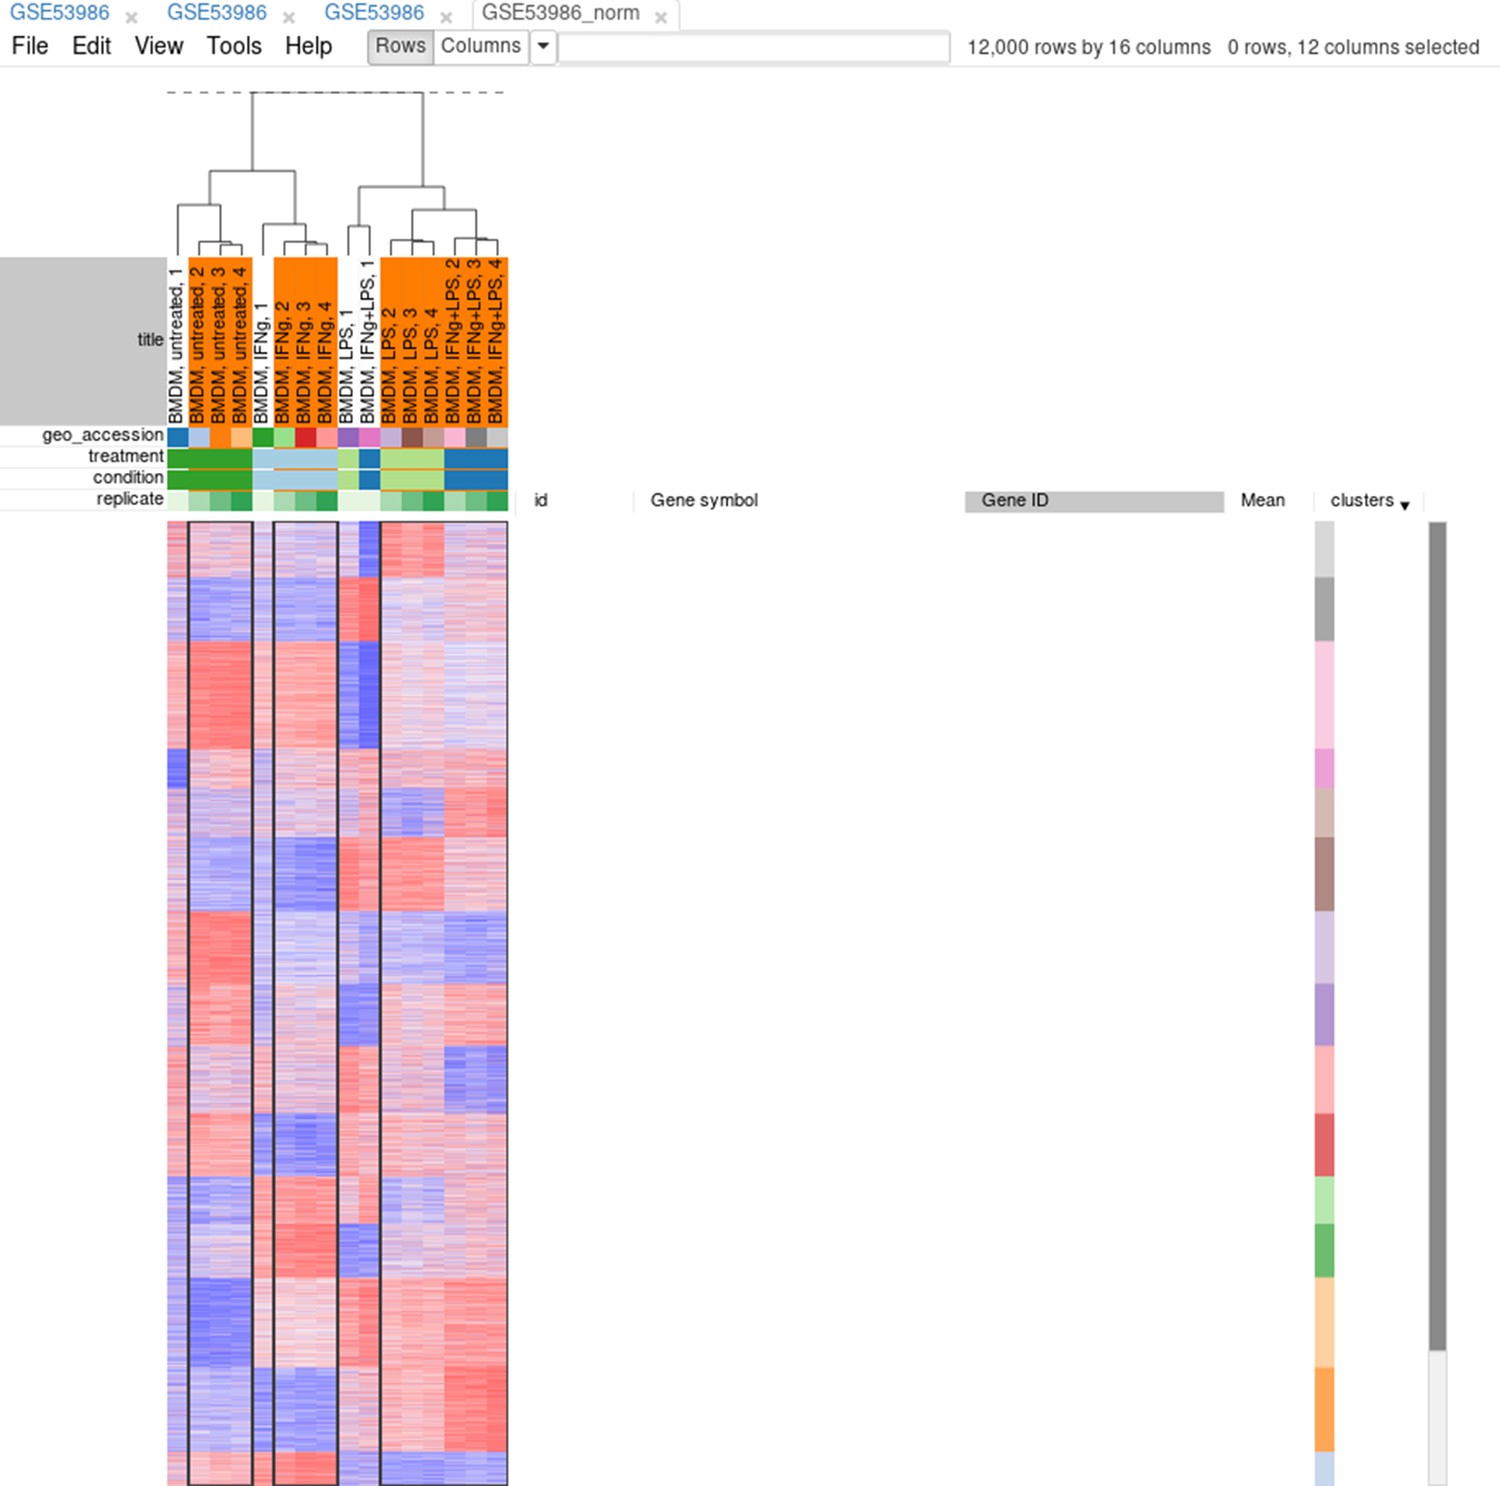
Figure 3
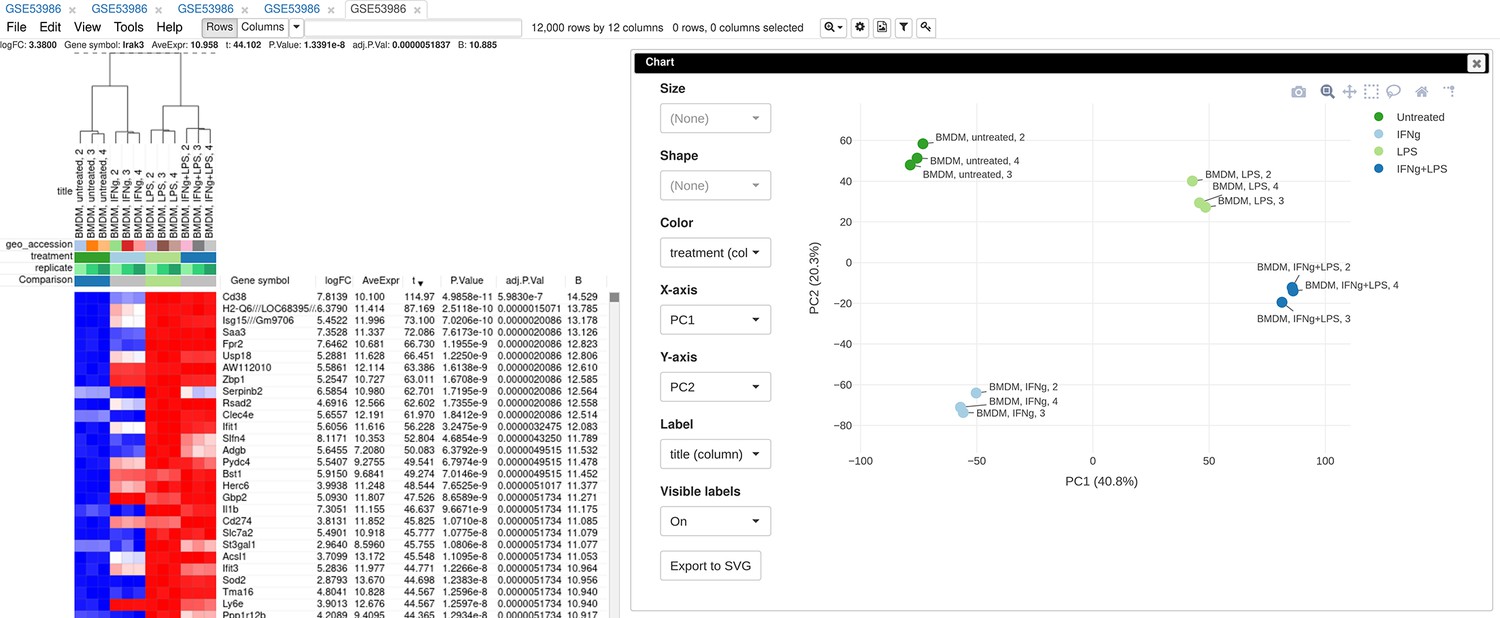
Example of analyzed dataset GSE53986 with normalized gene expression values, filtered outliers, hierarchically clustered columns, and rows annotated with differential expression analysis between untreated and LPS-treated macrophages.
Appendix 2—figure 1
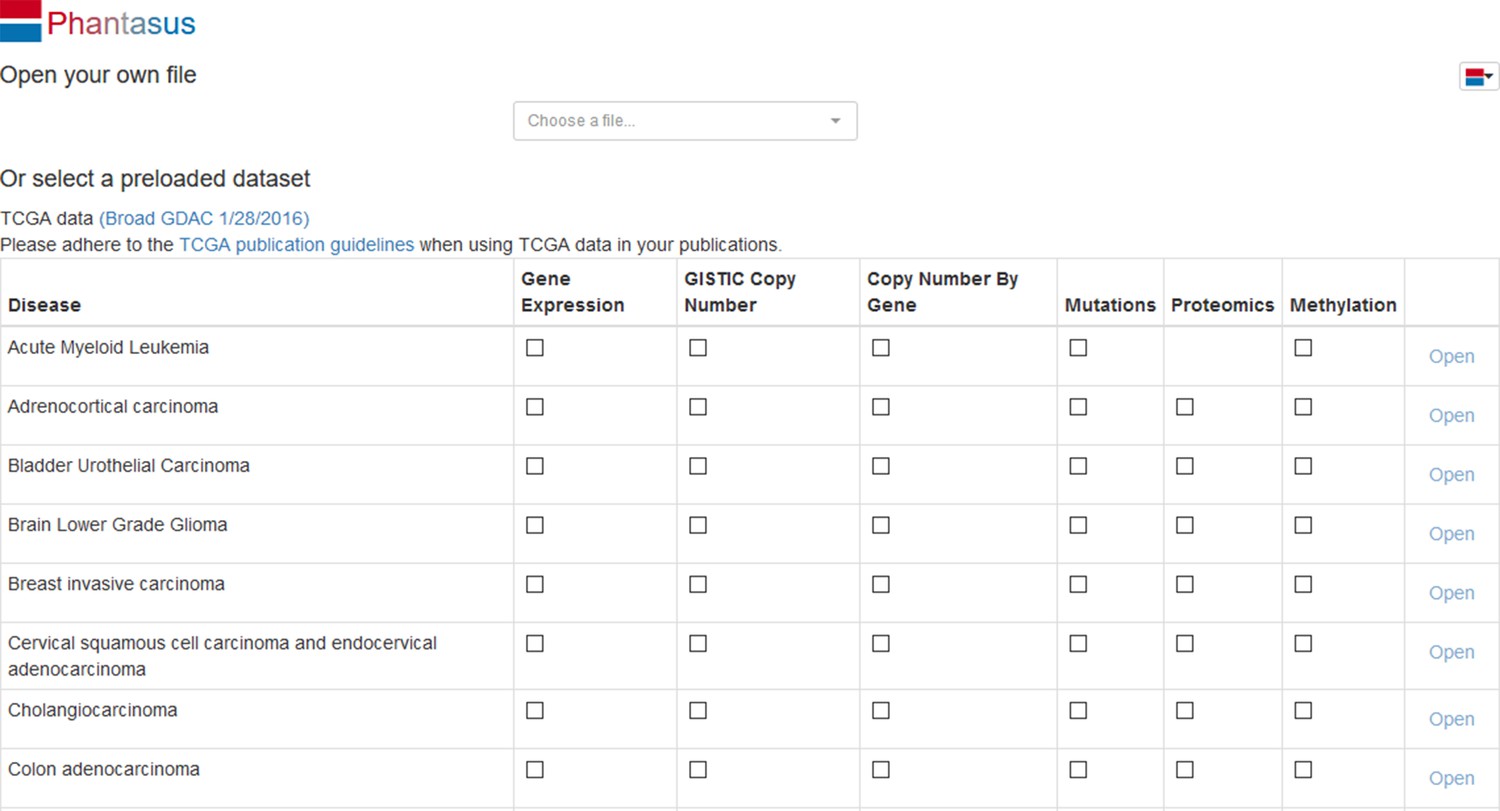
Phantasus starting screen.
Appendix 2—figure 2
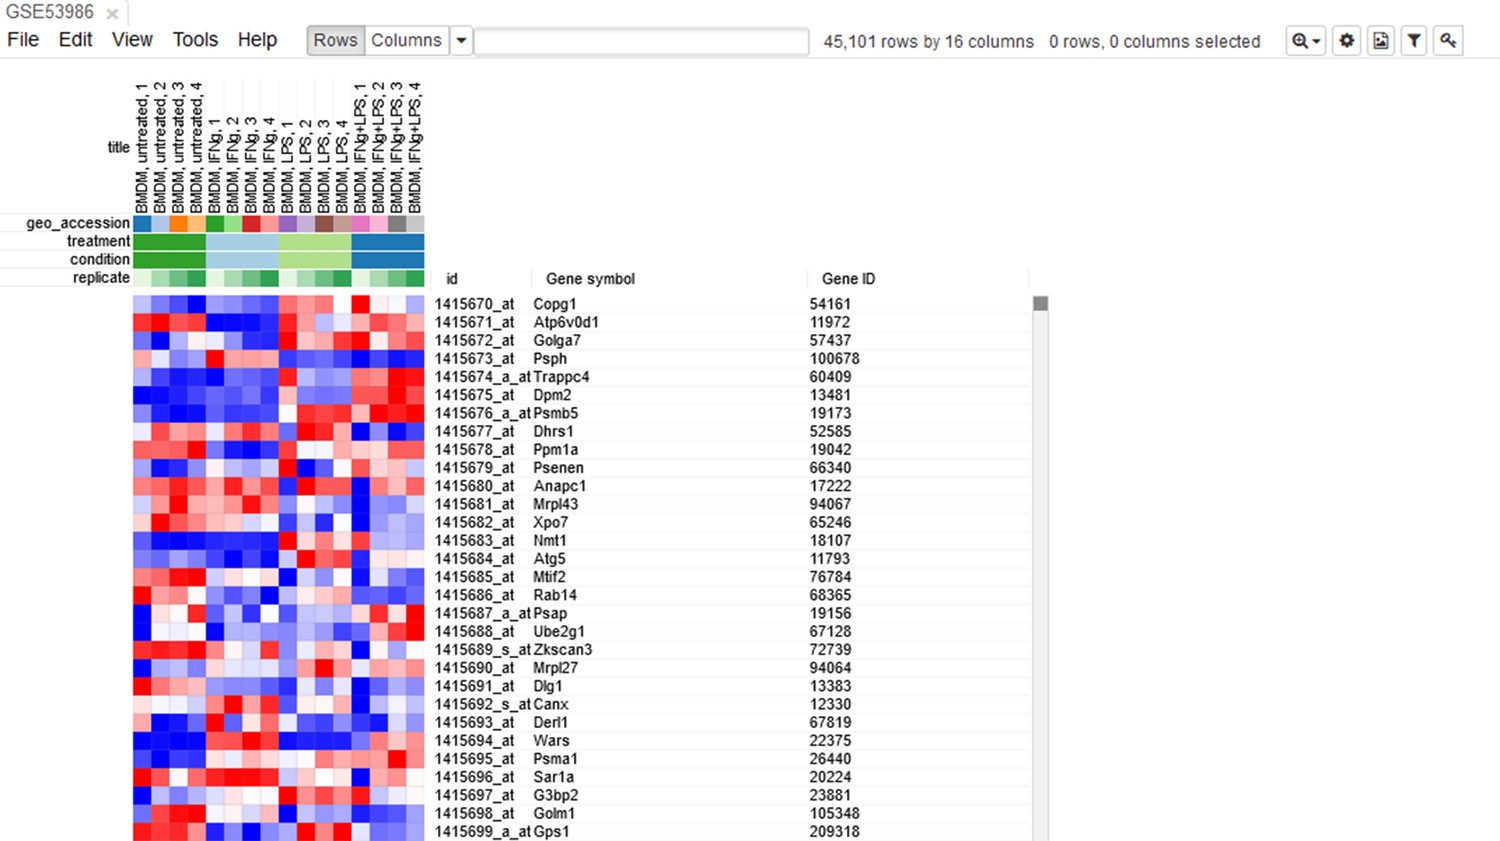
Heatmap of the loaded dataset.
Appendix 2—figure 3
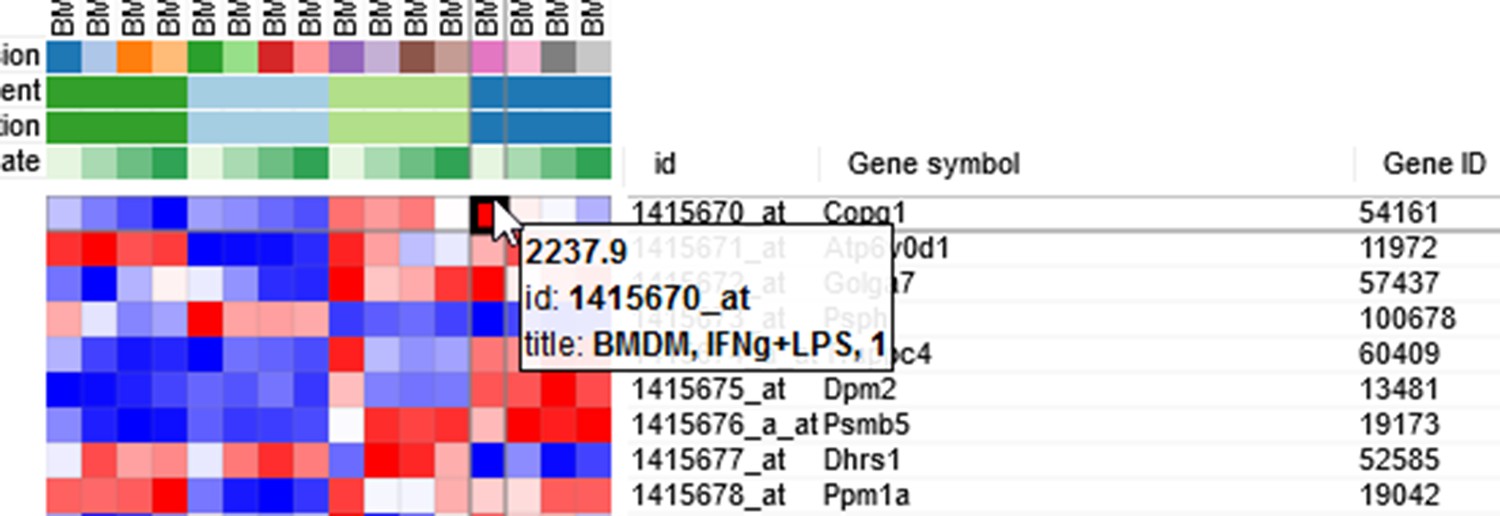
Heatmap cell tooltip.
Appendix 2—figure 4
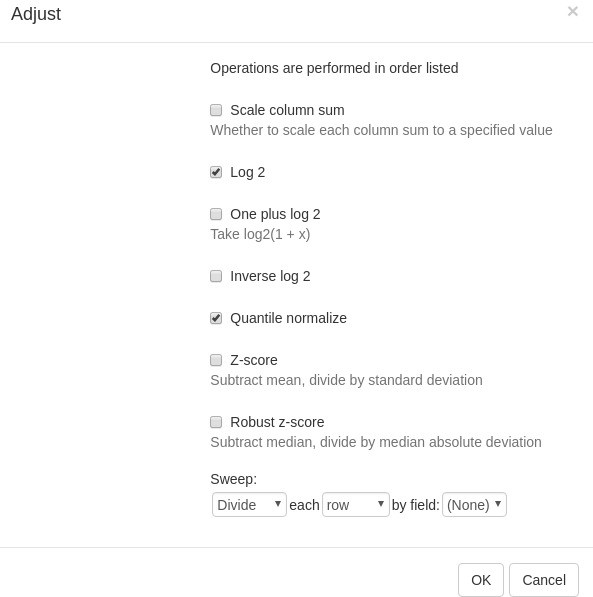
Adjust tool.
Appendix 2—figure 5
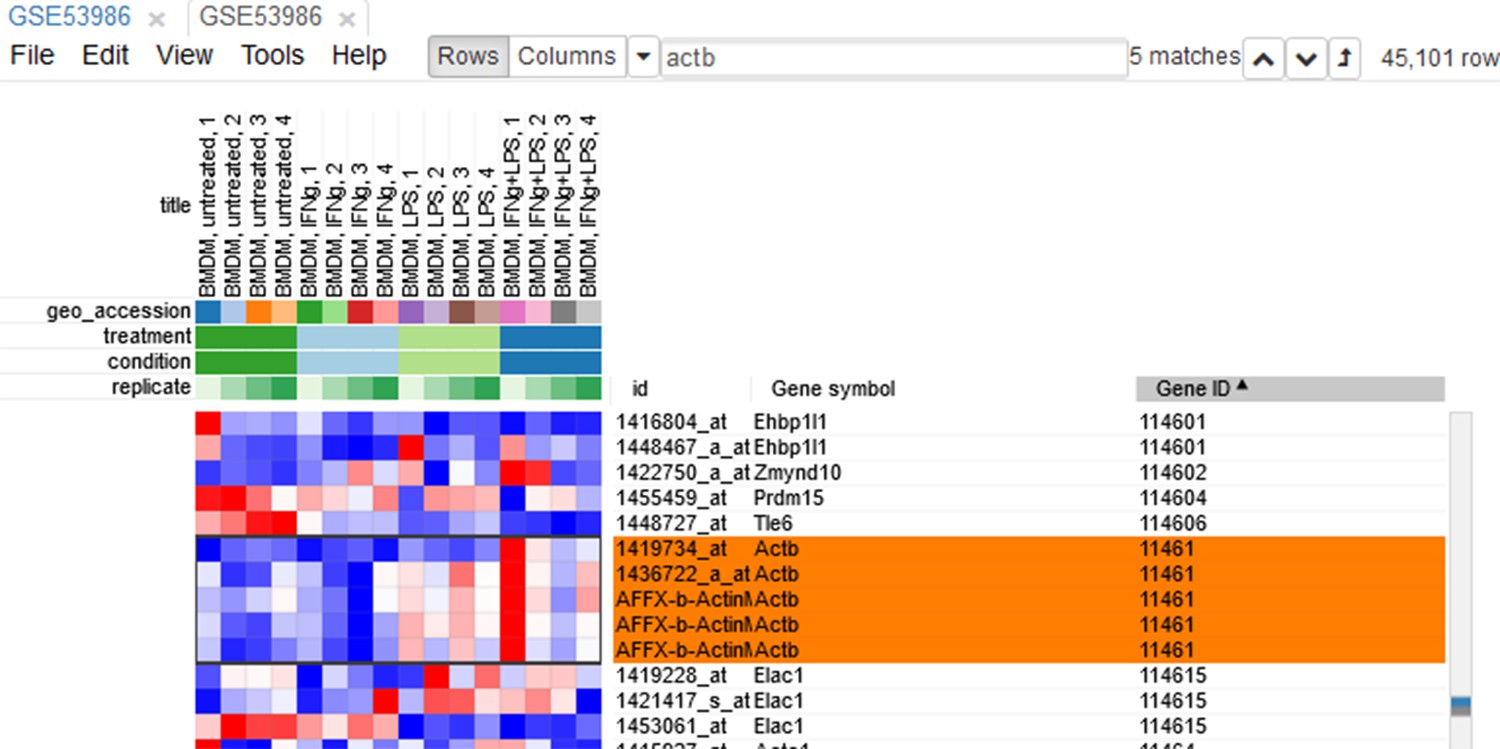
Actb duplicates.
Appendix 2—figure 6
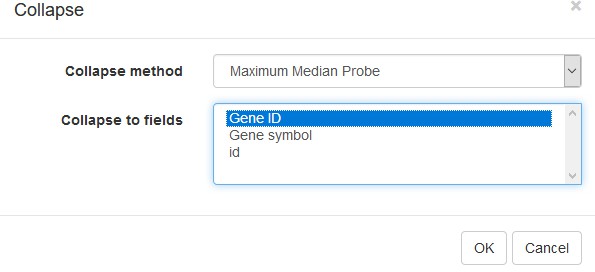
Collapse tool settings.
Appendix 2—figure 7
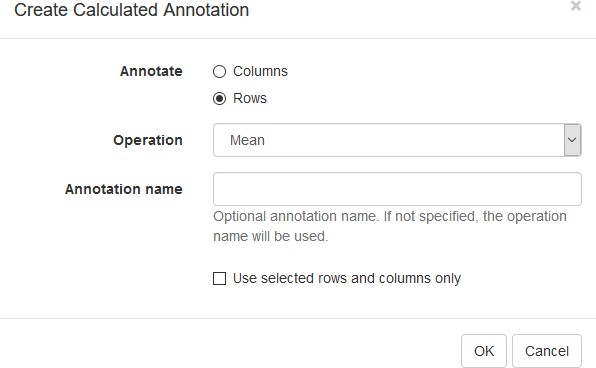
Row mean calculated annotation settings.
Appendix 2—figure 8

Heatmap with loaded row mean annotation.
Appendix 2—figure 9
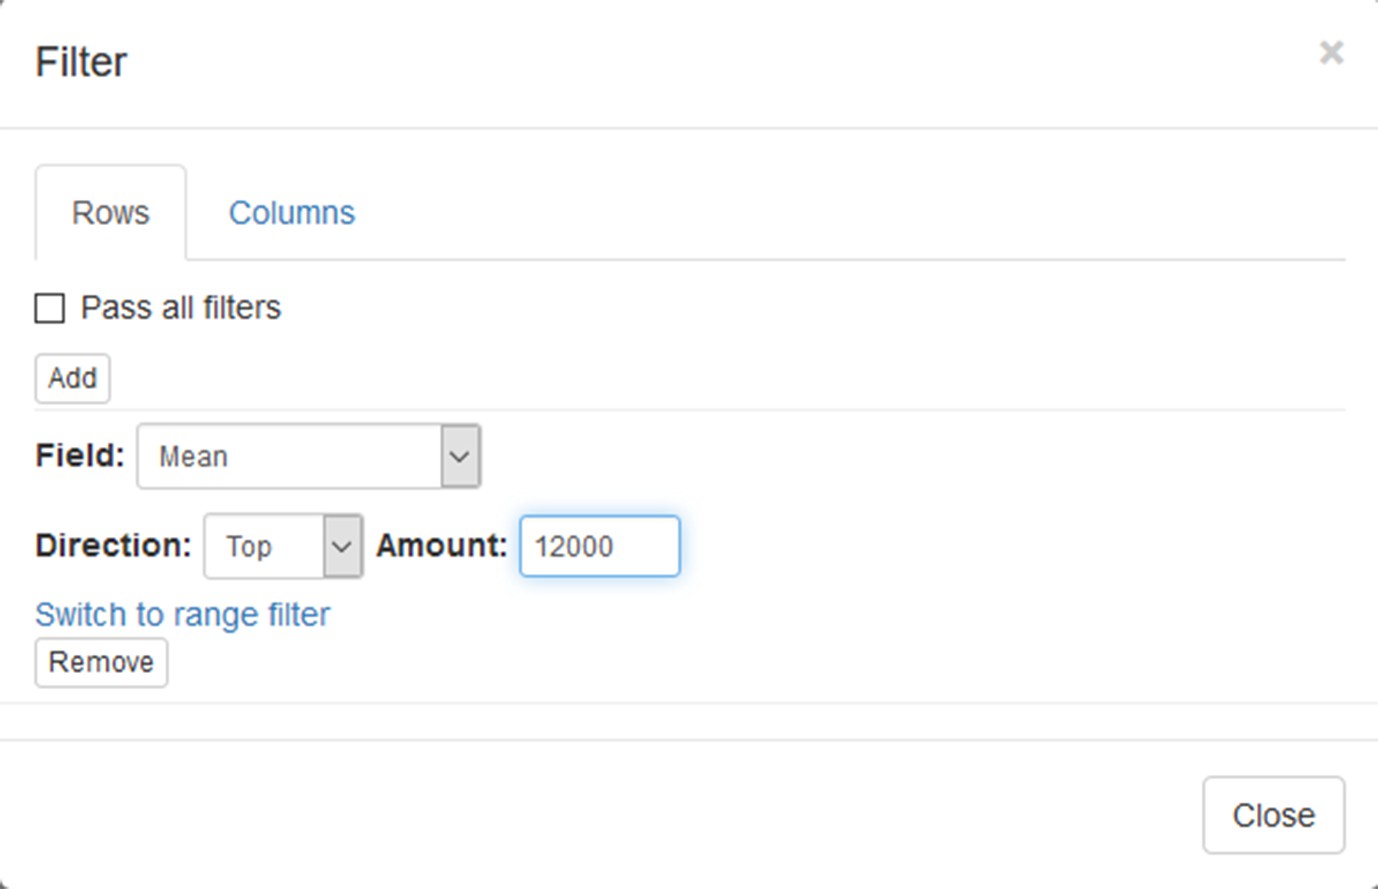
Filter tool settings.
Appendix 2—figure 10
Heatmap with filtered genes.
Appendix 2—figure 11
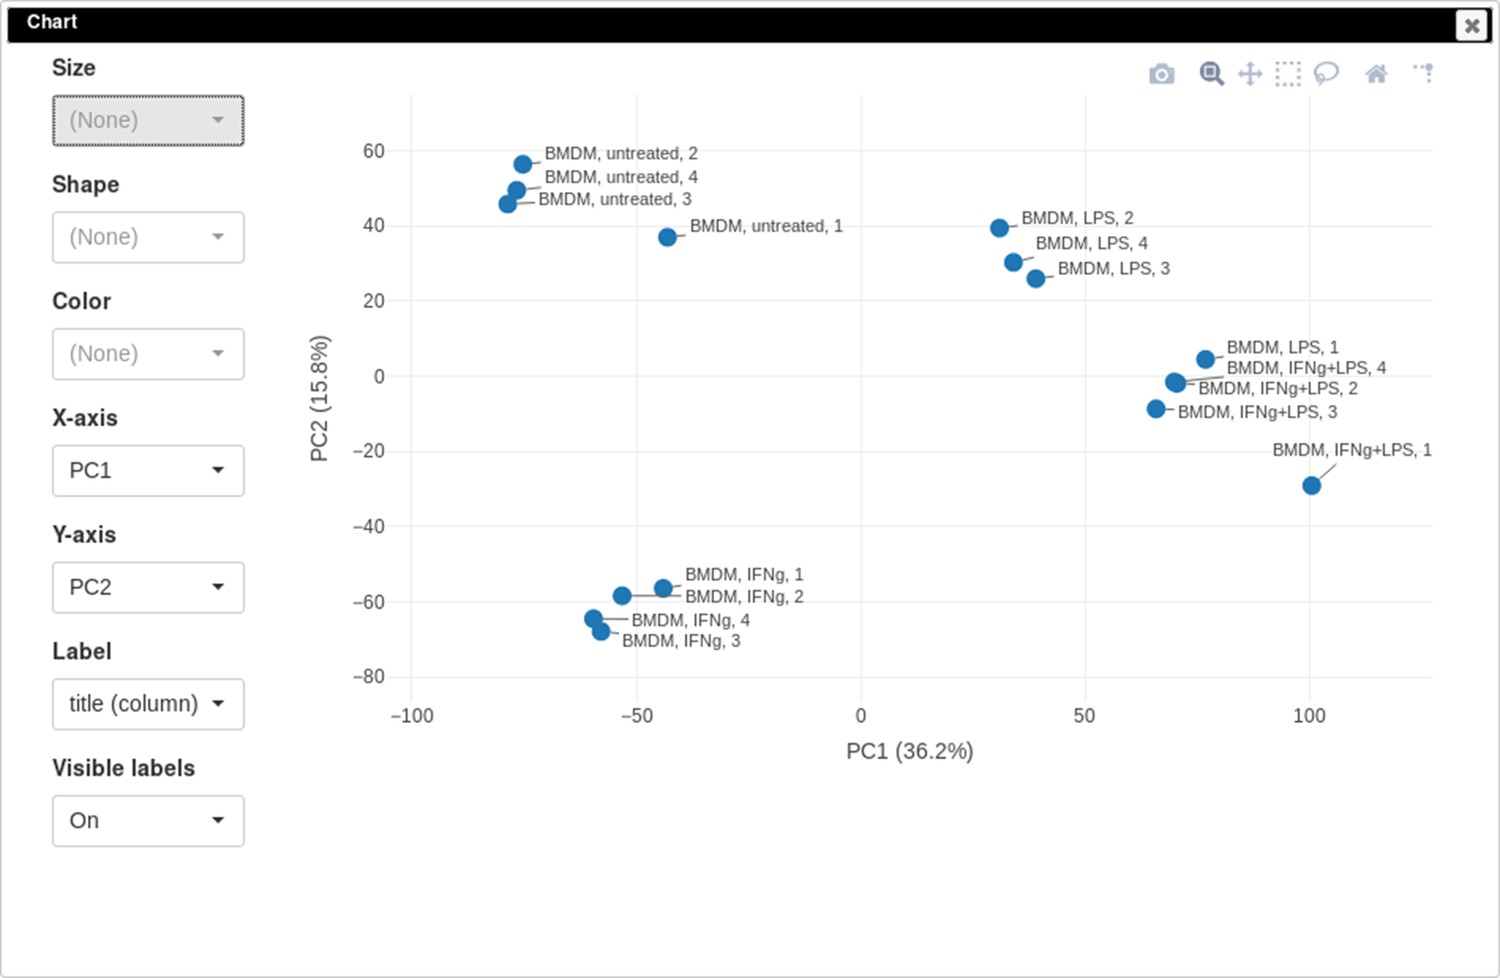
Principal component analysis (PCA) plot for dataset GSE53986.
Appendix 2—figure 12
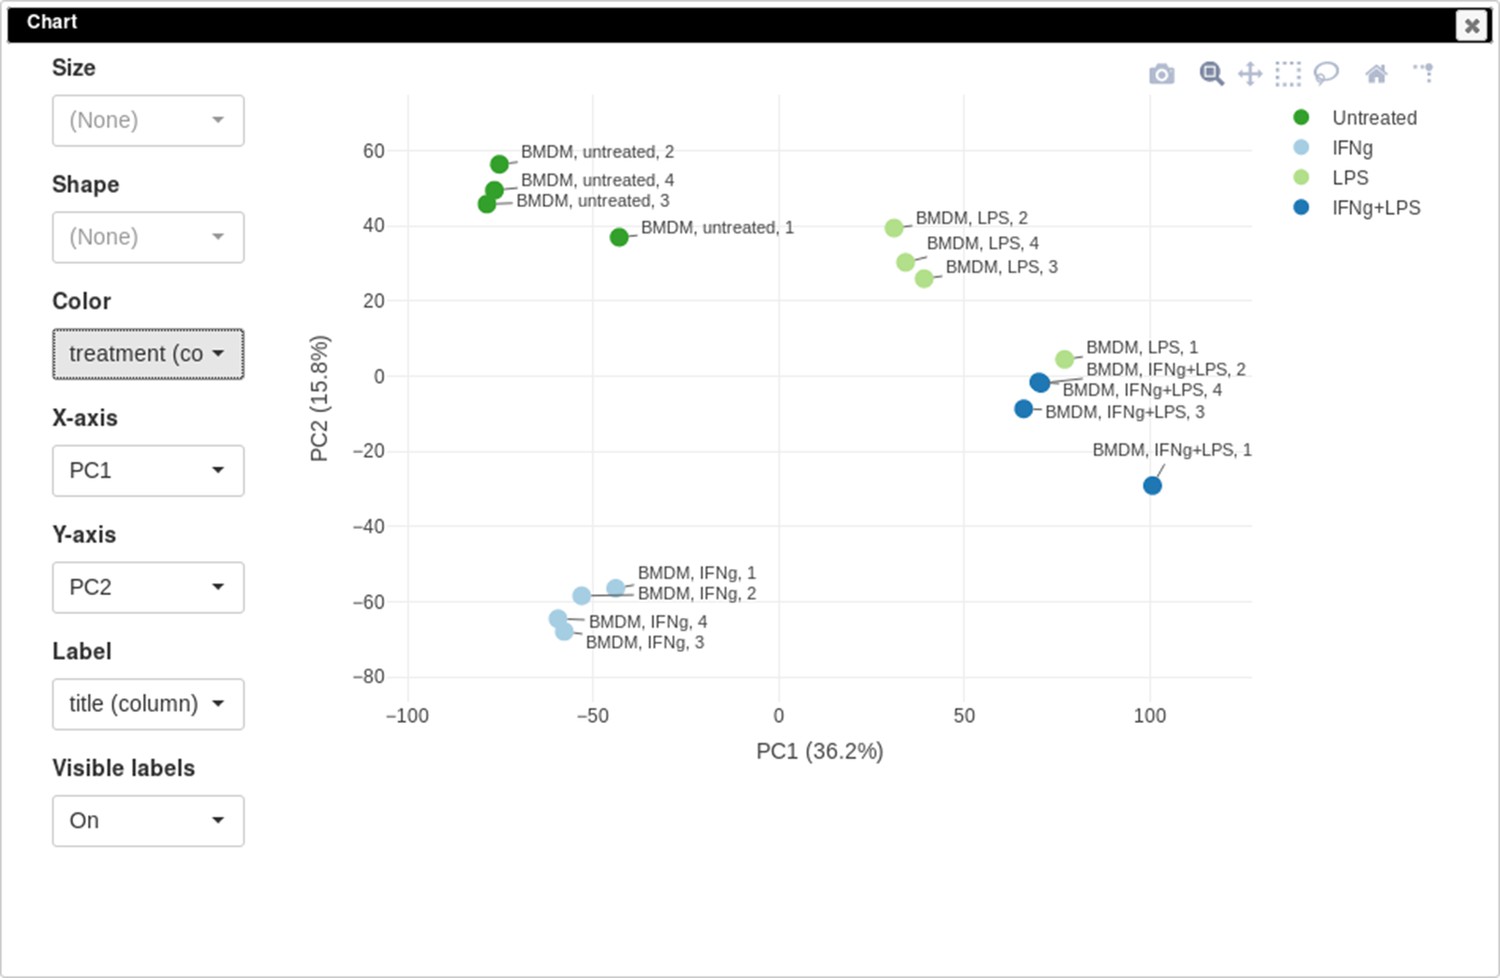
Customized principal component analysis (PCA) plot for the dataset GSE56986.
Appendix 2—figure 13
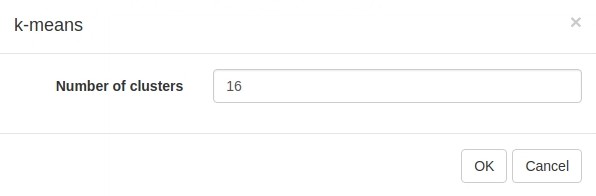
k-means tool settings.
Appendix 2—figure 14
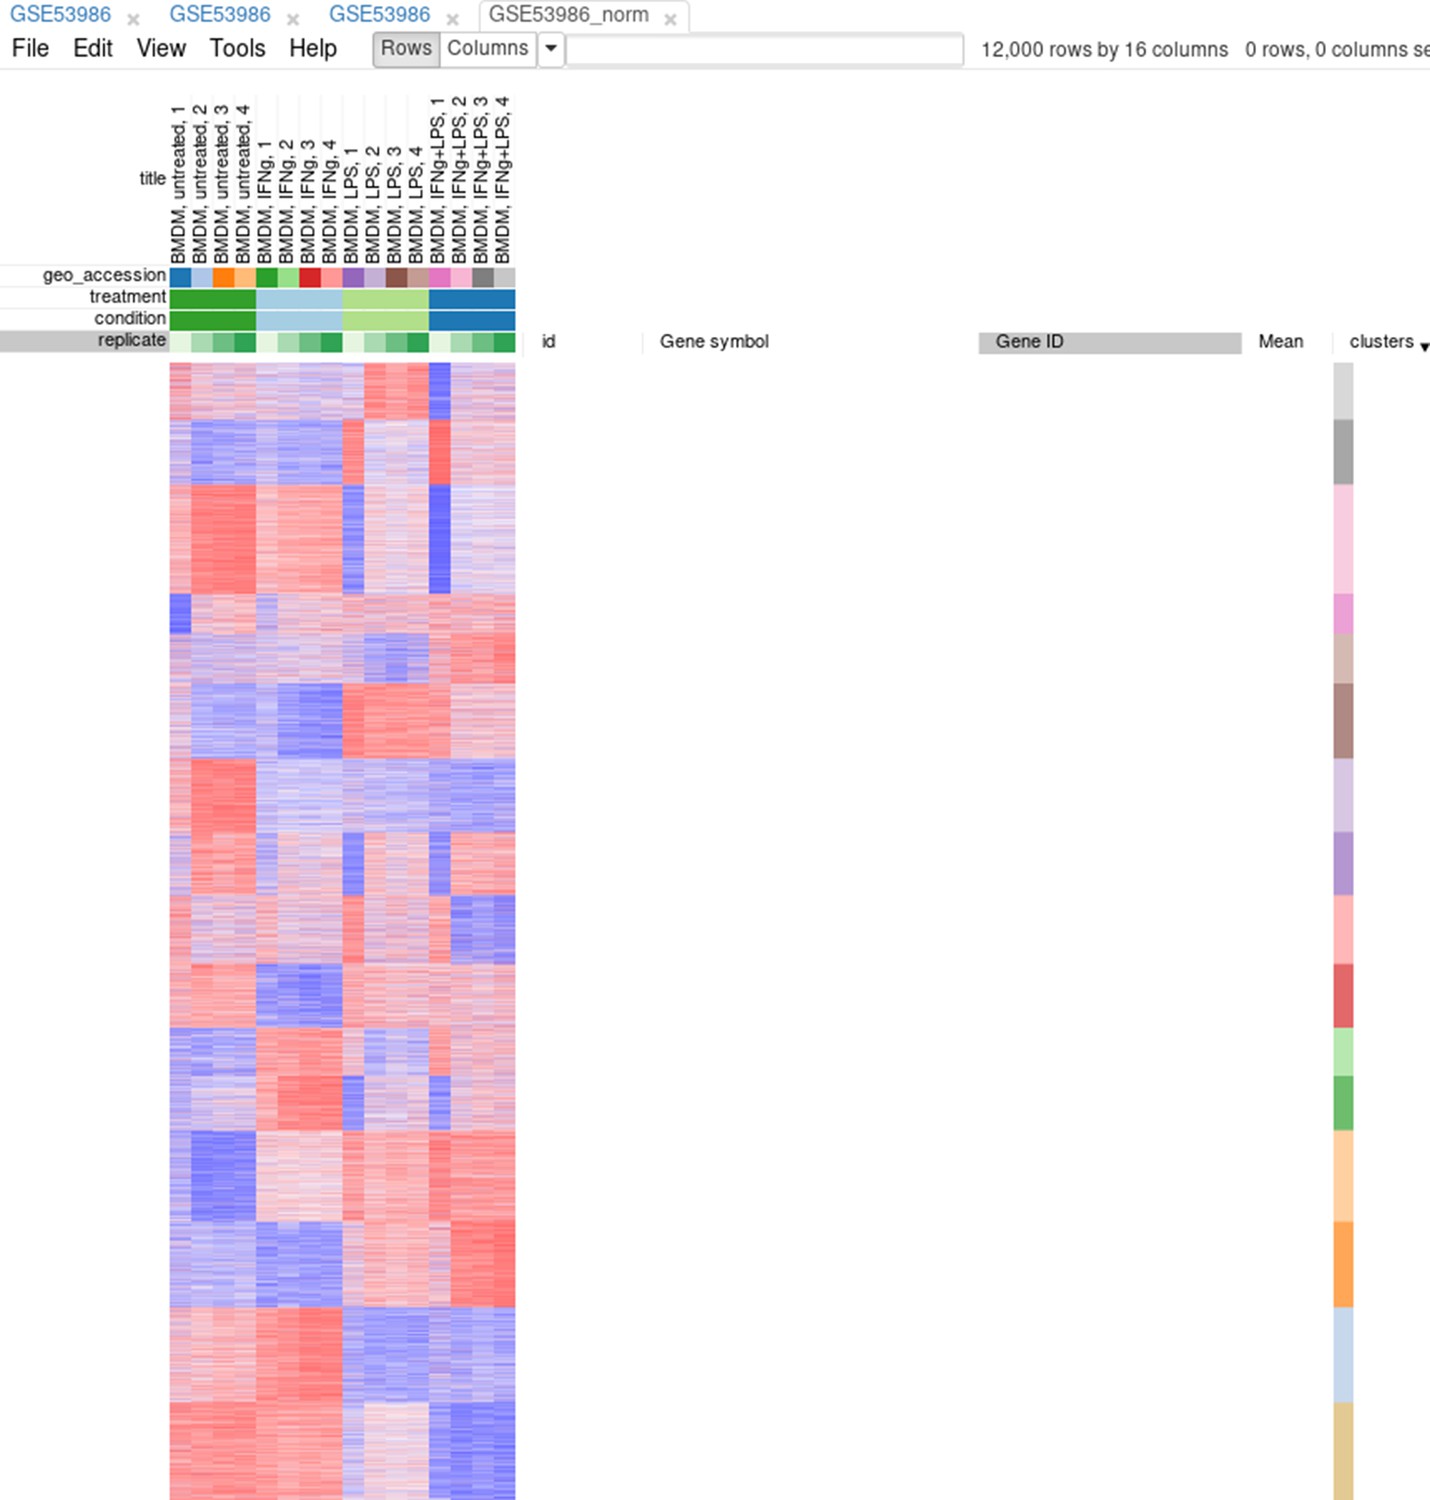
Clusters obtained using the k-means algorithm.
Appendix 2—figure 15
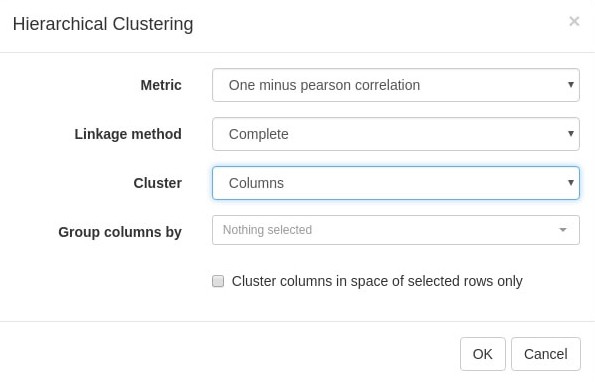
Hierarchical clustering settings.
Appendix 2—figure 16
Good samples selection.
Appendix 2—figure 17
Settings for differential expression analysis by limma package.
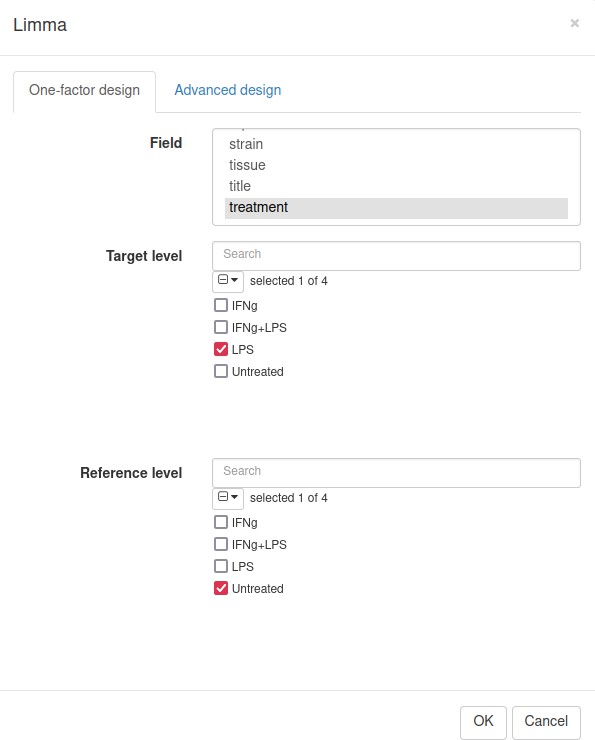
Appendix 2—figure 18
Differential expression analysis results for the dataset GSE53986.
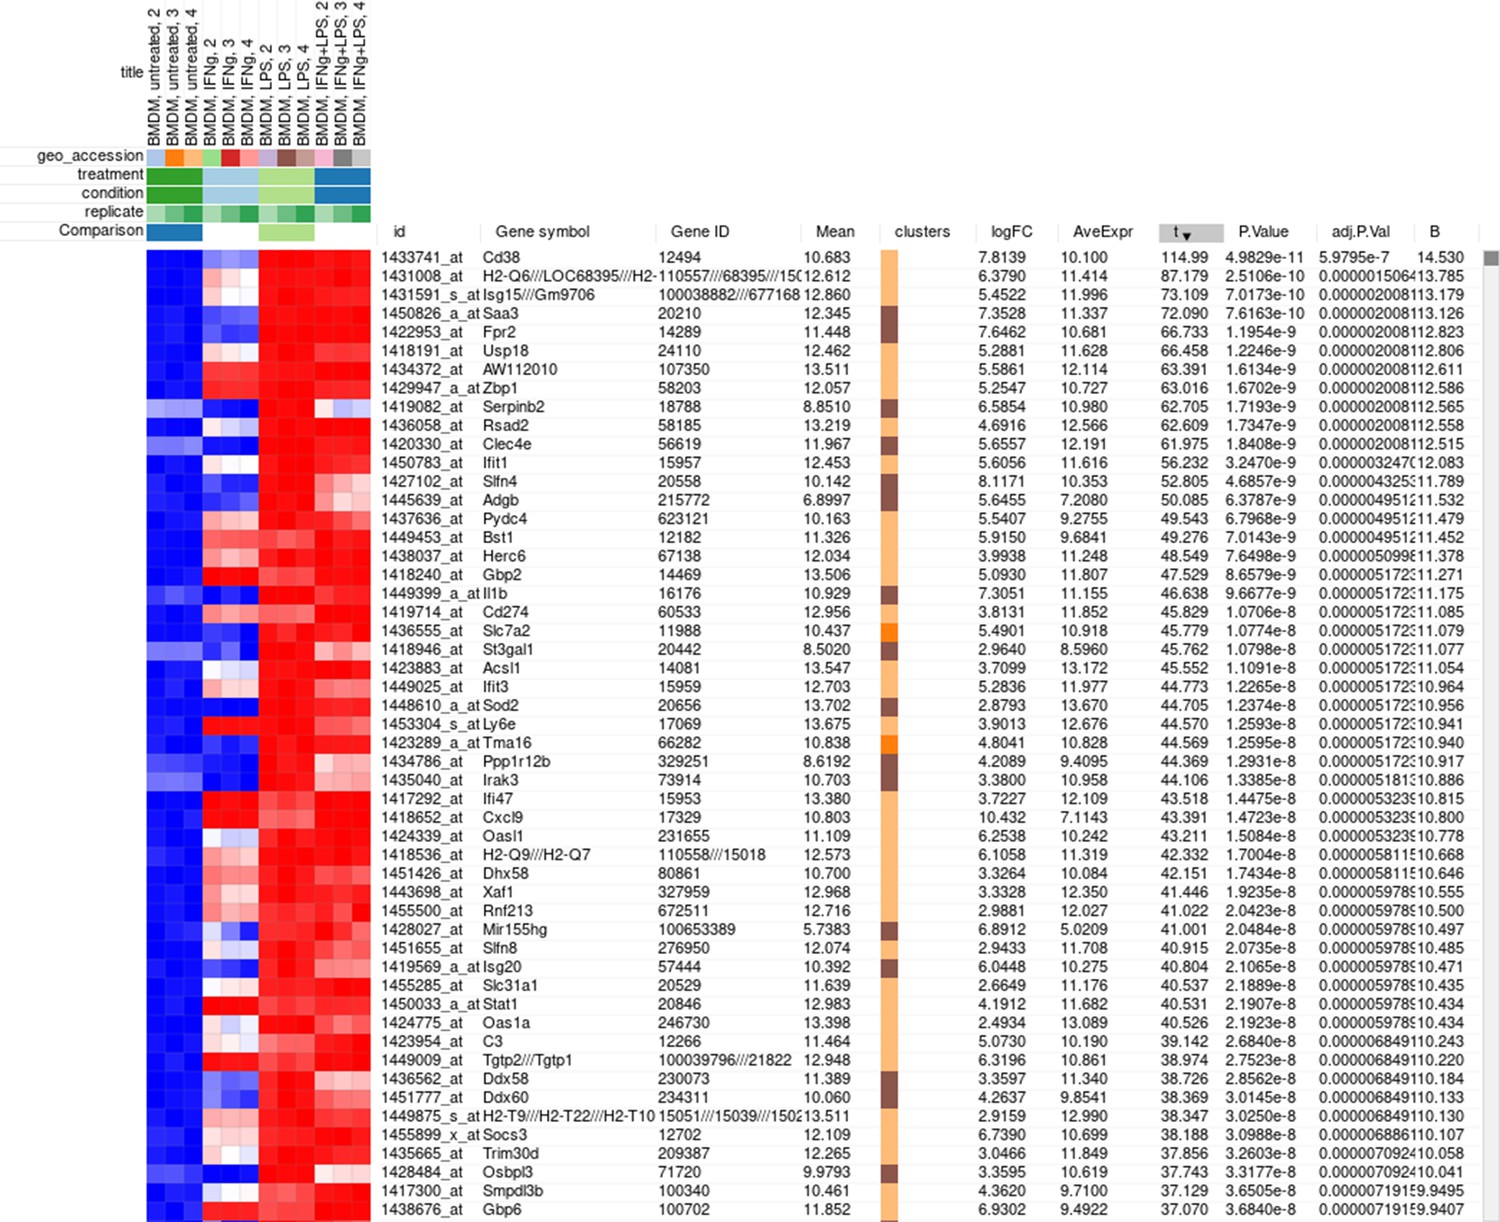
Appendix 2—figure 19
FGSEA settings.
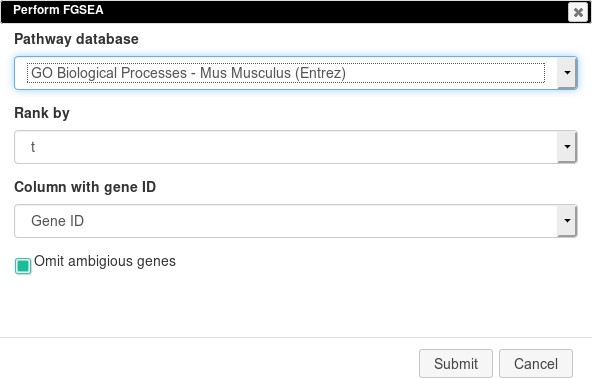
Appendix 2—figure 20
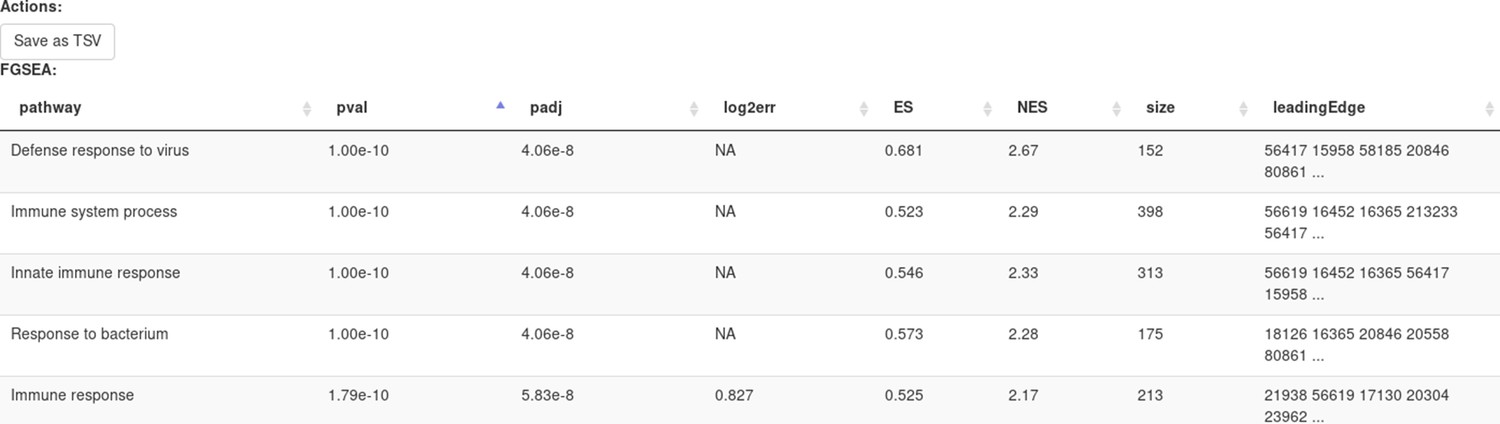
Pathways enriched by the FGSE tool for the dataset GSE54986.
Appendix 3—figure 1
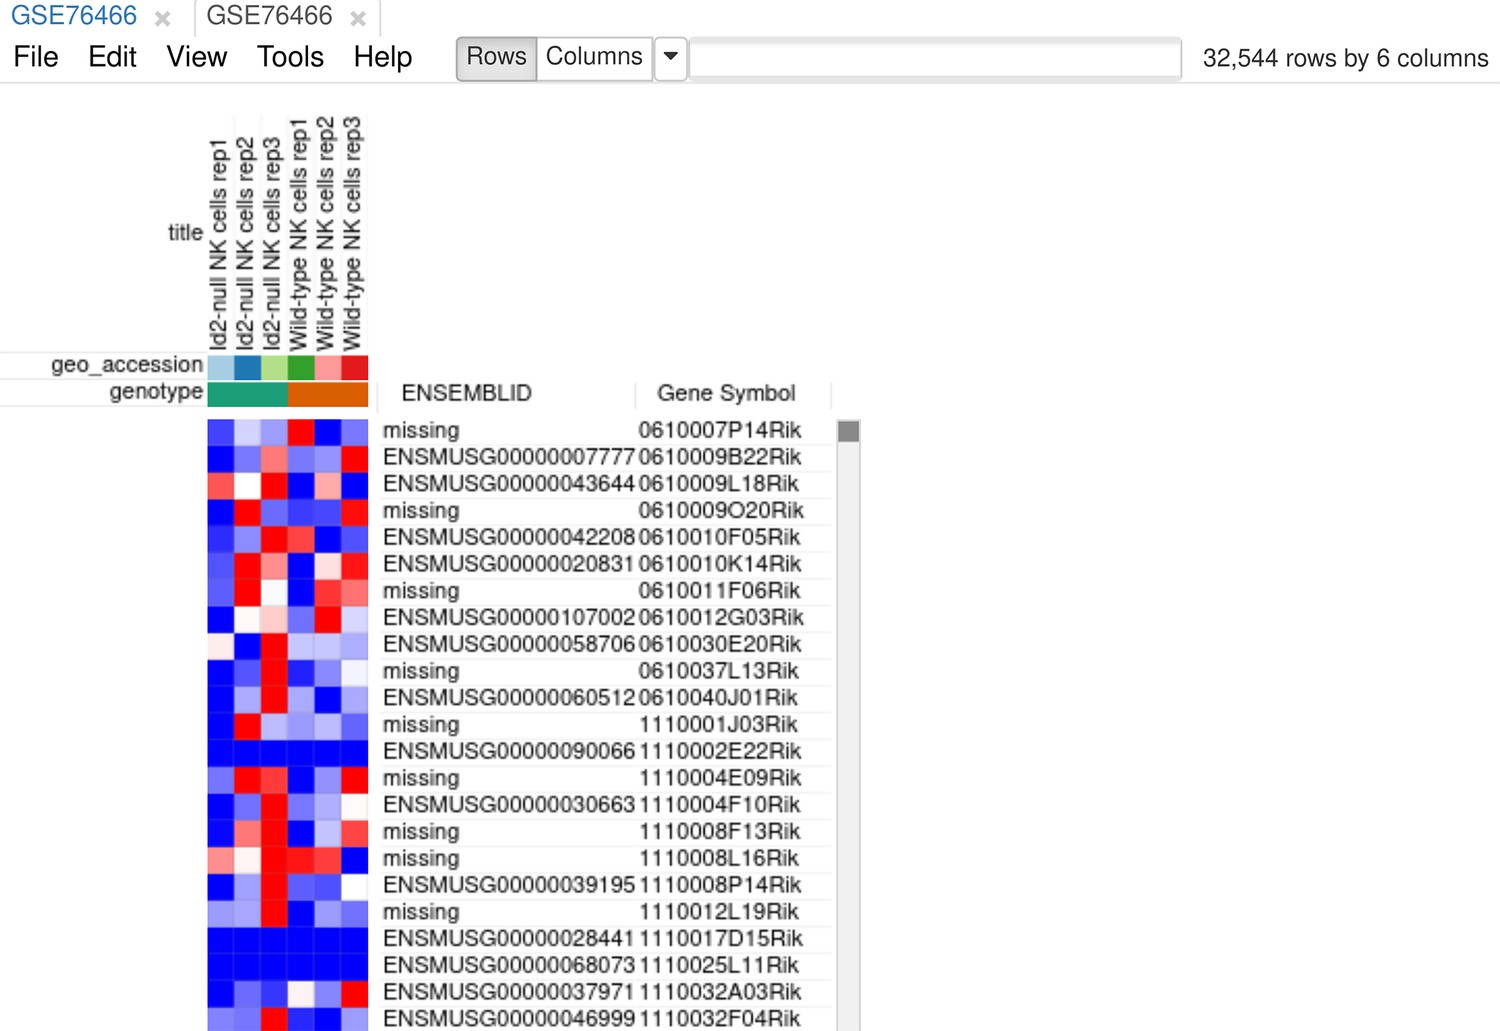
Heatmap for the dataset GSE76466 after samples filtration.
Appendix 3—figure 2

Settings for the Voom tool.
Appendix 3—figure 3
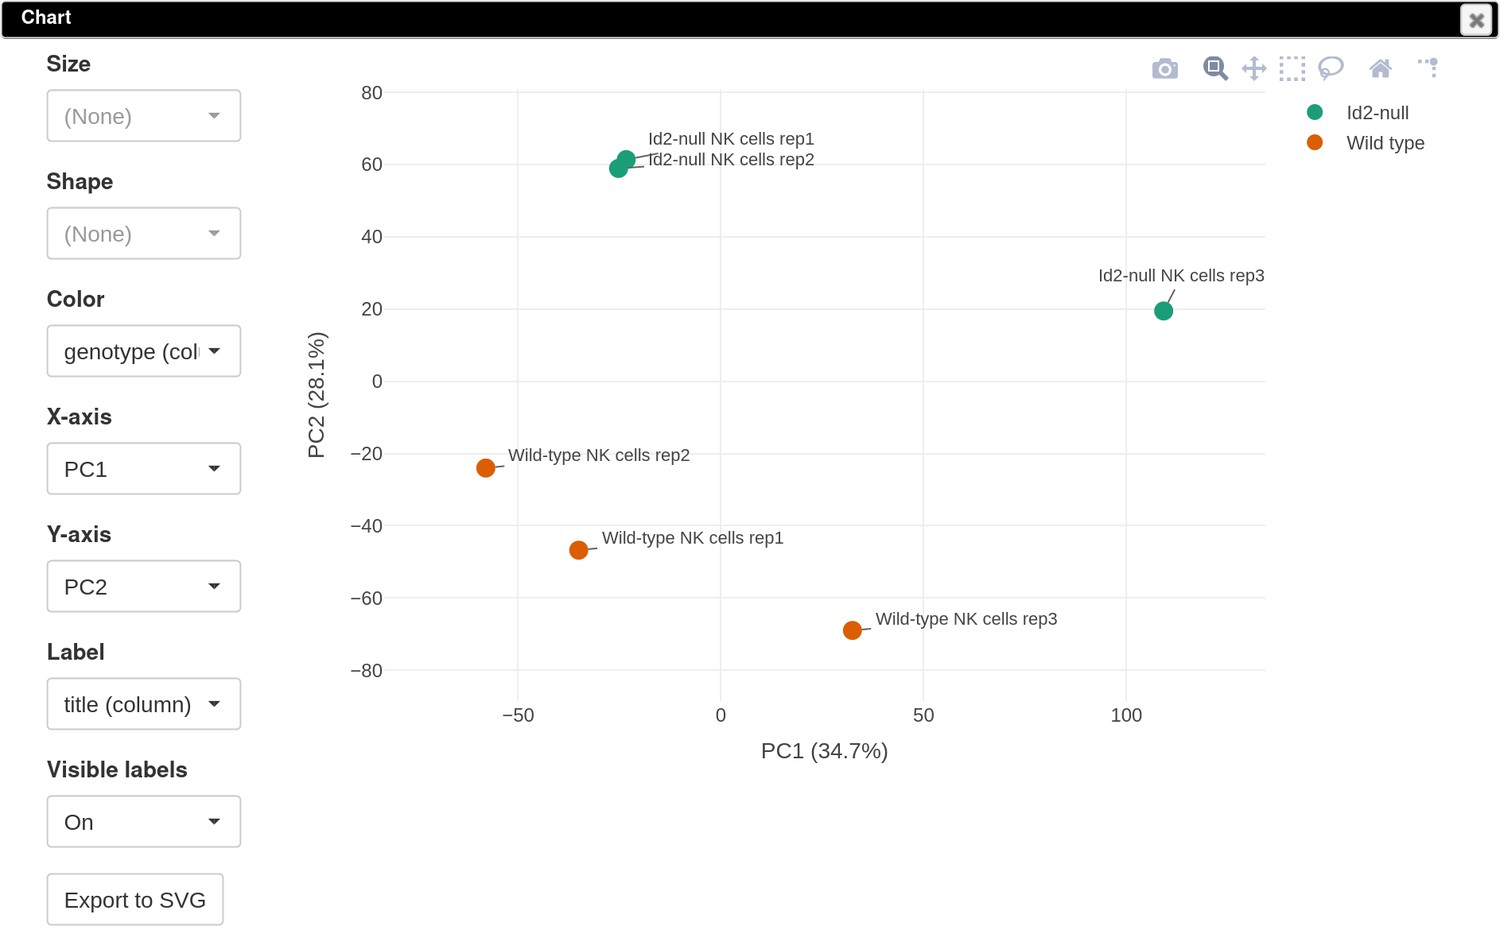
Principal component analysis (PCA) plot for the dataset GSE76466.
Appendix 3—figure 4
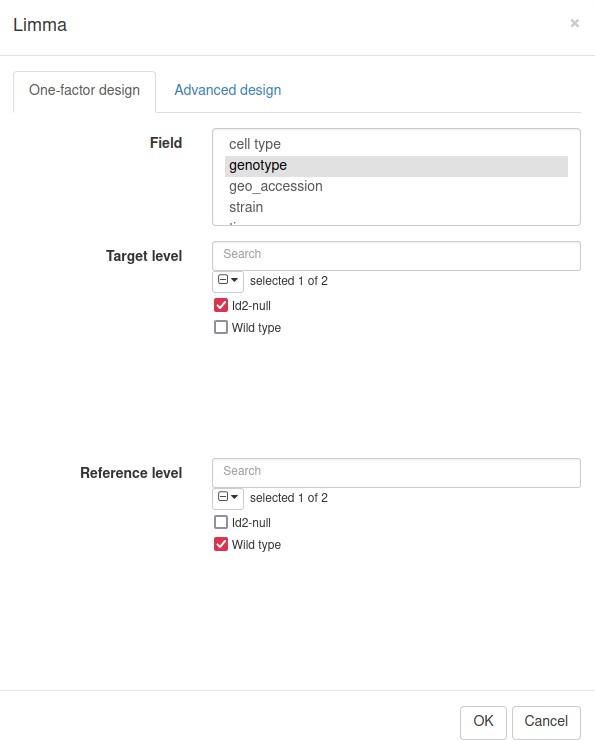
Limma tool settings for the dataset GSE76466.
Appendix 3—figure 5
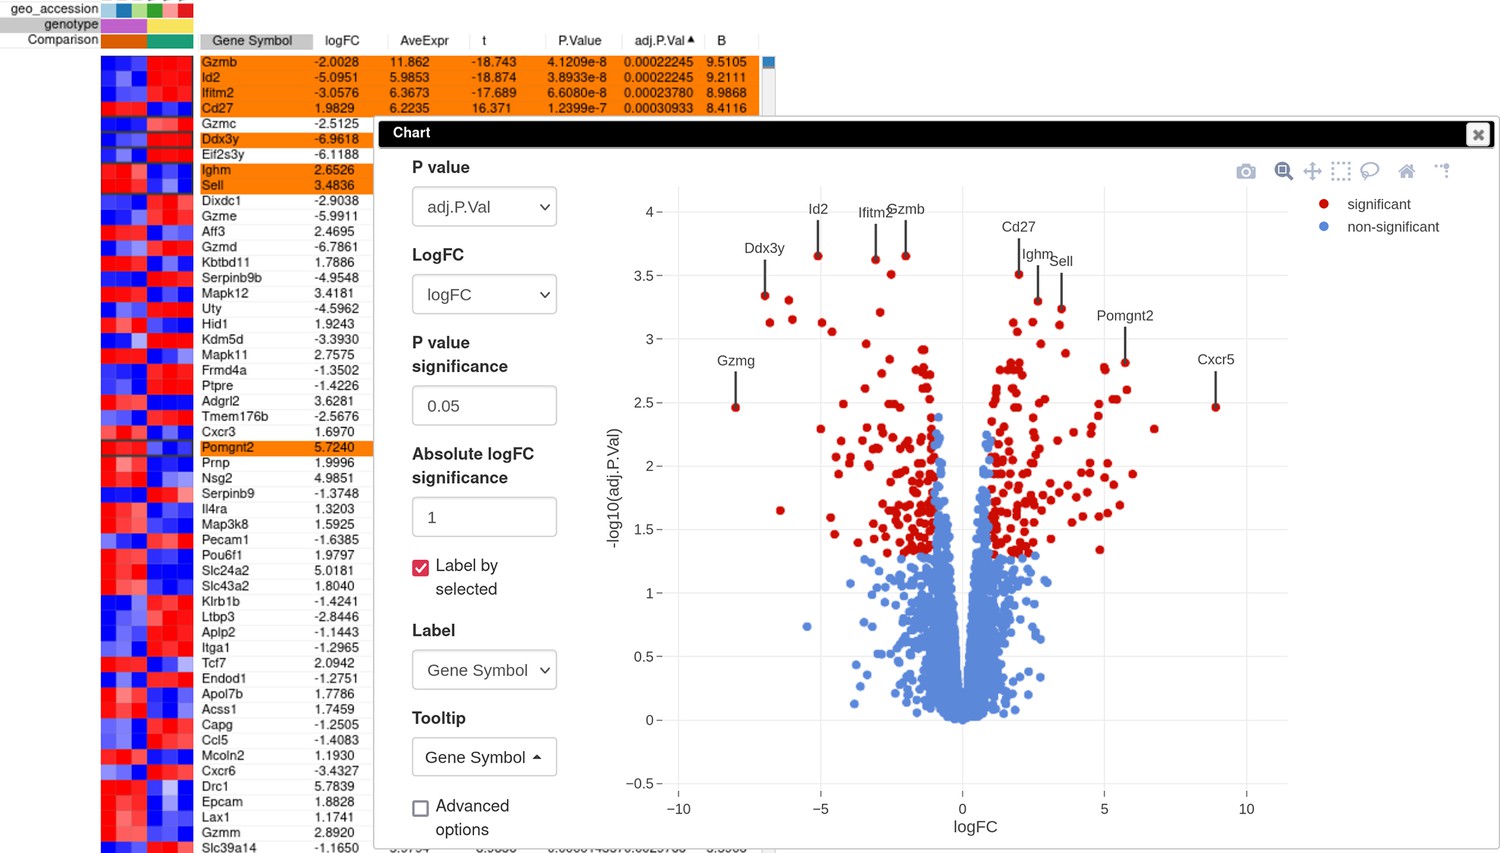
Volcano plot with differential gene expression results between wild-type (WT) and Id2-deficient samples for dataset GSE76466.
Appendix 3—figure 6

Filter tool settings for the Id2-dependent gene signature.
Appendix 3—figure 7

Principal component analysis (PCA) plot for dataset GSE101458.
Appendix 3—figure 8
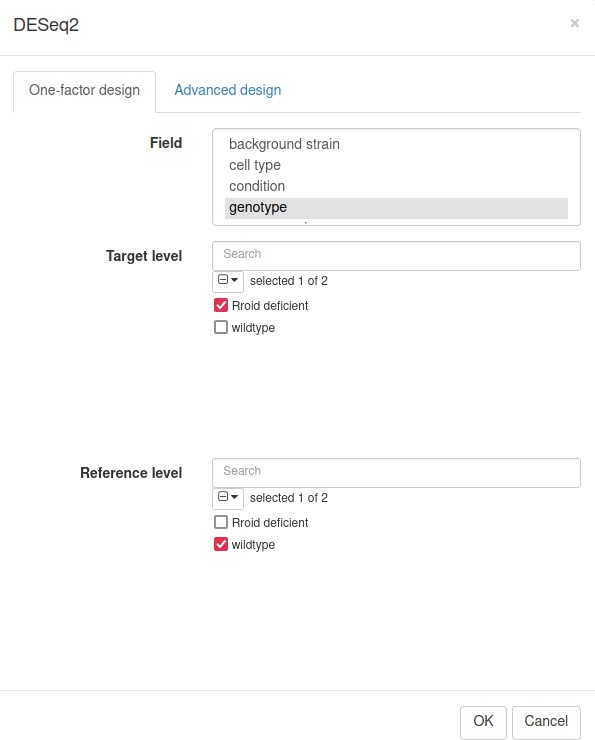
DESeq2 tool settings for the dataset GSE101458.
Appendix 3—figure 9
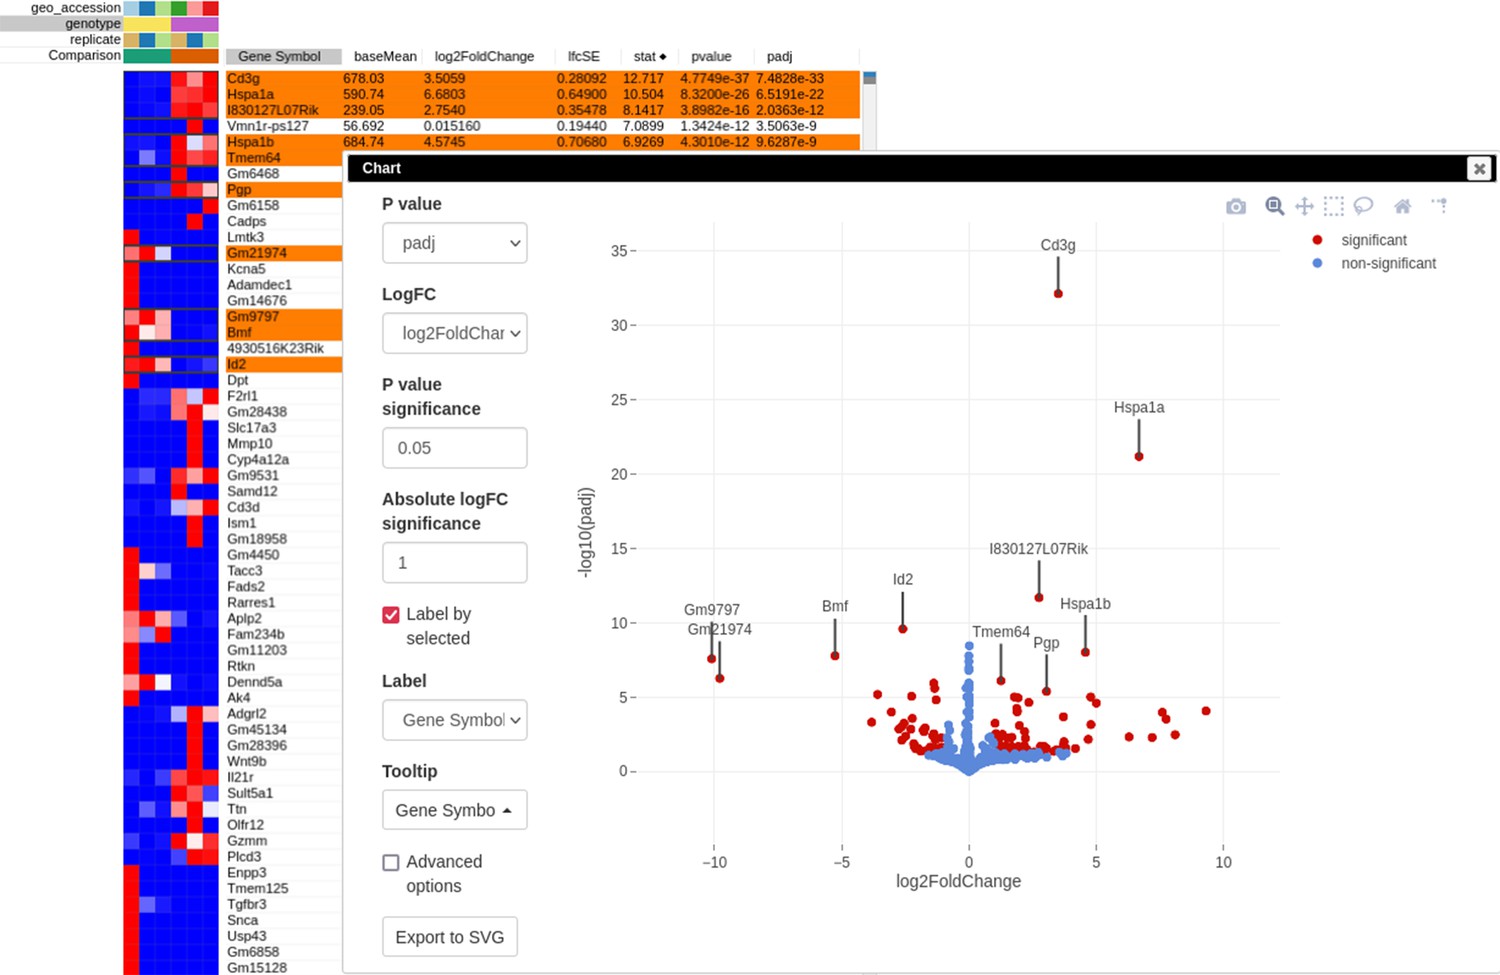
Volcano plot with differential gene expression results between wild-type (WT) and Rroid-deficient samples for dataset GSE101458.
Appendix 3—figure 10
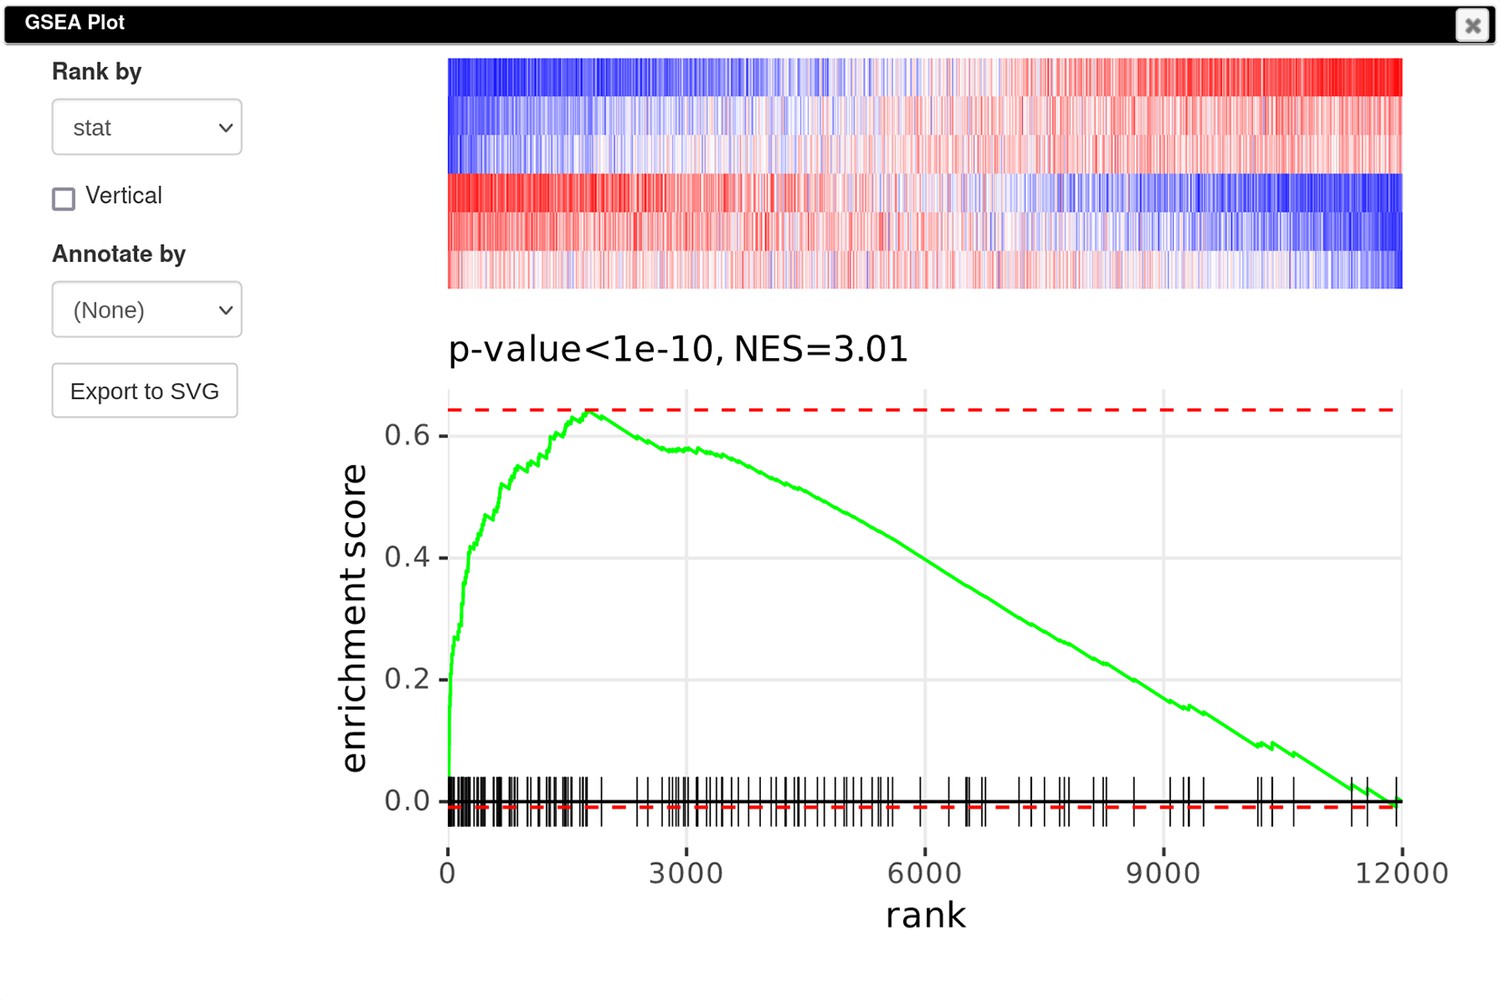
Enrichment plot of the Id2-dependent gene signature in dataset GSE101458.
Tables
Appendix 1—table 1
Gene expression analysis key steps.
| Application | Normalization | Principal component analysis | Clustering | Differential expression | Pathway analysis |
|---|---|---|---|---|---|
| Gene pattern Reich et al., 2006 | + | + | + | + | + |
| GEO2R Barrett et al., 2013 | - | - | - | + | - |
| BicOverlapper2 Santamaría et al., 2014 | - | - | - | + | + |
| Babelomics Alonso et al., 2015 | + | + | + | + | + |
| Morpheus Gould, 2016 | + | - | + | - | - |
| START Nelson et al., 2017 | + | + | - | + | - |
| BioJupies Torre et al., 2018 | + | + | + | + | + |
| iDEP Ge et al., 2018 | + | + | + | + | + |
| Degust Powell, 2019 | - | + | - | + | - |
| GREIN Mahi et al., 2019 | + | + | - | + | - |
| EXPANDER Hait et al., 2019 | + | + | + | + | + |
| RaNa-seq Prieto and Barrios, 2019 | - | + | - | + | + |
| RNAdetector La Ferlita et al., 2021 | - | - | - | + | - |
| GEOexplorer Hunt et al., 2022 | + | + | + | + | + |
| Phantasus | + | + | + | + | + |
Appendix 1—table 2
Gene expression sources.
| Application | User-provided data | GEO microarray | GEO RNA-seq |
|---|---|---|---|
| Gene pattern Reich et al., 2006 | + | + | - |
| GEO2R Barrett et al., 2013 | - | + | - |
| BicOverlapper2 Santamaría et al., 2014 | + | + | - |
| Babelomics Alonso et al., 2015 | + | - | - |
| Morpheus Gould, 2016 | + | - | - |
| START Nelson et al., 2017 | + | - | - |
| BioJupies Torre et al., 2018 | + | - | +/- * |
| iDEP Ge et al., 2018 | + | - | +/-* |
| Degust Powell, 2019 | + | - | - |
| EXPANDER Hait et al., 2019 | + | - | - |
| GREIN Mahi et al., 2019 | - | - | + |
| RaNa-seq Prieto and Barrios, 2019 | + | - | + |
| RNAdetector La Ferlita et al., 2021 | + | - | - |
| GEOexplorer Hunt et al., 2022 | - | + | - |
| Phantasus | + | + | +/-* |
-
*
As processed in ARCHs4 and/or Dee2 projects.
Appendix 1—table 3
User experience features.
| Application | Architecture | Saved sessions | Interactive heatmap | Interactive plots | Editing sample annotations | Editing gene annotations |
|---|---|---|---|---|---|---|
| Gene pattern Reich et al., 2006 | Web non-Shiny | + | - | - | - | - |
| GEO2R Barrett et al., 2013 | Web non-Shiny | - | - | - | - | - |
| BicOverlapper2 Santamaría et al., 2014 | Local installation | - | +/-* | - | - | - |
| Babelomics Alonso et al., 2015 | Web non-Shiny | - | - | + | + | + |
| Morpheus Gould, 2016 | Web non-Shiny | +/- | + | + | + | - |
| START Nelson et al., 2017 | Web Shiny | - | +/-* | + | - | - |
| BioJupies Torre et al., 2018 | Web non-Shiny | + | +/-* | + | - | - |
| iDEP Ge et al., 2018 | Web Shiny | - | +/-* | + | - | + |
| Degust Powell, 2019 | Web non-Shiny | - | + | + | - | - |
| GREIN Mahi et al., 2019 | Web Shiny | - | + | + | - | - |
| EXPANDER Hait et al., 2019 | Local installation | - | + | + | + | - |
| RaNa-seq Prieto and Barrios, 2019 | Web non-Shiny | + | +/-* | + | - | - |
| RNAdetector La Ferlita et al., 2021 | Local installation | - | - | - | + | - |
| GEOexplorer Hunt et al., 2022 | Web Shiny | - | + | + | - | - |
| Phantasus | Web non-Shiny | + | + | + | + | + |
-
*
Limited number of genes.
Additional files
Download links
A two-part list of links to download the article, or parts of the article, in various formats.
Downloads (link to download the article as PDF)
Open citations (links to open the citations from this article in various online reference manager services)
Cite this article (links to download the citations from this article in formats compatible with various reference manager tools)
Phantasus, a web application for visual and interactive gene expression analysis
eLife 13:e85722.
https://doi.org/10.7554/eLife.85722


