Building resilient cervical cancer prevention through gender-neutral HPV vaccination
- International Agency for Research on Cancer (IARC/WHO), Early Detection, Prevention and Infections Branch, France
- Karkinos Healthcare, India
Figures
Figure 1
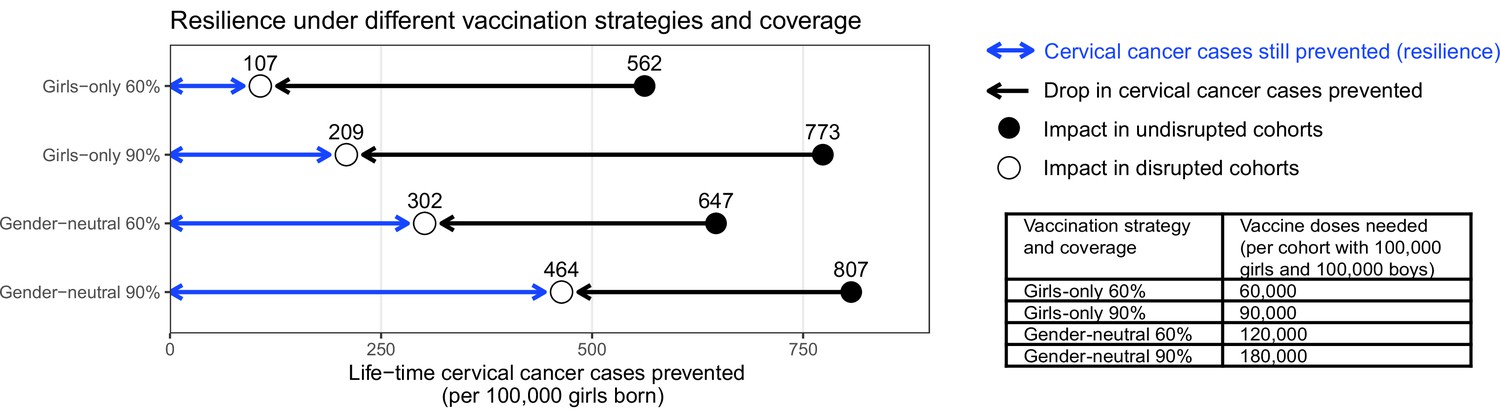
Resilience against HPV vaccination disruption in the base case.
Predicted resilience, defined as life-time number of cervical cancer cases still prevented in the birth cohorts with disruption of vaccination per 100,000 girls born (blue arrow), and drop in cervical cancers prevented as compared to impact in the cohorts vaccinated prior to the disruption (black arrow), under the four highlighted scenarios. Disruption was simulated according to the base case with a period of disruption of 5 years and 0% coverage in girls and boys during the disruption period.
Figure 2
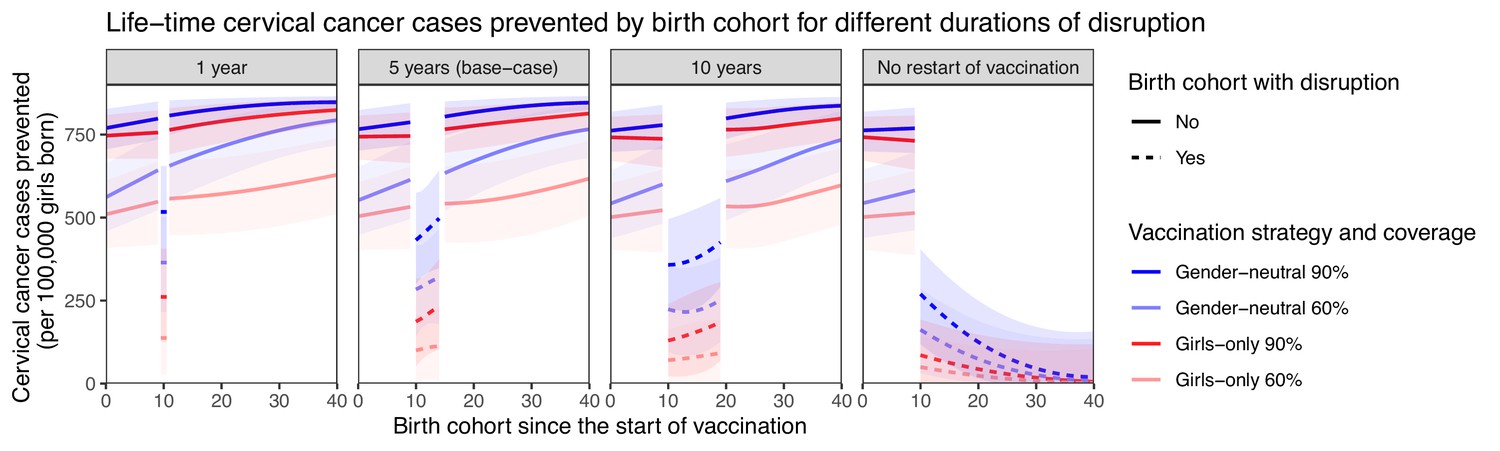
Resilience against HPV vaccination disruption in sensitivity analyses on duration of disruption.
Predicted life-time cervical cancer cases prevented by birth cohorts (per 100,000 girls born) under different durations of disruption (panel) and in the four highlighted scenarios: girls-only strategy with 60% coverage (light red), girls-only strategy with 90% coverage (dark red), gender-neutral strategy with 60% coverage (light blue), and gender-neutral strategy with 90% coverage (dark blue). Vaccination coverage was fixed at 0% in girls and boys during the period of disruption. Birth cohort 0 corresponds to the first vaccinated cohort. Birth cohorts with disruption correspond to dashed lines and birth cohorts without disruption to solid lines.
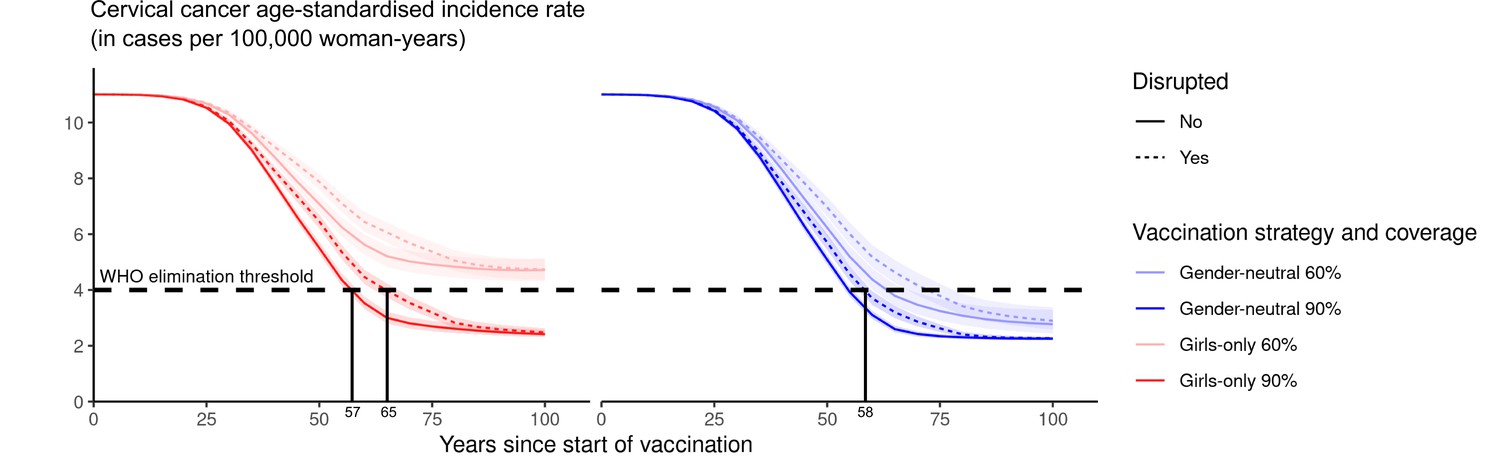
Figure 3
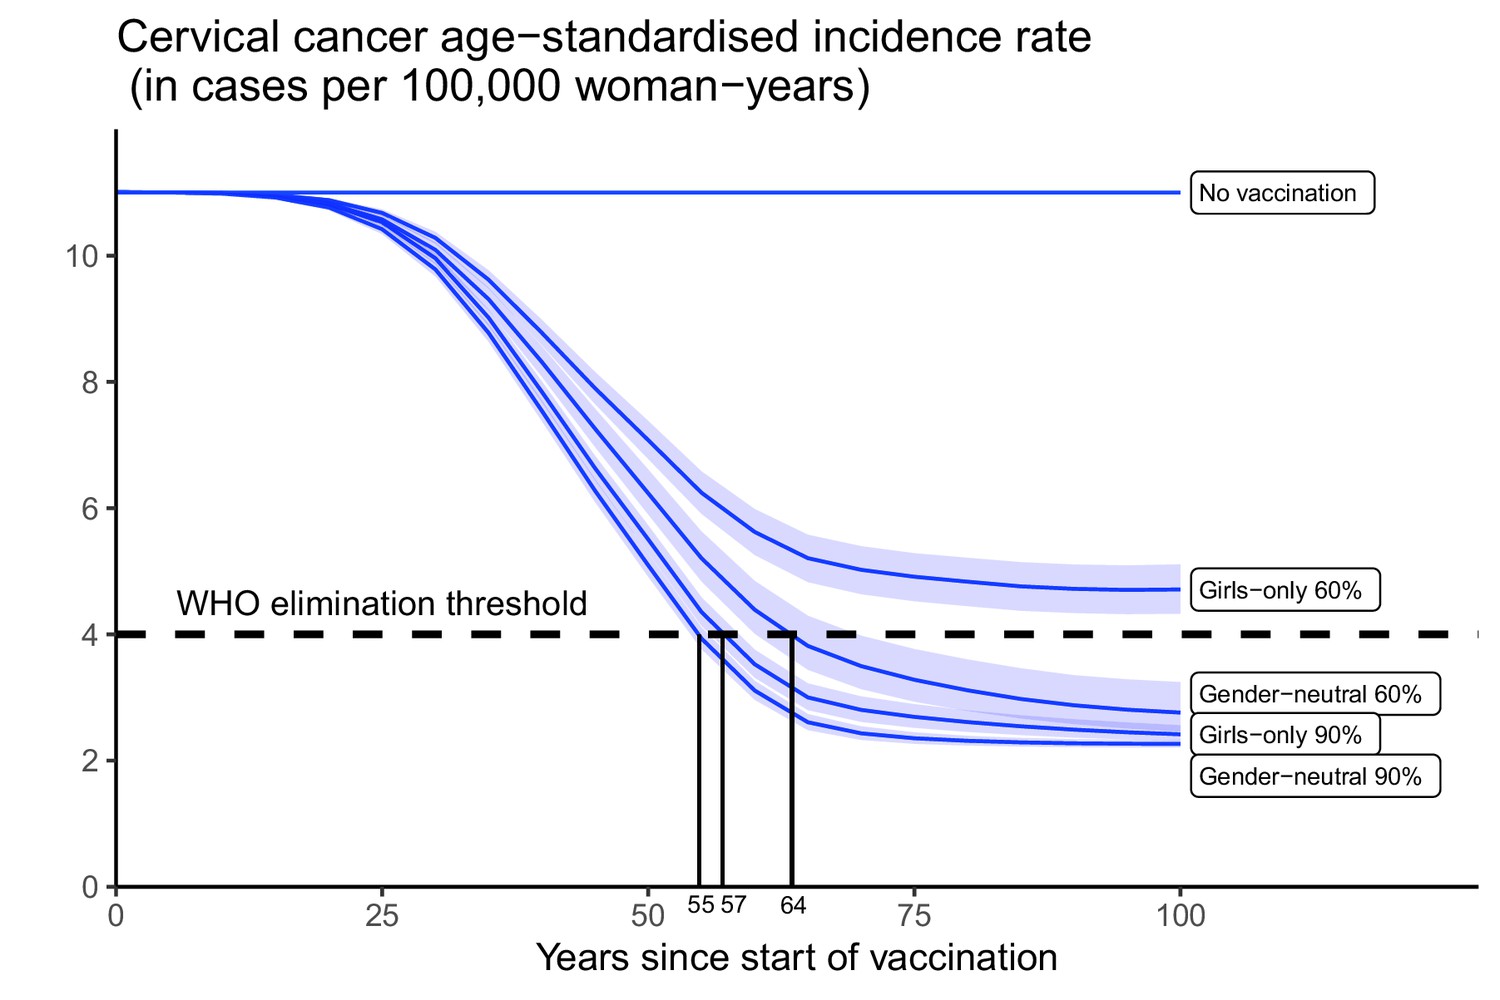
Progress towards cervical cancer elimination over time.
Predicted cervical cancer age-standardised incidence (in cases per 100,000 woman-years) in the years since start of vaccination in India under no vaccination and in the four highlighted scenarios. The dashed line represents the World Health Organization (WHO) elimination threshold for cervical cancer elimination as a public health priority, that is, age-standardised incidence of 4 cases per 100,000 woman-years. Disruption was simulated according to the base case with a period of disruption of 5 years and 0% coverage in girls and boys during the disruption period.
Figure 4
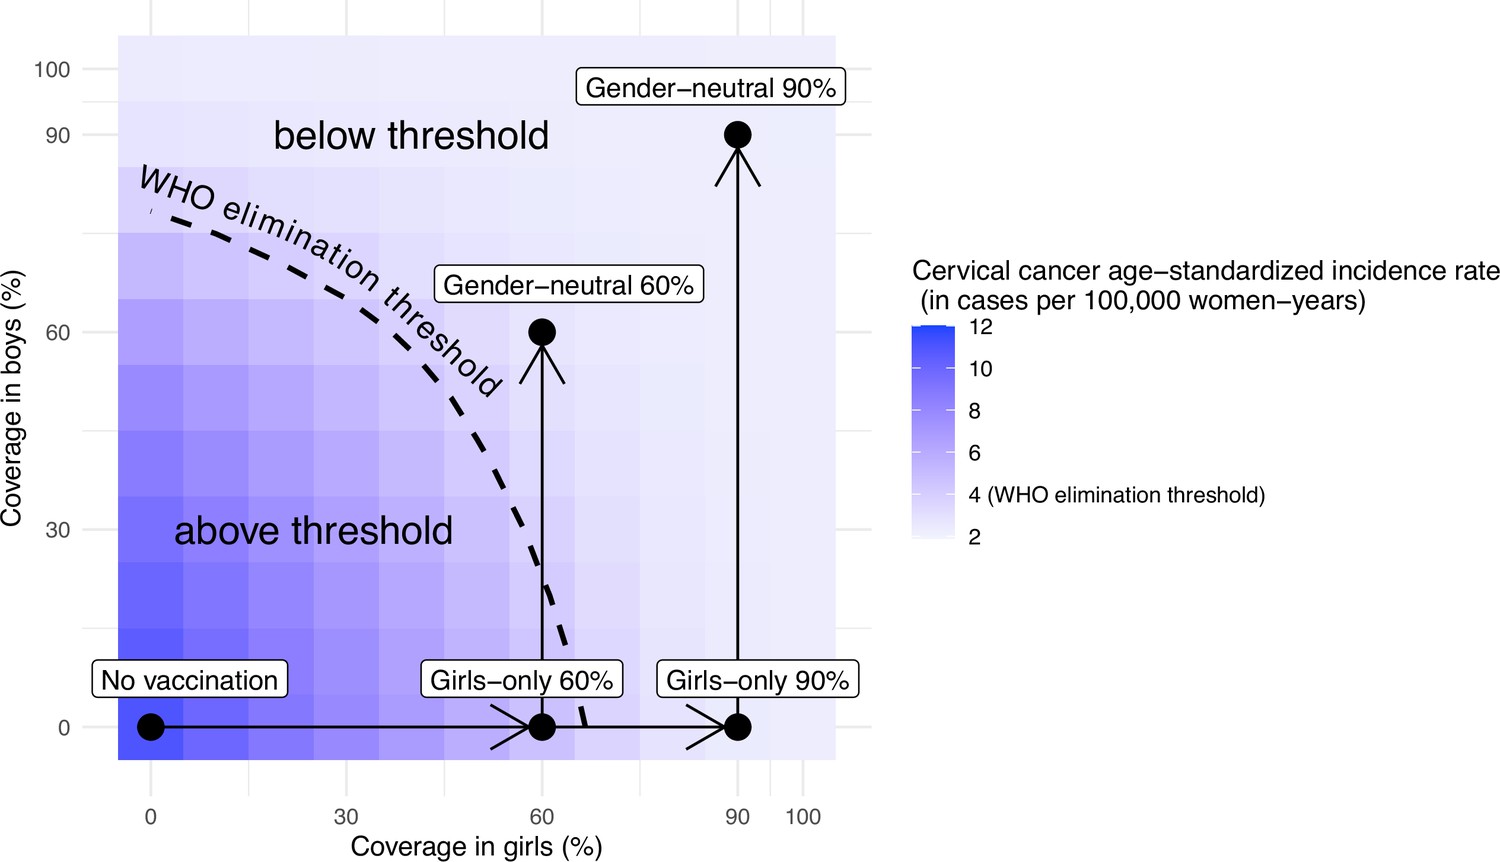
Attainment of cervical cancer elimination in the long term.
Heatmap of the predicted cervical cancer age-standardised incidence rate (in cases per 100,000 woman-years) in the long term (i.e., at 100 years after the start of vaccination) in India by vaccination coverage in girls and boys (under no disruption of vaccination). The dashed curve represents the World Health Organization (WHO) elimination threshold for cervical cancer elimination, that is, age-standardised incidence of 4 cases per 100,000 woman-years. The five black circles correspond to no vaccination and the four highlighted scenarios: girls-only strategy with 60% coverage, girls-only strategy with 90% coverage, gender-neutral strategy with 60% coverage, and gender-neutral strategy with 90% coverage. The horizontal arrows represent scale-up of vaccination by increasing coverage in girls, and the vertical arrows represent switching to gender-neutral vaccination.
Appendix 1—figure 1
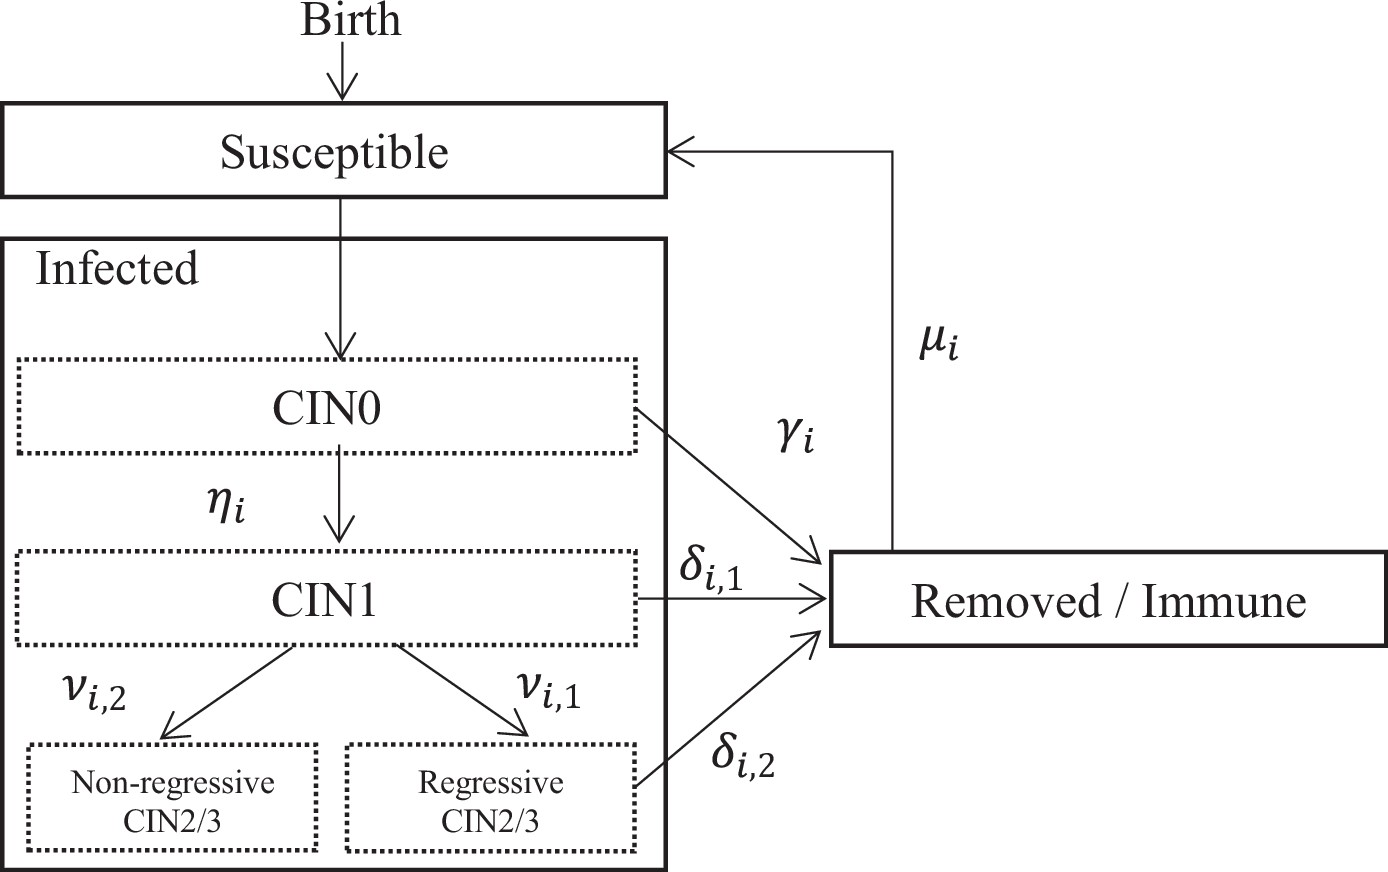
Structure of HPV natural history in EpiMetHeos.
Appendix 1—figure 2
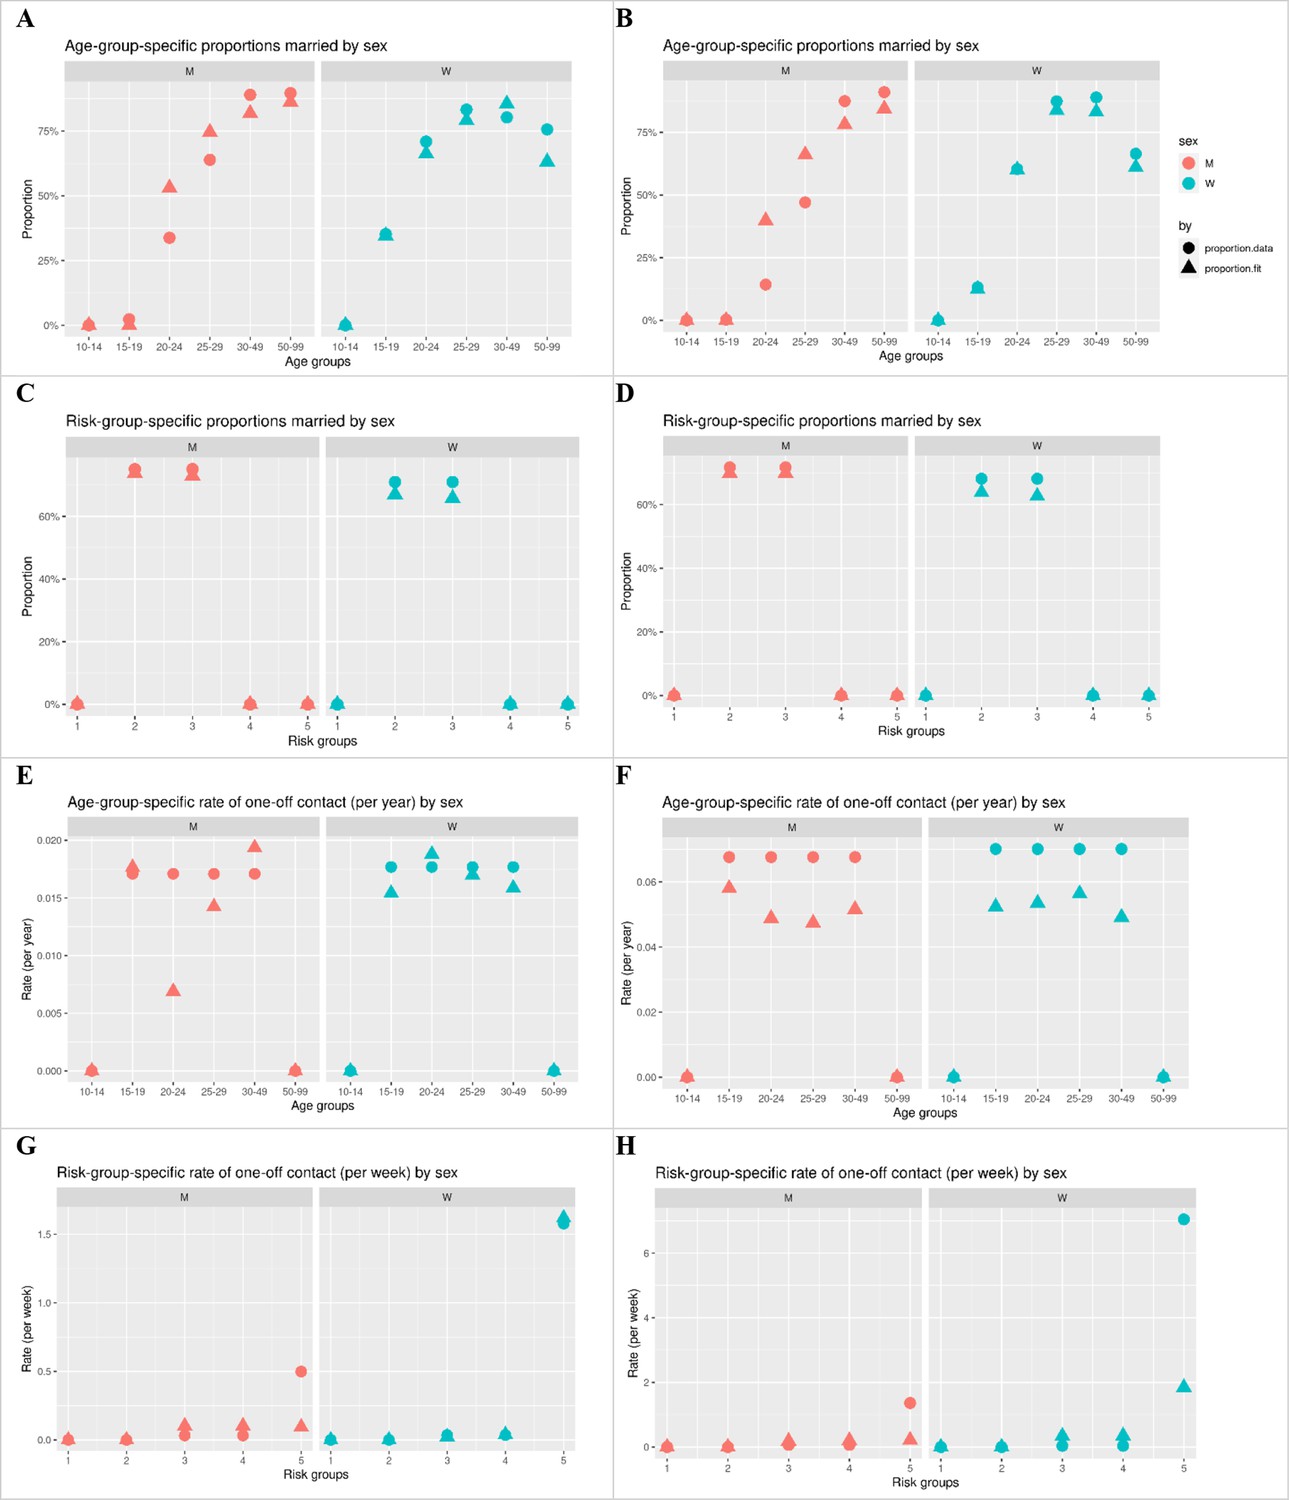
Model fit of the target statistics of sexual contact behaviour.
Left column: West Bengal. Right column: Tamil Nadu. Circle: targets derived from data. Triangle: fit by model.
Appendix 1—figure 3
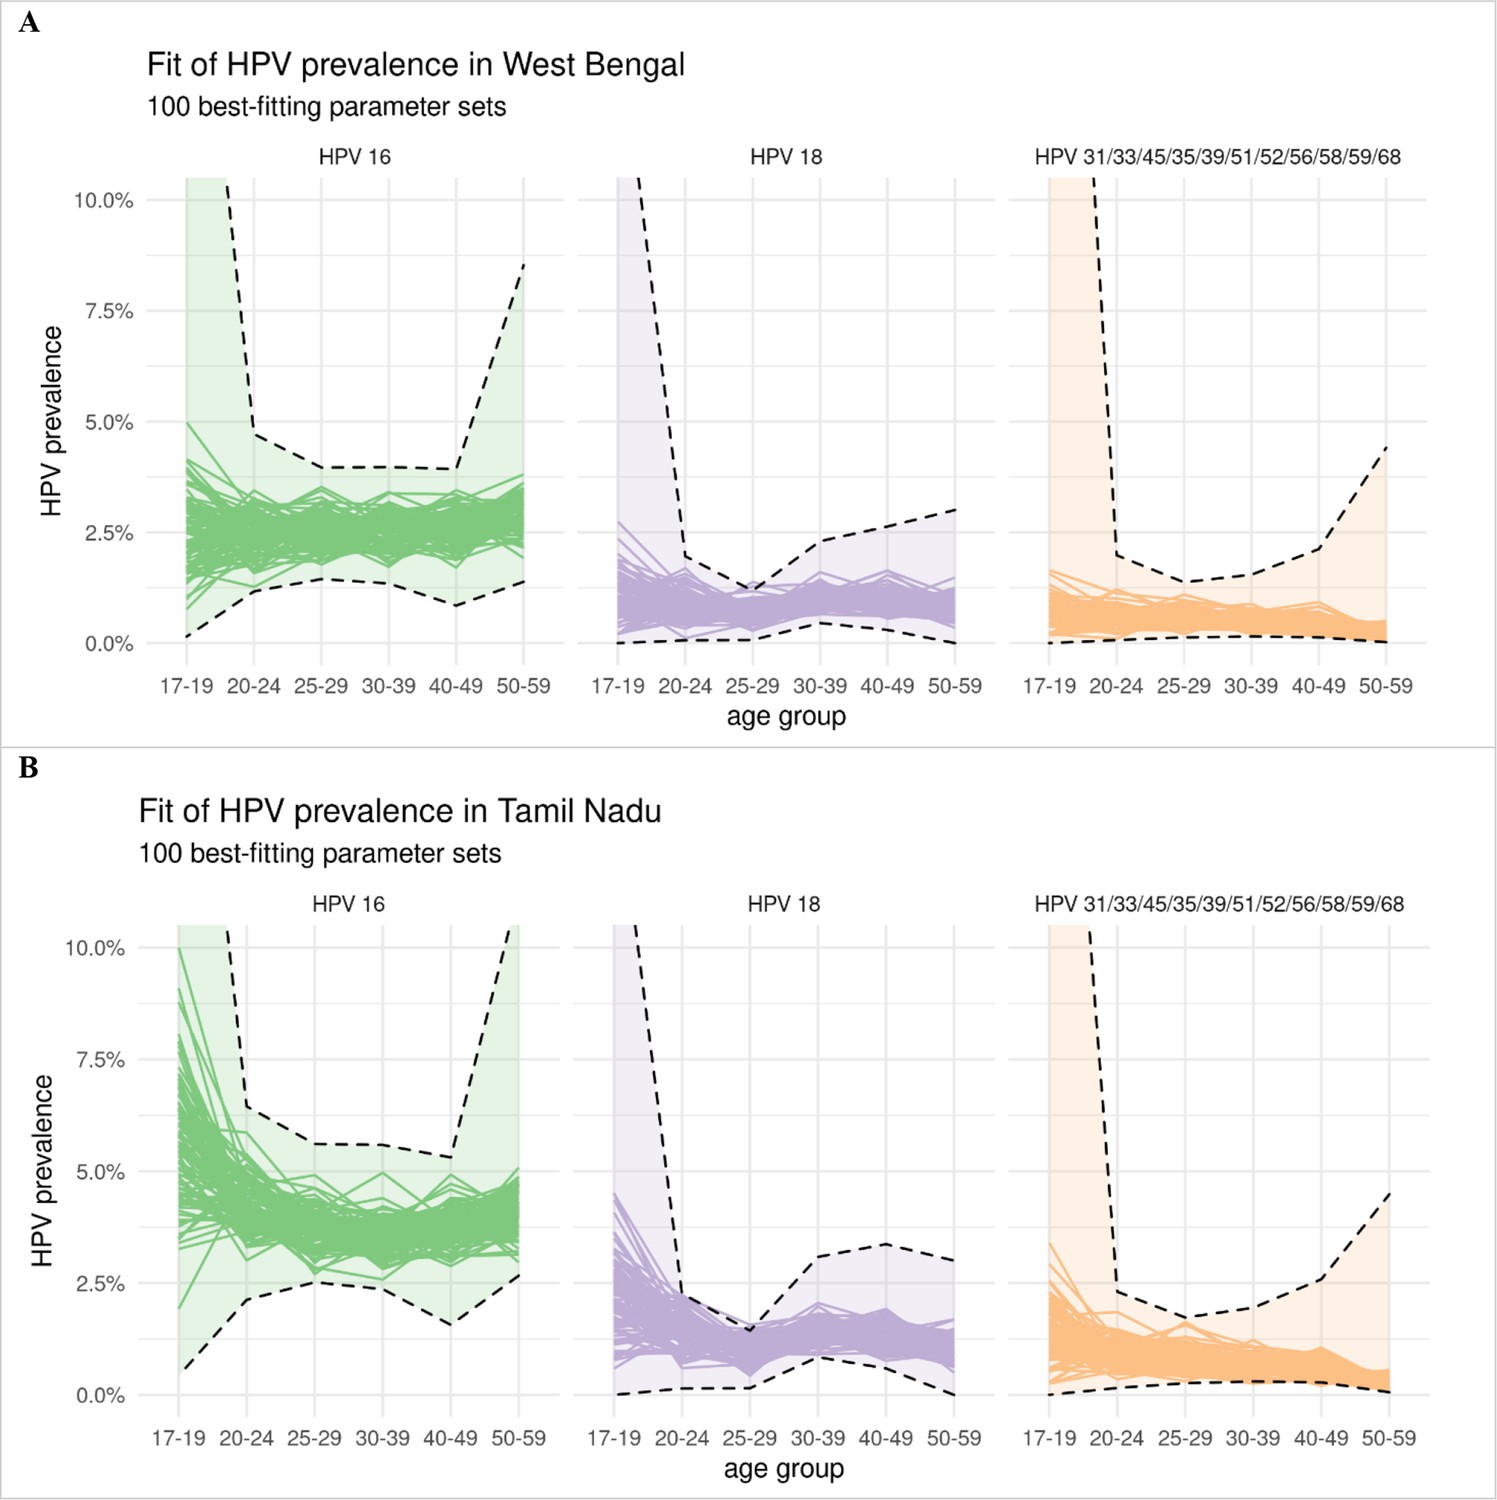
Model fit of the type-specific HPV prevalence data.
Panel A: West Bengal. Panel B: Tamil Nadu. Model estimates of HPV prevalence of each of the 100 best-fitting parameter sets are given by a separate line. The confidence intervals of the observed HPV prevalence under binomial distribution are given by the dashed lines. The confidence intervals for West Bengal follow the same shape as those for Tamil Nadu, as the type-specific prevalence for West Bengal was derived by rescaling that of Tamil Nadu (the prevalence for West Bengal being approximately half that of Tamil Nadu).
Appendix 1—figure 4
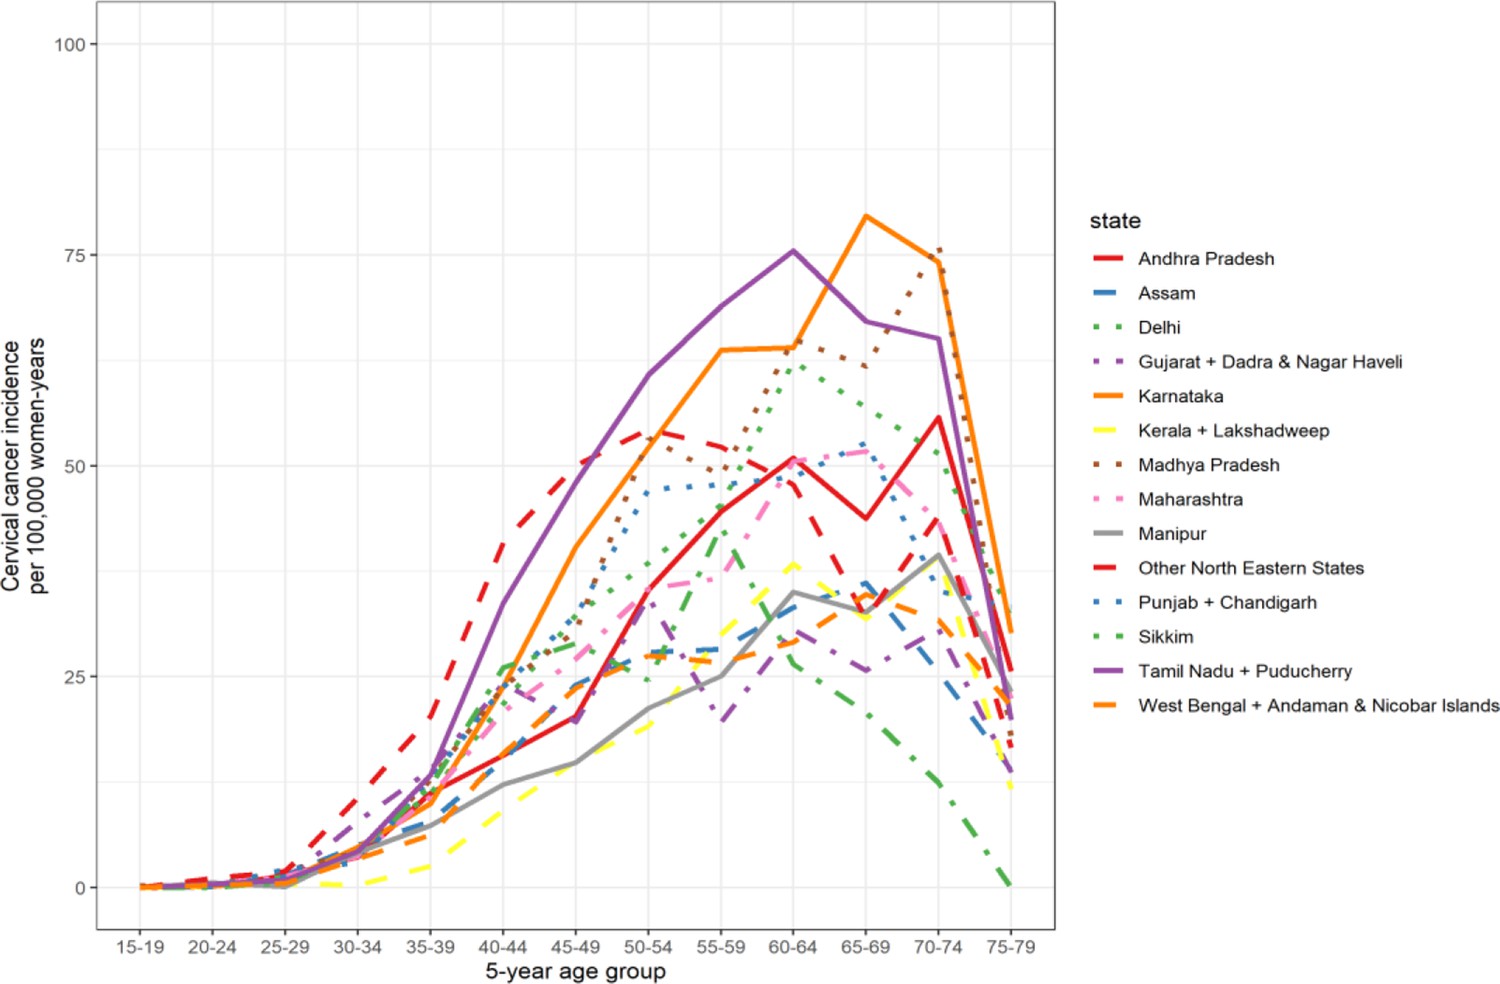
Age-specific cervical cancer incidence data by Indian state.
Appendix 1—figure 5
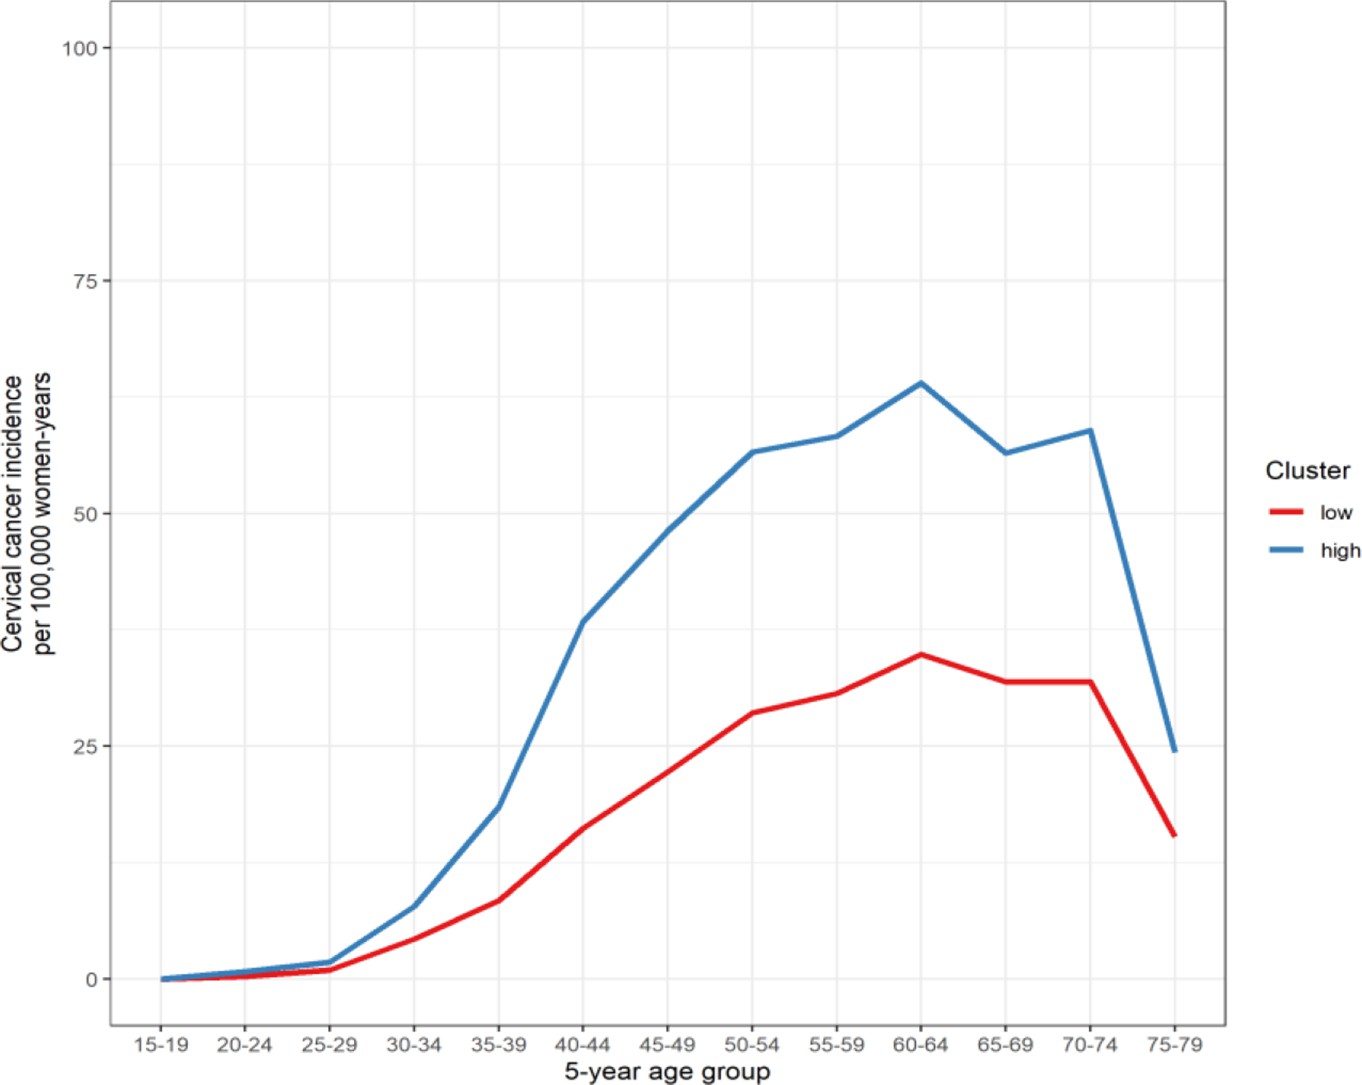
Mean of age-specific cervical cancer incidence of the cluster of Indian states.
Appendix 2—figure 1
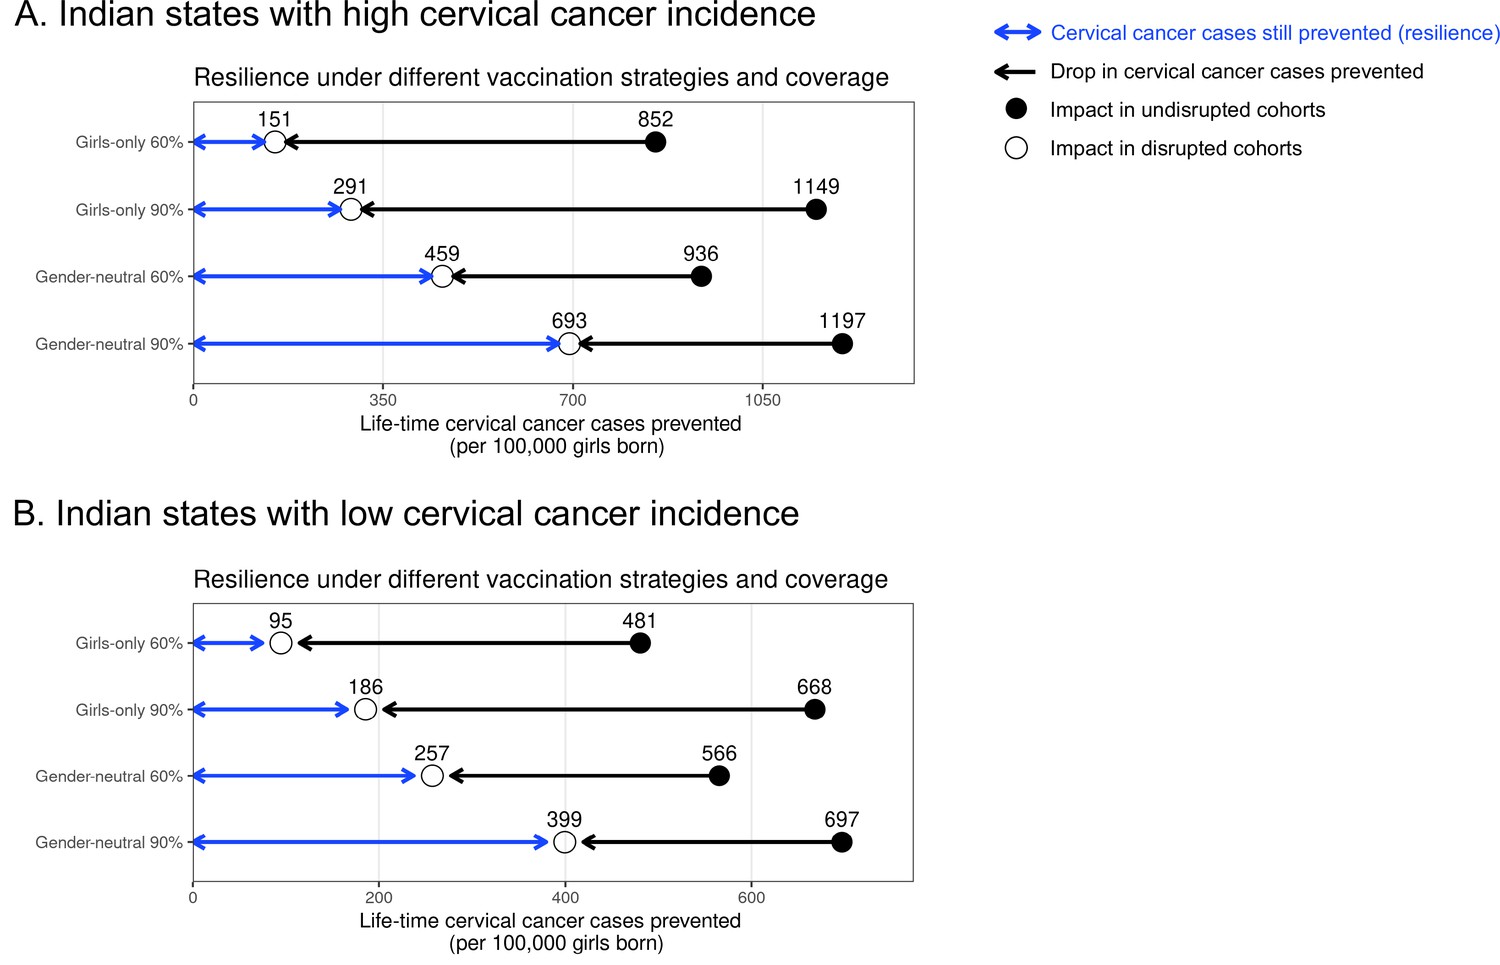
Resilience against HPV vaccination disruption in the base case by Indian state.
Predicted HPV vaccination resilience, defined as life-time number of cervical cancer cases still prevented in the birth cohorts with disruption of vaccination per 100,000 girls born (blue arrow), and drop in cervical cancers prevented as compared to impact in the undisrupted cohorts (black arrow), under the four highlighted scenarios in Indian states with (A) high and (B) low cervical cancer incidence. Disruption was simulated according to the base case with a period of disruption of 5 years and 0% coverage in girls and boys during the disruption period. Figure 1 in the main text corresponds to the results for all Indian states.
Appendix 2—figure 2
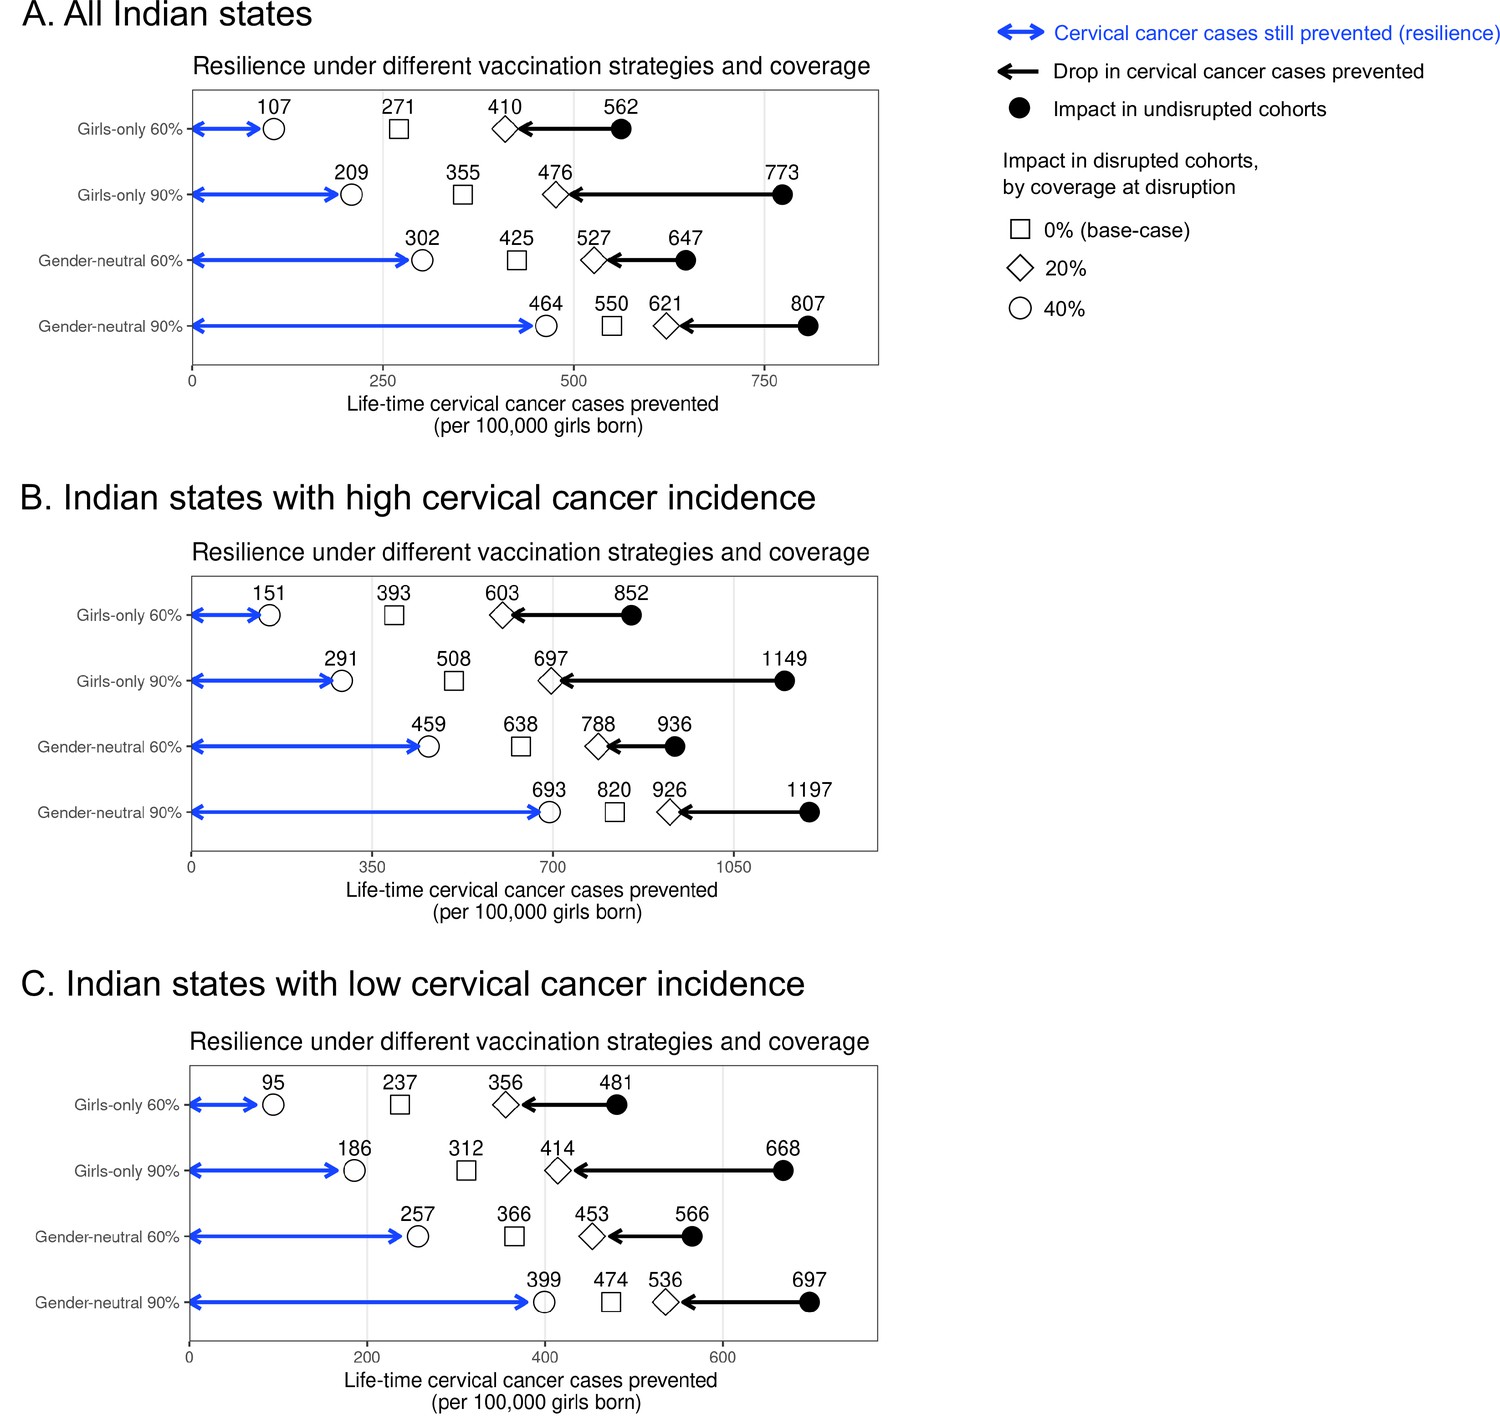
Resilience against HPV vaccination disruption in sensitivity analyses on coverage at disruption by Indian state.
Predicted HPV vaccination resilience, defined as life-time number of cervical cancer cases still prevented in the birth cohorts with disruption of vaccination per 100,000 girls born (blue arrow), and drop in cervical cancers prevented as compared to impact in the undisrupted cohorts (black arrow), under different vaccination strategies and coverage (rows) in the sensitivity analyses of the coverage of disruption in (A) all Indian states, (B) Indian states with high cervical cancer incidence, and (C) Indian states with low cervical cancer incidence. Disruption was simulated for 0% (base case), 20%, or 40% coverage in girls at disruption. The vaccination coverage was fixed at 0% in boys, and the duration of disruption was fixed at 5 years.
Appendix 2—figure 3
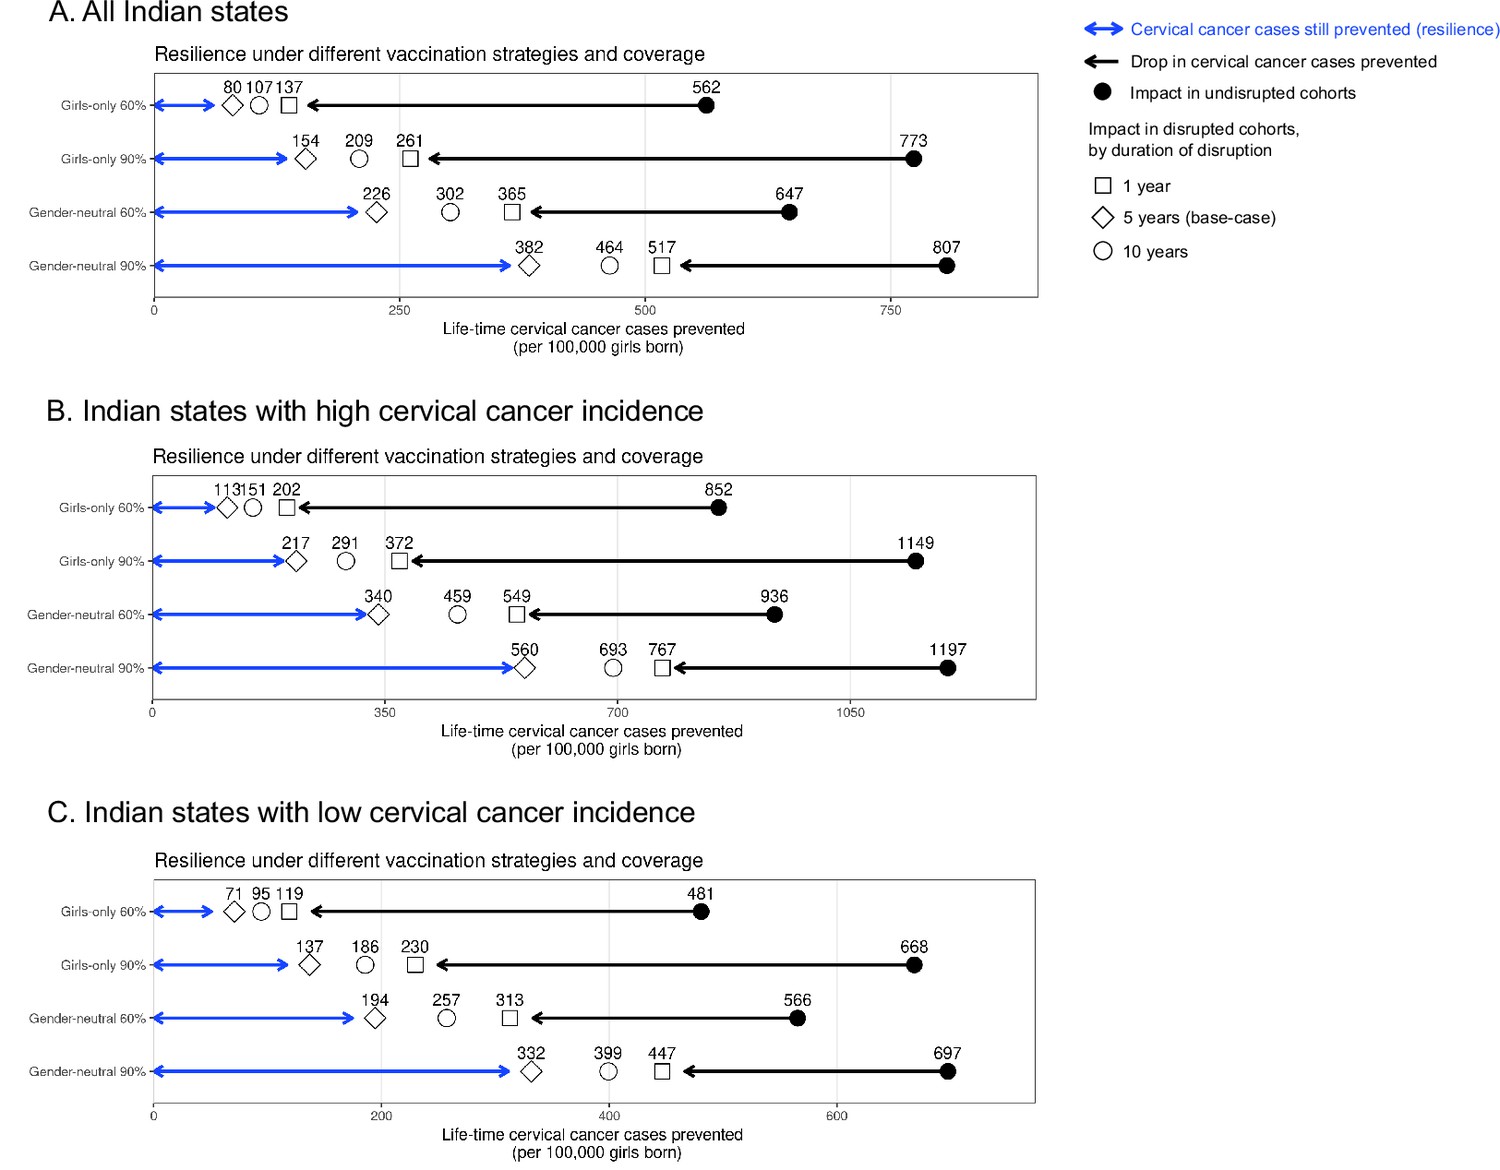
Resilience against HPV vaccination disruption in sensitivity analyses on duration of disruption by Indian state.
Predicted HPV vaccination resilience, defined as life-time number of cervical cancer cases still prevented in the birth cohorts with disruption of vaccination per 100,000 girls born (blue arrow), and drop in cervical cancers prevented as compared to impact in the undisrupted cohorts (black arrow), under different vaccination strategies and coverage (rows) in the sensitivity analyses of the duration of disruption in (A) all Indian states, (B) Indian states with high cervical cancer incidence, and (C) Indian states with low cervical cancer incidence. Disruption was simulated for 1, 5 (base case), or 10 years indicated by different empty shapes. Vaccination coverage was fixed at 0% in girls and boys during the period of disruption.
Appendix 2—figure 4
Progress towards cervical cancer elimination over time with and without disruption.
Predicted cervical cancer age-standardised incidence (in cases per 100,000 woman-years) in the years since start of vaccination in the four highlighted scenarios with (dashed curves) and without (solid curves) disruption. The dashed horizontal line represents the World Health Organization (WHO) elimination threshold for cervical cancer elimination, that is, age-standardised incidence of 4 cases per 100,000 woman-years. Disruption was simulated according to the base case with a period of disruption of 5 years and 0% coverage in girls and boys during the disruption period.
Tables
Table 1
Sensitivity analyses on coverage at disruption and duration of disruption on resilience.
Life-time number of cervical cancer cases prevented per 100,000 girls born in birth cohorts vaccinated prior to disruption in part I. Sensitivity analyses on coverage at disruption in part II and on duration of disruption in part III on resilience (defined as the life-time number of cervical cancer cases still prevented in the birth cohorts with disruption of vaccination per 100,000 girls born) and resilience ratio (defined as fold change in resilience by switching from one scenario to another). Uncertainty intervals are reported in brackets. [Resilience ratio of scenario X to scenario Y] is defined as [resilience of scenario Y]/[resilience of scenario X]. For example, in the base case, [resilience ratio of GO 60% to GO 90%] = [resilience of GO 90%]/[resilience of GO 60%]=209/107=2.0.
| I. Life-time number of cervical cancer cases prevented prior to disruption | |||||||
|---|---|---|---|---|---|---|---|
| Scenario | GO 60% | GO 90% | GN 60% | GN 90% | |||
| No disruption | 562 (444, 676) | 773 (701, 836) | 647 (539, 746) | 807 (752, 853) | |||
| II. Sensitivity analyses on coverage at disruption (with duration of disruption fixed at 5 years) | |||||||
| Coverage at disruption in % | Resilience by vaccination strategy and coverage | Resilience ratio | |||||
| GO 60% | GO 90% | GN 60% | GN 90% | GO 60% to GO 90% | GO 60% to GN 60% | GO 90% to GN 90% | |
| 0 (base case) | 107 (7, 214) | 209 (81, 340) | 302 (170, 437) | 464 (328, 602) | 2.0 | 2.8 | 2.2 |
| 20 | 271 (155, 391) | 355 (221, 490) | 425 (297, 559) | 550 (416, 680) | 1.3 | 1.6 | 1.6 |
| 40 | 410 (277, 534) | 476 (343, 599) | 527 (401, 647) | 621 (500, 730) | 1.2 | 1.3 | 1.3 |
| III. Sensitivity analyses on duration of disruption (with coverage at disruption fixed at 0%) | |||||||
| Duration of disruption in years | Resilience by vaccination strategy and coverage | Resilience ratio | |||||
| GO 60% | GO 90% | GN 60% | GN 90% | GO 60% to GO 90% | GO 60% to GN 60% | GO 90% to GN 90% | |
| 1 | 137 (26, 253) | 261 (125, 407) | 365 (215, 502) | 517 (372, 655) | 1.9 | 2.7 | 2.0 |
| 2 | 125 (17, 233) | 240 (105, 375) | 344 (206, 480) | 500 (359, 642) | 1.9 | 2.7 | 2.1 |
| 5 (base case) | 107 (7, 214) | 209 (81, 340) | 302 (170, 437) | 464 (328, 602) | 2.0 | 2.8 | 2.2 |
| 10 | 80 (0, 182) | 154 (33, 275) | 226 (96, 358) | 382 (240, 525) | 1.9 | 2.8 | 2.5 |
Additional files
-
MDAR checklist
- https://cdn.elifesciences.org/articles/85735/elife-85735-mdarchecklist1-v1.docx
-
Supplementary file 1
List of model parameters.
- https://cdn.elifesciences.org/articles/85735/elife-85735-supp1-v1.docx
-
Supplementary file 2
Data related to Appendix 1.
(A) Overview of available cancer incidence data from local registries by Indian state. (B) Age-specific cervical cancer incidence data by Indian state. (C) Mortality rate of India. (D) Type-specific contribution of HPV types in cervical cancer. (E) Standard world population (Segi, 1960). (F) Female population size by Indian state.(G) Pre-vaccination risk of cervical cancer by Indian state.
- https://cdn.elifesciences.org/articles/85735/elife-85735-supp2-v1.docx
-
Supplementary file 3
Sensitivity analyses on coverage at disruption and duration of disruption on resilience by Indian state.
- https://cdn.elifesciences.org/articles/85735/elife-85735-supp3-v1.docx
-
Reporting standard 1
HPV-FRAME checklist (Canfell et al., 2019).
- https://cdn.elifesciences.org/articles/85735/elife-85735-repstand1-v1.docx
Download links
A two-part list of links to download the article, or parts of the article, in various formats.
Downloads (link to download the article as PDF)
Open citations (links to open the citations from this article in various online reference manager services)
Cite this article (links to download the citations from this article in formats compatible with various reference manager tools)
Building resilient cervical cancer prevention through gender-neutral HPV vaccination
eLife 12:e85735.
https://doi.org/10.7554/eLife.85735


