PIMT is a novel and potent suppressor of endothelial activation
- Center for Translational Medicine, Thomas Jefferson University, United States
- Department of Cell and Developmental Biology, Perelman School of Medicine, University of Pennsylvania, United States
- Quantitative Proteomics Resource Center, University of Pennsylvania, United States
- Department of Cardiovascular Medicine, Ruijin Hospital, Shanghai Jiao Tong University School of Medicine, China
- Center for Metabolic Disease Research, Lewis Katz School of Medicine, Temple University, United States
Figures
Figure 1 with 1 supplement

PIMT haploinsufficiency exacerbates LPS-induced mouse pulmonary vascular inflammation and lung injury.
(A) Total cell counts and protein concentrations were determined in bronchoalveolar lavage fluid (BALF) of wild-type (WT; Pimt+/+) and Pimt hemizygous (Pimt+/−) mice 18 hr after intratracheal LPS (100 µg/100 µl, ALI) or PBS (100 µl, Sham) administration. (B) Diff-Quik stained smears of BALF (left) and neutrophil counts (right) were determined in WT and PIMT+/− mice 18 hr after intratracheal PBS or LPS administration. Bars, 20 μm. (C) Levels of TNF-α, IL-6, and Ccl2 in the BALF of WT and Pimt+/− mice were measured by enzyme-linked immunosorbent assay (ELISA) 18 hr after intratracheal PBS or LPS administration. (D) Expression of TNF-α, IL-1β, IL-6, Ccl2, and ICAM-1 mRNA extracted from lung tissues of WT and Pimt+/− mice with indicted treatments was determined by quantitative real-time RT-PCR (qRT-PCR). (E) Expression of ICAM-1 from lung tissues of WT and Pimt+/− mice with indicted treatments was determined by western blot and quantitated by densitometric analysis. (F) Hematoxylin and eosin staining of the lung sections of WT and Pimt+/− mice 18 hr after intratracheal PBS or LPS. Infiltrated immune cells were counted. Bars, 20 μm. (G) Representative immunofluorescent staining of PIMT in WT mouse lung sections. CD31 is shown as an endothelial marker. Nuclei were stained with DAPI (4′,6-diamidino-2-phenylindole), and IgG was used as a negative control. Bars, 20 µm. All data are expressed as mean ± SD, *p<0.05, **p<0.01, ***p<0.001, two-way ANOVA coupled with Tukey’s post hoc test, and n=9 per group.
-
Figure 1—source data 1
Expression of ICAM-1 from lung tissues of wild-type (WT) and PIMT+/− mice after LPS instillation.
- https://cdn.elifesciences.org/articles/85754/elife-85754-fig1-data1-v1.zip
Figure 1—figure supplement 1
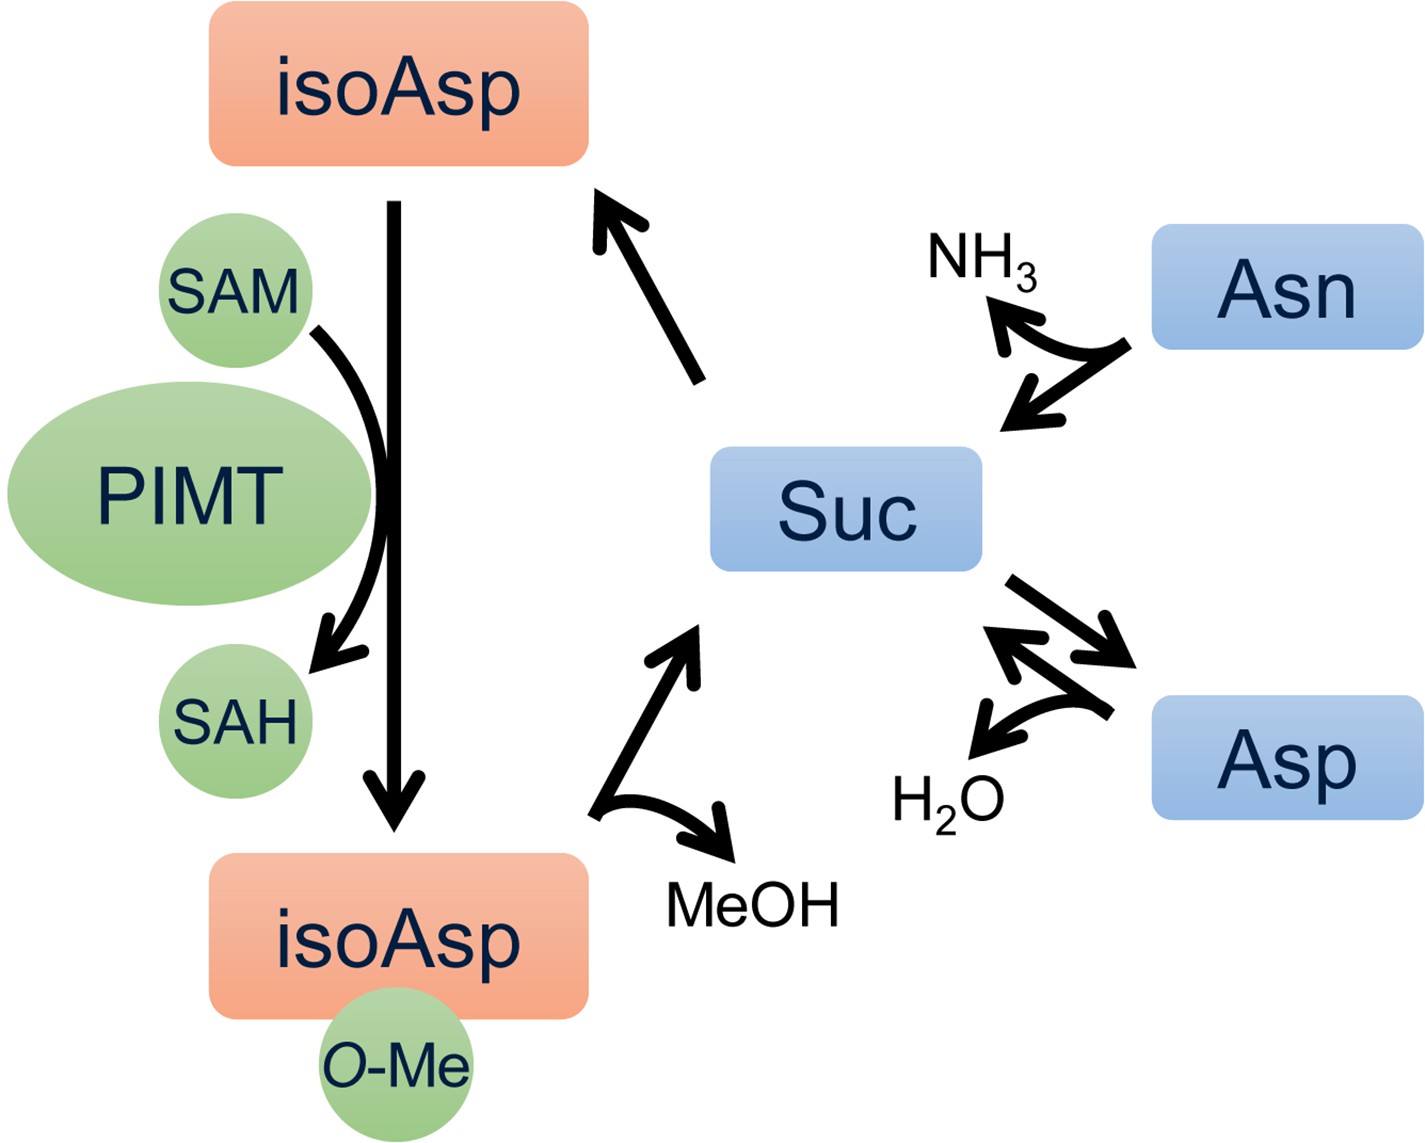
Catalytic process of PIMT-mediated isoaspartyl (isoAsp) methylation and protein repair cycle.
Suc, succinimide; SAM, S-adenosyl methionine; SAH, S-Adenosyl-L-homocysteine.
Figure 2 with 1 supplement
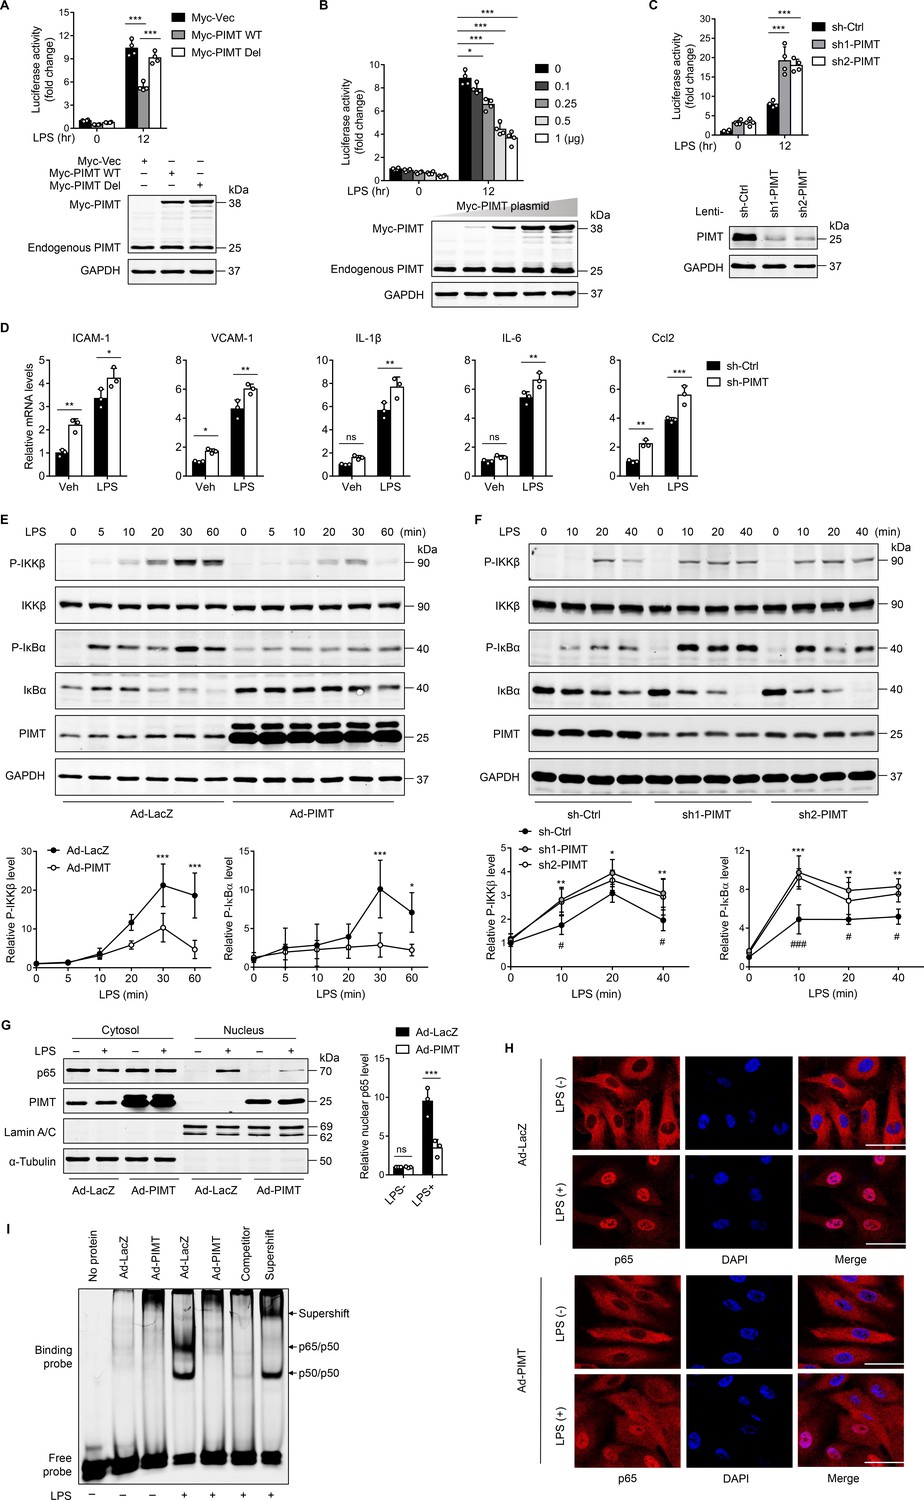
PIMT suppresses LPS-induced endothelial NF-κB transactivation and proinflammatory effect.
(A) EA.hy926 cells were transfected with NF-κB-luciferase reporter together with either empty or Myc-tagged PIMT plasmids. 36 hr after transfection, cells were treated with either vehicle or LPS (1 μg/ml) for additional 12 hr and then harvested for the luciferase assay. Results are presented relative to Renilla activity (n=4). Endogenous and ectopic expression of PIMT were determined by western blot. Vec, pCS2−6×Myc empty vector; WT, wild-type PIMT; Del, catalytic defective PIMT mutant. (B) EA.hy926 cells were co-transfected with NF-κB luciferase reporter together with increased amounts of Myc-tagged PIMT plasmid. 36 hr after transfection, cells were stimulated with either vehicle or LPS (1 μg/ml) for 12 hr and then harvested for luciferase assay (n=4). Expression of PIMT was determined by western blot. (C) EA.hy926 cells were transduced with lentivirus expressing control shRNA (sh-Ctrl) or PIMT shRNAs (sh1-PIMT or sh2-PIMT) for 36 hr and then transfected with NF-κB-luciferase reporter plasmid for additional 36 hr. Luciferase activity was determined after LPS (1 μg/ml) treatment for 12 hr (n=4). PIMT levels were determined by western blot. (D) Human umbilical vein endothelial cells (HUVECs) were transduced with lentivirus expressing sh-Ctrl or PIMT shRNAs (sh1-PIMT or sh2-PIMT) for 60 hr. The mRNA expression of ICAM-1, VCAM1, IL-1β, IL-6, and Ccl2 was determined by quantitative real-time RT-PCR (qRT-PCR) after LPS (200 ng/ml) treatment for 12 hr (n=3). (E) HUVECs were transduced with Ad-LacZ or Ad-PIMT (moi = 10) for 48 hr and then stimulated with LPS (1 μg/ml) for indicated time points. Expression of PIMT and phosphorylation of the indicated proteins in toll-like receptor (TLR)-mediated NF-κB pathway was detected by western blot (above) and quantitated by densitometric analysis (n=3). (F), HUVECs were transduced with lentivirus expressing sh-Ctrl or PIMT shRNAs (sh1-PIMT or sh2-PIMT) for 72 hr and stimulated with LPS (200 ng/ml) for indicated time points. Expression and phosphorylation of indicated proteins were determined by western blot and quantitated by densitometric analysis (n=3). *p<0.05, **p<0.01, and ***p<0.001 (sh-Ctrl vs. sh1-PIMT). #p<0.05 and ###p<0.001 (sh-Ctrl vs. sh2-PIMT). Two-way ANOVA coupled with Tukey’s post hoc test. (G) HUVECs were transduced with Ad-LacZ or Ad-PIMT (moi = 10) for 48 hr and then treated with LPS (1 μg/ml) for 30 min. Levels of NF-κB p65 in the cytoplasmic and nuclear fractions were determined by western blot. Lamin A/C and α-Tubulin were used as nuclear and cytoplasmic markers. The representative images (left) and quantification (right, n=3) were shown. (H) HUVECs were transduced with Ad-LacZ or Ad-PIMT (moi = 10) for 48 hr, followed by LPS (1 μg/ml) stimulation for 30 min. Localization of p65 was determined by immunofluorescent staining. Nuclei were stained with DAPI. Scale bars, 20 μm. (I) HUVECs were transduced with Ad-LacZ or Ad-PIMT (moi = 10) for 48 hr and then stimulated with LPS (1 μg/ml) for 30 min. Nuclear fraction was extracted, and NF-κB DNA-binding activity was determined by electrophoretic mobility-shift assay (EMSA). Competitor was 50-fold unlabeled probe. Supershift was incubated with anti-p65 antibody. All data are representative of mean ± SD, *p<0.05, **p<0.01, ***p<0.001, and two-way ANOVA coupled with Tukey’s post hoc test.
-
Figure 2—source data 1
Endogenous and ectopic expression of PIMT in EA.hy926 cells.
- https://cdn.elifesciences.org/articles/85754/elife-85754-fig2-data1-v1.zip
-
Figure 2—source data 2
Expression of PIMT of PIMT in EA.hy926 cells transfected with Myc-PIMT plasmid.
- https://cdn.elifesciences.org/articles/85754/elife-85754-fig2-data2-v1.zip
-
Figure 2—source data 3
Effect of PIMT shRNA on PIMT expression.
- https://cdn.elifesciences.org/articles/85754/elife-85754-fig2-data3-v1.zip
-
Figure 2—source data 4
Effect of PIMT expression on NF-κB activation.
- https://cdn.elifesciences.org/articles/85754/elife-85754-fig2-data4-v1.zip
-
Figure 2—source data 5
Effect of PIMT knockdown on NF-κB activation.
- https://cdn.elifesciences.org/articles/85754/elife-85754-fig2-data5-v1.zip
-
Figure 2—source data 6
Effect of PIMT overexpression on NF-κB p65 cellular localization.
- https://cdn.elifesciences.org/articles/85754/elife-85754-fig2-data6-v1.zip
Figure 2—figure supplement 1
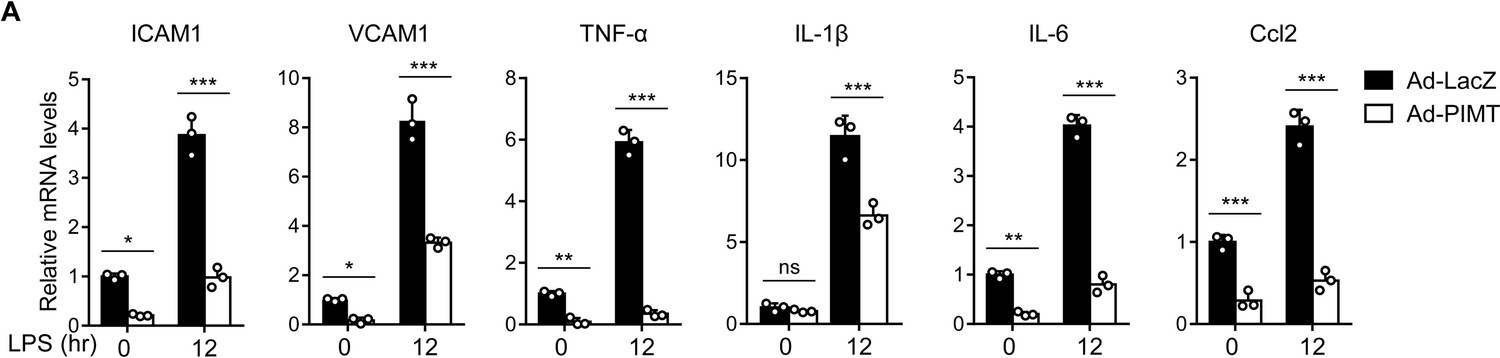
PIMT suppresses LPS-induced expression of inflammatory molecules in ECs.
Human umbilical vein endothelial cells (HUVECs) were transduced with adenovirus LacZ (Ad-LacZ) or PIMT (Ad-PIMT) at a moi of 10 for 48 hr. The mRNA levels of ICAM-1, VCAM1, TNF-α, IL-1β, IL-6, and Ccl2 were determined by quantitative PCR (qPCR) at 12 hr after LPS (1 μg/ml) stimulation (n=3). Results are representative of mean ± SD, *p<0.05, **p<0.01, ***p<0.001, and two-way ANOVA coupled with Tukey’s post hoc test.
Figure 3 with 1 supplement
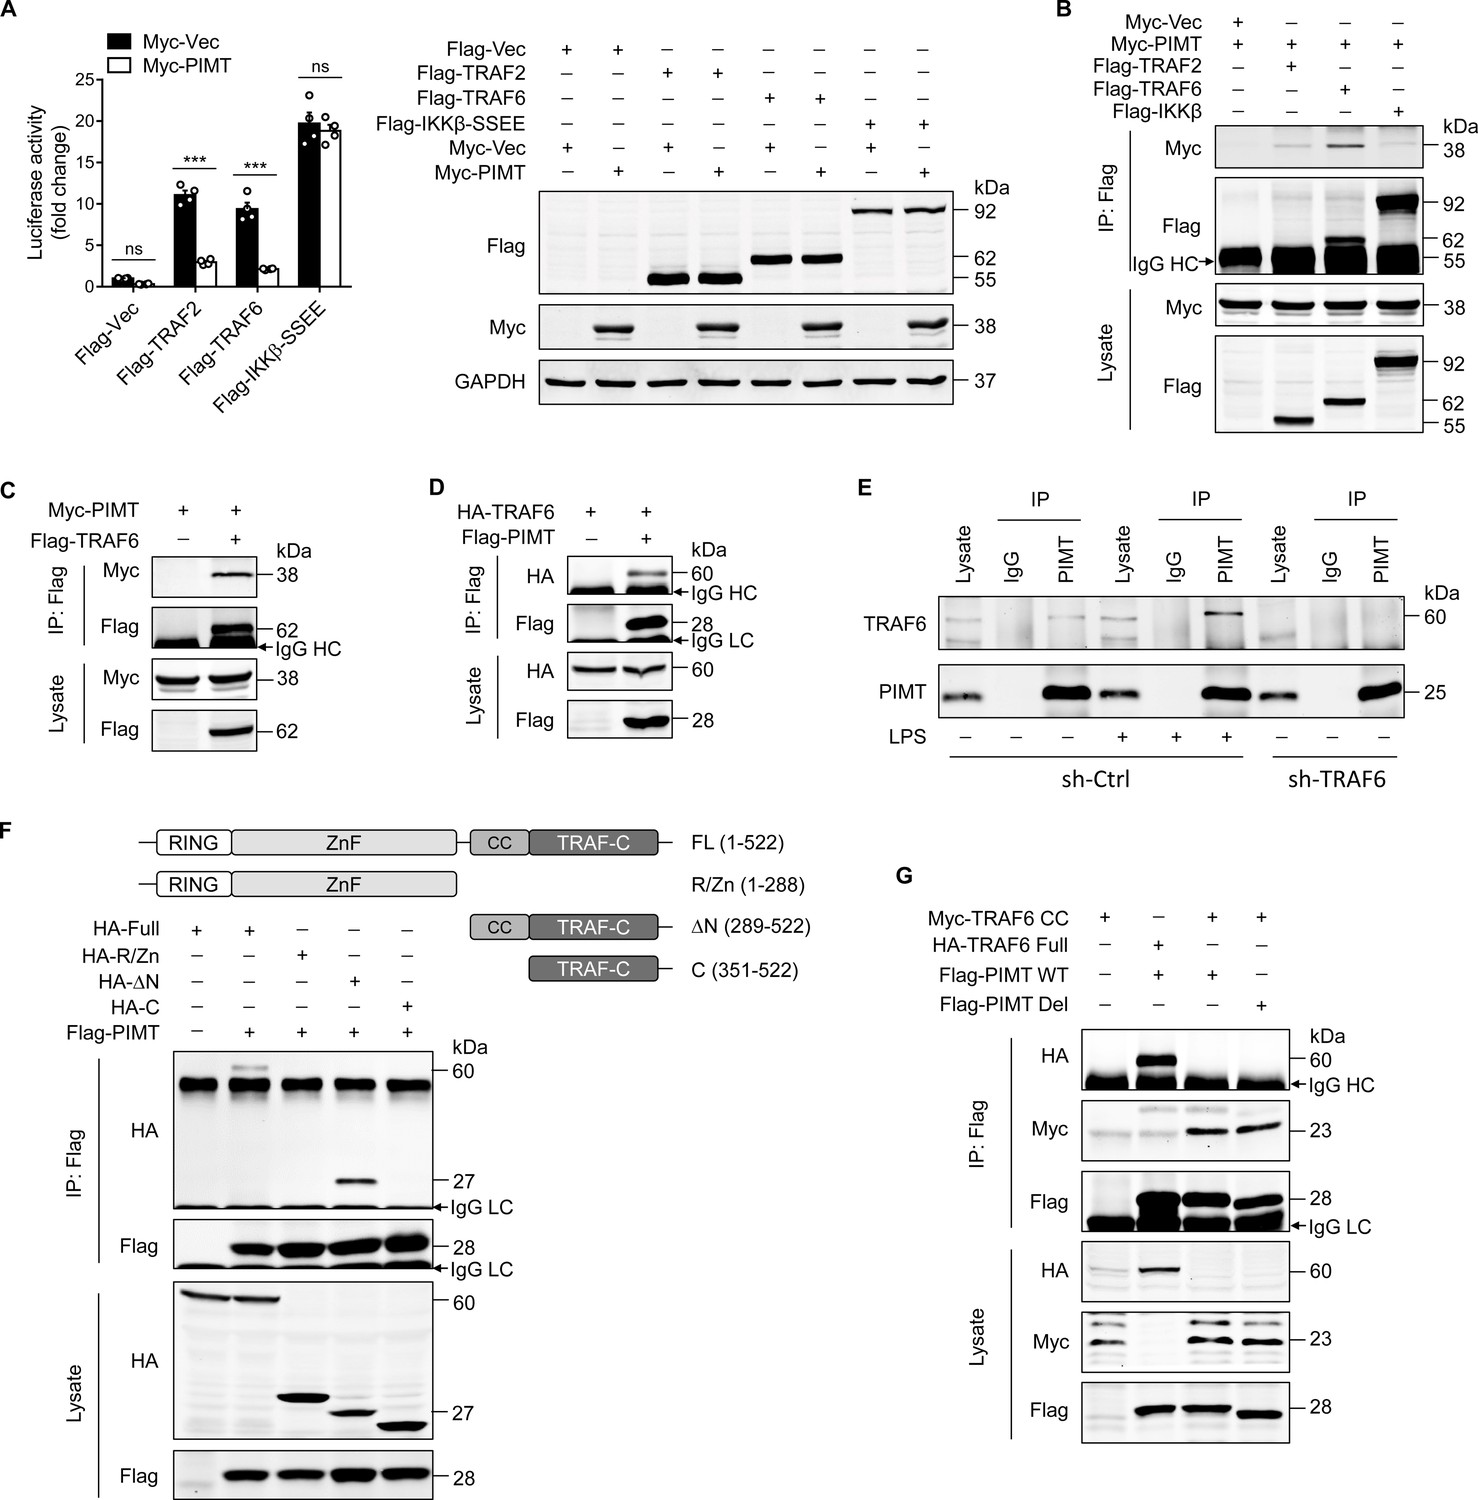
PIMT functionally interacts with TRAF6.
(A) EA.hy926 cells were transfected with NF-κB luciferase reporter together with indicated plasmids. Cells were harvested 48 hr later to determine luciferase activity (n=4), ***p<0.001, and two-way ANOVA coupled with Tukey’s post hoc test. Expression of transfected proteins was detected by western blot. (B) HEK-293T cells were transfected with a combination of indicated plasmids. 48 hr after transfection, immunoprecipitation was performed using anti-Flag antibody, followed by western blot to detect protein interaction. (C) HEK-293T cells were transfected with Flag-TRAF6 and Myc-PIMT expression vectors. 48 hr after transfection, immunoprecipitation was performed using anti-Flag antibody, followed by western blot to detect the interaction of PIMT with TRAF6. (D) HEK-293T cells were transfected with HA-TRAF6 and Flag-PIMT vectors. 48 hr after transfection, immunoprecipitation was performed using anti-HA antibody, followed by western blot to detect protein interaction. (E) Human umbilical vein endothelial cells (HUVECs) were transduced with lentivirus expressing the control shRNA (sh-Ctrl) or TRAF6 shRNA (sh-TRAF6) for 72 hr, followed by stimulation with either vehicle or LPS (1 μg/ml) for 30 min. Cell lysates were then collected for immunoprecipitation using anti-PIMT antibody, followed by western blot to detect the interaction of TRAF6 with PIMT. (F) HEK-293T cells were transfected with Flag-PIMT together with HA-tagged full length TRAF6 or its deletion mutants as indicated. 48 hr after transfection, immunoprecipitation was performed using anti-Flag antibody, followed by western blot to detect the interaction of PIMT with wild-type (WT) or truncated TRAF6 mutants. (G) HEK-293T cells were transfected with PIMT or its mutants together with tagged TRAF6 or its coiled-coil (CC) domain. Immunoprecipitation was performed using anti-Flag antibody, followed by western blot to detect the interaction of indicated proteins.
-
Figure 3—source data 1
Expression of indicated proteins in transfected EA.hy926 cells.
- https://cdn.elifesciences.org/articles/85754/elife-85754-fig3-data1-v1.zip
-
Figure 3—source data 2
Interaction of PIMT with TRAFs.
- https://cdn.elifesciences.org/articles/85754/elife-85754-fig3-data2-v1.zip
-
Figure 3—source data 3
Interaction of PIMT with TRAF6.
- https://cdn.elifesciences.org/articles/85754/elife-85754-fig3-data3-v1.zip
-
Figure 3—source data 4
Interaction of PIMT with TRAF6.
- https://cdn.elifesciences.org/articles/85754/elife-85754-fig3-data4-v1.zip
-
Figure 3—source data 5
Interaction of PIMT with TRAF6 in human umbilical vein endothelial cells (HUVECs).
- https://cdn.elifesciences.org/articles/85754/elife-85754-fig3-data5-v1.zip
-
Figure 3—source data 6
Interaction of PIMT with TRAF6 mutants.
- https://cdn.elifesciences.org/articles/85754/elife-85754-fig3-data6-v1.zip
-
Figure 3—source data 7
Interaction of PIMT with TRAF6 coiled-coil (CC) domain.
- https://cdn.elifesciences.org/articles/85754/elife-85754-fig3-data7-v1.zip
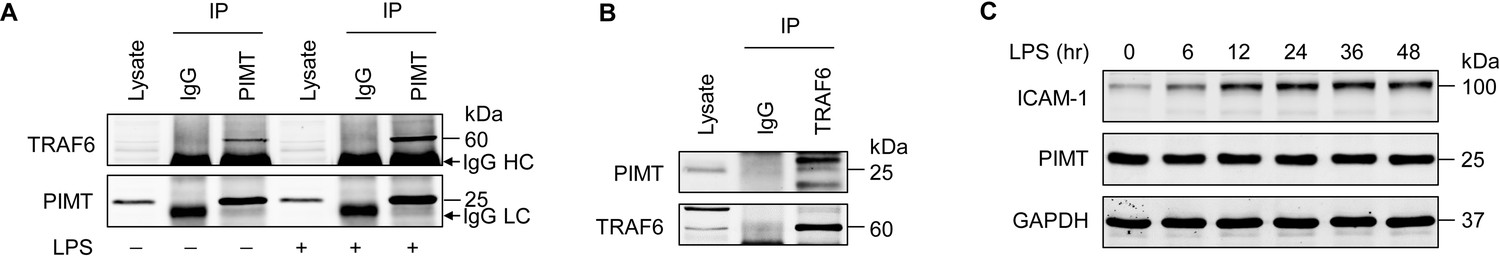
Figure 3—figure supplement 1
Endogenous interaction of PIMT with TRAF6 in ECs.
(A) Immunoprecipitation of PIMT and western blot of TRAF6 in cell lysates from human lung microvascular endothelial cells (HLMVECs) with or without LPS (1 μg/ml) treatment for 30 min. IgG heavy chain (HC) and IgG light chain (LC) were indicated. (B) Immunoprecipitation of cell lysates from human umbilical vein endothelial cells (HUVECs) using anti-TRAF6 antibody showing the interaction of TRAF6 with PIMT, as determined by western blot. (C) HLMVECs were treated with LPS (1 μg/ml) for indicated times, and PIMT were detected by western blot.
-
Figure 3—figure supplement 1—source data 1
Interaction of PIMT with TRAF6 after LPS stimulation in human lung microvascular endothelial cells (HLMVECs).
- https://cdn.elifesciences.org/articles/85754/elife-85754-fig3-figsupp1-data1-v1.zip
-
Figure 3—figure supplement 1—source data 2
Interaction of TRAF6 with PIMT in human umbilical vein endothelial cells (HUVECs).
- https://cdn.elifesciences.org/articles/85754/elife-85754-fig3-figsupp1-data2-v1.zip
-
Figure 3—figure supplement 1—source data 3
Effects of LPS on ICAM-1 and PIMT expression.
- https://cdn.elifesciences.org/articles/85754/elife-85754-fig3-figsupp1-data3-v1.zip
Figure 4 with 1 supplement
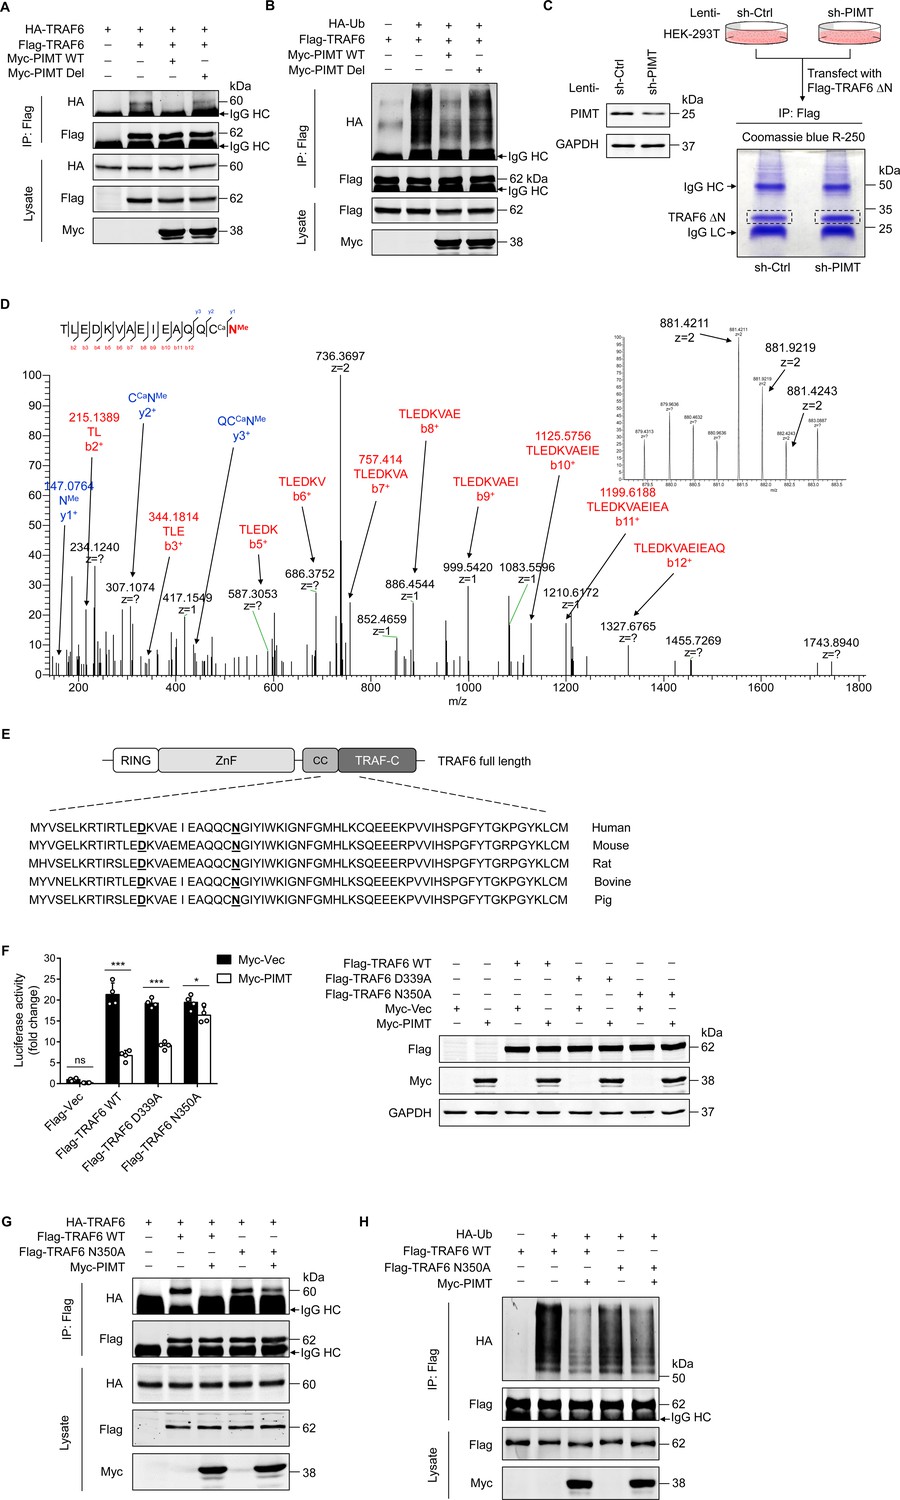
PIMT suppresses TRAF6 function through methylation of TRAF6 at N350.
(A) HEK-293T cells were transfected with TRAF6 and PIMT constructs. Immunoprecipitation was performed 48 hr after transfection using anti-Flag antibody, followed by western blot using anti-HA antibody to detect TRAF6 oligomerization. (B) HEK-293T cells were transfected with HA-ubiquitin (HA-Ub) and Flag-TRAF6 in the presence of Myc-tagged wild-type (WT) PIMT and its enzymatic inactive mutant (PIMT Del). 48 hr after transfection, cells were collected for anti-Flag immunoprecipitation. The autoubiquitination of TRAF6 was detected by western blot using anti-HA antibody. (C) Left, western blot showing expression of PIMT in control or PIMT stable depleted HEK-293T cells. Right, work flow of in gel preparation of TRAF6 ∆N (shown in Figure 3H) for mass spectrometric analysis. (D) Liquid chromatography and mass spectrometry (LC-MS/MS) analysis of asparagine (Asn)/aspartate (Asp) modification in TARF6 ∆N domain. Mass tolerance window of the fragment ions is set within 0.02 Da. Ca, carbamidomethyl. Me, methyl. Left, manually assigned MS/MS spectra of TLEDKVAEIEAQQC (carbamidomethyl) N (methyl). Right, corresponding two charged precursor ion peaks, the m/z of the monoisotopic peak (m/z 841.4211, z=2) was found to be 1.4 ppm apart from the theoretical m/z (881.4198, z=2). (E) Alignment of TRAF6 protein sequences from different species. Identified methylated Asp and Asn residues are underlined. (F) EA.hy926 cells were transfected with NF-κB reporter plasmid together with WT TRAF6 or TRAF6 mutants (D339A and N350A). 48 hr after transfection, cell were collected for luciferase assay (n=4), *p<0.05, ***p<0.001, and two-way ANOVA coupled with Tukey’s post hoc test. Expression of transfected proteins were determined by western blot. (G) HEK-293T cells were transfected with HA-TRAF6 and indicated Flag-tagged TRAF6 constructs together Myc-PIMT plasmid. 48 hr after transfection, immunoprecipitation was performed using anti-Flag antibody, followed by western blot using anti-HA antibody to detect TRAF6 oligomerization. (H) HEK-293T cells were transfected with Flag tagged WT or mutant TRAF6 together with HA-Ub and Myc-PIMT plasmids. 48 hr after transfection, TRAF6 was immunoprecipitated by anti-Flag antibody, and autoubiquitination was then detected by western blot using anti-HA antibody.
-
Figure 4—source data 1
Effect of PIMT on TRAF6 oligomerization.
- https://cdn.elifesciences.org/articles/85754/elife-85754-fig4-data1-v1.zip
-
Figure 4—source data 2
Effect of PIMT on TRAF6 autoubiquitination.
- https://cdn.elifesciences.org/articles/85754/elife-85754-fig4-data2-v1.zip
-
Figure 4—source data 3
Effect of lentivirus bearing PIMT shRNA on PIMT expression.
- https://cdn.elifesciences.org/articles/85754/elife-85754-fig4-data3-v1.zip
-
Figure 4—source data 4
Expression of PIMT and TRAF6 in transfected EA.hy926 cells.
- https://cdn.elifesciences.org/articles/85754/elife-85754-fig4-data4-v1.zip
-
Figure 4—source data 5
Role of TRAF6 N350 in TRAF6 oligomerization.
- https://cdn.elifesciences.org/articles/85754/elife-85754-fig4-data5-v1.zip
-
Figure 4—source data 6
Role of TRAF6 N350 in TRAF6 autoubiquitination.
- https://cdn.elifesciences.org/articles/85754/elife-85754-fig4-data6-v1.zip
Figure 4—figure supplement 1
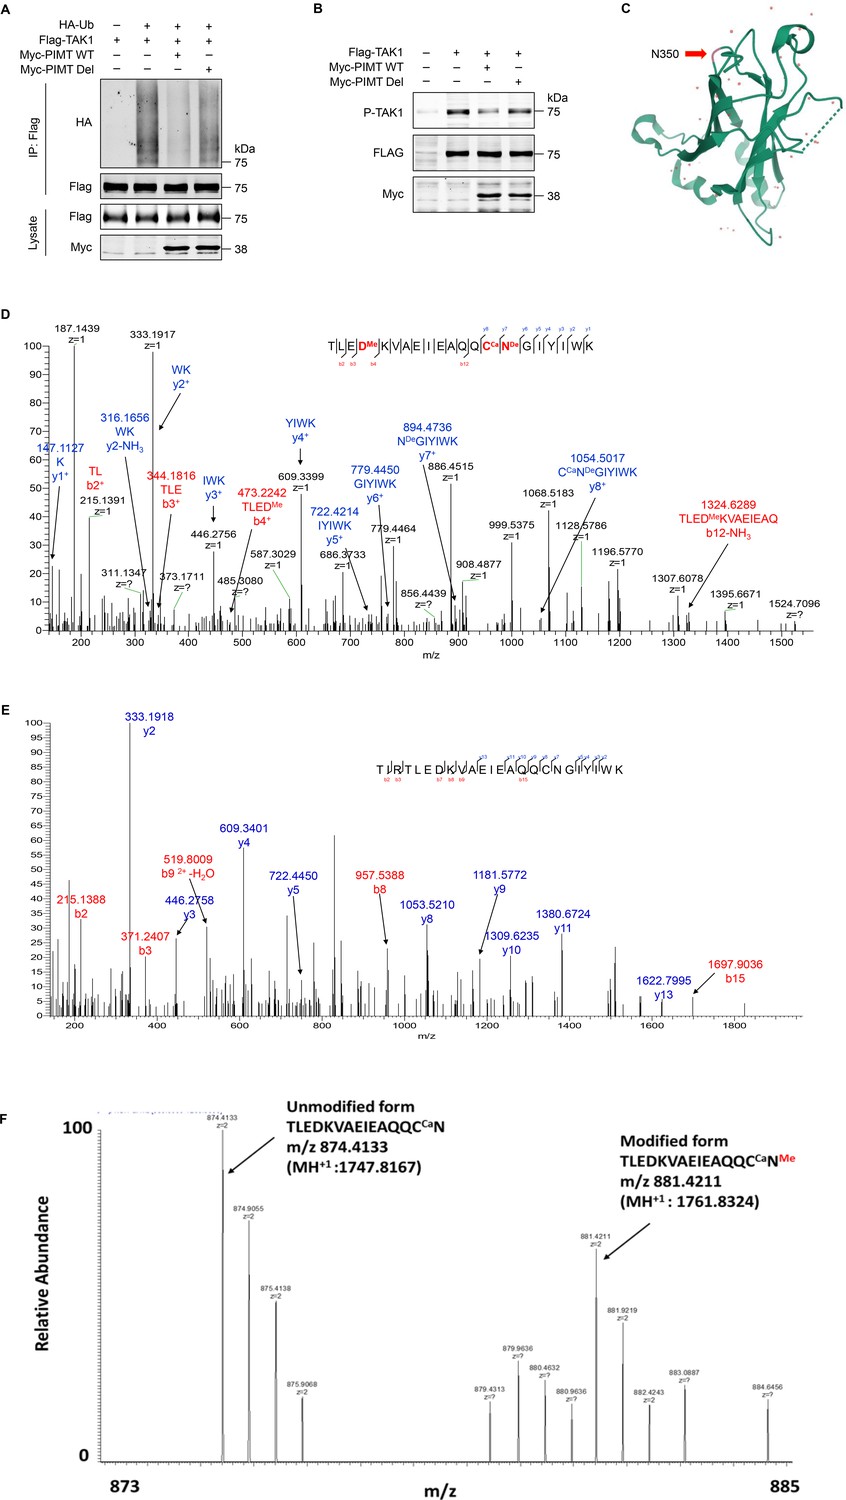
PIMT suppresses TAK1 ubiquitination and phosphorylation.
(A) HEK-293T cells were transfected with HA-ubiquitin (HA-Ub) and Flag-TAK1 in the presence of Myc-tagged wild-type (WT) or mutant PIMT (PIMT Del). 48 hr after transfection, cells were collected for immunoprecipitation using anti-Flag antibody and ubiquitination of TAK1 was detected by western blot using anti-HA antibody. (B) EA.hy926 were transfected with indicated TAK1 and PIMT expressing vectors. 48 hr after transfection, western blot was performed to detect TAK1 phosphorylation. (C) Apo structure of C-terminal human TRAF6 indicating the location of N350. (D) Liquid chromatography and mass spectrometry (LC-MS/MS) analysis of TARF6 ∆N domain. Mass tolerance window of the fragment ions is set within 0.02 Da. Ca, carbamidomethyl. Me, methyl. De, deamidated. Manually assigned MS/MS spectra of TLED (methyl) KVAEIEAQQC (carbamidomethyl) N (deamidated) GIYWK generated from sh-Ctrl cells. D339 methylation and N350 deamidation were detected. (E) Manually assigned MS/MS spectra of TIRTLEDKVAEIEAQQCNGIYIWK detected from PIMT knockdown cells. Methylation of D339 and N350 was not detected. (F) Relative intensity of the unmodified and asparagine methylated TLEDKVAEIEAQQC(ca)N in control knockdown cells.
-
Figure 4—figure supplement 1—source data 1
Effect of PIMT on TAK1 ubiquitination.
- https://cdn.elifesciences.org/articles/85754/elife-85754-fig4-figsupp1-data1-v1.zip
-
Figure 4—figure supplement 1—source data 2
Effect of PIMT on TAK1 phosphorylation.
- https://cdn.elifesciences.org/articles/85754/elife-85754-fig4-figsupp1-data2-v1.zip
Figure 5 with 2 supplements
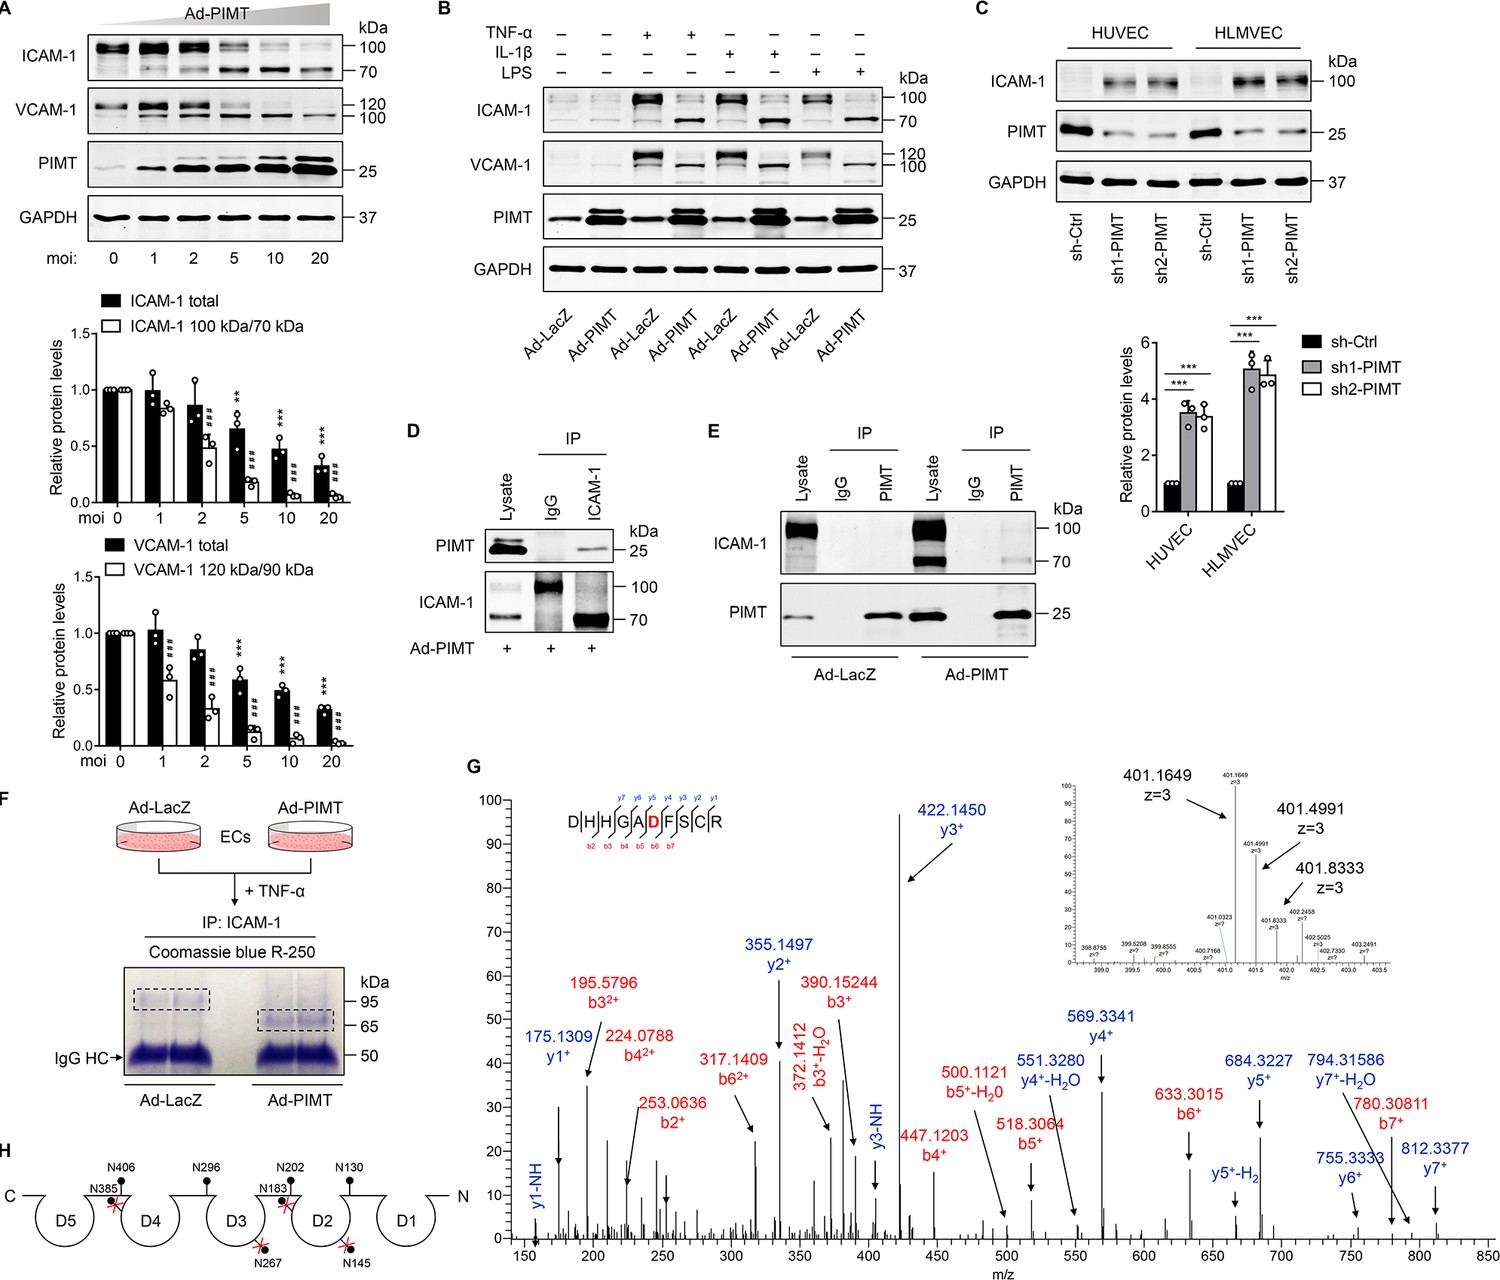
PIMT attenuates ICAM-1 expression and N-linked glycosylation in ECs.
(A) Human umbilical vein endothelial cells (HUVECs) were transduced with increasing dosages of Ad-PIMT for 48 hr and then stimulated with TNF-α (10 ng/ml) for 12 hr. Expression of ICAM-1 and VCAM-1 was determined by western blot. Total protein levels of ICAM-1 and VCAM-1 and the ratio of high molecular weight (HMW) bands to lower molecular weight (LMW) bands were quantitated at different mois (normalized to GAPDH), n=3. **p<0.01, ***p<0.001, compared with the corresponding ICAM-1 or VCAM1 expression at moi of 0. # # #p<0.001, compared with the corresponding the ratio of HMW bands to LMW bands of ICAM-1 or VCAM-1 at moi of 0, two-way ANOVA coupled with Tukey’s post hoc test. (B) HUVECs transduced with indicated adenoviruses were exposed to TNF-α (10 ng/ml), IL-1β (20 ng/ml), or LPS (1 μg/ml) for 12 hr, and expression of ICAM-1 and VCAM-1 was detected by western blot. (C) HUVECs and human lung microvascular endothelial cells (HLMVECs) were transfected with lentivirus expressing control shRNA (sh-Ctrl) or PIMT RNAs (sh1-PIMT or sh2-PIMT) for 72 hr, and expression of ICAM-1 was detected by western blot and quantitated by densitometric analysis. ***p<0.001, one-way ANOVA coupled with Tukey’s post hoc test, n=3. (D) HUVECs were transduced with Ad-PIMT (moi = 10) for 48 hr and then treated with TNF-α (10 ng/ml) for 12 hr. Immunoprecipitation was performed using anti-ICAM-1 antibody, followed by western blot to detect the interaction of ICAM-1 with PIMT. (E) HUVECs were transduced with Ad-PIMT (moi = 5) for 48 hr and then treated with TNF-α (10 ng/ml) for 12 hr. Immunoprecipitation was performed using anti-PIMT antibody, followed by western blot to detect the interaction of PIMT with ICAM-1. (F) Workflow in gel preparation of ICAM-1 from ECs for liquid chromatography and mass spectrometry (LC-MS/MS) analysis. Coomassie Blue R-250 staining showed LMW ICAM-1 immunoprecipitated from HUVECs transduced with Ad-PIMT. (G) Precursor ion peaks corresponding to two charged spectra, the m/z of the monoisotopic peak was exactly matched to the theoretical m/z (401.1649, z=3; above). Manually assigned MS/MS spectra of ICAM-1 peptide from PIMT overexpressed HUVECs (below). One representative spectrum is shown to exemplify the N-glycosite change. The asparagine (Asn) site was detected as aspartate (Asp). (H) Schematic demonstration of the N-glycosites of ICAM-1 (shown as lollipop patterns). Identified deamidated residuals were marked with red crosses.
-
Figure 5—source data 1
Effect of PIMT on ICAM-1 and VCAM-1 expression.
- https://cdn.elifesciences.org/articles/85754/elife-85754-fig5-data1-v1.zip
-
Figure 5—source data 2
Effect of PIMT on ICAM-1 and VCAM-1 expression in response to different inflammatory stimuli.
- https://cdn.elifesciences.org/articles/85754/elife-85754-fig5-data2-v1.zip
-
Figure 5—source data 3
Effect of PIMT knockdown on ICAM-1 expression.
- https://cdn.elifesciences.org/articles/85754/elife-85754-fig5-data3-v1.zip
-
Figure 5—source data 4
Interaction of PIMT with ICAM-1.
- https://cdn.elifesciences.org/articles/85754/elife-85754-fig5-data4-v1.zip
-
Figure 5—source data 5
Interaction of PIMT with low molecular weight ICAM-1.
- https://cdn.elifesciences.org/articles/85754/elife-85754-fig5-data5-v1.zip
Figure 5—figure supplement 1
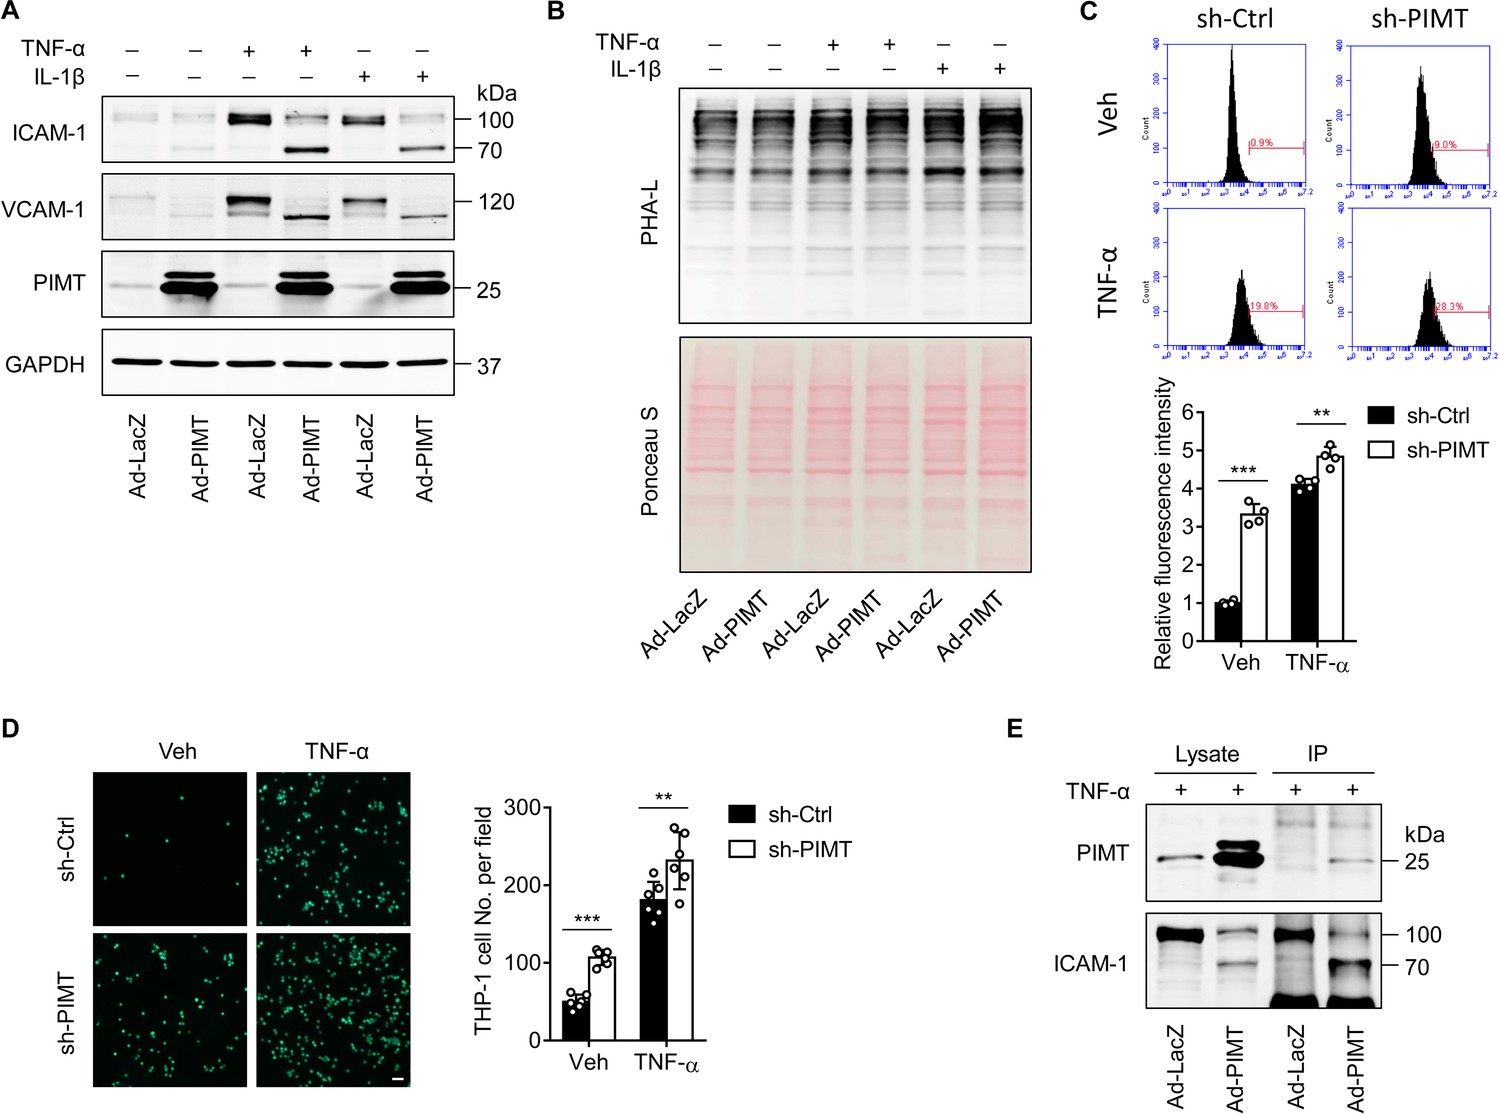
PIMT attenuates ICAM-1 expression in ECs.
(A) HIAECs(Human iliac artery endothelial cells) were transduced Ad-LacZ or Ad-PIMT (moi = 10) for 48 hr and the treated with TNF-α (10 ng/ml) or IL-1β (20 ng/ml) for 12 hr. Levels of ICAM-1 and VCAM1 were determined by western blot. (B) Human umbilical vein endothelial cells (HUVECs) were transduced with Ad-LacZ or Ad-PIMT (moi = 10) for 48 hr and then treated with indicated cytokine. Cell lysate was collected for biotinylated Phaseolus vulgaris leucoagglutinin (PHA-L) staining, followed by fluorescence labeled streptavidin incubation. Ponceau S staining reveals the total levels of loaded proteins. (C) HUVECs were transduced with lentivirus expressing the control shRNA (sh-Ctrl) or PIMT shRNAs (sh1-PIMT or sh2-PIMT) for 60 hr and then stimulated with either vehicle or TNF-α (1 ng/ml) for 12 hr. Expression of ICAM-1 on the surface of HUVECs was determined by flow cytometric analysis. (D) HUVECs transduced with indicated lentivirus expressing shRNAs were stimulated with TNF-α (1 ng/ml) for 12 hr and then incubated with calcein-labeled THP-1 cells for additional 1 hr. After washing, attached THP-1 cells were visualized and counted on an inverted fluorescent microscopy (n=6). (E) HUVECs were transduced with LacZ or PIMT adenovirus (moi, 10) and stimulated with TNF-α (10 ng/ml) for 12 hr. Immunoprecipitation using anti-ICAM-1 antibody showing the interaction of PIMT with lower molecular weight (LMW) ICAM-1 in ECs. All data are representative of mean ± SD, **p<0.01, **p<0.01, ***p<0.001, and two-way ANOVA coupled with Tukey’s post hoc test. Bars, 50 μm.
-
Figure 5—figure supplement 1—source data 1
Effect of PIMT on ICAM-1 expression in ECs.
- https://cdn.elifesciences.org/articles/85754/elife-85754-fig5-figsupp1-data1-v1.zip
-
Figure 5—figure supplement 1—source data 2
Interaction of PIMT with lower molecular weight (LMW) ICAM-1 in ECs.
- https://cdn.elifesciences.org/articles/85754/elife-85754-fig5-figsupp1-data2-v1.zip
Figure 5—figure supplement 2
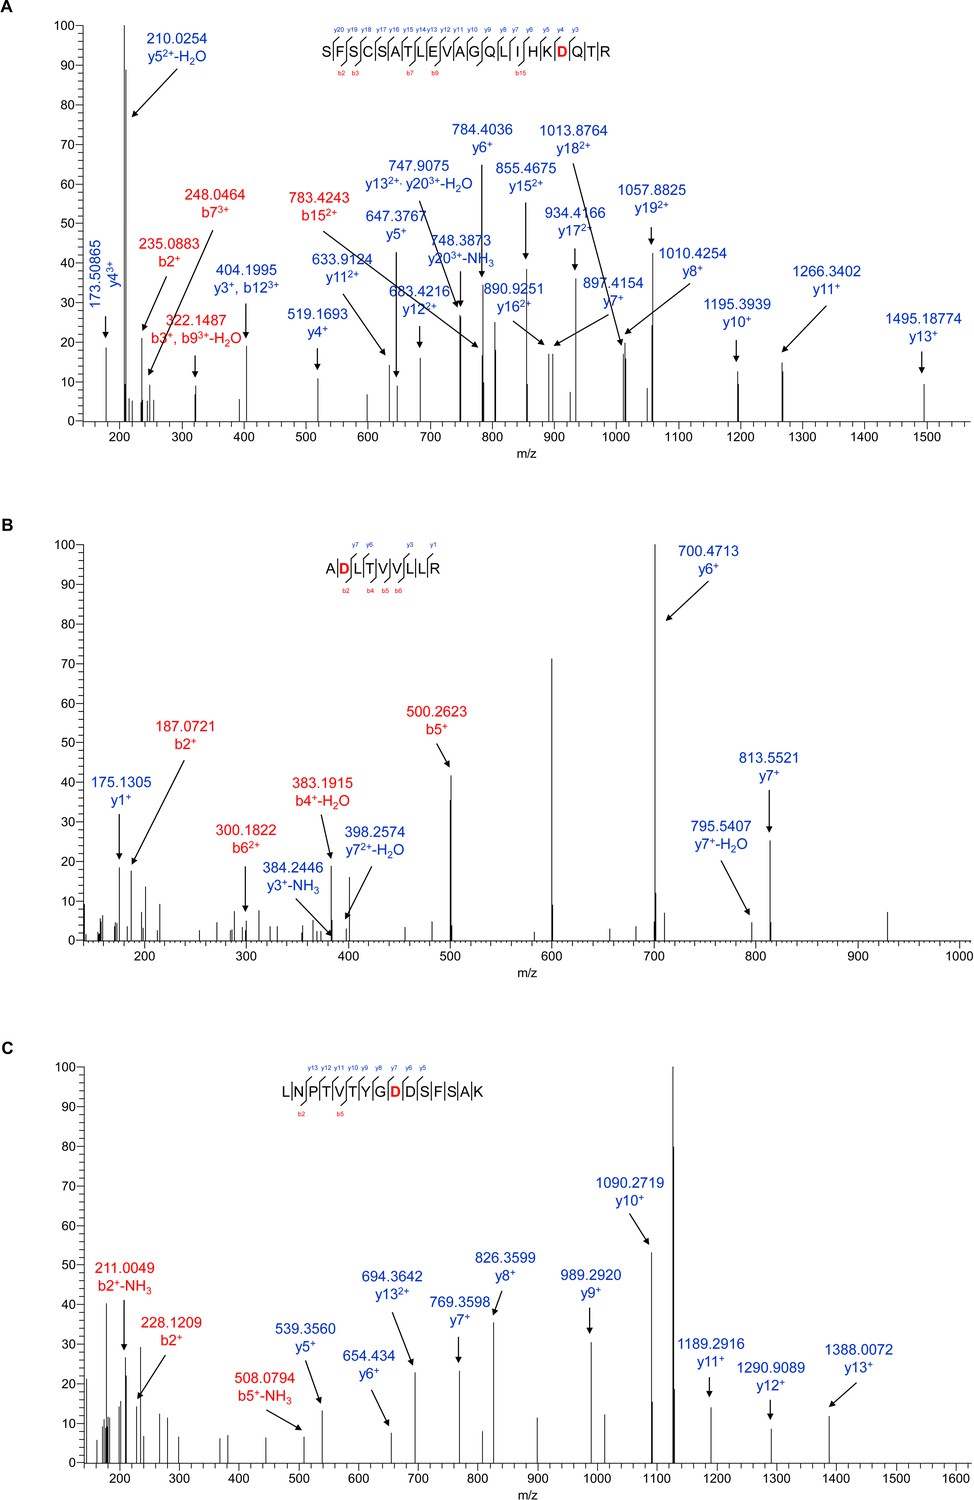
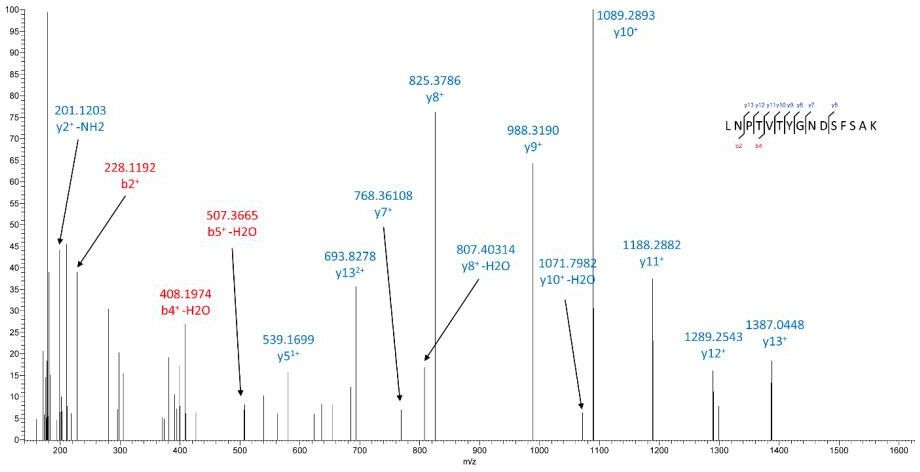
PIMT affects N-linked glycosylation of ICAM-1 at specific Asn sites in ECs.
(A–C) Manually assigned MS/MS spectra of liquid chromatography and mass spectrometry (LC-MS/MS)-based identification of ICAM-1 peptide from PIMT transduced ECs. Mass tolerance window of all fragment ions is set within 0.02 Da.
Figure 6
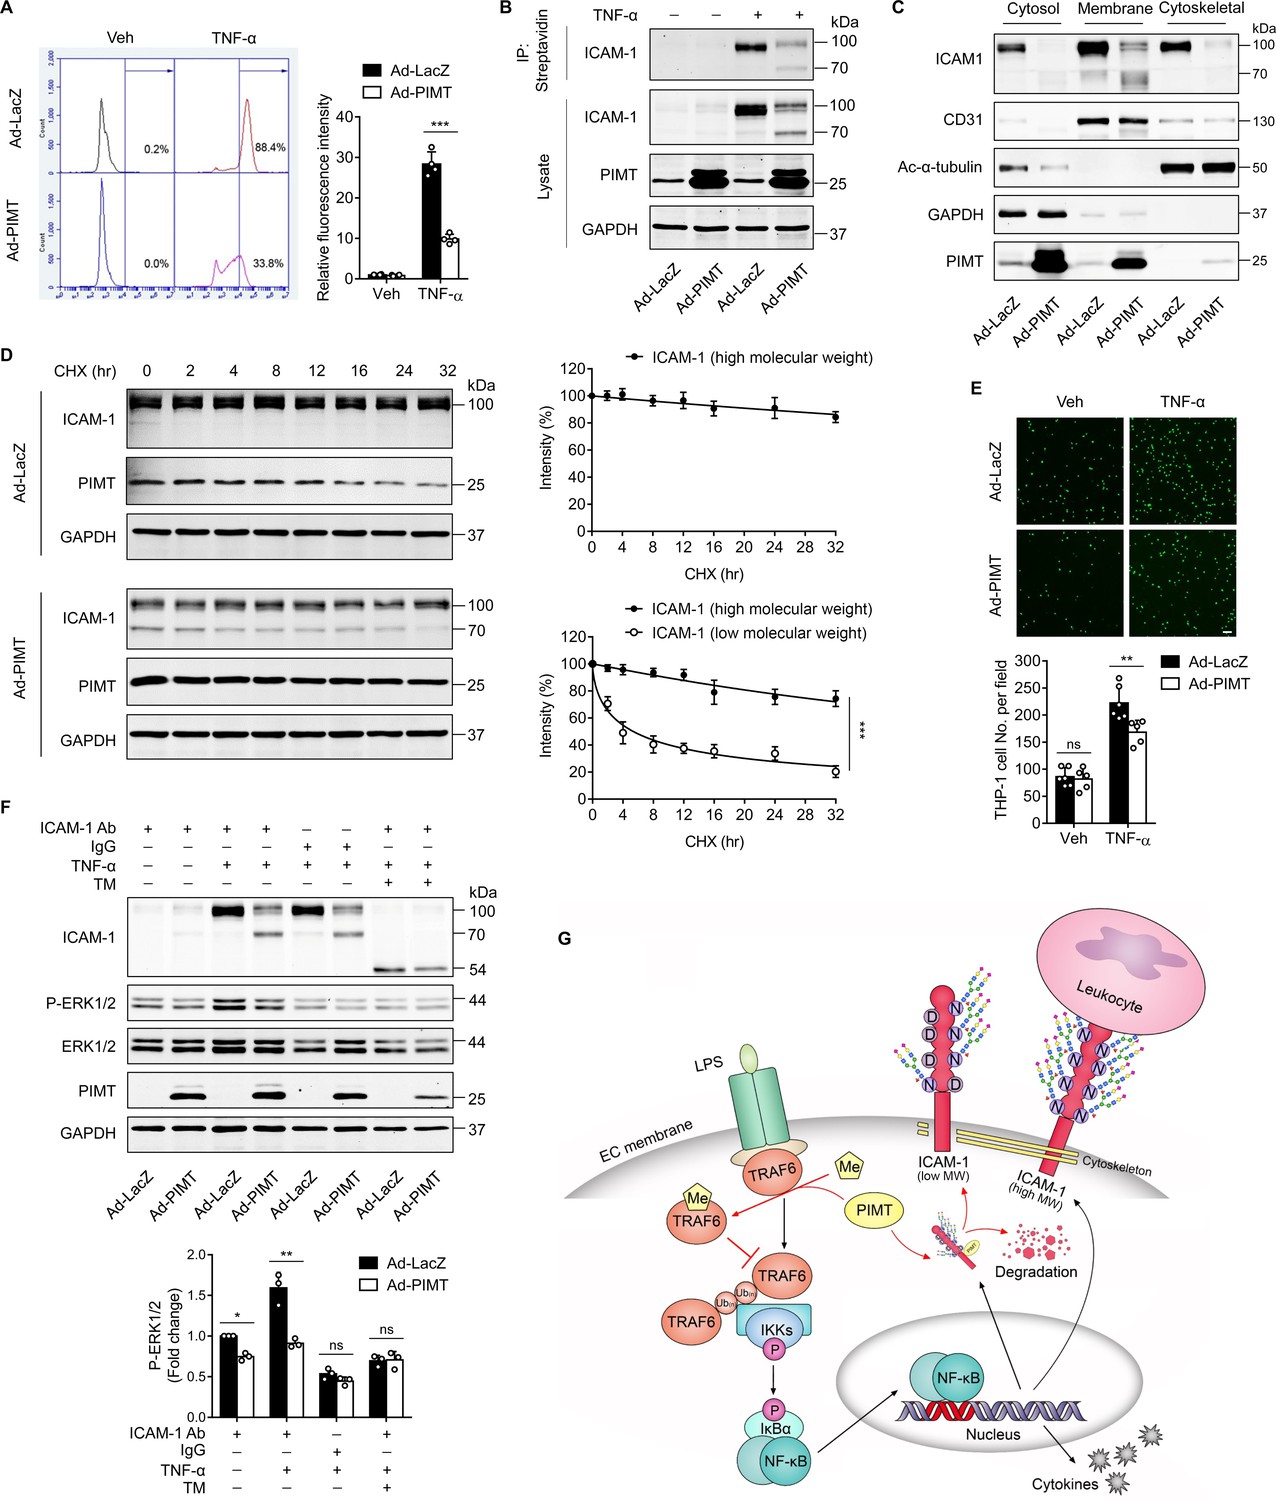
PIMT inhibits ICAM-1-mediated signaling events in ECs.
(A) Human umbilical vein endothelial cells (HUVECs) transduced with indicated adenovirus (moi = 10, 48 hr) were stimulated with either vehicle or TNF-α (10 ng/ml) for 12 hr. Left, expression of ICAM-1 on the surface of HUVECs was labeled by fluorescent antibody and determined by flow cytometry. Right, the statistical summary of fluorescence intensity. ***p<0.001, two-way ANOVA coupled with Tukey’s post hoc test, and n=4. (B) HUVECs were transduced with Ad-LacZ or Ad-PIMT (moi = 10) for 48 hr and then stimulated with TNF-α (10 ng/ml) for 12 hr and labeled with biotin. Precipitation was performed using streptavidin agarose beads, followed by western blot to detect the cell surface ICAM-1. (C) Western blot of ICAM-1 in different cellular fractions. HUVECs were fractionated after indicated virus transduction (moi, 10) and TNF-α (10 ng/ml, 12 hr) incubation. GAPDH, CD31, and acetyl-α-tubulin were used as cytosol, membrane, and cytoskeleton markers, respectively. (D) HUVECs were transduced with Ad-LacZ or Ad-PIMT (moi = 5, 48 hr) and stimulated with TNF-α (10 ng/ml) for 12 hr to induce both ICAM-1 bands, then subjected to the treatment with 10 μM cycloheximide (CHX) for indicated intervals. The half-life of ICAM-1 was determined by western blot (n=3), ***p<0.001, unpaired two-sided t test. (E) HUVECs transduced with adenovirus expressing LacZ or PIMT were stimulated with TNF-α (10 ng/ml, 12 hr) and then incubated with calcein-AM-labeled THP-1 for additional 1 hr. After washing, attached THP-1 cells were visualized and counted on an inverted fluorescent microscopy (n=6), **p<0.01, and two-way ANOVA coupled with Tukey’s post hoc test. Bars, 50 μm. (F) HUVECs pre-incubated with or without tunicamycin (TM, 2.5 µM) for 1 hr were exposed to indicated treatments and then subjected for ICAM-1 ligation using anti-ICAM-1 antibody followed by secondary antibody incubation. IgG were used as a negative cross-linking control. Phosphorylated and total ERK1/2 were determined by western blot and quantified by densitometric analysis (n=3), *p<0.05, **p<0.01, and two-way ANOVA coupled with Tukey’s post hoc test. (G) Schematic diagram of suppressing LPS-stimulated endothelial activation by PIMT.
-
Figure 6—source data 1
Effect of PIMT on the membrane expression of ICAM-1.
- https://cdn.elifesciences.org/articles/85754/elife-85754-fig6-data1-v1.zip
-
Figure 6—source data 2
Effect of PIMT on the levels of ICAM-1 in different cellular fractions.
- https://cdn.elifesciences.org/articles/85754/elife-85754-fig6-data2-v1.zip
-
Figure 6—source data 3
Effect of PIMT on ICAM-1 protein stability.
- https://cdn.elifesciences.org/articles/85754/elife-85754-fig6-data3-v1.zip
-
Figure 6—source data 4
Effect of PIMT on ERK1/2 activation after ICAM-1 ligation.
- https://cdn.elifesciences.org/articles/85754/elife-85754-fig6-data4-v1.zip
Author response image 1
Author response image 2
Tables
Key resources table
| Reagent type (species) or resource | Designation | Source or reference | Identifiers | Additional information |
|---|---|---|---|---|
| Genetic reagent (M. musculus) | B6;129S4-Pcmt1tm1Scl/J | The Jackson Laboratory | #023343 | |
| Genetic reagent (M. musculus) | C57BL/6J | The Jackson Laboratory | #000664 | |
| Cell line (Homo-sapiens) | HUVEC | Gibco | C0155C | |
| Cell line (Homo-sapiens) | HLMVEC | Lonza | CC-2527 | |
| Cell line (Homo-sapiens) | HEK-293T | ATCC | CRL-3216 | |
| Cell line (Homo-sapiens) | EA.hy926 | ATCC | CRL-2922 | |
| Cell line (Homo-sapiens) | THP-1 | ATCC | TIB-202 | |
| Cell line (Homo-sapiens) | HEK-293 | ATCC | CRL-1573 | |
| Antibody | Rabbit polyclonal anti-PCMT1 | ABclonal | A6684 | IF (1:200), IP (1:100) WB (1:1000) |
| Antibody | Rabbit polyclonal anti-TRAF6 | ABclonal | A0973 | IP (1:100) WB (1:1000) |
| Antibody | Rabbit polyclonal anti-ICAM-1 | ABclonal | A5597 | IP (1:100) FCM (1:200) WB (1:1000) |
| Antibody | Rabbit polyclonal anti- phospho-TAK1-T187 | ABclonal | AP1222 | WB (1:1000) |
| Antibody | Rabbit polyclonal anti-HA | ABclonal | AE036 | WB (1:1000) |
| Antibody | Rat monoclonal anti-PECAM1 | BD Pharmingen | 550274 | IF (1:200) |
| Antibody | Mouse monoclonal anti-Flag | Sigma-Aldrich | F3165 | WB (1:2000) |
| Antibody | Mouse monoclonal anti-HA | Sigma-Aldrich | H9658 | WB (1:2000) |
| Antibody | Mouse monoclonal anti-c-Myc | Sigma-Aldrich | C3956 | WB (1:2000) |
| Antibody | Rabbit polyclonal anti-GAPDH | Proteintech | 10494–1-AP | WB (1:1000) |
| Antibody | Rabbit polyclonal anti- Tubulin | Proteintech | 11224–1-AP | WB (1:1000) |
| Antibody | Rabbit polyclonal anti- TRAF6 | Proteintech | 66498–1-Ig | WB (1:1000) |
| Antibody | Rabbit monoclonal anti- p65 | CST | #8242 | IF (1:200) WB (1:1000) |
| Antibody | Rabbit monoclonal anti- phospho-IKKα/β | CST | #2697 | WB (1:1000) |
| Antibody | Rabbit monoclonal anti- IKKβ | CST | #8943 | WB (1:1000) |
| Antibody | Rabbit monoclonal anti- phospho-IκBα | CST | #2859 | WB (1:1000) |
| Antibody | Rabbit polyclonal anti- IκBα | CST | #9242 | WB (1:1000) |
| Antibody | Rabbit monoclonal anti- phospho-Erk1/2 | CST | #4370 | WB (1:1000) |
| Antibody | Rabbit monoclonal anti- Erk1/2 | CST | #4695 | WB (1:1000) |
| Antibody | Rabbit monoclonal anti- acetyl-α-Tubulin | CST | #5335 | WB (1:1000) |
| Antibody | Rabbit polyclonal anti- Lamin A/C | Santa Cruz | sc-20681 | WB (1:1000) |
| Antibody | Rabbit polyclonal anti- ICAM-1 | Santa Cruz | sc-7891 | WB (1:1000) |
| Antibody | Mouse monoclonal anti- VCAM1 | Santa Cruz | sc-13160 | WB (1:1000) |
| Antibody | Mouse monoclonal anti-PCMT1 | Santa Cruz | sc-100977 | WB (1:1000) |
| Antibody | Mouse monoclonal anti-GAPDH | Santa Cruz | sc-32233 | WB (1:2000) |
| Antibody | Donkey polyclonal anti-Rabbit | LI-COR | 926–68073 | IRDye 680RD, WB (1:10000) |
| Antibody | Goat polyclonal anti-Mouse | LI-COR | 926–32210 | IRDye 800CW, WB (1:10000) |
| Antibody | Donkey polyclonal anti-mouse | Invitrogen | A21202 | Alexa Flour 488, IF (1:1000) |
| Antibody | Donkey polyclonal anti-rat | Invitrogen | A21208 | Alexa Flour 488, IF (1:1000) |
| Antibody | Goat polyclonal anti-rabbit | Invitrogen | A21428 | Alexa Flour 555, IF (1:1000) |
| Antibody | Goat polyclonal anti-rabbit | Invitrogen | A32733 | Alexa Flour 647, FCM (1:1000) |
| Recombinant DNA reagent | pFLAG-CMV-2-PIMT | PMID:23647599 | ||
| Recombinant DNA reagent | pcDNA3-FLAG-TRAF6 | Addgene | #66929 | |
| Recombinant DNA reagent | pcDNA3-FLAG-TRAF2 | Addgene | #66931 | |
| Recombinant DNA reagent | pcDNA-FLAG-IKKβ | Addgene | #23298 | |
| Recombinant DNA reagent | FLAG-IKKβ-S177E/S181E | Addgene | #11105 | |
| Recombinant DNA reagent | HA-Ubiquitin | Addgene | #18712 | |
| Recombinant DNA reagent | pLKO-PIMT | Sigma-Aldrich | TRCN0000036401, TRCN0000036403 | |
| Recombinant DNA reagent | pLKO-TRAF6 | Sigma-Aldrich | TRCN0000007348 | |
| Recombinant DNA reagent | pLKO-non target control | Sigma-Aldrich | SHC016 | |
| Peptide, recombinant protein | Human TNF-α | PeproTech | 300–01 A | |
| Peptide, recombinant protein | Human IL-1β | PeproTech | 200-01B | |
| Commercial assay or kit | Mouse TNF-α ELISA | R&D | DY-410 | |
| Commercial assay or kit | Mouse IL-6 ELISA | R&D | DY-406 | |
| Commercial assay or kit | Mouse Ccl2 ELISA | R&D | DY-479 | |
| Chemical compound and drug | CellTracker | Invitrogen | C2925 | |
| Chemical compound and drug | DAPI | Invitrogen | D1306 | |
| Chemical compound and drug | LPS | Santa Cruz | sc-3535 | |
| Chemical compound and drug | Cycloheximide | Sigma-Aldrich | 01810 | |
| Chemical compound and drug | Anti-FLAG M2 Magnetic Beads | Sigma-Aldrich | M8823 | |
| Chemical compound and drug | Protein standards | Bio-Rad | #1610374 | |
| Chemical compound and drug | Protein standards | Genscript | M00624 |
Additional files
Download links
A two-part list of links to download the article, or parts of the article, in various formats.
Downloads (link to download the article as PDF)
Open citations (links to open the citations from this article in various online reference manager services)
Cite this article (links to download the citations from this article in formats compatible with various reference manager tools)
PIMT is a novel and potent suppressor of endothelial activation
eLife 12:e85754.
https://doi.org/10.7554/eLife.85754


