A descending inhibitory mechanism of nociception mediated by an evolutionarily conserved neuropeptide system in Drosophila
- Graduate School of Life and Environmental Sciences, University of Tsukuba, Japan
- Faculty of Advanced Engineering, Tokyo University of Science, Katsushika-ku, Japan
- College of Life and Environmental Sciences, University of Tsukuba, Japan
- Center for Development of Advanced Medicine for Dementia, National Center for Geriatrics and Gerontology, Japan
- Graduate School of Life Sciences, Tohoku University, Japan
- Faculty of Life and Environmental Sciences, University of Tsukuba, Japan
Figures
Figure 1 with 1 supplement
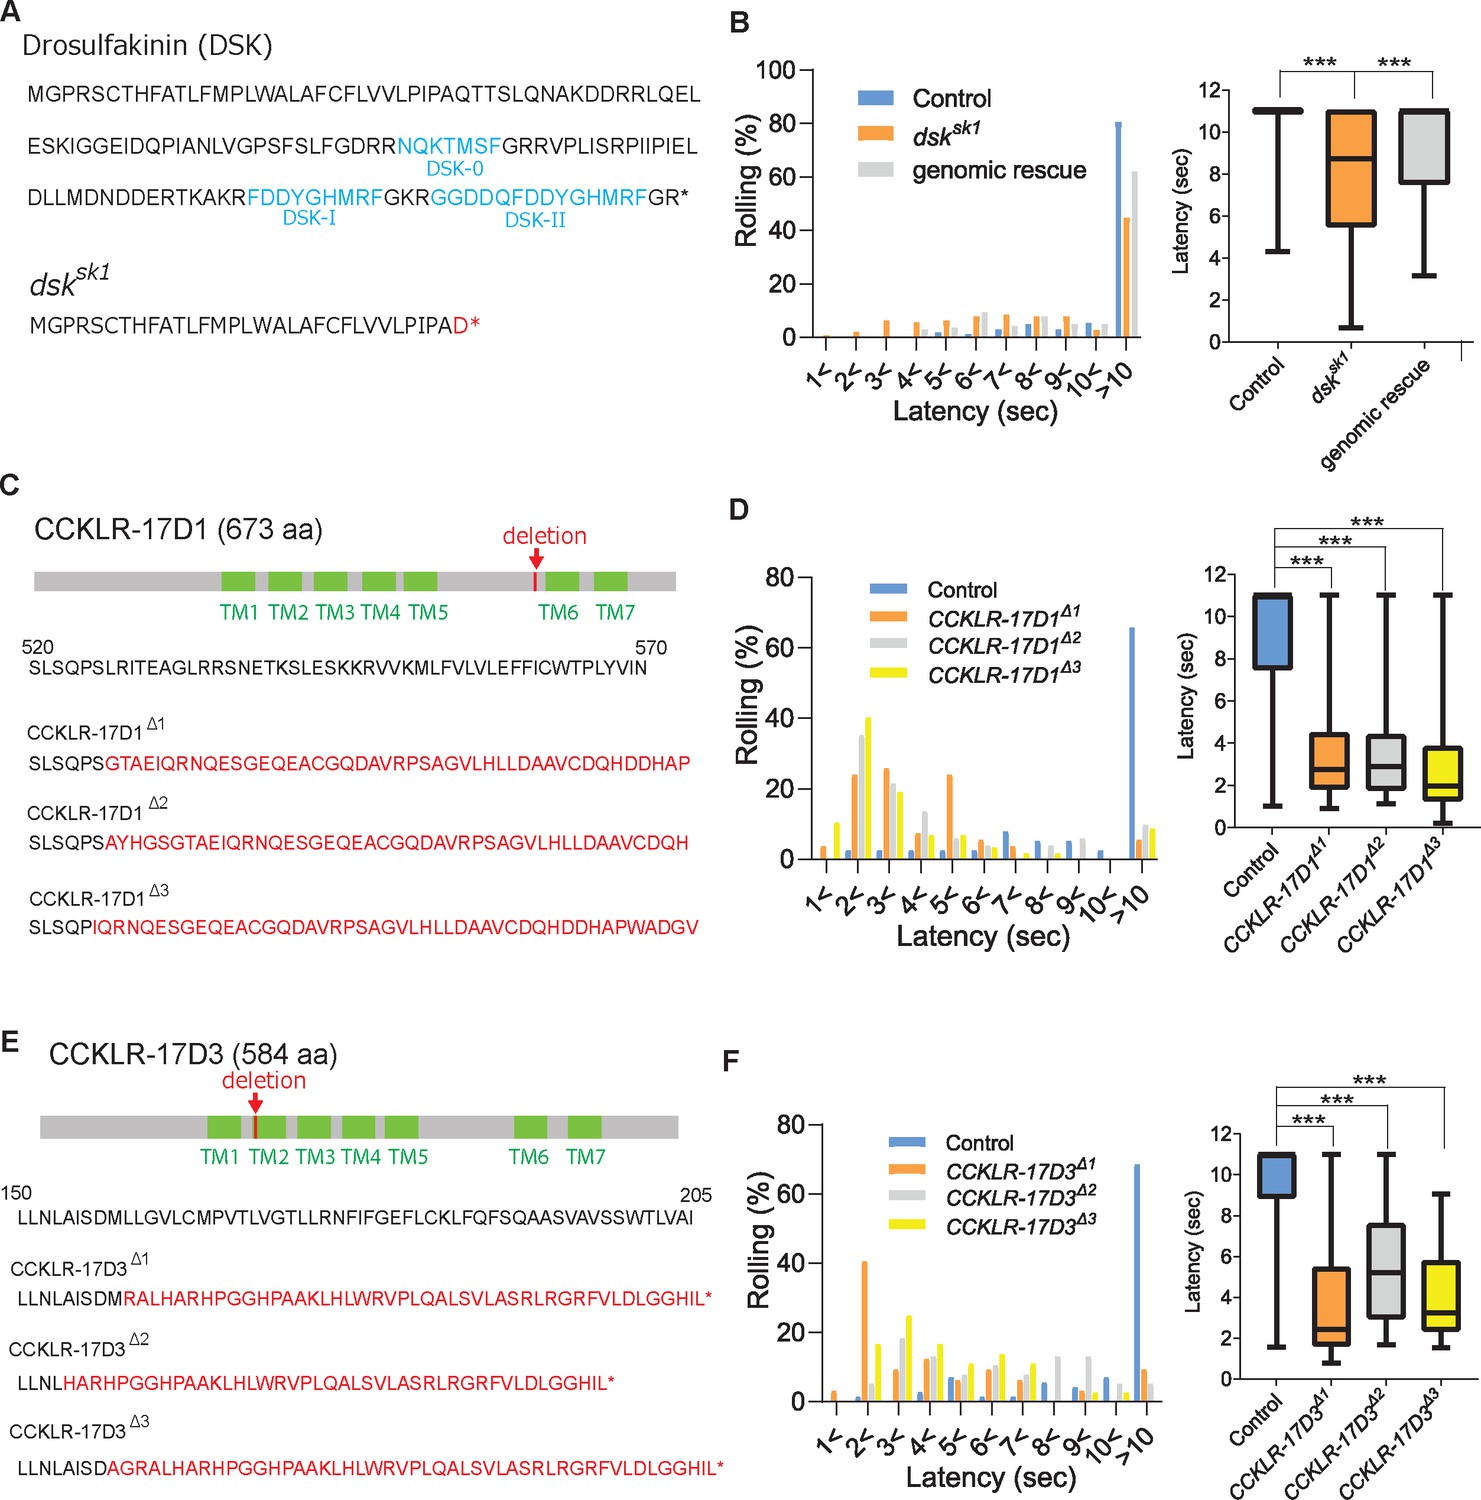
DSK signaling is involved in negatively regulating nociception.
(A) Predicted amino acid sequences of pro-DSK peptide in the wild-type (top) and dsksk1 mutants (bottom). Due to a 5-base deletion at the +94–99 position in the coding sequence, dsksk1 mutants are predicted to produce a largely truncated pro-DSK peptide unable to be processed to active DSK peptides. Red letters represent residues different from the wild-type and asterisks indicate stop codons. (B) Hypersensitivity of dsksk1 mutants to a 42 °C thermal probe. Significantly shortened latencies of dsksk1 mutants (n=143) compared with the controls (n=164) were recovered in genomic rescue animals (Dp(3;1)2-2; dsksk1, n=139). (Left) Histograms (Right) Box plots of latencies. *** p<0.001 Steel’s test. (C) Predicted amino acid sequence of CCKLR-17D1 in the wild-type and CCKLR-17D1 mutants. CCKLR-17D1Δ1, CCKLR-17D1Δ2, and CCKLR-17D1Δ3 have 17-base (+1573–1589), 2-base (+1575–1576) and 32-base (+1573–1604) deletions in the coding sequence respectively, which result in large frameshifts completely abolishing the sixth and seventh transmembrane domains (TMs). (D) CCKLR-17D1Δ1 (n=54), CCKLR-17D1Δ2 (n=51) and CCKLR-17D1Δ3 mutants (n=57) all showed significantly shorter latencies than control (n=38). (Left) Histograms (Right) Box plots of latencies. *** p<0.001 Steel’s test. (E) Predicted amino acid sequence of CCKLR-17D3 in the wild-type and CCKLR-17D3 mutants. CCKLR-17D3Δ1, CCKLR-17D3Δ2, and CCKLR-17D3Δ3 possess 8-base (+474–481), 32-base (+457–488), and 5-base (+472–476) deletions in the coding sequence respectively, which result in large frameshifts and truncation in the middle of the second TM. (F) CCKLR-17D3Δ1 (n=32), CCKLR-17D3Δ2 (n=38), and CCKLR-17D3Δ3 mutants (n=36) all exhibited significantly shorter latencies than control (n=70). (Left) Histograms (Right) Box plots of latencies. *** p<0.001 Steel’s test. All box plots show median (middle line) and 25th to 75th percentiles with whiskers indicating the smallest to the largest data points.
-
Figure 1—source data 1
Source data used to generate the summary data and graphs shown in Figure 1 and Figure 1—figure supplement 1.
- https://cdn.elifesciences.org/articles/85760/elife-85760-fig1-data1-v1.xlsx
Figure 1—figure supplement 1
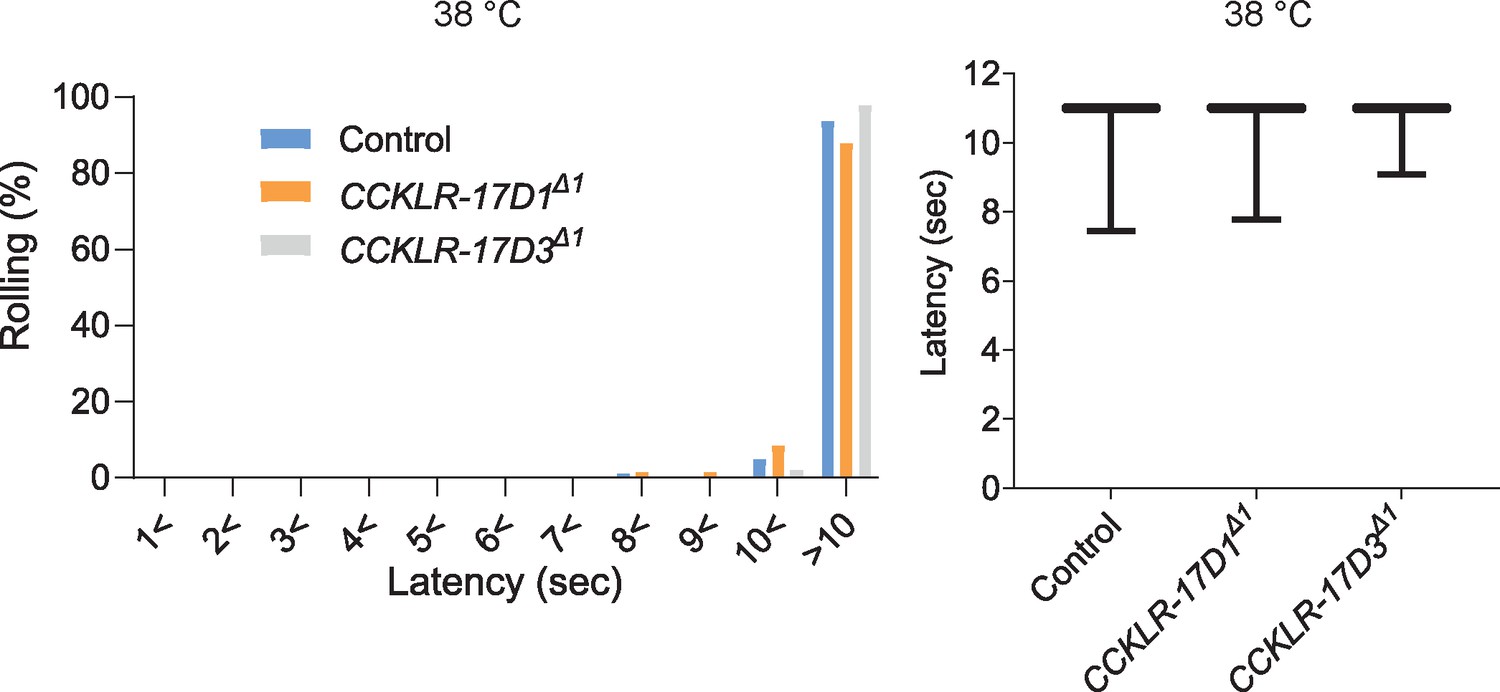
Thermal nociceptive thresholds in DSK receptor mutants are largely normal.
Thermal responses of CCKLR-17D1 and CCKLR-17D3 mutants to a 38 °C probe. Both CCKLR-17D1Δ1 (n=58) and CCKLR-17D3Δ1 (n=48) showed comparable distributions of responding latencies to the controls (yw, n=79). Box plots show median (middle line) and 25th to 75th percentiles with whiskers indicating the smallest to the largest data points. p>0.4 Steel’s test.A schematic model of the DSKergic descending inhibitory pathway of nociception in larval Drosophila.
Figure 2 with 1 supplement
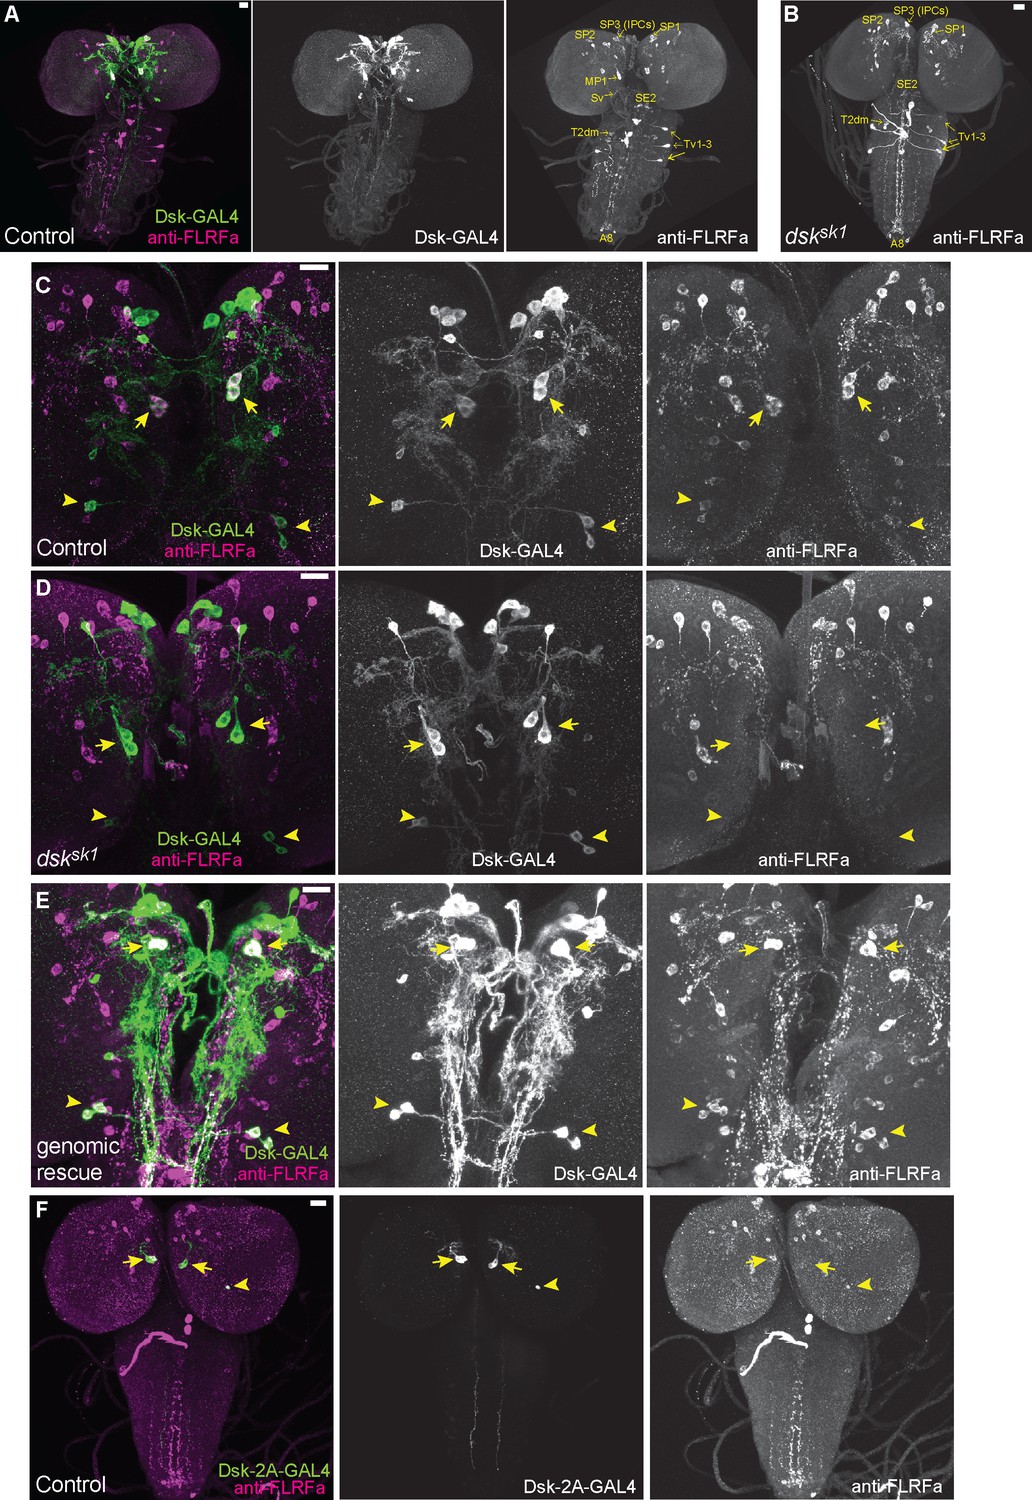
DSK is expressed in two groups of larval brain neurons.
(A) Representative image of DSK-GAL4 expression and anti-FLRFa staining in the wild-type larval CNS. (B) Representative image of anti-FLRFa staining in dsksk1 larval CNS. (C) Representative images of DSK-GAL4 expression and anti-FLRFa staining in the control larval brains. Arrows and arrowheads indicate MP1 and Sv neurons, respectively. Co-expressions of DSK-GAL4 and anti-FLRFa were observed in MP1 and Sv in all of the examined samples (n=27/27), but in IPCs only in 7% (n=2/27). (D) Representative images of DSK-GAL4 expression and anti-FLRFa staining in the dsksk1 larval brains. Arrows and arrowheads indicate MP1 and Sv neurons, respectively. (E) Representative images of DSK-GAL4 expression and anti-FLRFa staining in the larval brains of the genomic rescue genotype (Dp(3;1)2-2/Y; +/lexA-rCD2::RFP UAS-mCD8::GFP; dsksk1 DSK-GAL4/dsksk1). Arrows and arrowheads indicate MP1 and Sv neurons, respectively. (F) An example image showing the expression of DSK-2A-GAL4, a 2A-GAL4 knock-in line of the dsk gene, more faithfully recapitulating its endogenous expression. Arrows and arrowheads indicate MP1 and Sv neurons, respectively. MP1 neurons were labeled in 100% of DSK-2AGAL4 samples (n=41/41), while a single IPC in 51.2% (n=21/41), multiple IPCs in 24.4% (n=10/41), and Sv neurons in 17.1% (n=7/41) of examined samples. All scale bars represent 20 µm.
Figure 2—figure supplement 1
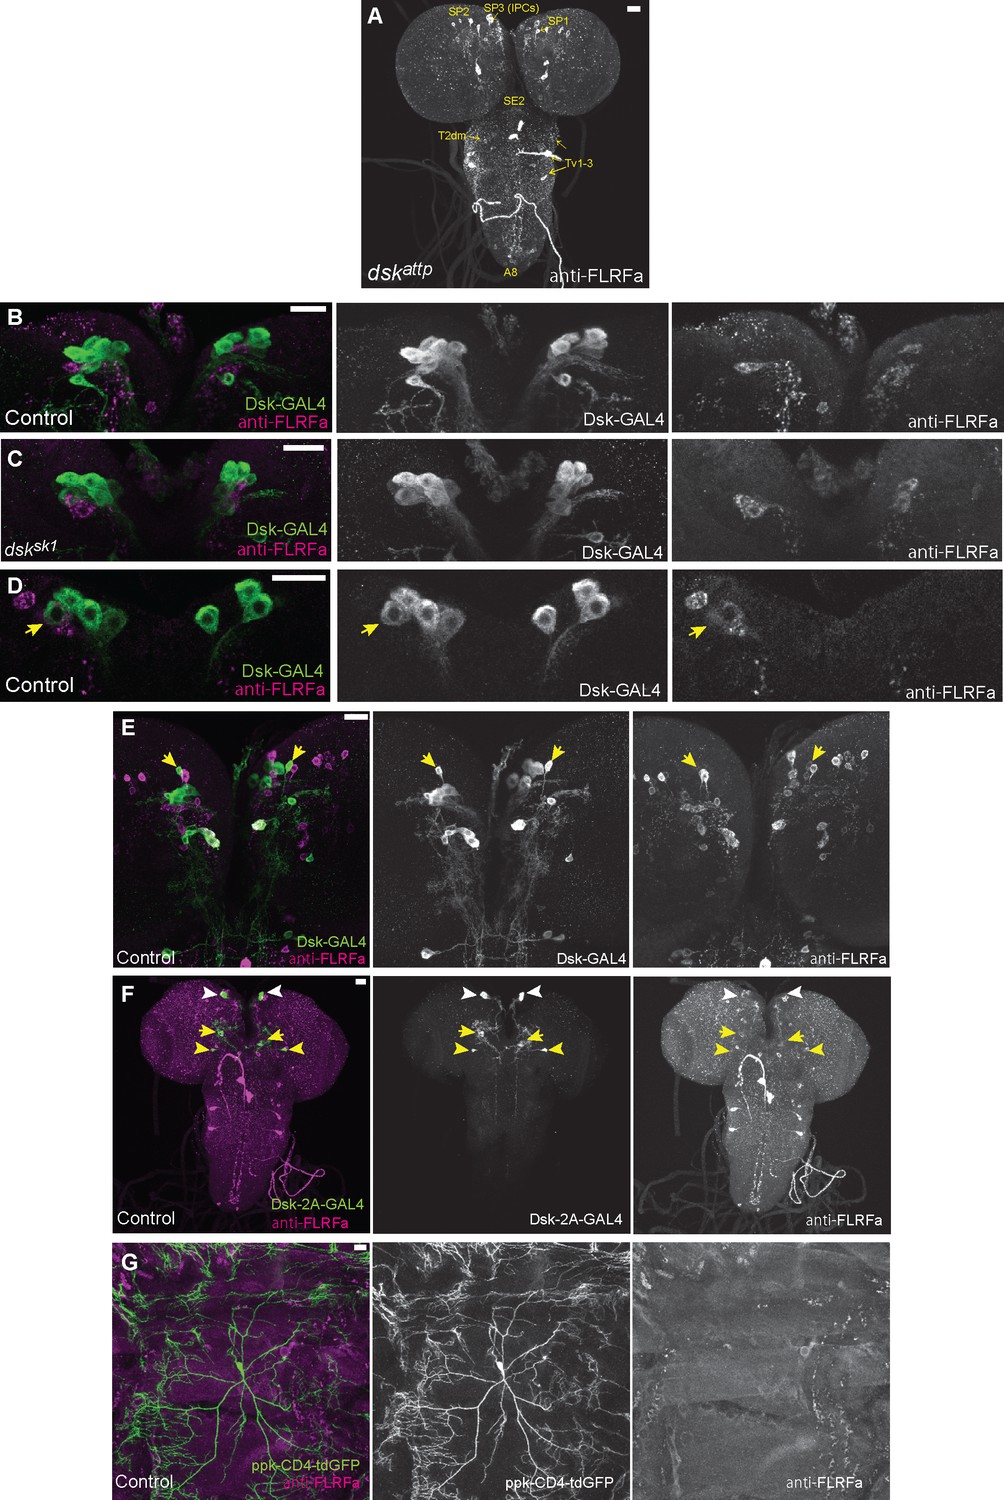
DSK expressions in the other brain neurons and peripheral sensory neurons.
(A) Representative image showing staining of anti-FLRFa in dskattp mutants. The staining patterns were indistinguishable from dsksk1 mutants. (B) Representative image showing staining patterns of DSK-GAL4 and anti-FLRFa in the wild-type larval IPCs. In the wild-type brain, typically 4–7 IPCs are visualized by DSK-GAL4 and 1–3 by anti-FLRFa consistently to the previous study by Söderberg et al., 2012 that used anti-DSK raised by Nichols and Lim, 1996 In contrast, few IPCs co-labelled were found, which is also somewhat consistent with the variability of DSK immunostaining in IPCs reported by the previous study (Söderberg et al., 2012). (C) Representative image showing staining patterns of DSK-GAL4 and anti-FLRFa in the dsksk1 larval IPCs. Comparable staining patterns of DSK-GAL4 and anti-FLRFa were observed in the mutant IPCs. (D) An example of rare IPC that was co-labeled by DSK-GAL4 and anti-FLRFa in the wild-type brain (arrow). (E) Representative image showing SP1 neurons (arrows) that were rarely co-labeled by DSK-GAL4 and anti-FLRFa. Note that faint anti-FLRFa staining was only detected in the SP1 neuron in the right hemisphere. (F) An example image showing DSK-2A-GAL4 expression in IPCs (white arrowheads), MP1 (yellow arrows), and Sv neurons (yellow arrowheads). (G) Representative image showing double-labeling of Class IV md neurons (ppk-CD4::tdGFP) and anti-FLRFa staining in the dorsal larval body wall. All scale bars represent 20 µm.
Figure 3 with 1 supplement
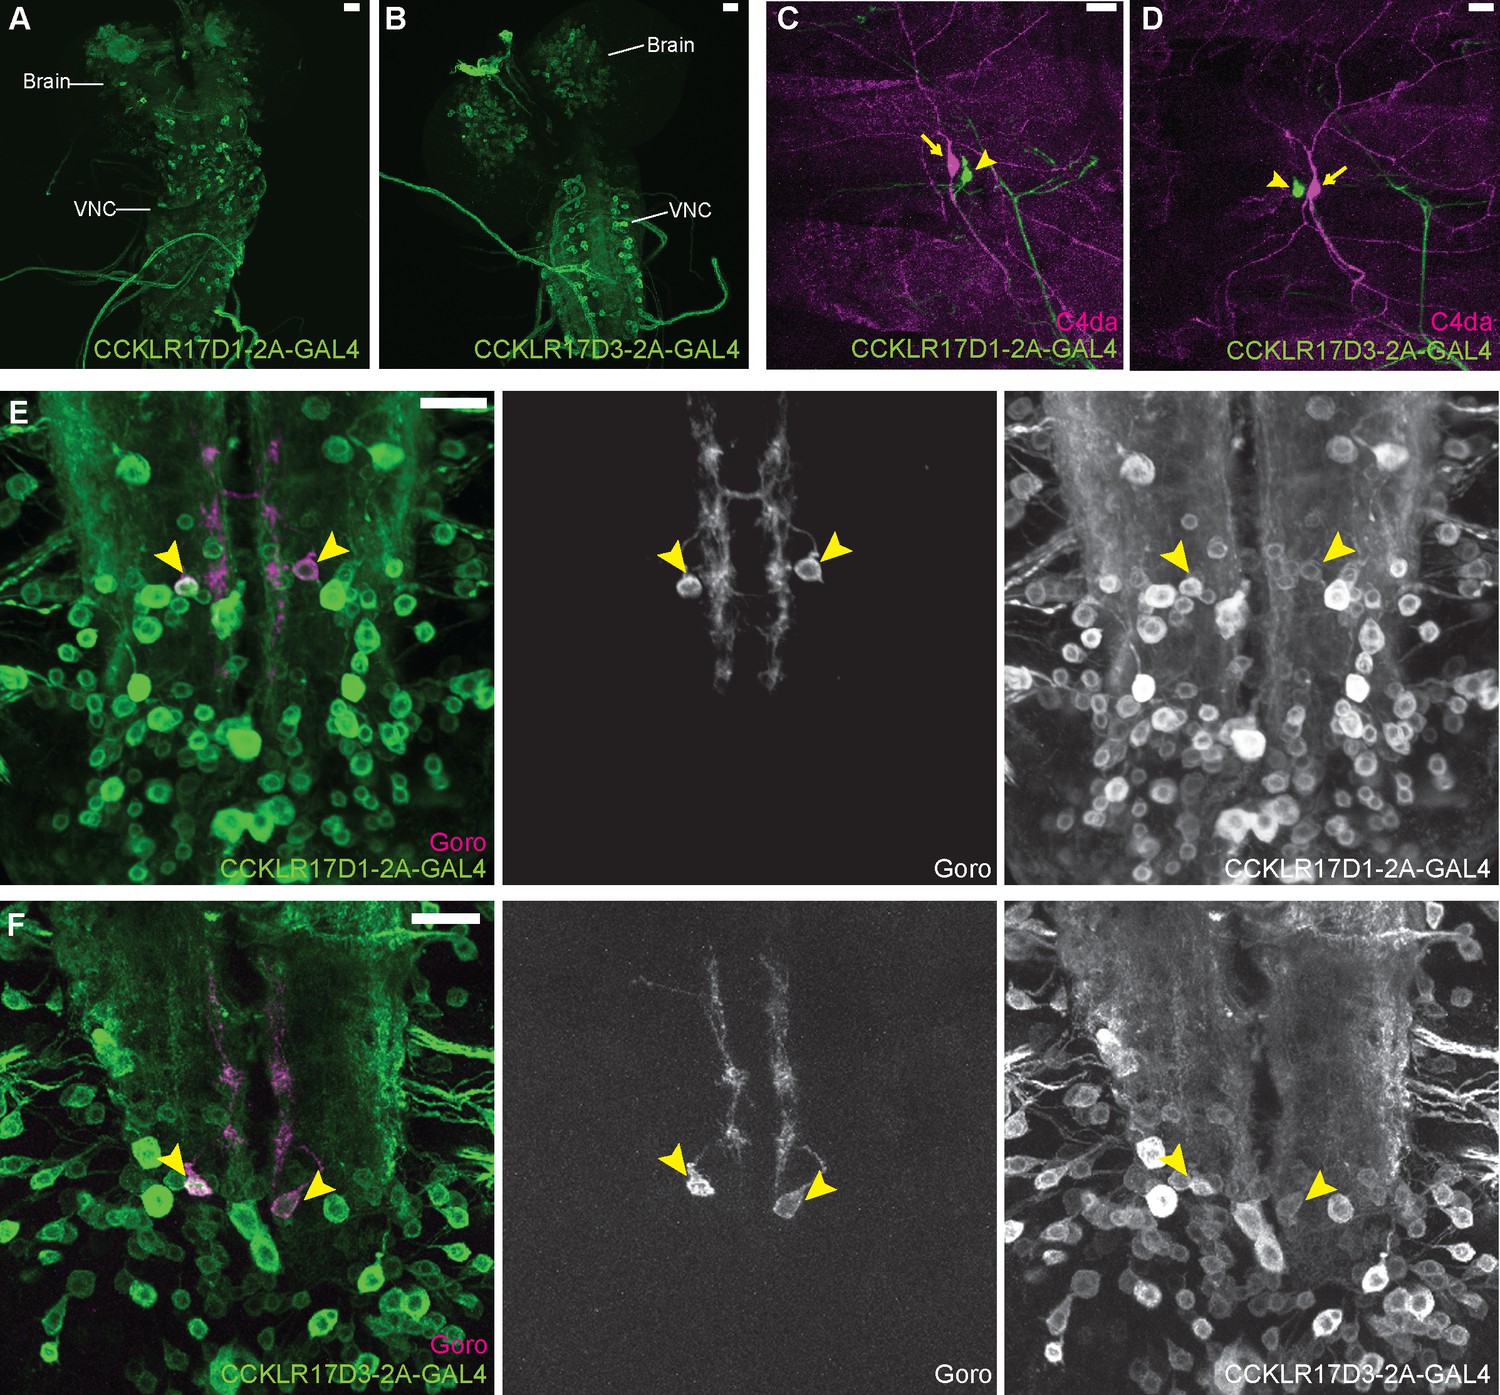
DSK receptors are expressed in Goro neurons in the larval VNC.
(A and B) Representative images of CCKLR-17D1-T2A-GAL4 (A) and CCKLR-17D3-T2A-GAL4 (B) expressions in the larval CNS. (C and D) Representative images showing double-labeling of CCKLR-17D1-T2A-GAL4 (C) and CCKLR-17D3-T2A-GAL4 (D) with C4da nociceptors (R38A10-lexA). Arrows and arrowheads indicate cell bodies of C4da nociceptors and es cells, respectively. (E and F) Representative images showing double-labeling of CCKLR-17D1-T2A-GAL4 (E) and CCKLR-17D3-T2A-GAL4 (F) with Goro neurons (arrowheads, R69E06-lexA). Expression patterns were confirmed in multiple samples (n=7 and 5). All scale bars represent 20 µm.
Figure 3—figure supplement 1
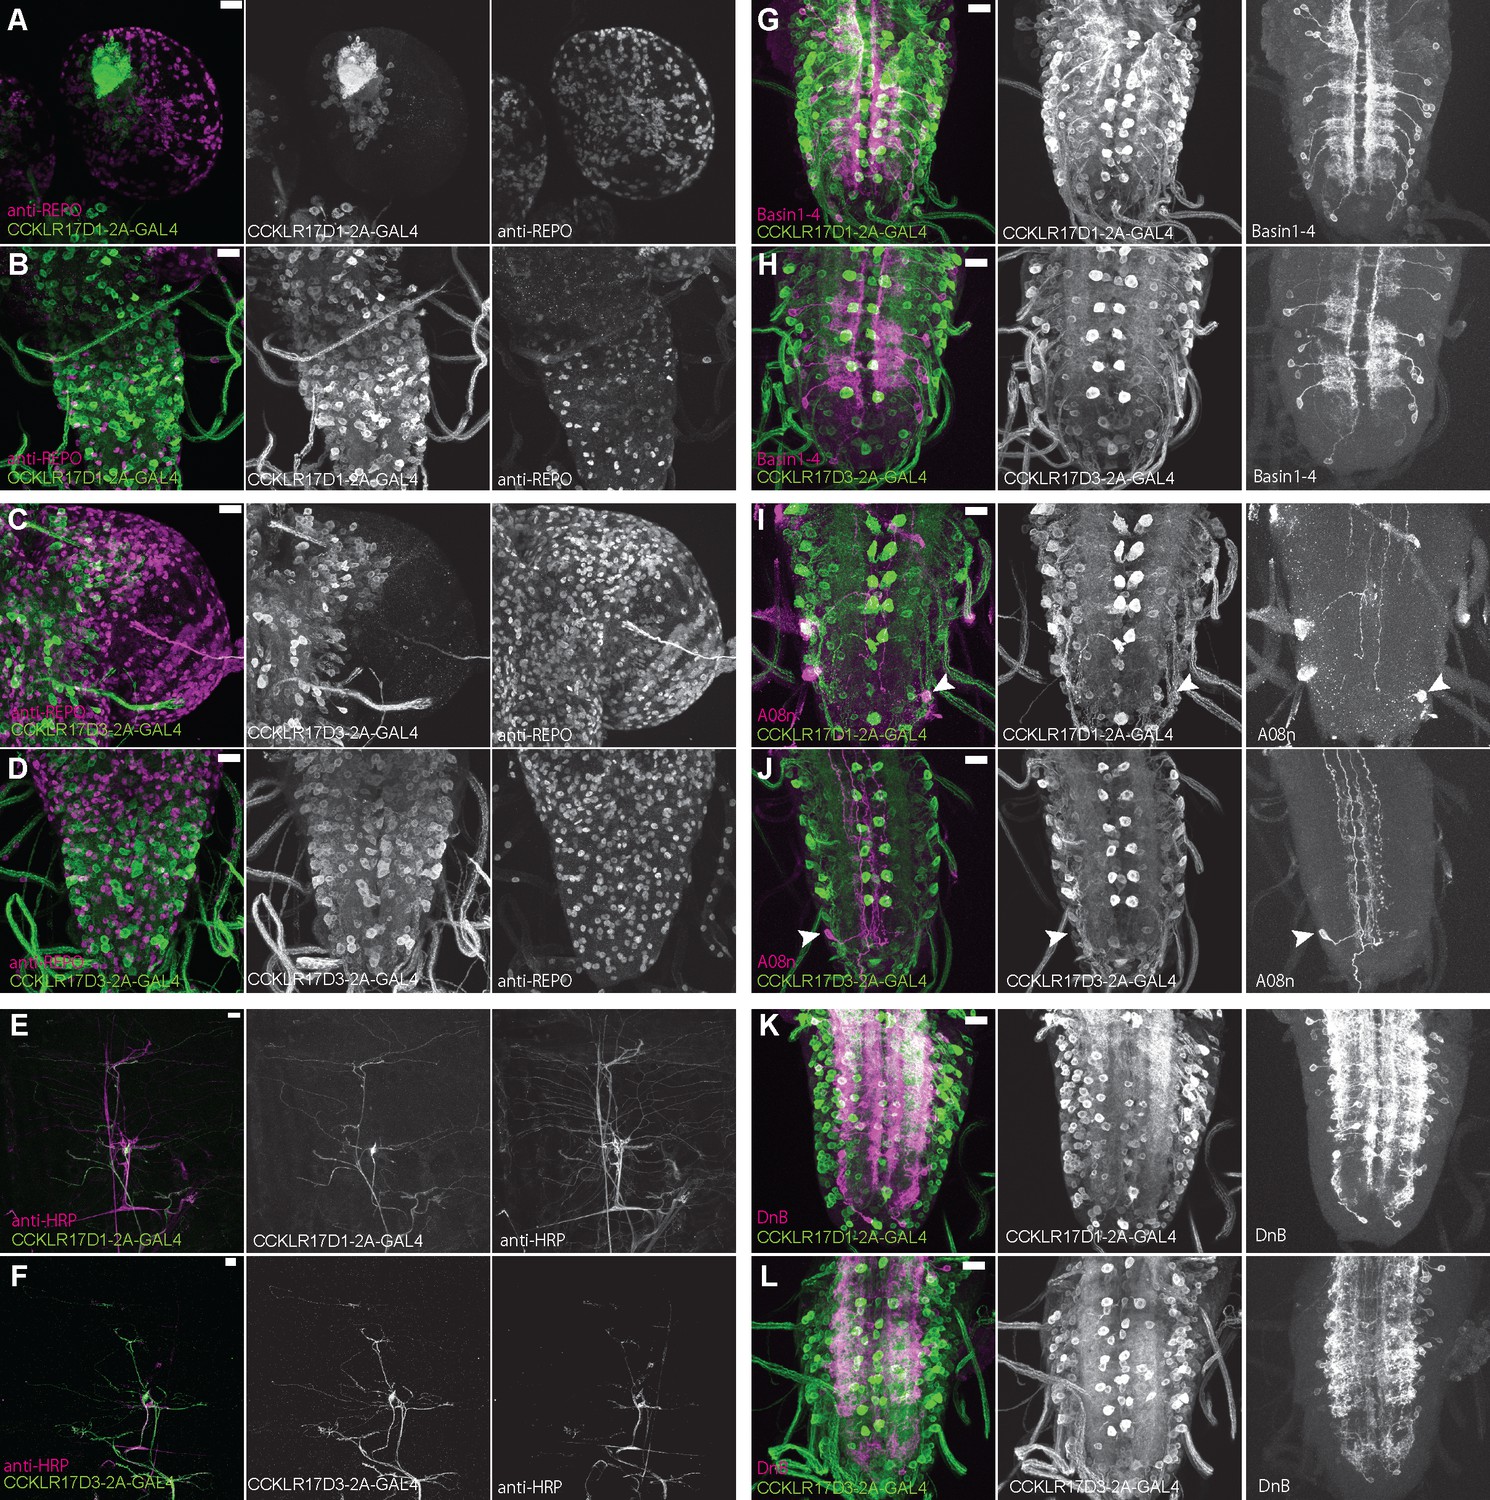
Expression patterns of DSK receptors in larval glial cells, peripheral tissue, and nociceptive interneurons.
(A and B) Representative images showing double-labeling of CCKLR-17D1-T2A-GAL4 and a glial cell marker anti-REPO in the larval brain (A) and the larval VNC (B), representing little expressions of CCKLR-17D1-T2A-GAL4 in glial cells. (C and D) Representative images showing double-labeling of CCKLR-17D3-T2A-GAL4 and a glial cell marker anti-REPO in the larval brain (C) and in the larval VNC (D), representing little expressions of CCKLR-17D3-T2A-GAL4 in glial cells. (E and F) Representative images showing the expressions of CCKLR-17D1-T2A-GAL4 (E) and CCKLR-17D3-T2A-GAL4 (F) with a peripheral neuronal marker anti-HRP in the larval body wall, showing the absence of both GAL4s from peripheral sensory neurons other than es cells. (G and H) Expressions of CCKLR-17D1-T2A-GAL4 (G) and CCKLR-17D3-T2A-GAL4 (H) were negligible in Basin1 to 4 neurons labeled by R72F11-lexA in the larval VNC. (I and J) Negligible expression of CCKLR-17D1-T2A-GAL4 (I) and CCKLR-17D3-T2A-GAL4 (J) found in A08n neurons labeled by R82E12-lexA (arrowheads) in the larval VNC. (K and L) Expressions of CCKLR-17D1-T2A-GAL4 (K) and CCKLR-17D3-T2A-GAL4 (L) were negligible in DnB neurons labeled by R70F01-lexA in the larval VNC. All scale bars represent 20 µm.
Figure 4 with 1 supplement
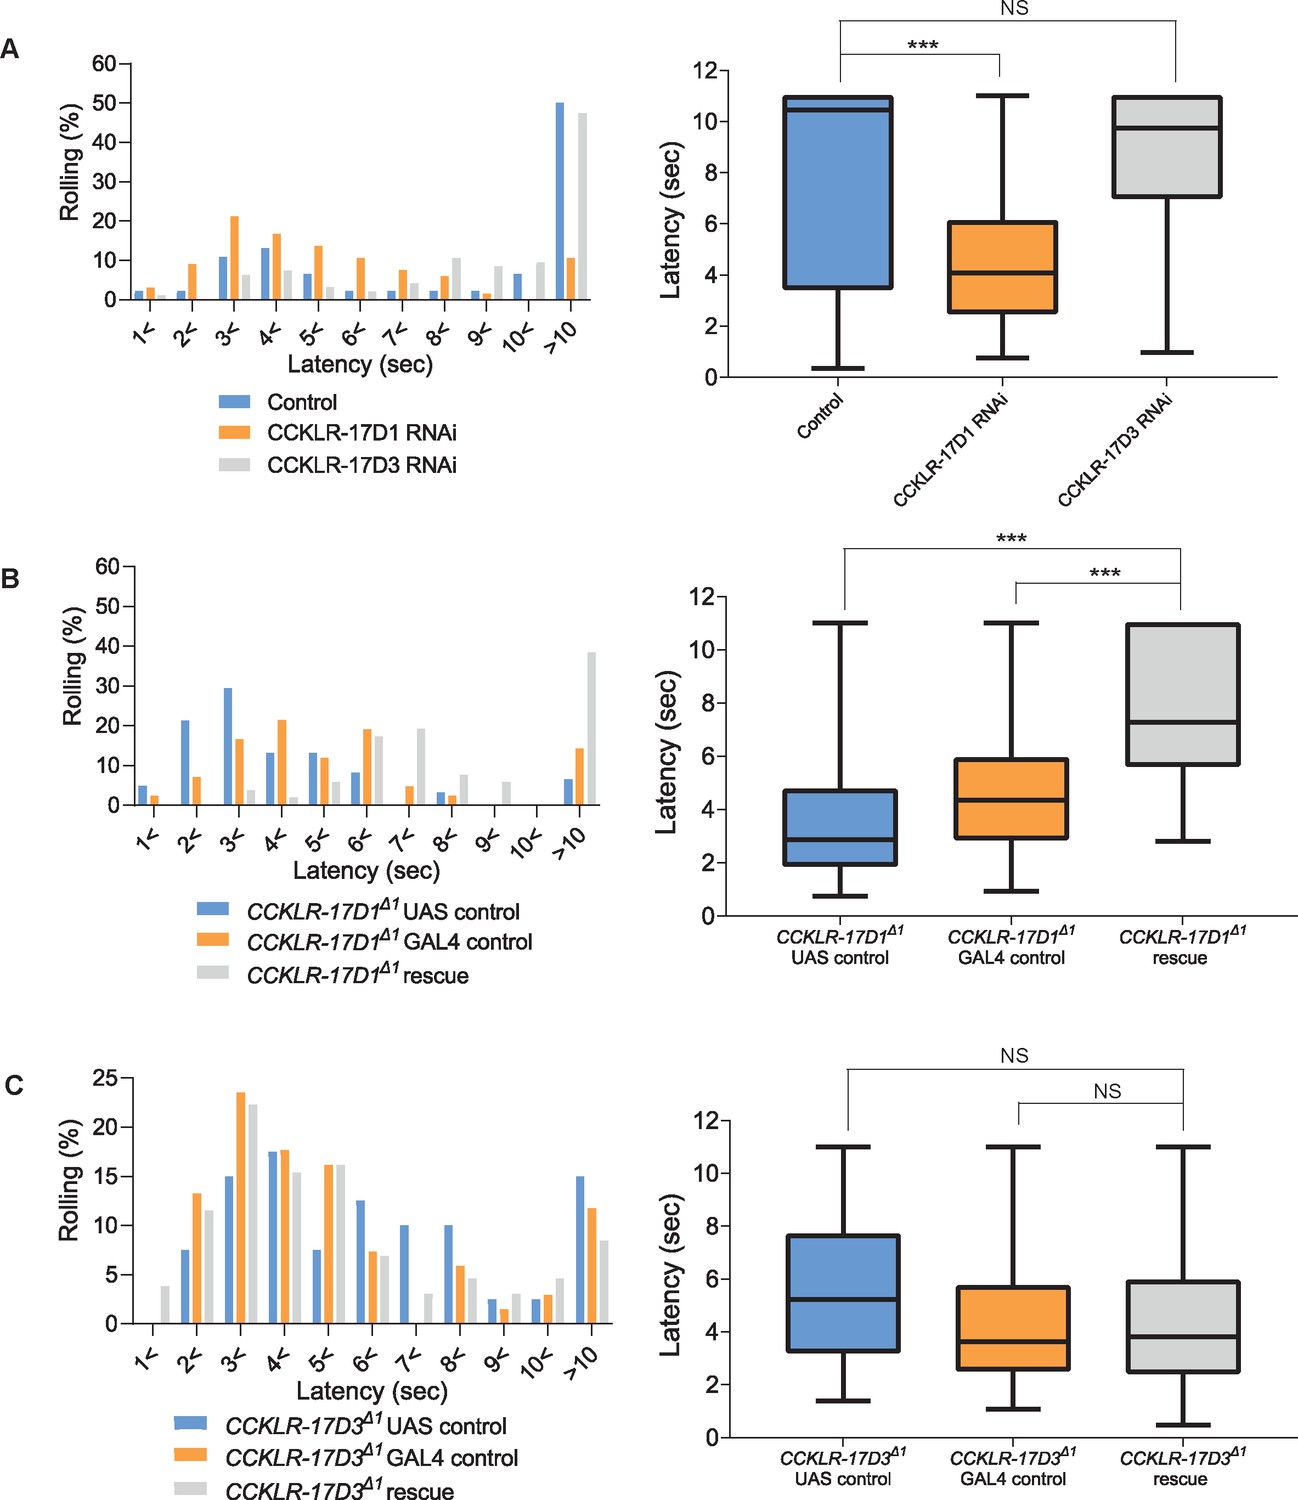
CCKLR-17D1 in Goro neurons is necessary and sufficient for normal thermal nociception.
(A) RNAi of CCKLR-17D1 and CCKLR-17D3 using a Goro-GAL4 line R69E06-GAL4. Expressing CCKLR-17D1 RNAi (R69E06-GAL4 x yv; JF02644, n=66) but not CCKLR-17D3 RNAi (R69E06-GAL4 x yv; JF02968, n=95) with R69E06-GAL4 caused significantly shorter latencies to 42 °C than controls (R69E06-GAL4 x yv; attp2, n=46). (Left) Histograms (Right) Box plots of latencies. *** p<0.001, NS (non-significant) p>0.05 Steel’s test. (B) Rescue of CCKLR-17D1 with R69E06-GAL4. The shortened latencies of CCKLR-17D1Δ1 mutants observed in UAS controls (CCKLR-17D1Δ1; UAS-CCKLR-17D1/+, n=61) or GAL4 controls (CCKLR-17D1Δ1; R69E06-GAL4/+, n=42) were restored in the rescue genotype (CCKLR-17D1Δ1; UAS-CCKLR-17D1/+; R69E06-GAL4/+, n=52). (Left) Histograms (Right) Box plots of latencies. *** p<0.001 Steel’s test. (C) Rescue of CCKLR-17D3 with R69E06-GAL4. The shortened latencies of CCKLR-17D3Δ1 mutants were unaltered in the rescue genotype (CCKLR-17D3Δ1; UAS-CCKLR-17D3/+; R69E06-GAL4/+, n=130) compared with UAS controls (CCKLR-17D3Δ1; UAS-CCKLR-17D3/+, n=40) or GAL4 controls (CCKLR-17D3Δ1; R69E06-GAL4/+, n=68). (Left) Histograms (Right) Box plots of latencies. NS (non-significant) p>0.05 Steel’s test. All box plots show median (middle line) and 25th to 75th percentiles with whiskers indicating the smallest to the largest data points.
-
Figure 4—source data 1
Source data used to generate the summary data and graphs shown in Figure 4 and Figure 4—figure supplement 1.
- https://cdn.elifesciences.org/articles/85760/elife-85760-fig4-data1-v1.xlsx
Figure 4—figure supplement 1
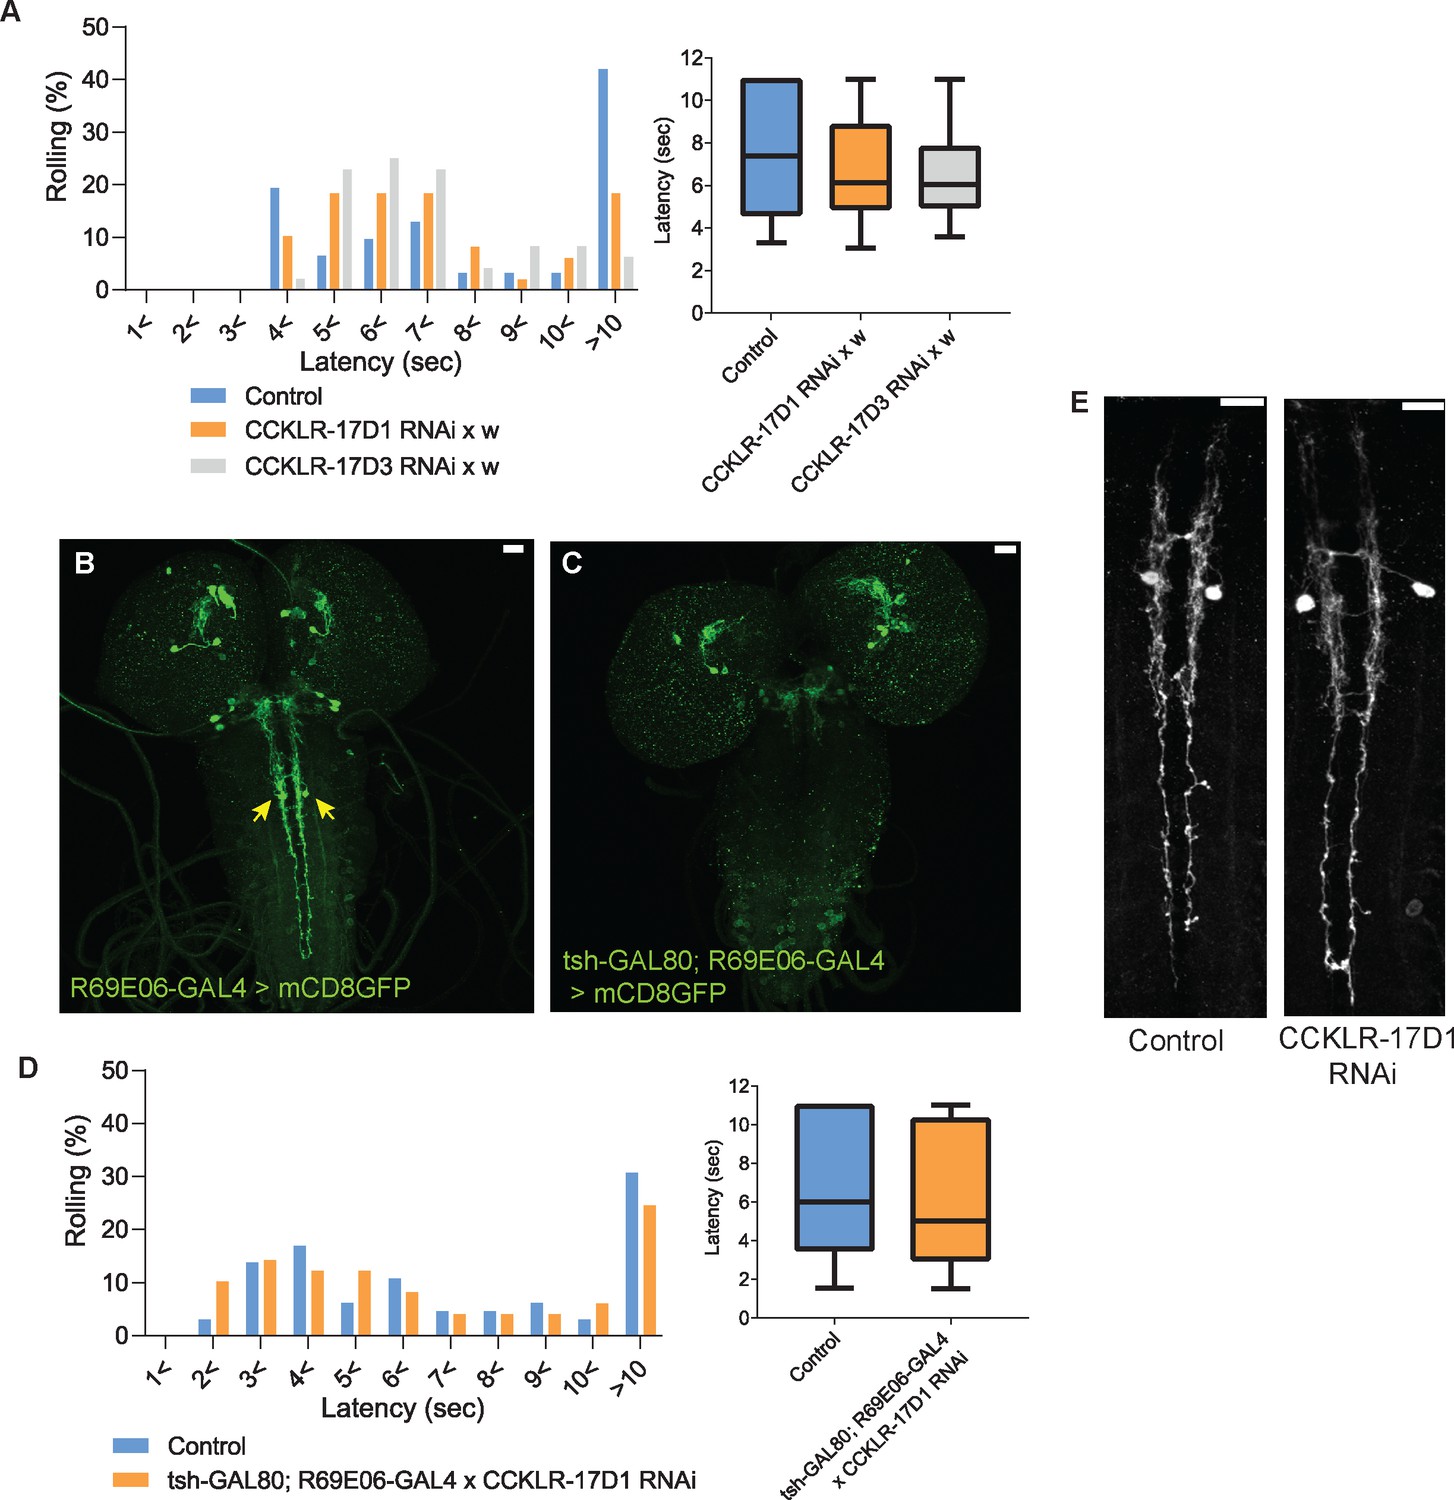
CCKLR-17D1 RNAi in Goro neurons induces thermal hypersensitivity in a GAL4-dependent manner, without affecting the morphology.
(A) Without the GAL4 driver, UAS-CCKLR-17D1 RNAi (yv;JF02644 x w1118, n=49) and UAS-CCKLR-17D3 RNAi (yv;JF02968 x w1118, n=48) both did not cause thermal hypersensitivity to 42 °C compared with the control (R69E06-GAL4 x yv; attp2, n=31). p>0.38 Steel’s test. (B and C) tsh-GAL80 eliminates the expression of R69E06-GAL4 from Goro neurons. The expression of R69E06-GAL4 in Goro neurons (B) (10xUAS-IVS-mCD8GFP; R69E06-GAL4 x yv; attp2) was eliminated when tsh-GAL80 was combined with R69E06-GAL4 (C) (tsh-GAL80; R69E06-GAL4x40xUAS-IVS-mCD8GFP). (D) When the expression of UAS-CCKLR-17D1 RNAi was eliminated from Goro neurons (tsh-GAL80; R69E06-GAL4 x yv; JF02644, n=49), larval nociceptive responses to a 42 °C probe was indistinguishable from the control (R69E06-GAL4 x yv; attp2, n=65). p>0.33 Mann-Whitney’s U-test. (E) Goro neurons expressing CCKLR-17D1 RNAi (10xUAS-IVS-mCD8GFP; R69E06-GAL4 x yv; JF02644) did not alter their number, position, and gross projection patterns in comparison with the control (10xUAS-IVS-mCD8GFP; R69E06-GAL4 x yv; attp2). All scale bars represent 20 µm. All box plots show median (middle line) and 25th to 75th percentiles with whiskers indicating the smallest to the largest data points.
Figure 5 with 1 supplement
Goro neurons lacking CCKLR-17D1 show sensitized responses to noxious heat.
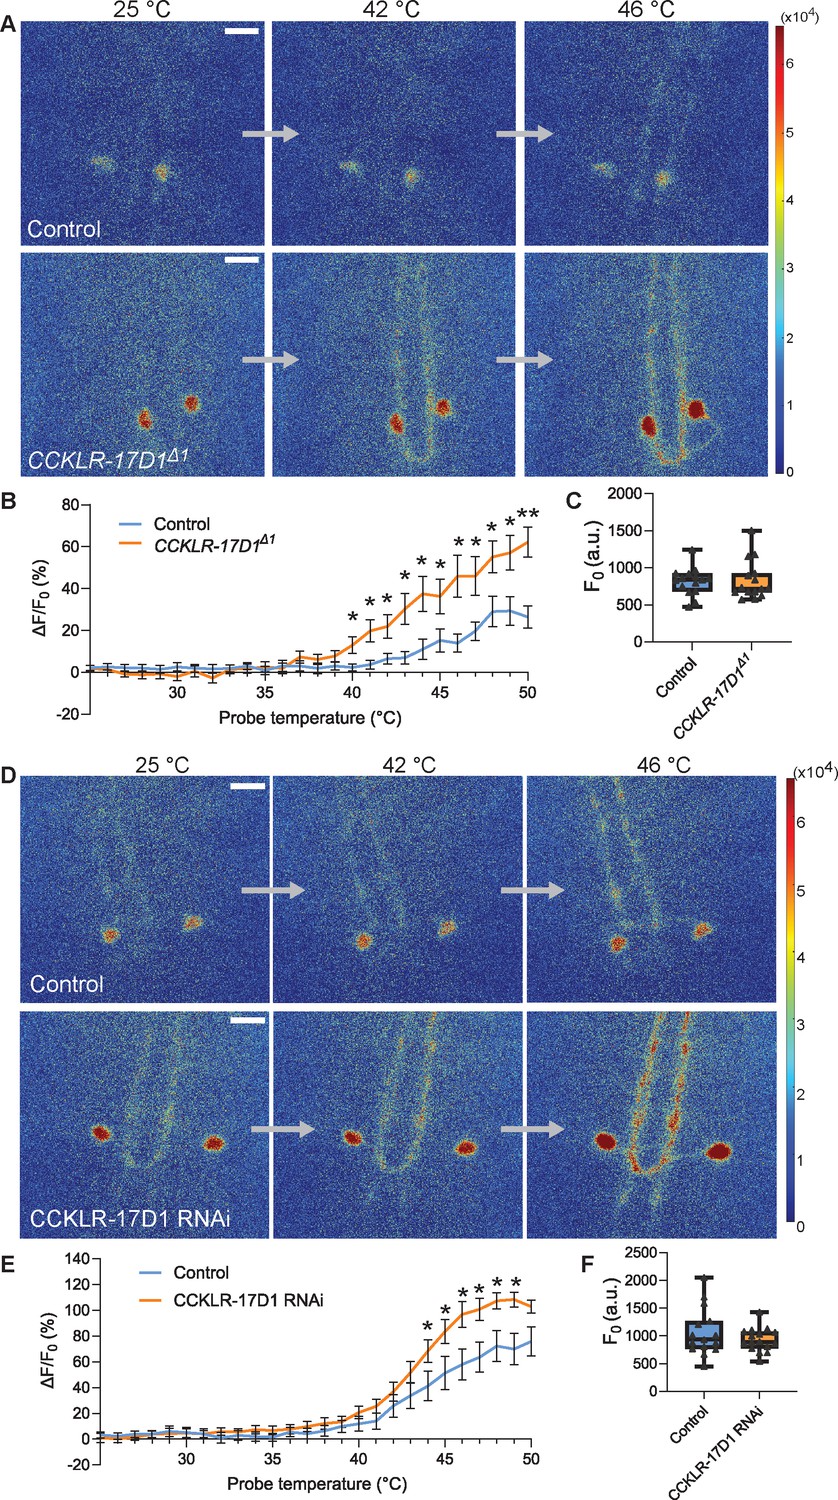
(A) Representative still images showing thermal activation of Goro neurons in the controls (top, yw/Y; R69E06-GAL4 UAS-GCaMP6m/+) and CCKLR-17D1Δ1 mutants (bottom, CCKLR-17D1Δ1/Y; R69E06-GAL4 UAS-GCaMP6m/+). See also Videos 1 and 2. (B) Average percent increase of GCaMP6m fluorescence intensity relative to the baseline (ΔF/F0) during heat ramp stimulations in controls (n=15) and CCKLR-17D1Δ1 (n=15). * p<0.05, ** p<0.01 Mann-Whitney’s U-test. (C) Basal GCaMP6m signal levels (F0) in controls (n=15) and CCKLR-17D1Δ1 mutants (n=15). p>0.6 Mann-Whitney’s U-test. (D) Representative stills showing thermal activation of the controls (top, R69E06-GAL4 UAS-GCaMP6m x yv; attp2) and Goro neurons expressing CCKLR-17D1 RNAi (bottom, R69E06-GAL4 UAS-GCaMP6m x yv; JF02644). See also Videos 3 and 4. (E) Average percent increase of GCaMP6m fluorescence intensity relative to the baseline (ΔF/F0) during heat ramp stimulations in controls (n=15) and CCKLR-17D1 RNAi (n=16). * p<0.05 Mann-Whitney’s U-test. (F) Basal GCaMP6m levels (F0) in controls (n=15) and CCKLR-17D1 RNAi (n=16). p>0.6 Mann–Whitney’s U-test. Error bars represent standard error. All box plots show median (middle line) and 25th to 75th percentiles with whiskers indicating the smallest to the largest data points. All scale bars represent 20 µm.
-
Figure 5—source data 1
Source data used to generate the summary data and graphs shown in Figure 5 and Figure 5—figure supplement 1.
- https://cdn.elifesciences.org/articles/85760/elife-85760-fig5-data1-v1.xlsx
Figure 5—figure supplement 1
Thermal responsiveness of Goro neurons in CCKLR-17D3Δ1.
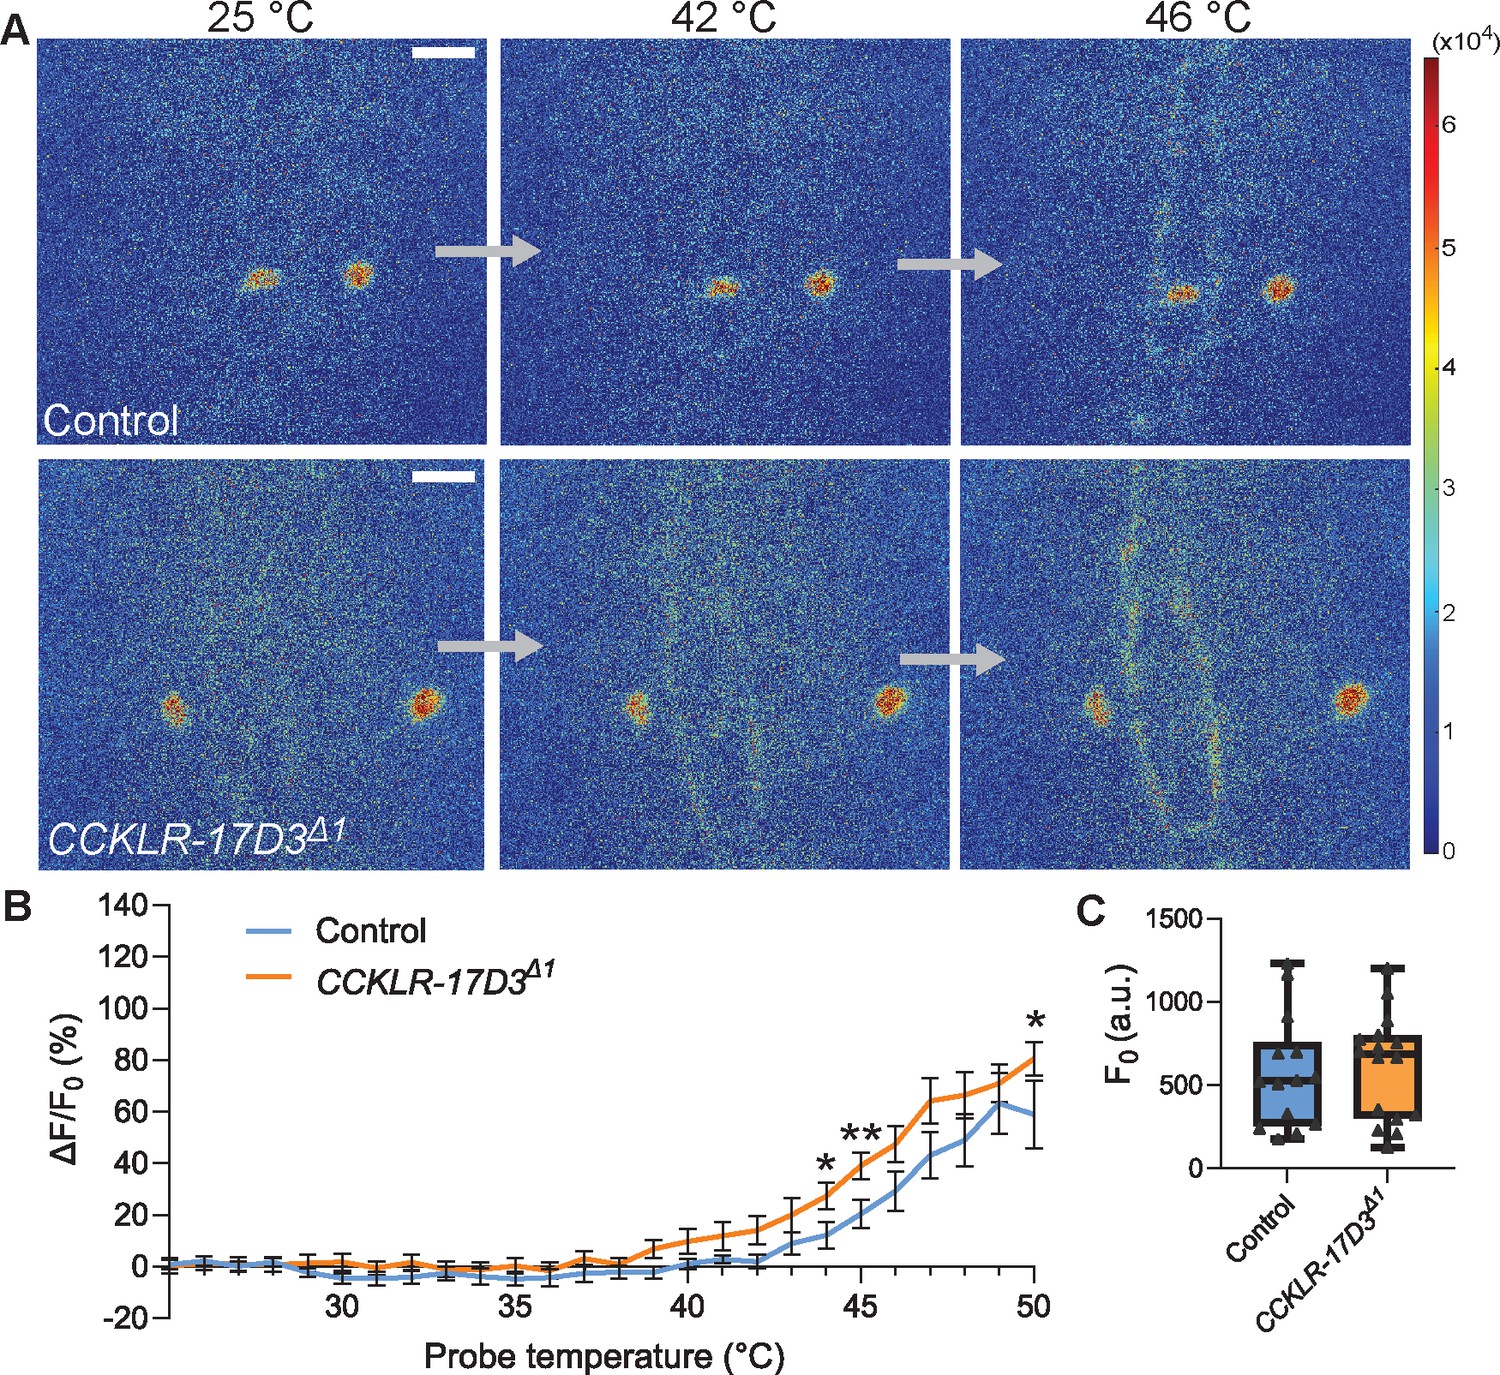
(A) Representative still images showing thermal activation of Goro neurons in control animals (top, yw/Y; R69E06-GAL4 UAS-GCaMP6m/+) and CCKLR-17D3Δ1 mutants (bottom, CCKLR-17D3Δ1/Y; R69E06-GAL4 UAS-GCaMP6m/+). See also Videos 5 and 6. Scale bars represent 20 µm. (B) Average percent increase of GCaMP6m fluorescence intensity relative to baseline (ΔF/F0) during heat ramp stimulations in CCKLR-17D3Δ1 experiments. ΔF/F0 is plotted to binned probe temperature (interval = 1 °C). In comparison with controls, Goro neurons of CCKLR-17D3Δ1 exhibited mildly elevated fluorescent increase of GCaMP6m, which reached statistical significance only at 44 °C, 45 °C, and 50 °C. n=14 and 16 for controls and CCKLR-17D3Δ1, respectively. * p<0.05, ** p<0.01 (Mann–Whitney’s U-test). Error bars represent standard errors. (C) Basal GCaMP6m signal levels (F0) did not differ between controls and CCKLR-17D3Δ1 (n=14 and 16). p>0.5 (Mann–Whitney’s U-test). Box plots show median (middle line) and 25th to 75th percentiles with whiskers indicating the smallest to the largest data points.
Figure 6
Projection patterns of DSK-expressing neurons in the larval CNS.
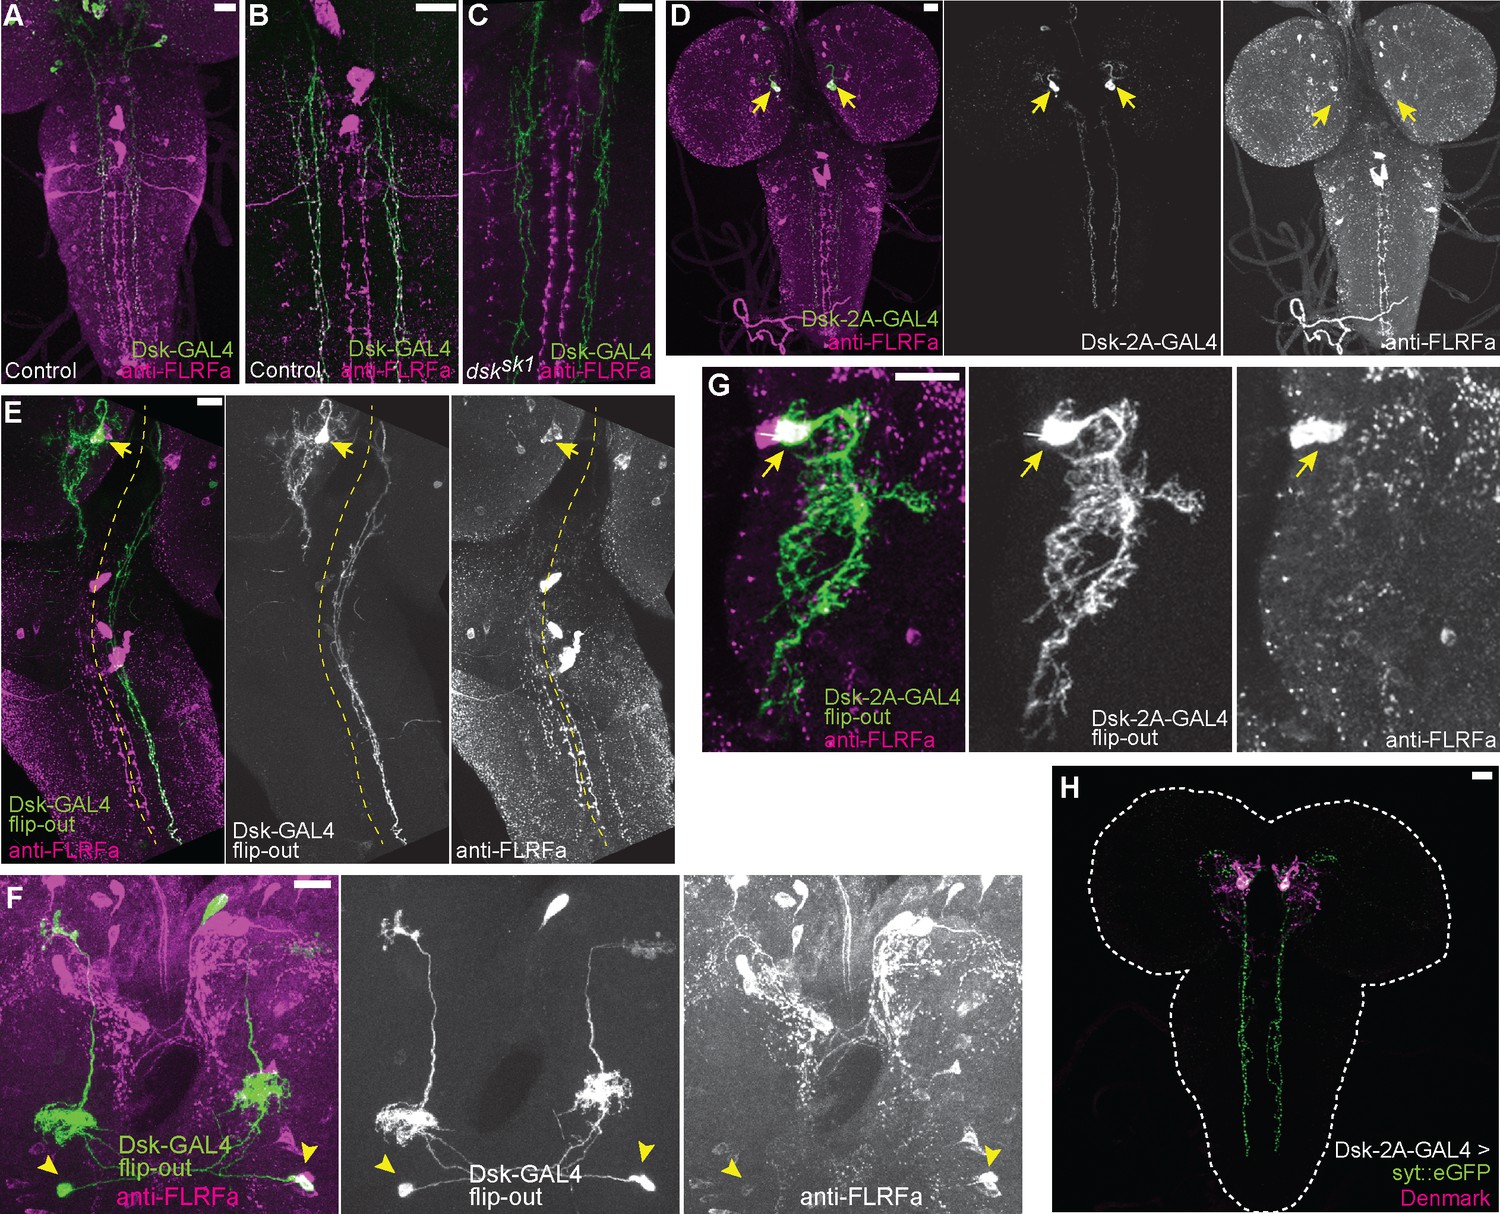
(A) Representative image showing descending axons from DSK-GAL4 positive brain neurons (green) to the larval VNC. (B) Representative image showing all descending projections labeled by DSK-GAL4 (green) harbor punctate anti-FLRFa signals (magenta) in the wild-type. (C) Representative image showing the complete absence of punctate anti-FLRFa signals (magenta) in the descending projections labeled by DSK-GAL4 (green) in the dsksk1 mutants. (D) Image showing the descending projections of MP1 neurons (arrows) marked by DSK-2A-GAL4. (E) Image showing a single FLP-out clone of MP1 neuron (arrow) contralaterally sending descending axons to the larval VNC. The yellow dashed line indicates the midline. (F) Image showing two FLP-out clones of Sv neurons (arrowheads) sending ascending axons to both sides of the brain. (G) A projection image showing the MP1 neurites in the brain. Note that few anti-FLRFa-positve puncta are associated with MP1 neurites within the brain. Similar expression patterns were observed in multiple samples (n=3). The arrow indicates the anti-FLRFa-positve MP1 soma. (H) Representative image showing localizations of syt::eGFP (green) and Denmark (magenta) in MP1 neurons (DSK-2A-GAL4 x UAS-syt::eGFP UAS-Denmark). Similar expression patterns were observed in multiple samples (n=7). All scale bars represent 20 µm.
Figure 7
Activity and thermal responsiveness of DSK-expressing neurons.
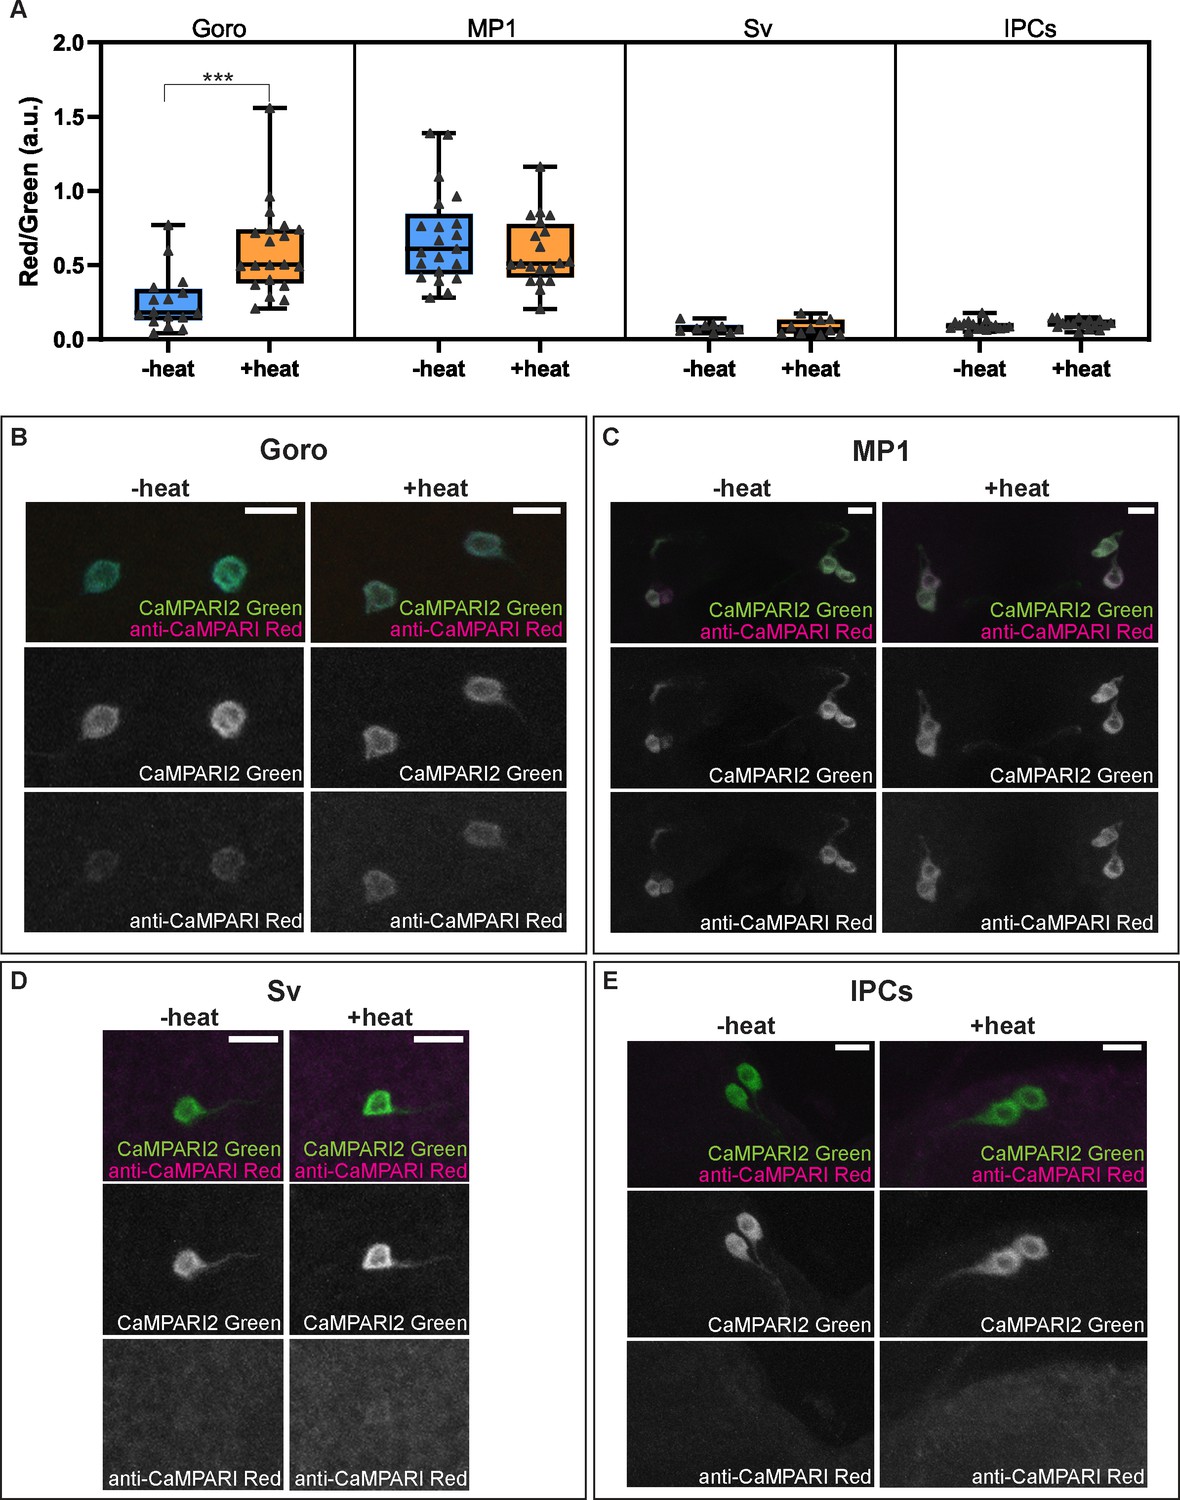
(A) Box plots of the quantified ratio of CaMPARI2 green signals and photoconverted CaMPARI2 red signals detected by anti-CaMPARI-red in Goro, MP1, Sv, and IPCs (Red/Green) with or without local heat ramp stimulation. Goro neurons showed a significantly higher Red/Green ratio of CaMPARI2 when local heat ramp stimulation was applied to the larvae (n=16 and 20, p<0.001, Mann-Whitney’s U-test). MP1 neurons showed a high Red/Green ratio of CaMPARI2 both with and without local heat stimulation (n=21 and 20, p>0.3, Mann-Whitney’s U-test). The Red/Green ratio of CaMPARI2 was low in Sv compared to MP1 neurons, and CaMPARI2 photoconversion was not increased by local heat stimulation (n=9 and 10, p>0.5, Mann-Whitney’s U-test). IPCs also exhibited low CaMPARI2 photoconversion regardless of the presence of local heat ramp stimulation (n=17 and 16, p>0.25, Mann-Whitney’s U-test). (B–E) Representative images showing CaMPARI2 green signals (green) and anti-CaMPARI-red signals (magenta) in Goro (B), MP1 (C), Sv (D), and IPCs (E). All box plots show median (middle line) and 25th to 75th percentiles, with whiskers indicating the smallest to the largest data points. Scale bars represent 10 µm.
-
Figure 7—source data 1
Source data used to generate the summary data and graphs shown in Figure 7.
- https://cdn.elifesciences.org/articles/85760/elife-85760-fig7-data1-v1.xlsx
Figure 8
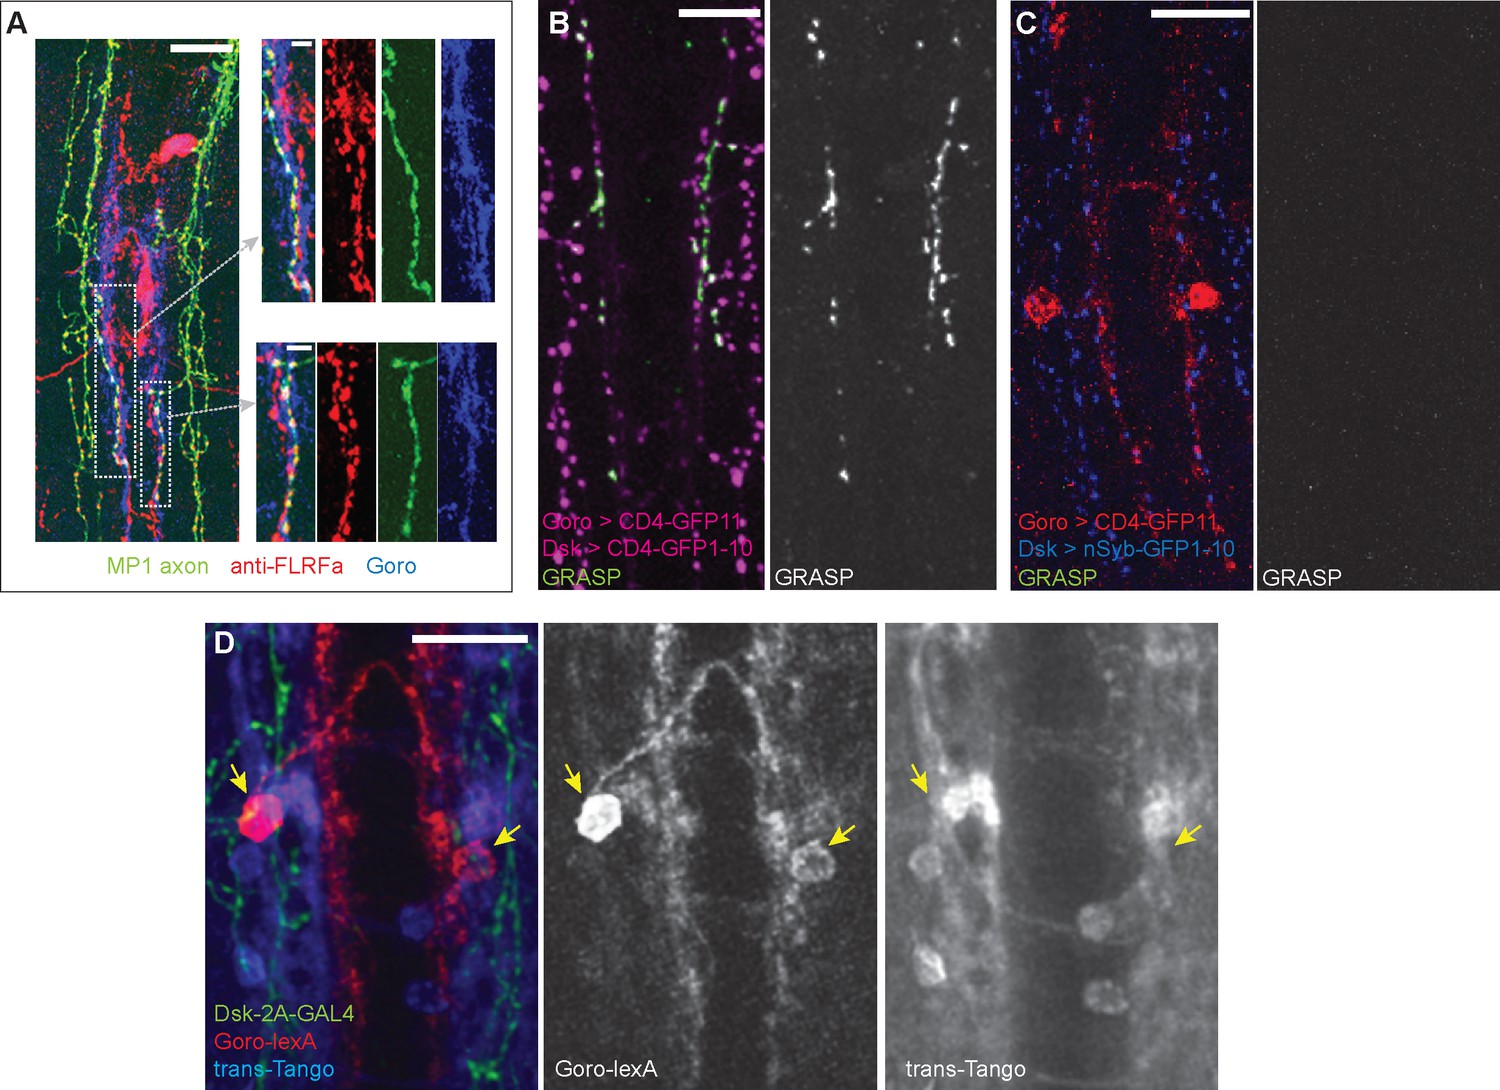
Synaptic connectivity between MP1 axons and Goro neurons is not detected.
(A) Representative images of the larval VNC showing partially overlapping MP1 axons (green) and processes of Goro neurons (blue) that are associated with anti-FLRFa signals (red). MP1 axons partially overlapping Goro neurons were similarly observed in all examined samples (n=5). (B) Representative image showing CD4-GRASP experiments between MP1 axons and Goro neurons (magenta). Signals of reconstituted GFP (GRASP, green) were detected in all examined samples (n=5). (C) Representative image showing nSyb-GRASP experiments between MP1 axons (blue) and Goro neurons (red). Signals of reconstituted GFP (GRASP, green) were not detectable in any of the examined samples (n=5). (D) Representative image showing trans-Tango experiments using DSK-2A-GAL4 (R69E06-lexA, lexAop-rCD2::RFP UAS-mCD8::GFP; DSK-2A-GAL4 x UAS-myrGFP, QUAS-mtdTomato::3xHA; trans-Tango). Transsynaptic activation of Tango signals (blue; mtdTomato::3xHA detected by anti-HA) was undetectable in Goro neurons (red; rCD2::RFP detected by anti-CD2). Green represents MP1 axons labeled by DSK-2A-GAL4 (myrGFP and mCD8::GFP detected by anti-GFP). Signals of mtdTom::3xHA in Goro neurons were not detected in any of the examined samples (n=4). Arrows indicate Goro somata. All scale bars represent 20 µm, except for the insets in (A) (5 µm).
Figure 9
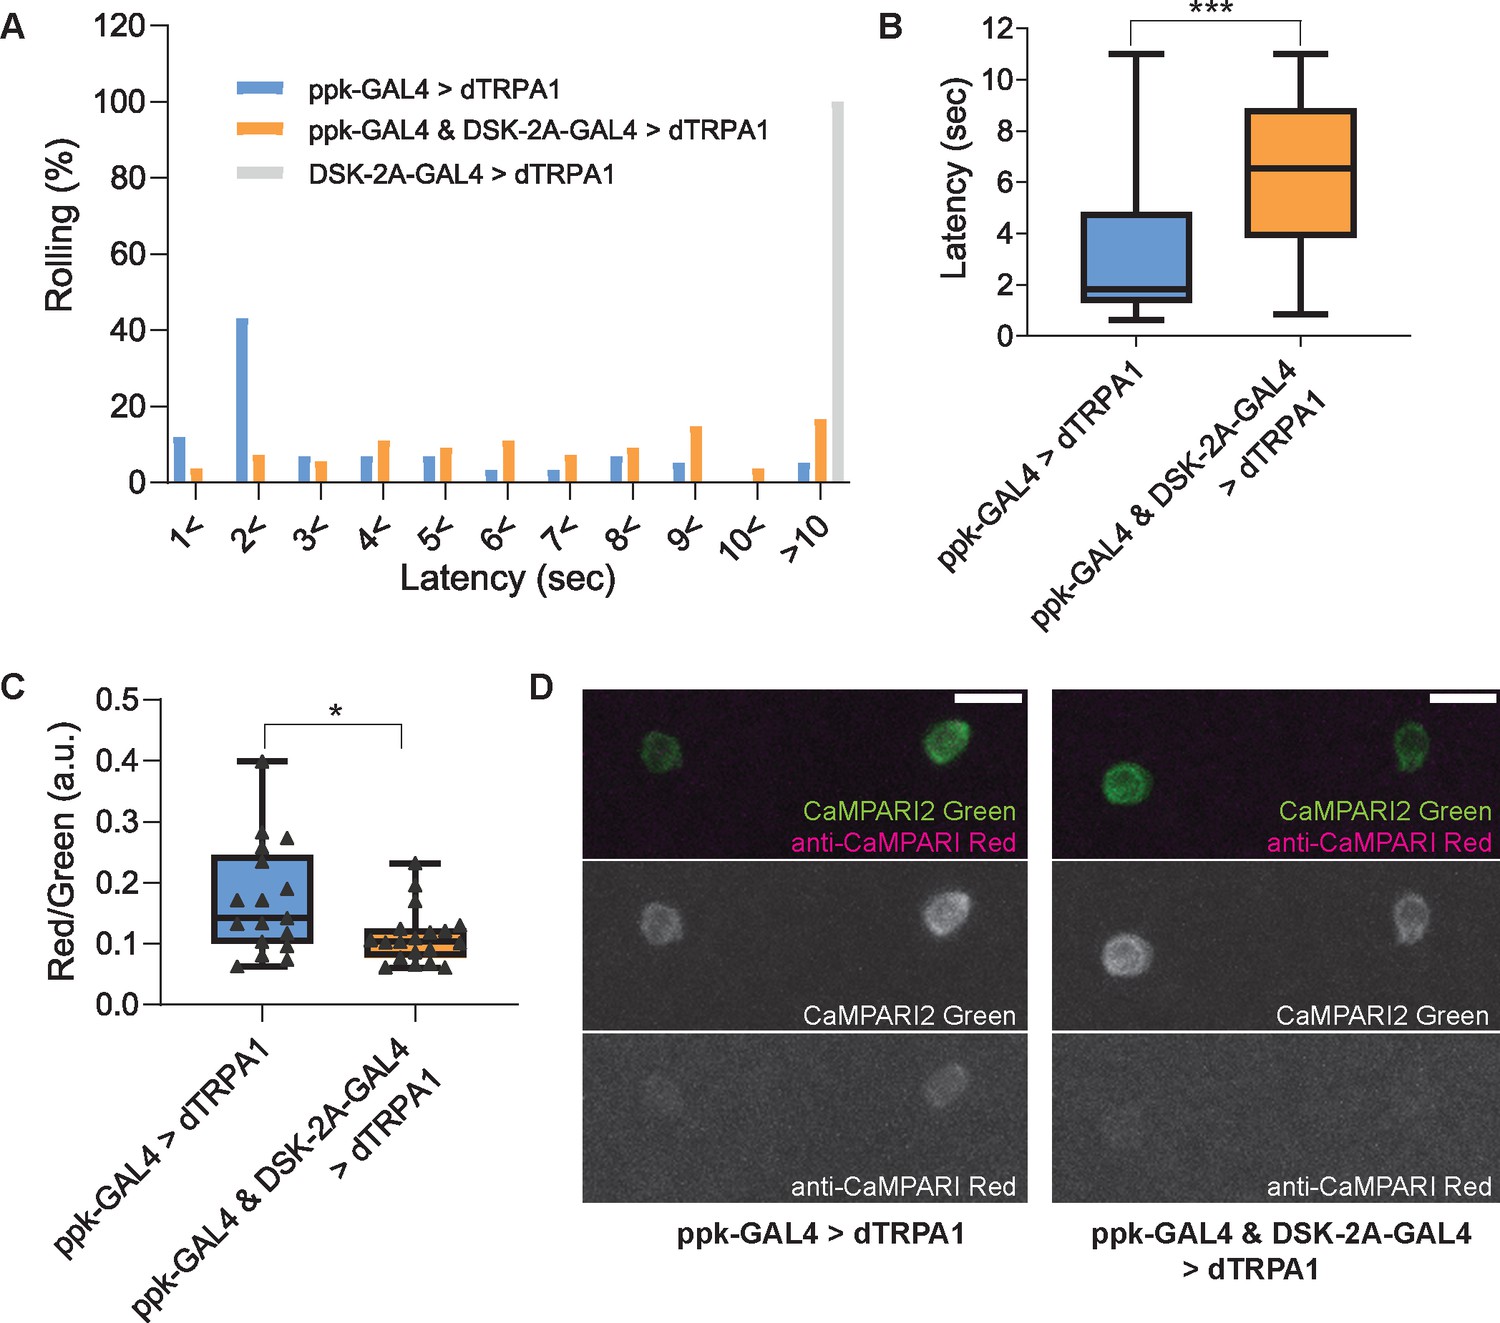
Thermogenetic activation of DSK-2A-GAL4 neurons inhibits larval nociception and Goro neurons.
(A and B) Thermogenetic activations of nociceptors and/or DSK-2A-GAL4 neurons using UAS-dTRPA1. (A) Histogram representing the percentage of larvae exhibiting nociceptive rolling. Upon thermogenetic activations, 55% of larvae expressing dTRPA1 in nociceptors (ppk-GAL4 >dTRPA1; ppk1.9-GAL4 x UAS-dTRPA1, n=58) exhibited nociceptive rolling within 2 s. In contrast, only 11% of larvae with simultaneous activations of nociceptors and DSK-2A-GAL4 showed rolling within 2 s (ppk-GAL4 & DSK-2A-GAL4>dTRPA1; ppk1.9-GAL4 DSK-2A-GAL4 x UAS-dTRPA1, n=54). Thermogenetic activations of DSK-2A-GAL4 neurons alone (DSK-2A-GAL4>dTRPA1; DSK-2A-GAL4 x UAS-dTRPA1, n=40) did not trigger nociceptive responses even after 10 s. (B) Box plots showing latencies. Thermogenetic activation of DSK-2A-GAL4 simultaneously with nociceptors caused a significantly longer latency to rolling responses (Mann-Whitney U-test, *** p<0.001). (C and D) CaMPARI2 snapshot imaging of the activity of Goro neurons activated by thermogenetic stimulation of C4da nociceptors. (C) Box plots of the ratio of CaMPARI2 green signals and photoconverted CaMPARI2 red signals detected by anti-CaMPARI-red in Goro neurons (Red/Green). Compared to the larvae with thermogenetic activation of C4da nociceptors only (ppk-GAL4 >dTRPA1; ppk1.9-GAL4, UAS-dTRPA1 x R69E06-lexA; lexAop-CaMPARI2; n=17), the larvae with simultaneous activation of C4da and DSK-2A-GAL4 neurons (ppk-GAL4 & DSK-2A-GAL4>dTRPA1; ppk1.9-GAL4, UAS-dTRPA1; DSK-2A-GAL4 x R69E06-lexA; lexAop-CaMPARI2; n=19) showed significantly decreased CaMPARI2 photoconversion in Goro neurons (Mann-Whitney U-test, * p<0.025). (D) Representative images showing CaMPARI2 green signals (green) and anti-CaMPARI-red signals (magenta) in Goro neurons of animals with thermogenetic C4da activation (ppk-GAL4 >dTRPA1) and with simultaneous thermogenetic activation of C4da and DSK-2A-GAL4 neurons (ppk-GAL4 & DSK-2A-GAL4>dTRPA1). All box plots show median (middle line) and 25th to 75th percentiles with whiskers indicating the smallest to the largest data points. Scale bars represent 10 µm.
-
Figure 9—source data 1
Source data used to generate the summary data and graphs shown in Figure 9.
- https://cdn.elifesciences.org/articles/85760/elife-85760-fig9-data1-v1.xlsx
Figure 10
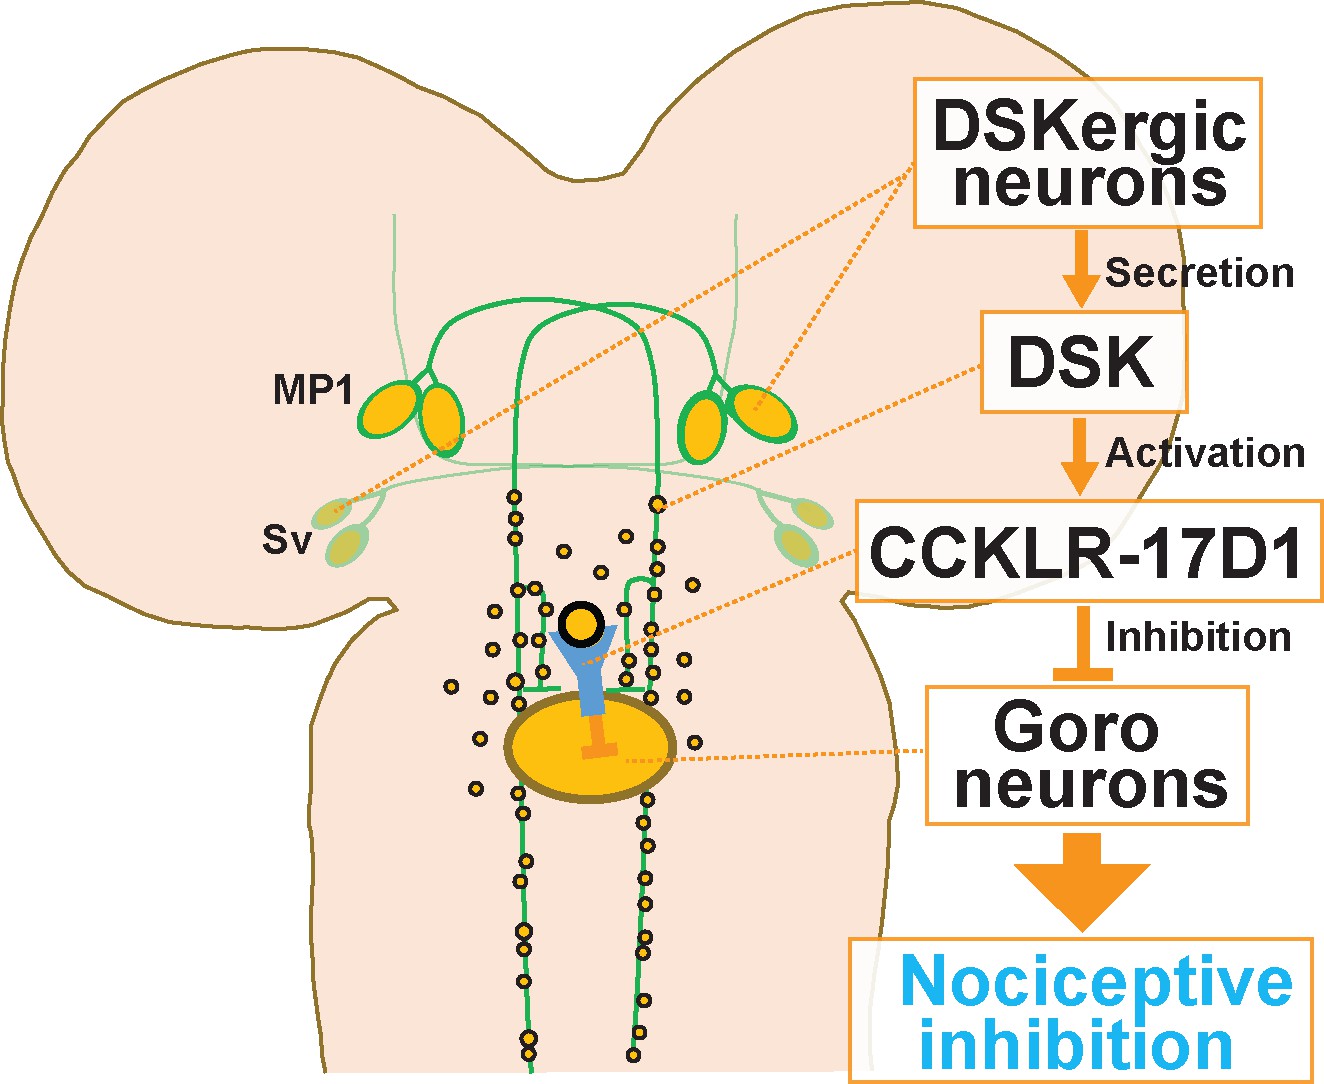
A schematic model of the DSKergic descending inhibitory pathway of nociception in larval Drosophila.
DSK-expressing MP1 and/or Sv neurons in the brain secrete DSK peptides. DSK in the larval VNC activates the CCKLR-17D1 receptor expressed in Goro neurons, which subsequently inhibits the activity of Goro neurons, and ultimately larval nociceptive rolling responses.
Videos
Video 1
Ca2+ imaging of Goro neurons in a control animal used for the CCKLR-17D1Δ1 experiments.
See also Figure 5. The movie was generated from heat-mapped time-series projection images of GCaMP6m fluorescence using MATLAB. Time and probe temperature are indicated at the top left and top right corners, respectively.
Video 2
Ca2+ imaging of Goro neurons in a CCKLR-17D1Δ1 mutant animal.
See also Figure 5. The movie was generated from heat-mapped time-series projection images of GCaMP6m fluorescence using MATLAB. Time and probe temperature are indicated at the top left and top right corners, respectively.
Video 3
Ca2+ imaging of Goro neurons in a control animal used for the CCKLR-17D1 RNAi experiments.
See also Figure 5. The movie was generated from heat-mapped time-series projection images of GCaMP6m fluorescence using MATLAB. Time and probe temperature are indicated at the top left and top right corners, respectively.
Video 4
Ca2+ imaging of Goro neurons in a CCKLR-17D1 RNAi animal.
See also Figure 5. The movie was generated from heat-mapped time-series projection images of GCaMP6m fluorescence using MATLAB. Time and probe temperature are indicated at the top left and top right corners, respectively.
Video 5
Ca2+ imaging of Goro neurons in a control animal used for the CCKLR-17D3Δ1 experiments.
See also Figure 5—figure supplement 1. The movie was generated from heat-mapped time-series projection images of GCaMP6m fluorescence using MATLAB. Time and probe temperature are indicated at the top left and top right corners, respectively.
Video 6
Ca2+ imaging of Goro neurons in a CCKLR-17D3Δ1 mutant animal.
See also Figure 5—figure supplement 1. The movie was generated from heat-mapped time-series projection images of GCaMP6m fluorescence using MATLAB. Time and probe temperature are indicated at the top left and top right corners, respectively.
Additional files
Download links
A two-part list of links to download the article, or parts of the article, in various formats.
Downloads (link to download the article as PDF)
Open citations (links to open the citations from this article in various online reference manager services)
Cite this article (links to download the citations from this article in formats compatible with various reference manager tools)
A descending inhibitory mechanism of nociception mediated by an evolutionarily conserved neuropeptide system in Drosophila
eLife 12:RP85760.
https://doi.org/10.7554/eLife.85760.3


