Effect of an enhanced public health contact tracing intervention on the secondary transmission of SARS-CoV-2 in educational settings: The four-way decomposition analysis
- Epidemiology Unit, Azienda Unità Sanitaria Locale – IRCCS di Reggio Emilia, Italy
- Centre for Environmental, Nutritional and Genetic Epidemiology (CREAGEN), University of Modena and Reggio Emilia, Italy
- Public Health Unit, Azienda Unità Sanitaria Locale-IRCCS di Reggio Emilia, Italy
- Department of Infectious Diseases, Istituto Superiore di Sanità, Italy
Figures
Figure 1
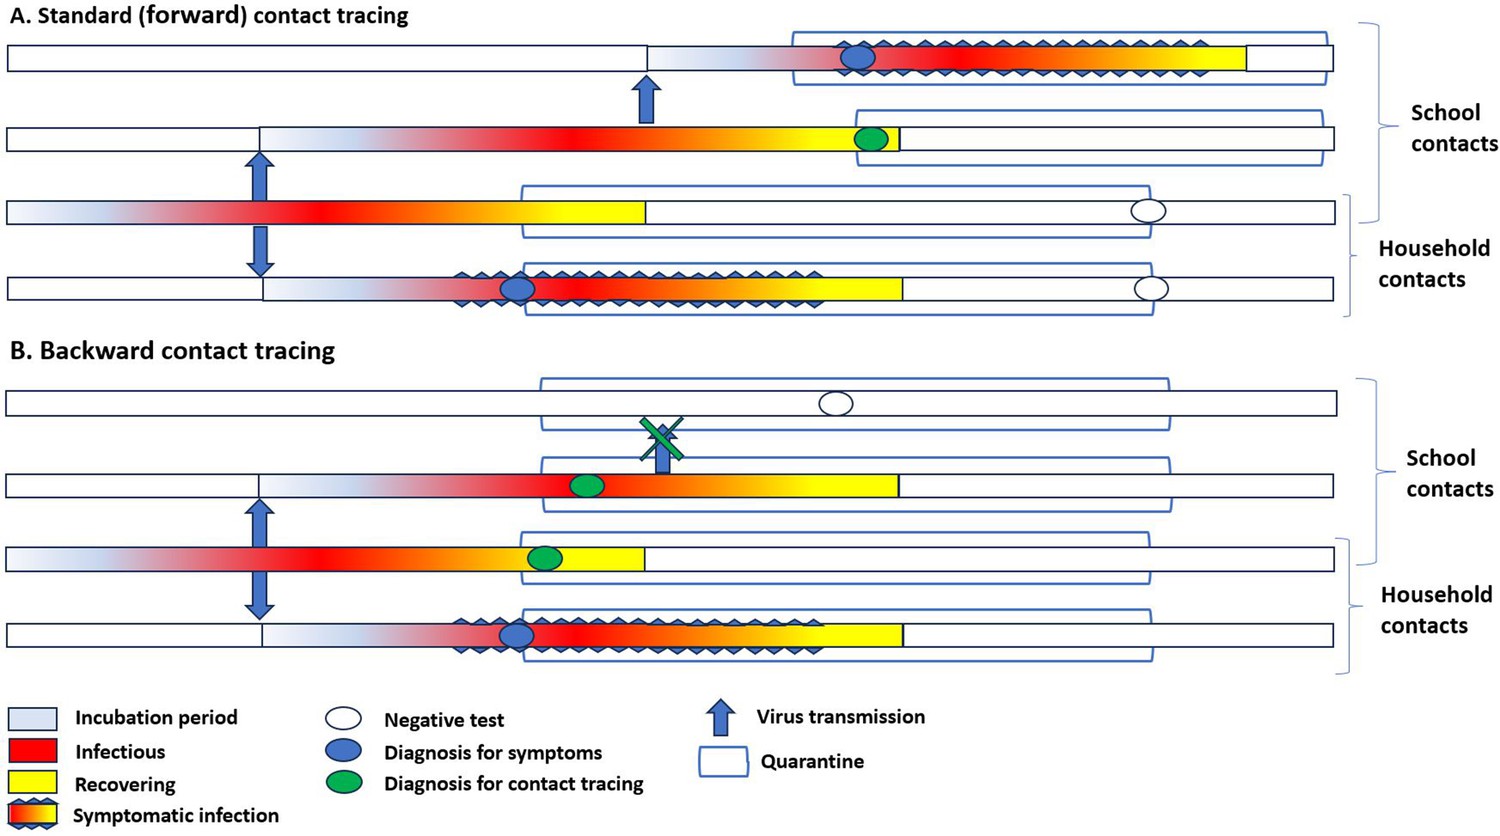
Simplified timeline of transmission in household and among school contacts in the presence of standard contact tracing and backward contact tracing.
(A) In standard contact tracing, all close contacts were quarantined after identifying a case in the community. Contacts were only tested at the end of the quarantine or if symptomatic. Only for school contacts, immediate testing of all classmates was performed; if one or more classmates resulted positive, the whole class was quarantined. (B) In backward contact tracing, close contacts were also immediately tested, independently from the presence of symptoms. The tracing and quarantine policy in schools was similar. In the proposed example, after the diagnosis of a symptomatic household member, backward tracing would identify an asymptomatic child, thus allowing the extension of investigation to his school contacts and eventually stopping secondary transmission in the class.
Figure 2
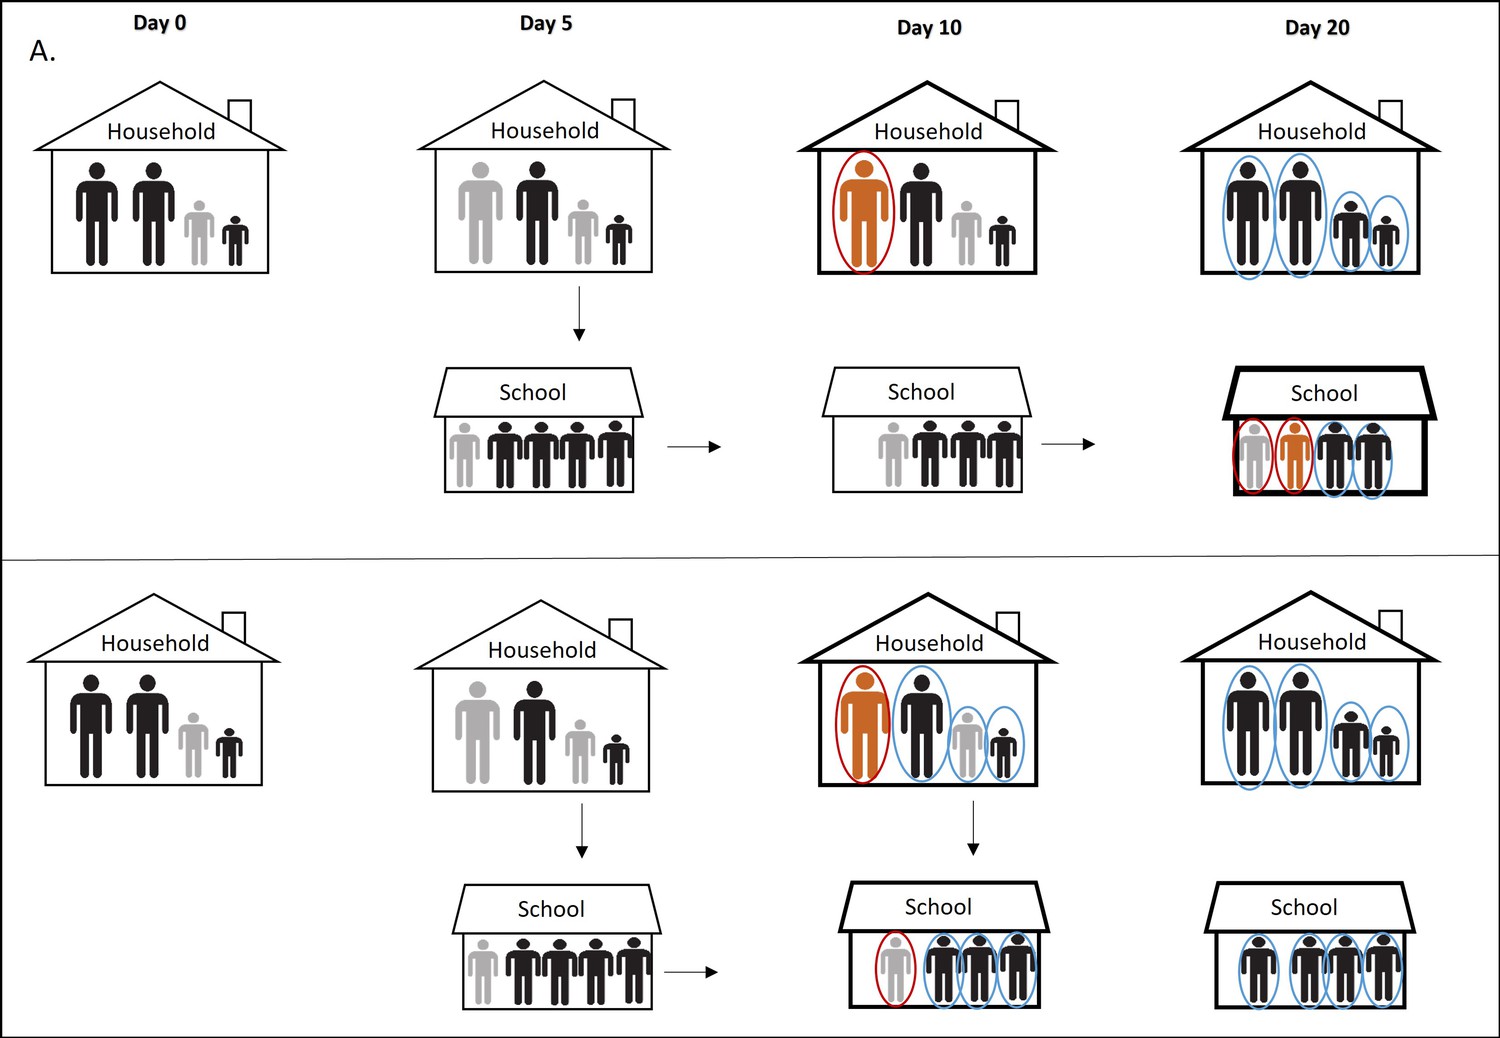
Simplified illustration of the pre and post intervention scenarios.
In panel A we report the scenario without prompt contact testing in community and its effect on the SARS-CoV-2 transmission in educational setting. Day 0: One of the children in a household became infected (primary case) but asymptomatic (gray). Day 5: One parent and one classmate became infected, also asymptomatic (gray). Day 10: The infected parent became symptomatic (orange), tested positive (red circle), and considered an index case of the household. Entire family is quarantined (bold line) but not tested immediately. Meanwhile, the primary case transmits infection further to two other classmates. Classmates of the primary case are not tested because they are not identified as school contacts due to late testing of the household contacts. Day 20: Family members of the index case are tested at the end of the quarantine. One positive classmate of the primary case became symptomatic, tested positive, and considered an index case in the school cluster given that the classmates were not considered contacts of the primary case since he was already isolated. Other classmates are tested only when an index case occurs. Panel B illustrates the scenario with prompt contact testing in community. Day 10: The infected parent became symptomatic, tested positive, and entire family was quarantined and tested at the beginning of quarantine. Primary case is identified promptly, his classmates are identified as contacts, tested, and isolated preventing further transmission of the virus.
Figure 3
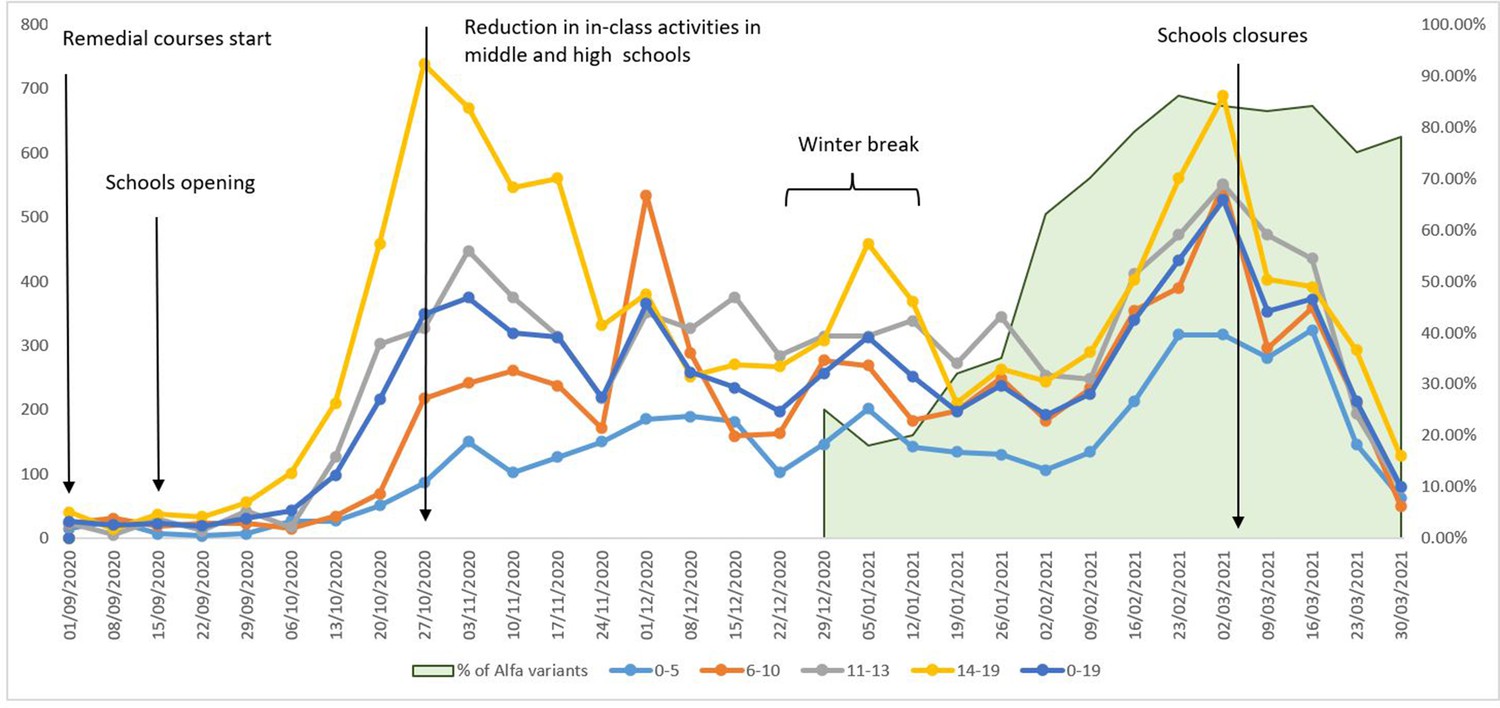
Weekly notification rates of new COVID-19 cases per 100,000 inhabitants, ages 0–19, by age class, Reggio Emilia Province, 1 September 2020 – 4 April 2021.
The graph also reports the main changes in school opening and school closures and the proportion of Alpha variants (green area) among sequenced cases reported by the Italian National Institute of Health.
Figure 4
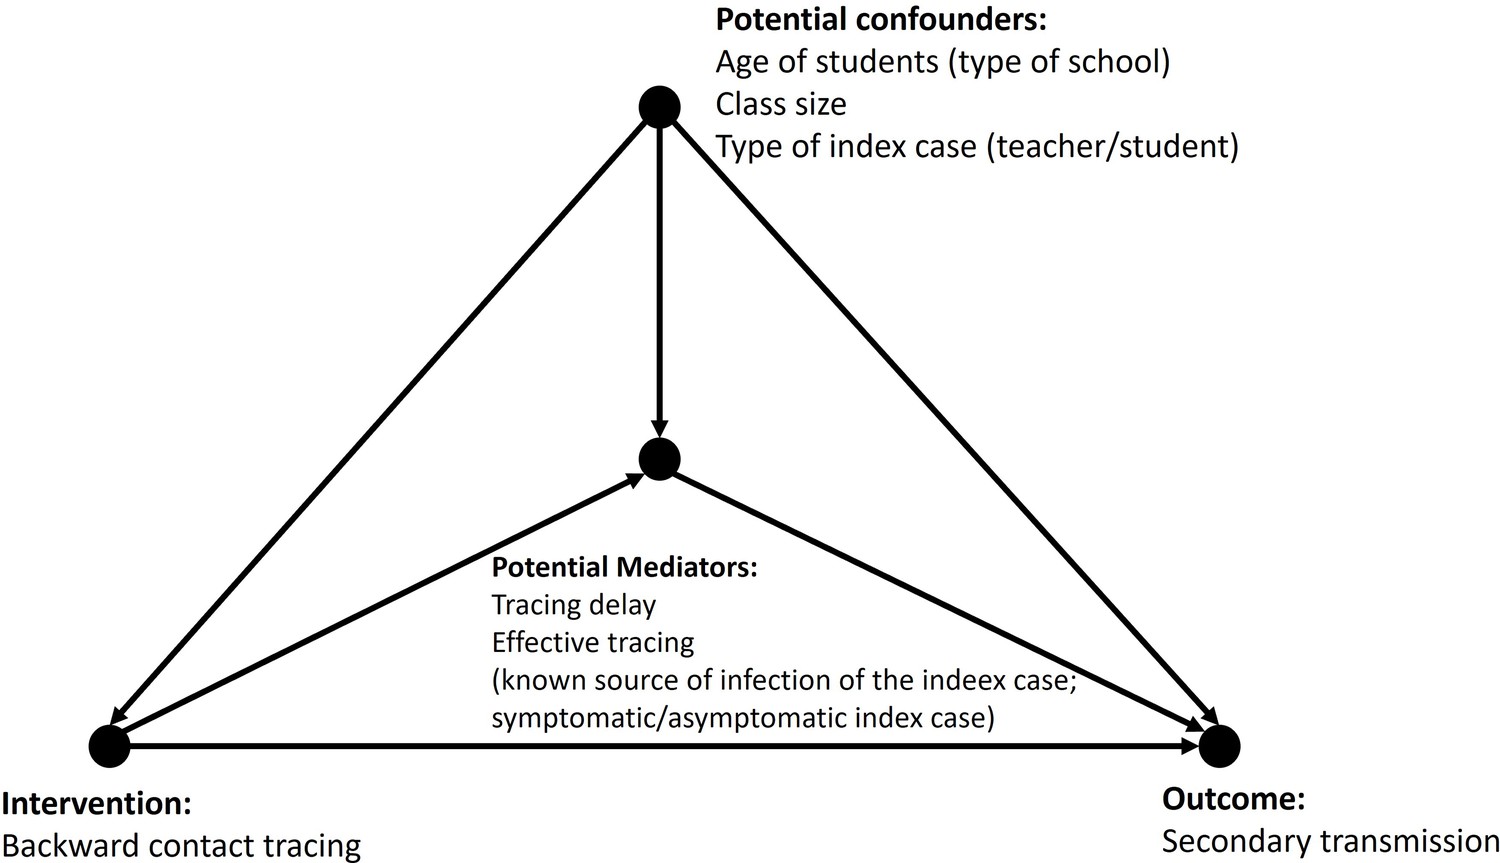
Directed acyclic graph for the association of intervention and number of secondary cases, mediated by contact tracing delay and known contact of the index case, adjusted for the type of school, type of index case, and class size.
Figure 5
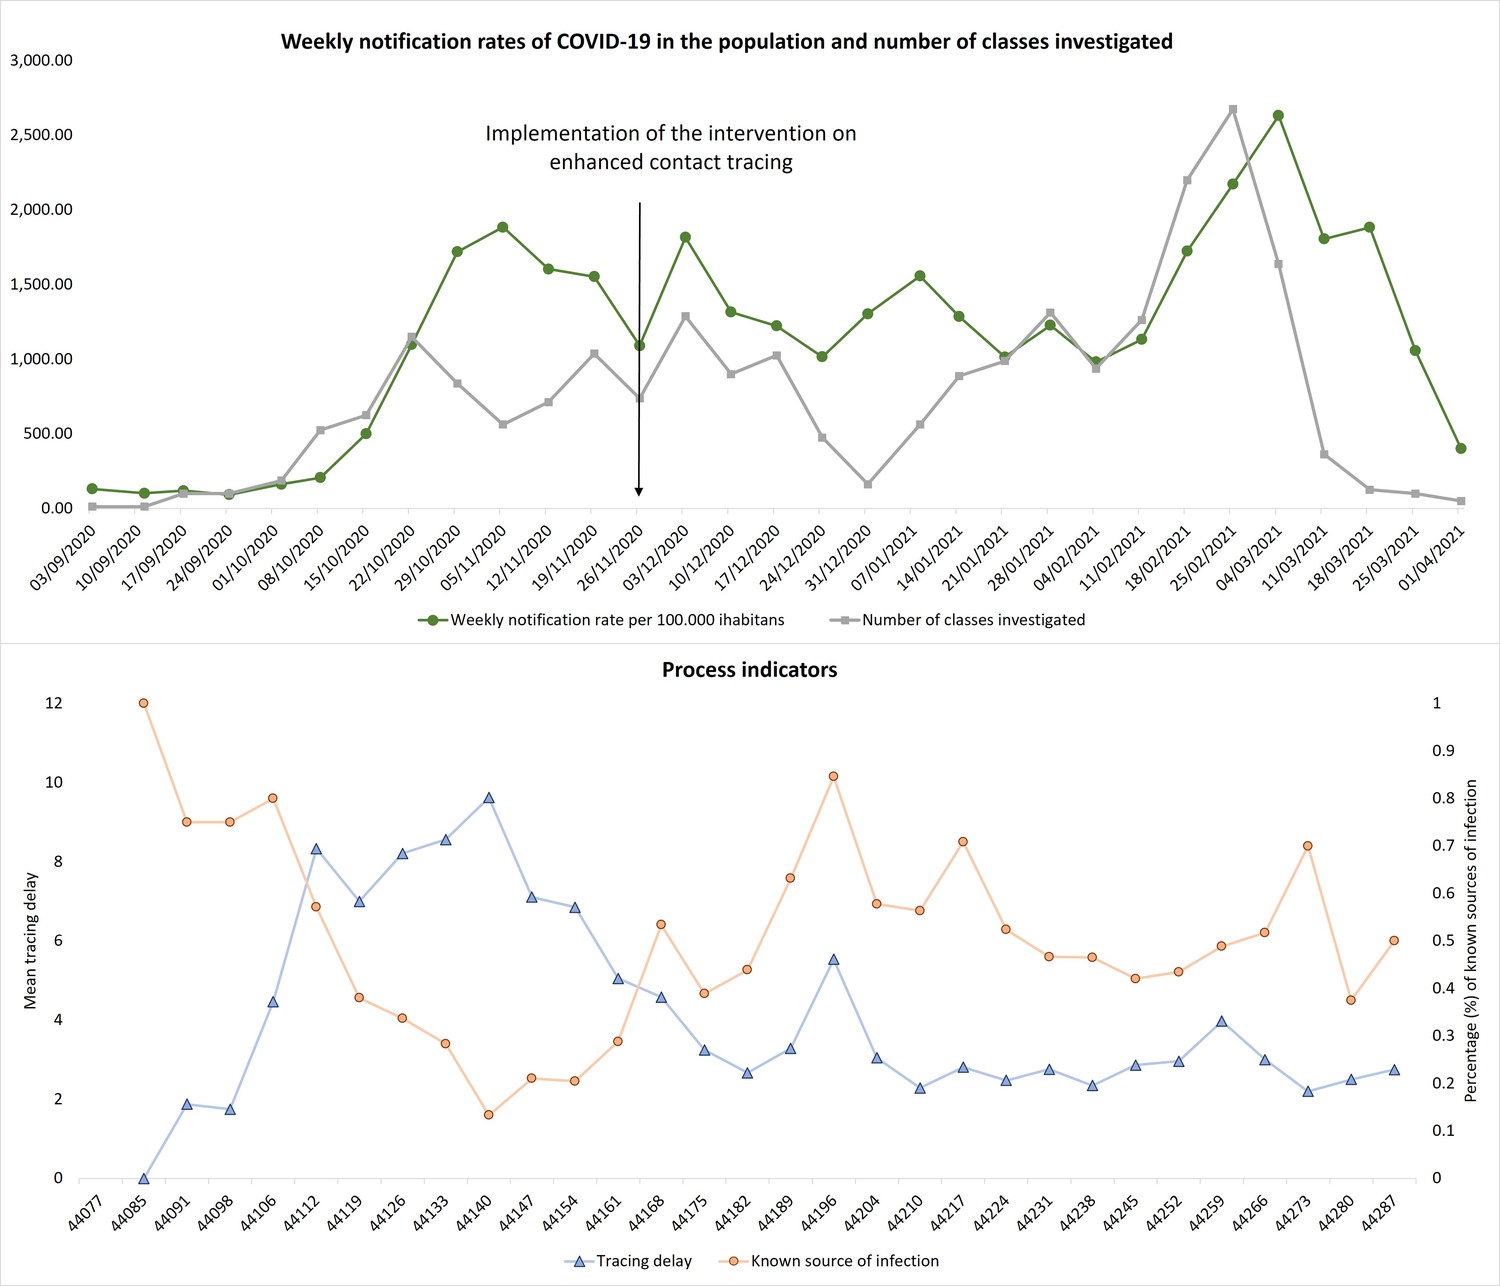
Upper graph: Weekly notification rates of COVID-19 per 100.000 inhabitants of Reggio Emilia Province, 1 September 2020 – 4 April 2021 and number of classes investigated.
Lower graph: Weekly average contact tracing delay and percentage of index cases with a known source of infection.
Tables
Table 1
Characteristics of 1884 classes and 1604 index cases for which a school contact with COVID-19 cases was suspected, before, and after the intervention.
| n (%) | Before interventionn=490 | After interventionn=1394 | |
|---|---|---|---|
| Classes (n=1884) | |||
| Type of school | |||
| Infant-toddler centre | 350 (18.5) | 107 (21.8) | 243 (17.4) |
| Primary school | 540 (28.7) | 125 (25.5) | 415 (29.8) |
| Middle school | 496 (26.3) | 128 (26.1) | 368 (26.4) |
| High school | 478 (25.4) | 129 (26.3) | 349 (25.0) |
| Other educational services | 20 (1.1) | 1 (0.2) | 19 (1.4) |
| Calendar period | |||
| September/October | 248 (13.1) | ||
| November | 263 (13.9) | ||
| December | 316 (16.8) | ||
| January | 265 (14.1) | ||
| February | 523 (27.8) | ||
| March/April | 269 (14.3) | ||
| Class size | |||
| <21 | 862 (45.7) | 191 (39.0) | 671 (48.1) |
| ≥21 | 1011 (53.7) | 293 (59.8) | 718 (51.5) |
| Missing | 11 (0.6) | 6 (1.2) | 5 (0.4) |
| Secondary transmission | |||
| No | 1157 (61.4) | 307 (62.6) | 850 (61.0) |
| Yes | 727 (38.6) | 183 (37.4) | 544 (39.0) |
| Number of secondary cases* | 1 (1-3) | 2 (1-3) | 1 (1-3) |
| Mean attack rate | 0.1 (0.04–0.12) | 0.1 (0.04–0.12) | 0.1 (0.04–0.12) |
| Part of a school cluster | |||
| No | 1 367 (72.6) | 368 (75.1) | 999 (71.7) |
| Yes | 517 (27.4) | 122 (24.9) | 395 (28.3) |
| Tracing delay* | 3 (2-5) | 7 (5-10) | 3 (2-4) |
| Testing delay* | 4 (2-8) | 5 (3-8) | 4 (2-7) |
| Index cases (n=1604) | n=429 | n=1,175 | |
| Type of index case | |||
| Student | 1213 (75.6) | 321 (74.8) | 892 (75·9) |
| Teacher | 391 (24.4) | 108 (25.2) | 283 (24.1) |
| Index case symptomatic | |||
| No | 298 (18.6) | 63 (14.7) | 235 (20) |
| Yes | 1306 (81.4) | 366 (85.3) | 940 (80) |
| Potential source of infection | |||
| Unknown | 814 (50.7) | 283 (66·0) | 531 (45.2) |
| Known | 790 (49.3) | 146 (34·0) | 644 (54.8) |
| Type of source | |||
| Household outbreak | 614 (77.7) | 97 (66.4) | 517 (80.3) |
| Social contact | 26 (3.3) | 7 (4.8) | 19 (2.9) |
| Sport contact | 18 (2.3) | 7 (4.8) | 11 (1.7) |
| Unidentifiable contact | 132 (16.7) | 35 (24.0) | 97 (15.1) |
-
*
Median (IQR), calculated only in classes with secondary transmission.
Table 2
Association between class or index case characteristics (potential confounders) and number of secondary cases.
| Number of classes with secondary transmission | Number of secondary cases | IRR* (95% CI) | |
|---|---|---|---|
| Classes (n=1884) | n=727 | n=1706 | |
| Type of school | |||
| Infant-toddler centre | 131 (18.2) | 349 | ref |
| Primary school | 217 (29.8) | 553 | 1.03 (0.80–1.31) |
| Middle school | 172 (23.7) | 386 | 0.78 (0.60–1.01) |
| High school | 202 (27.8) | 409 | 0.86 (0.66–1.11) |
| Other educational services | 5 (0.7) | 9 | 0.45 (0.17–1.18) |
| Class size | |||
| <21 | 316 (43.5) | 751 | ref |
| ≥21 | 411 (56.5) | 955 | 1.08 (0.91–1.29) |
| Index cases (n=1604) | n=640 | ||
| Type of index case | |||
| Student | 477 (74.5) | 1047 | ref |
| Teacher | 163 (25.5) | 658 | 0.75 (0.61–0.92) |
| Screening | 0 | 1 | na |
-
*
Relative risks are computed with negative binomial models with the count of secondary cases as a dependent variable.
Table 3
Association between class or index case characteristics and the process indicators (potential mediators).
| Totaln | Known source of infection of the index casen (%)* | Index case symptomaticn (%)* | Tracing delayMedian (IQR) | |
|---|---|---|---|---|
| Classes (n=1884) | ||||
| Type of school | ||||
| Infant-toddler centre | 350 | 157 (44.9) | 281 (80.3) | 3 (2-5) |
| Primary school | 540 | 255 (47.2) | 355 (65.7) | 3 (2-5) |
| Middle school | 496 | 206 (41.5) | 293 (59.1) | 3 (2-6) |
| High school | 478 | 216 (45.2) | 360 (75.3) | 3 (2-6) |
| Other educational services | 20 | 7 (35.0) | 10 (50.0) | 3 (1.5–5) |
| P value† | 0.378 | 0.001 | 0.147 | |
| Class size | ||||
| <21 | 862 | 375 (41.4) | 587 (81.6) | 3 (2-5) |
| ≥21 | 1011 | 461 (45.6) | 707 (69.9) | 3 (2-6) |
| Missing | 11 | 5 (45.5) | 5 (45.5) | 6 (3-7) |
| p value† | 0.661 | 0.782 | 0.367 | |
| Index cases (n=1604) | ||||
| Type of index case | ||||
| Student | 1213 | 683 (56.3) | 957 (78.9) | 3 (2-5) |
| Teacher | 391 | 104 (26.7) | 342 (87.5) | 3 (2-6) |
| p value† | <0.001 | <0.001 | 0.486 |
-
*
Values are numbers with row percentages.
-
†
Kruskal-Wallis test.
Table 4
Negative binomial regression of the association between the number of secondary cases (outcome) and intervention promptness indicators (mediators).
Table 5
Four-way decomposition mediation analysis of the association between intervention and the number of secondary cases.
| ERR* | 95% CI | |
|---|---|---|
| Total effect | –0.1 | –0.35–0.15 |
| Controlled direct effect | ||
| Known contact (M=1) | –0.29 | –0.61–0.03 |
| Unknown contact (M=0) | 0.31 | –0.49 to –0.02 |
| Pure indirect effect | –0.02 | –0.10–0.07 |
| Mediated interaction | –0.14 | –0.28 to –0.01 |
| Reference interaction | ||
| Known contact (M=1) | 0.35 | 0.03–0.68 |
| Unknown contact (M=0) | –0.25 | –0.49 to –0.02 |
-
*
Adjusted for the type of school, type of index case, and class size.
-
ERR, excess relative risk; M, mediator (known source of infection of the index case).
Additional files
-
Supplementary file 1
Plain language definitions of the mediation analysis.
- https://cdn.elifesciences.org/articles/85802/elife-85802-supp1-v1.docx
-
Supplementary file 2
STATA code.
- https://cdn.elifesciences.org/articles/85802/elife-85802-supp2-v1.docx
-
Supplementary file 3
Weekly notification rates of new COVID-19 cases in Reggio Emilia.
- https://cdn.elifesciences.org/articles/85802/elife-85802-supp3-v1.xlsx
-
Supplementary file 4
Weekly average contact tracing delay and percentage of index cases with a known source of infection.
- https://cdn.elifesciences.org/articles/85802/elife-85802-supp4-v1.xlsx
-
MDAR checklist
- https://cdn.elifesciences.org/articles/85802/elife-85802-mdarchecklist1-v1.docx
Download links
A two-part list of links to download the article, or parts of the article, in various formats.
Downloads (link to download the article as PDF)
Open citations (links to open the citations from this article in various online reference manager services)
Cite this article (links to download the citations from this article in formats compatible with various reference manager tools)
Effect of an enhanced public health contact tracing intervention on the secondary transmission of SARS-CoV-2 in educational settings: The four-way decomposition analysis
eLife 13:e85802.
https://doi.org/10.7554/eLife.85802


