A novel triptolide analog downregulates NF-κB and induces mitochondrial apoptosis pathways in human pancreatic cancer
- Department of Surgery, The University of Chicago, United States
- Cinkate Pharmaceutical Corp, ZhangJiang District, China
- Department of Pathology, The University of Chicago, United States
- Department of Pediatrics, Indiana University, United States
Figures
Figure 1 with 1 supplement
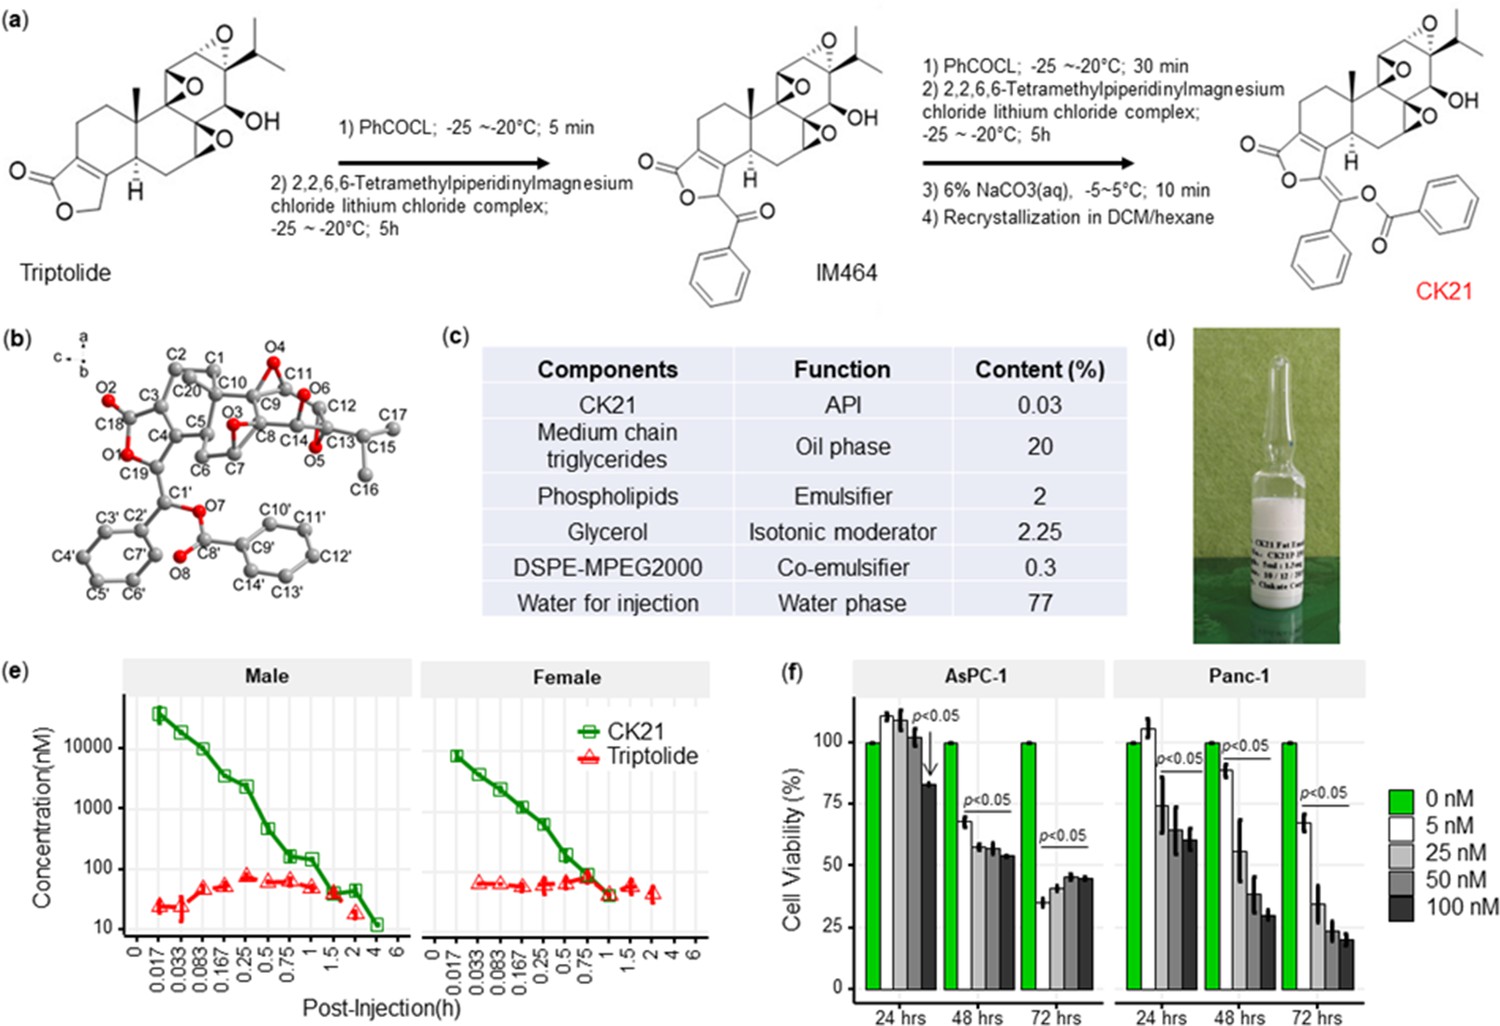
CK21 exhibits a stable release of triptolide in vivo.
(a) Synthesis of compound CK21 as white solid after recrystallization in a mixed organic solvent. Compound structure was characterized by H-NMR, C-NMR, and HR-MS. (b) Thermal ellipsoid model illustrating the crystal structure of CK21; carbon atoms were shown in gray, and oxygen atoms in red. Hydrogen atoms were omitted for clarity (c) Composition and putative function in the CK21 fat emulsion. (d) Macroscopic image of the final emulsion product of CK21. (e) In vivo administration of CK21 into SD rats (3 rats per group) converted into triptolide. CK21 was injected intravenously into female (1.5 mg/kg) and male (3 mg/kg) rats, and the concentration of CK21 and triptolide in the plasma was quantified. For samples ≥4 hours, no CK21 or triptolide was detected. (f) CK21 inhibited the proliferation of human pancreatic cancer cell lines. Data presented in all the graphs are mean ± standard error. Statistical analysis: Two-way ANOVA (repeated measures) with post-hoc comparison of the means was conducted for (f).
-
Figure 1—source data 1
Safety profile of CK21.
Acute maximum tolerated dose (MTD) studies, toxicity and toxicokinetic studies on rats and beagle dogs.
- https://cdn.elifesciences.org/articles/85862/elife-85862-fig1-data1-v2.pptx
-
Figure 1—source data 2
IC50 (µM) of triptolide (TP) or CK21 for different cancer cell lines in an in vitro cell viability assay.
- https://cdn.elifesciences.org/articles/85862/elife-85862-fig1-data2-v2.pptx
Figure 1—figure supplement 1

In vitro viability assay of primary human fibroblasts cocultured with CK21 at the indicated concentrations for 72 hours.
Figure 2 with 4 supplements

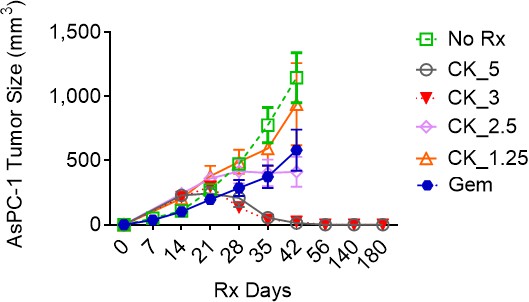
CK21 shows efficacy and minimal toxicity at 3 mg/kg in different in vivo animal models.
(a) Scheme of in vivo efficacy studies. Human pancreatic cancer cell line, AsPc-1, was implanted into nude mice and CK21 treatment was initiated ~14 days later and administered daily for 4 weeks. (b) Macroscopic images of tumor-bearing nude mice after receiving CK21 or blank emulsion after 4 weeks treatment. (c) AsPC-1 tumor volume after subcutaneous implantation and CK21 or gemcitabine treatment. (d) Weight change of nude mice bearing AsPC-1 and receiving CK21. (e) H&E staining of mice organ tissues after CK21 treatment. (f) TUNEL staining of tumor tissue and (g) percentage of apoptotic cells in AsPC-1 tumor after 2 weeks CK21. (h) Bioluminescence images of nude mice bearing intra-pancreatic AsPC-1 and receiving CK21. Color scheme represents the intensity of luminescence reflecting tumor size in each mouse. Mice with higher initial tumor burden was placed into CK21 group, and those with lower initial tumor burden into control group. (i) Fold change of the luminescence intensity of the nude mice bearing intra-pancreatic AsPC-1. (j) Survival curve of mice with orthotopic AsPC-1 tumors receiving CK21 treatment. In all the figures, post-implant days are days after tumor implantation and post-Rx days are days after receiving CK21 treatment (doses indicated as mg/kg). Data presented in all the graphs are mean ± standard error (some error bars are too small to be visible). Statistical analysis: Two-way ANOVA (not repeated measures) with post-hoc comparison of the means of each data set was conducted for all the line graphs except (i); For survival curve, Log-rank (Mantel-Cox) test was applied. (* P<0.05, ** P<0.01, *** P<0.001, **** P<0.0001).
Figure 2—figure supplement 1

Survival curve of mice receiving CK21 at 5 mg/kg or triptolide (TP) at 0.25 mg/kg.
Figure 2—figure supplement 2
AsPC-1 subcutaneous tumors showed no tumor relapse after treated with CK21 at 5 or 3 mg/kg.
Figure 2—figure supplement 3

CK21 inhibited growth of Panc-1 tumors in a subcutaneous xenograft model.
(a) Tumor growth with CK21 treatment at 3 mg/kg daily for 28 days. (b) Weight change of mice during Ck21 treatment.
Figure 2—figure supplement 4

Male mice with AsPC-1 tumors respond to CK21.
(a) Subcutaneous AsPC-1 tumor in male mice after CK21 treatment at 1.5 mg/kg. (b) Male mice weight during CK21 treatment. (N=5 for each experimental group).
Figure 3
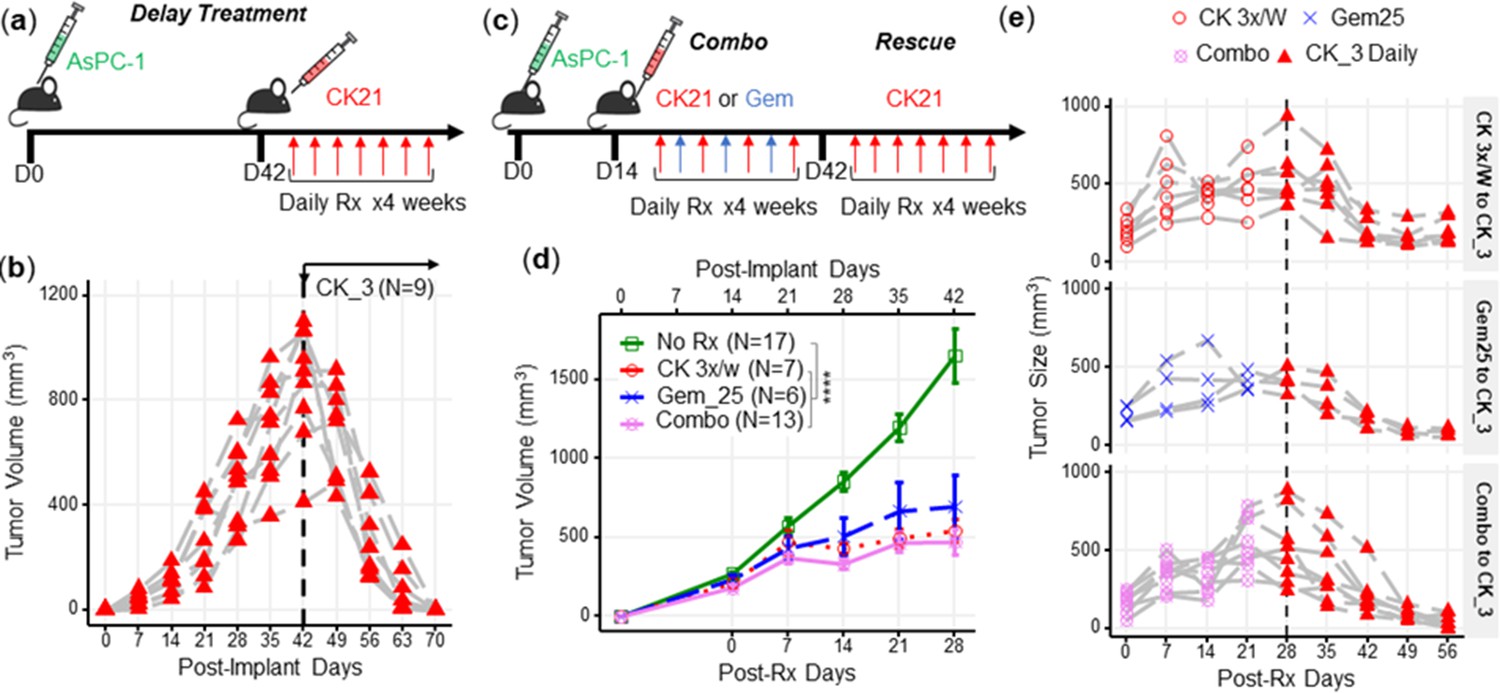
CK21 of 3 mg/kg daily shows efficacy in delay therapy and rescues mice that failed in synergistic therapy.
(a) Scheme of delayed therapy. Mice received CK21 at 3 mg/kg daily for 4 weeks, starting on day 42 post-tumor innoculation. (b) Tumor volume during delayed CK21 therapy. (c) Scheme of combination (Combo) and rescue therapy. Mice receive CK21 3 mg/kg (3 X/week; Mo, We, Fr), gemcitabine at 25 mg/kg (3 X/week; Tu, Th, Sa), or both. (d) Tumor size during the Combo therapy of CK21. (e) Mice which failed at CK21 or gemcitabine or Combo therapy from (c–d) were then rescued by switching to CK21 at 3 mg/kg daily, and tumor size monitored. Post-implant days are days after tumor implantation. Post-Rx days are days after receiving drug treatment. Data presented in (d) are mean ± standard error. Statistical analysis: Two-way ANOVA (not repeated measures) with post-hoc comparison of the means of each data set was conducted for (d), (**** P<0.0001). Each line in (b) and (e) represents a single mouse.
Figure 4 with 5 supplements

Transcriptome analysis of patient-derived pancreatic tumor organoids and AsPC-1 after CK21 treatment.
(a) In vitro culture of different organoids with escalating concentrations of CK21 for 72 hours. Gemcitabine was included as a positive control. (b) U049MAI tumor size in nude mice during CK21 treatment. (c) Co-expression Venn diagram of differentially expressed genes that were significantly different with CK21 treatment. Size of the circles reflect the total number of differentiate expressed genes (transformed using log2(n+1)). (d) Genes of interest showing consistent up or down regulation as treatment time increased. Fold change is color coded where red is upregulation, blue is down regulation. Circle presents the genes had an adjusted P-value <0.05, and triangle presents the genes had an adjusted pP-value >0.05. Size of the circle represents the adjusted p values. (e) RT-qPCR analysis of gene expression in tumor organoids after CK21 treatment for 24 hours. (f) Scheme of RNA seq using in vivo orthotropic AsPC-1 model. (g) Heatmaps of top statistically significant differentially expressed genes in AsPC-1 tumors after treatment with CK21 for three days. Statistical analysis: Two-way ANOVA (not repeated measures) with post-hoc comparison of the means of each drug dose was compared to No Rx controls for (a). Line indicates the doses that resulted in significant reduction in viability by CK21 or gemcitabine. Two-way ANOVA with post-hoc comparison of the means of each time point was conducted for (b), Multiple t tests were conducted for (e) (** P<0.01, *** P<0.001, **** P<0.0001).
-
Figure 4—source data 1
Essential information on the pancreatic tumor organoids used in this study.
Details of organoids from Patient# 1, 2, 6, and 7 are provided in reference 39 (Romero-Calvo et al., 2019).
- https://cdn.elifesciences.org/articles/85862/elife-85862-fig4-data1-v2.pptx
Figure 4—figure supplement 1
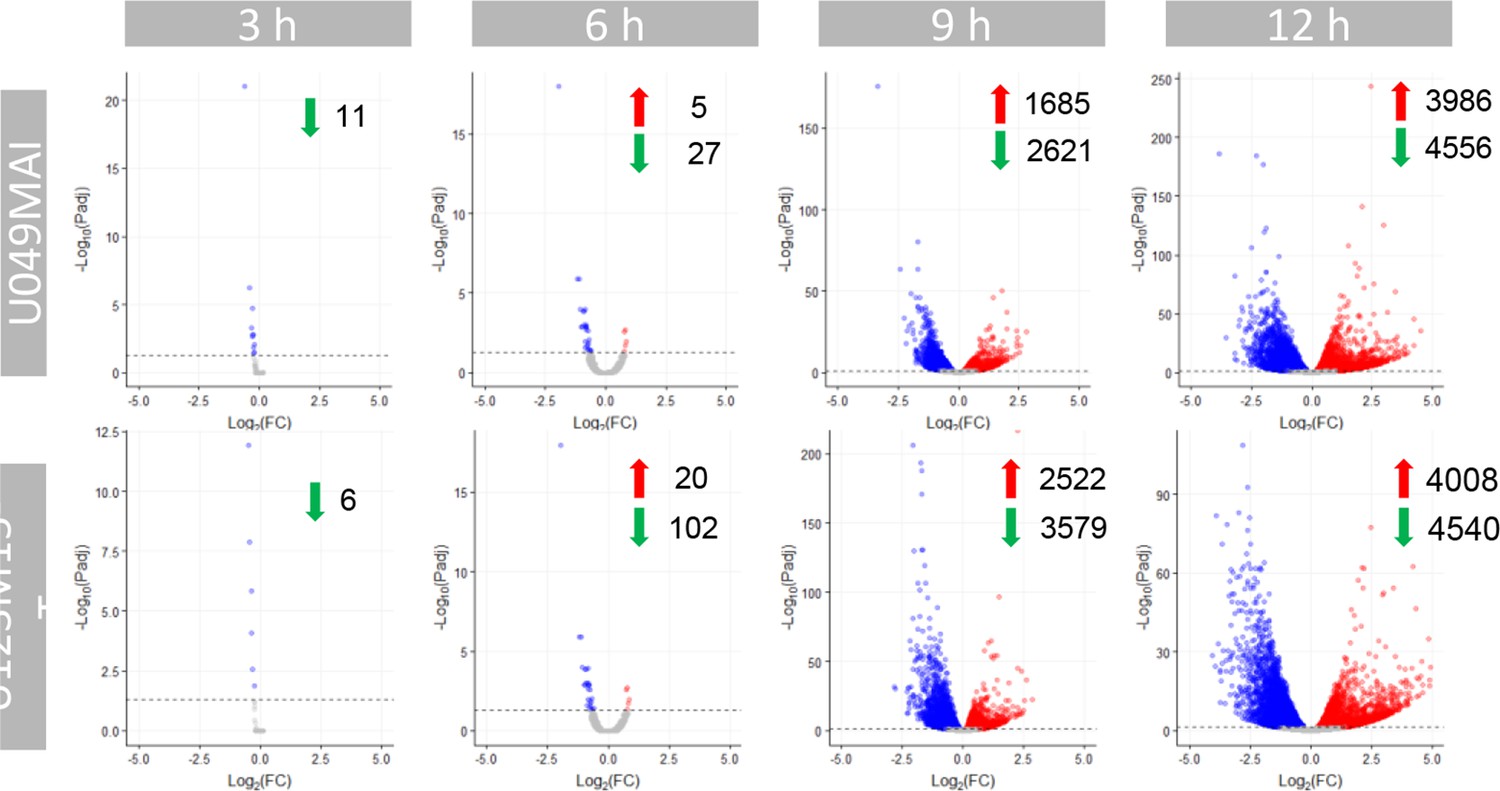
Volcano plots highlighting differentially expressed genes by U049MAI and U123m15-T respectively after 3 hours, 6 hours, 9 hours, and 12 hours of CK21 (50 nM) treatment.
Figure 4—figure supplement 2

DDIT4 expression was significantly reduced after CK21 treatment.
(a) CK21 (50 mM) reduced the expression of DDIT4 in AsPC-1, Panc-1, U049MAI, and U123M15-T after 24 hoursr of culture. (b) Baseline expression of DDIT4 in different tumor cells (without CK21 treatment).
Figure 4—figure supplement 3

DDIT4 knockdown or overexpression didn’t impact the sensitivty of tumor cell lines to CK21 treatment.
(a) knockdown of DDIT4 in Panc-1 did not alter response to CK21 (50 nM). (b) AsPC-1 overexpression of DDIT4 did not alter response to CK21 (50 nM).
Figure 4—figure supplement 4

Tumor size of KC-6141 and KPC-961 after subcutaneous implantation in B6 or B6 X129.
CK21 given at 4 mg/kg/day for KC-6141 and 3 mg/kg/day for KPC-961 resulted in modest inhibition of tumor growth.
Figure 4—figure supplement 5

RT-qPCR analysis of differentially expressed genes by two mice pancreatic tumor cell lines after CK21 treatment at 50 nM for 24 hours.
Figure 5 with 2 supplements

Bioinformatic analysis of the effect of CK21 on patient-derived pancreatic tumor organoids.
(a) Volcano plots of differentially expressed genes in (a) U049MAI and (b) U123M15-T after 12 hours CK21 treatment (50 nM). Significance cutoff was s P<0.05. Upregulation was colored as red, and downregulation was colored as blue. (c) Enrichment of molecular and cellular functions in U049MAI and U123M15-T after CK21 treatment. Size represents gene numbers. Color and shape represent functional groups. Z-score represents the confidence of the prediction, where positive value means upregulation and negative value means downregulation. Canonical pathway enrichment in (d) U049MAI and (e) U123M15-T after treatment with CK21 at 50 nM. Color represent Z-score where red means upregulation and blue means downregulation. Statistical analysis: Unpaired t-test was conducted for (c); Data presented in all the bar graphs are mean ± standard error.
Figure 5—figure supplement 1

Pathway enrichment of U049MAI and U123M15-T after treatment with CK21 (50 nM) for 9 hours.
Top pathways for (a) U049MAI and (b) U123M15-T.
Figure 5—figure supplement 2

Pathway enrichment of orthotopic AsPC-1 tumors after treatment with CK21 (3 mg/kg) for 3 days.
Figure 6 with 2 supplements
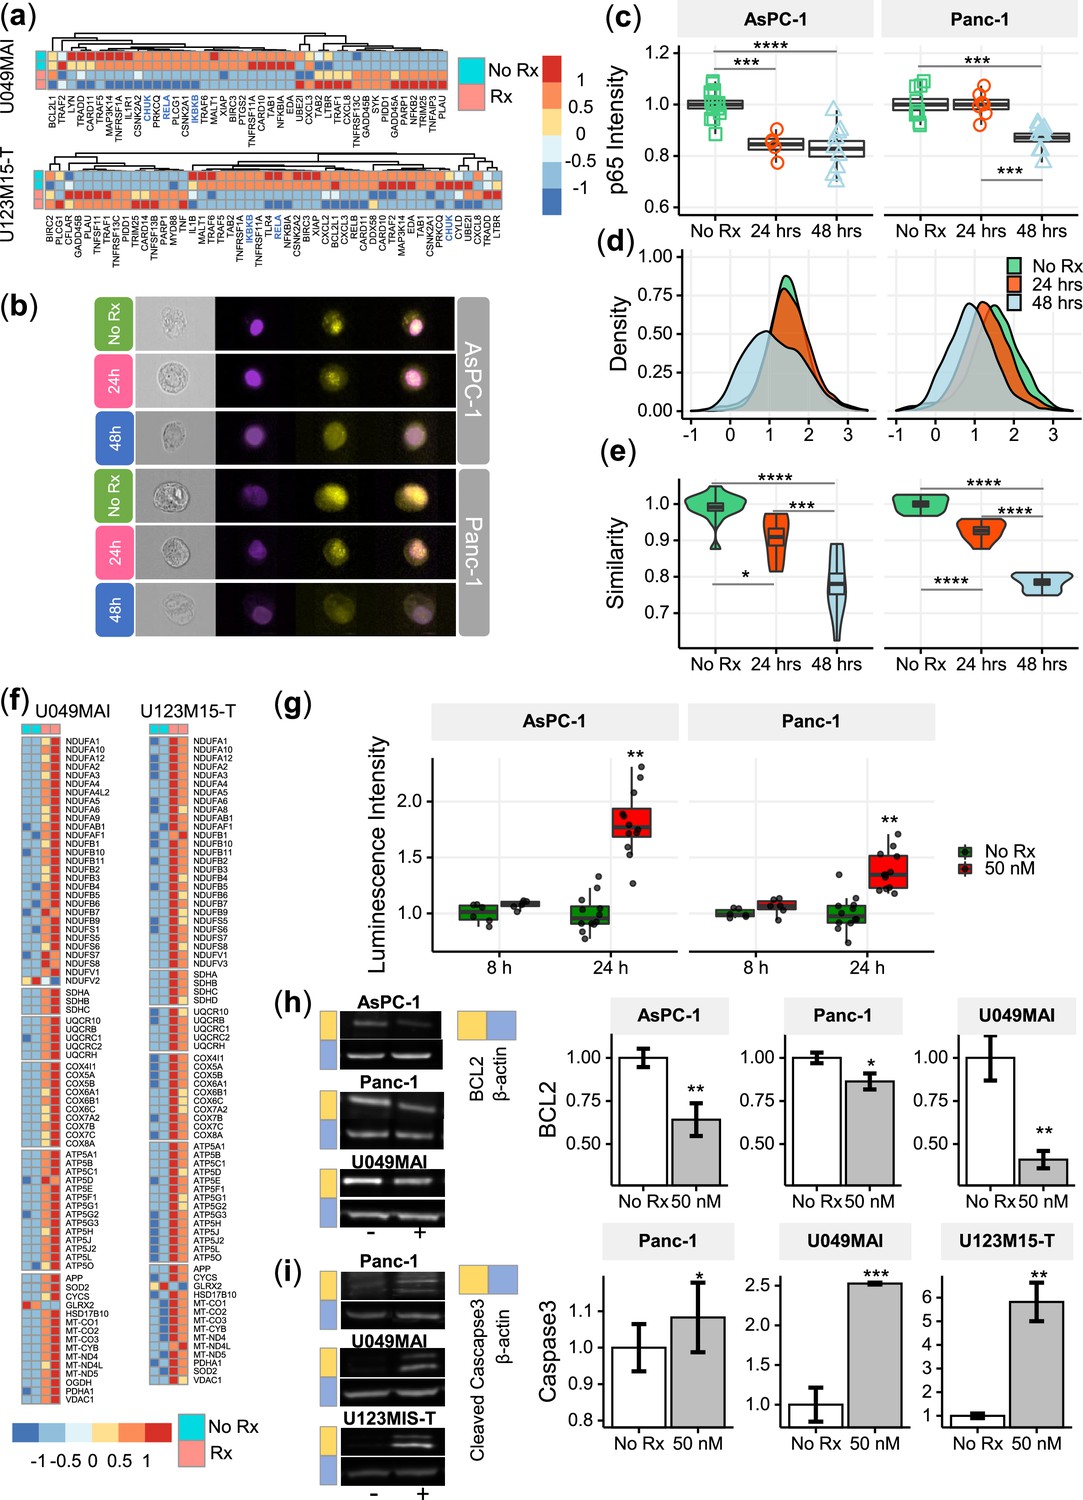
CK21 inhibits NF-κB activation and induces mitochondrial mediated apoptosis.
(a) Heatmap of the relative expression of genes in the NF-κB pathway in U049MAI and U123M15-T after CK21 treatment. Genes are color coded where red means upregulated, and blue means downregulated. Only statistically significant genes are listed. (b) Representative p65 translocation images of AsPC-1 and Panc-1 after treated with CK21 at 50 nM. Nuclei stained as purple, p65 stained as yellow. (c) Relative p65 MFI of AsPC-1 and Panc-1 after CK21 (50 nM) treatment. (d) Density plots and (e) similarity scores of p65 for AsPC-1 and Panc-1. (f) Heatmaps of genes involved in oxidative phosphorylation of U049MAI and U123M15-T after CK21 treatment. (g) Reactive oxygen species generated after CK21 treatment (8 and 24 hoursr). Representative blotting images and quantification of (h) BCL2 expression and (i) cleaved caspase-3 at 24 hours after CK21 treatment. Statistical analysis: One-way ANOVA with post-hoc Tukey comparison of the means of each data set was conducted for (c), (e); Unpaired T test was conducted at different time points for (g), (h), (i). (* P<0.05, ** P<0.01, *** P<0.001, **** P<0.0001).
-
Figure 6—source data 1
Full unedited gels.
- https://cdn.elifesciences.org/articles/85862/elife-85862-fig6-data1-v2.zip
Figure 6—figure supplement 1
Flow plots illustrating active Caspase 3/7 expression in AsPC-1 and Panc-1 treated with CK21 (50 and 400 mM) for 24 hoursr.
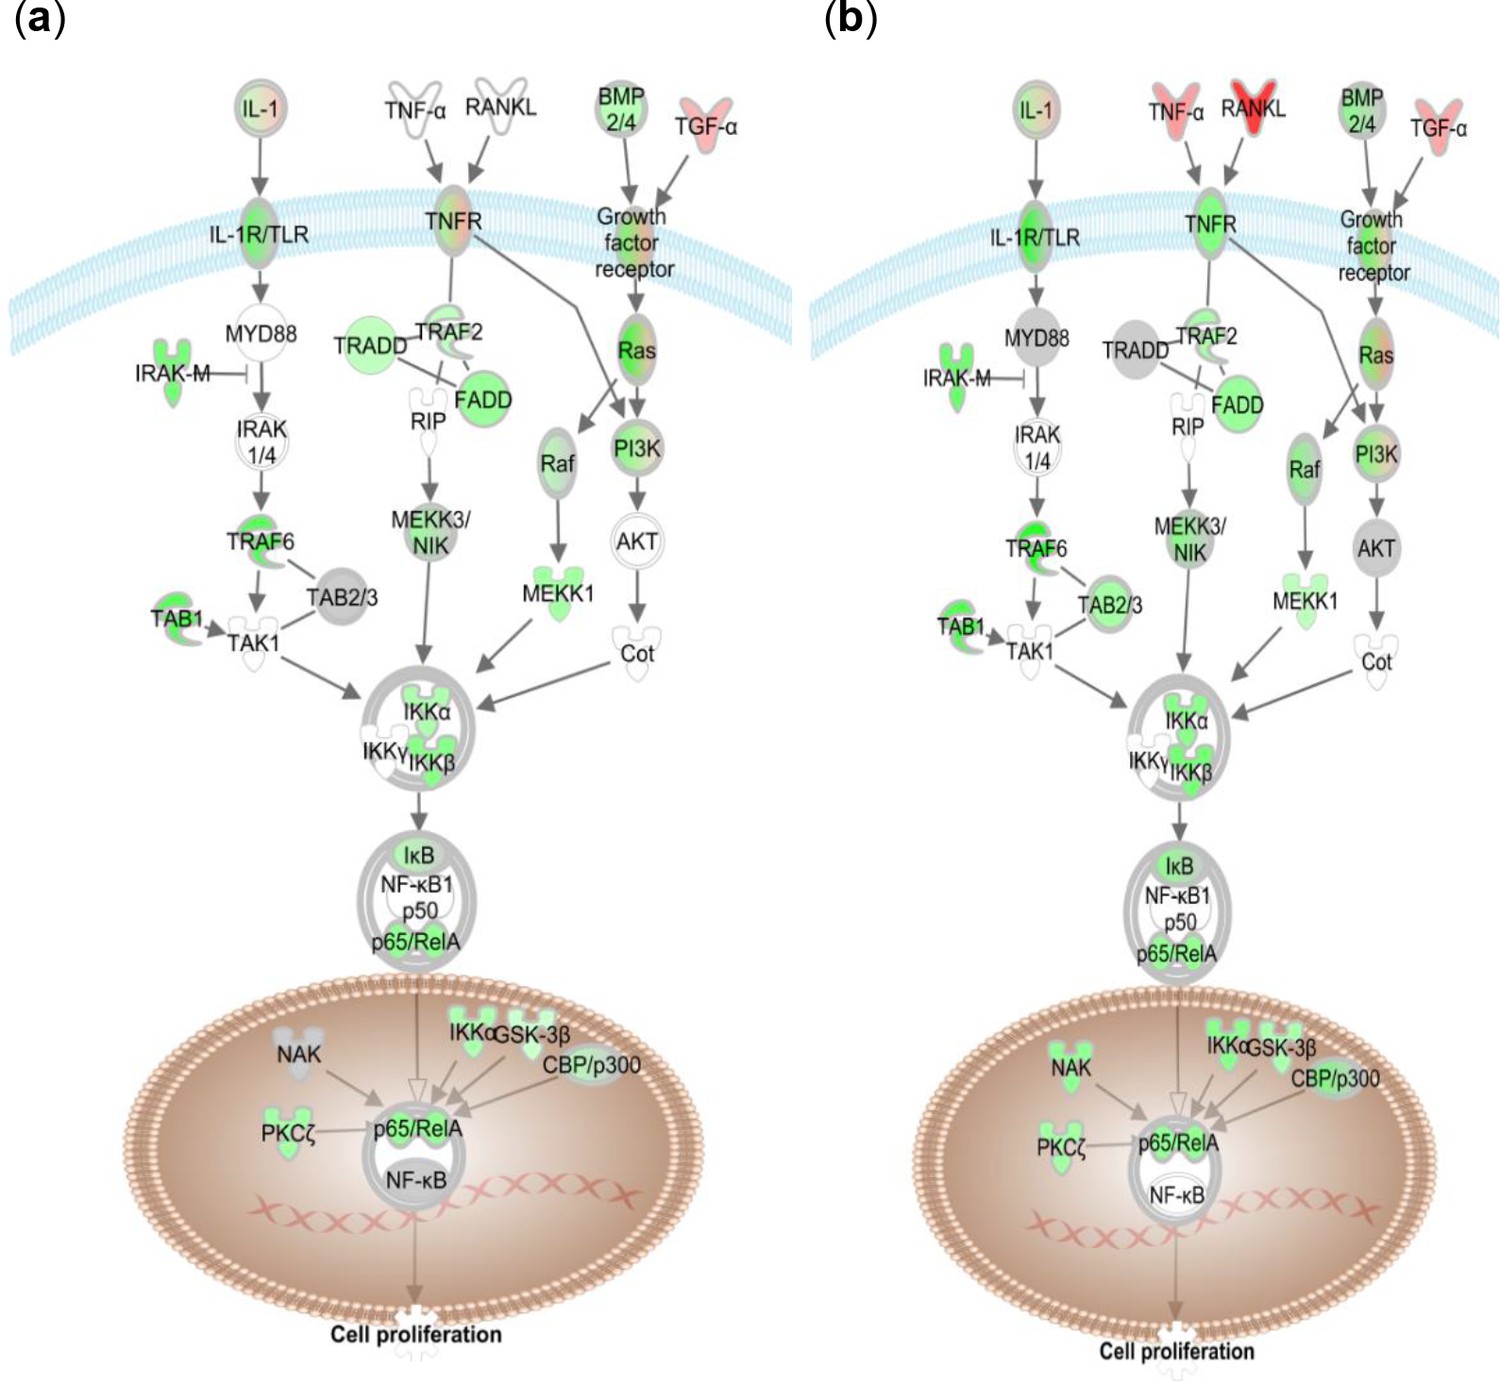
Figure 6—figure supplement 2

Key regulators in NF-kB canonical signaling pathway are significantly downregulated in (a) U049MAI and (b) U123M15-T after treatment with CK21 (50 nM) for 12 hoursr.
Green represents downregulation and red represent upregulation by IPA analysis.
Figure 7 with 1 supplement
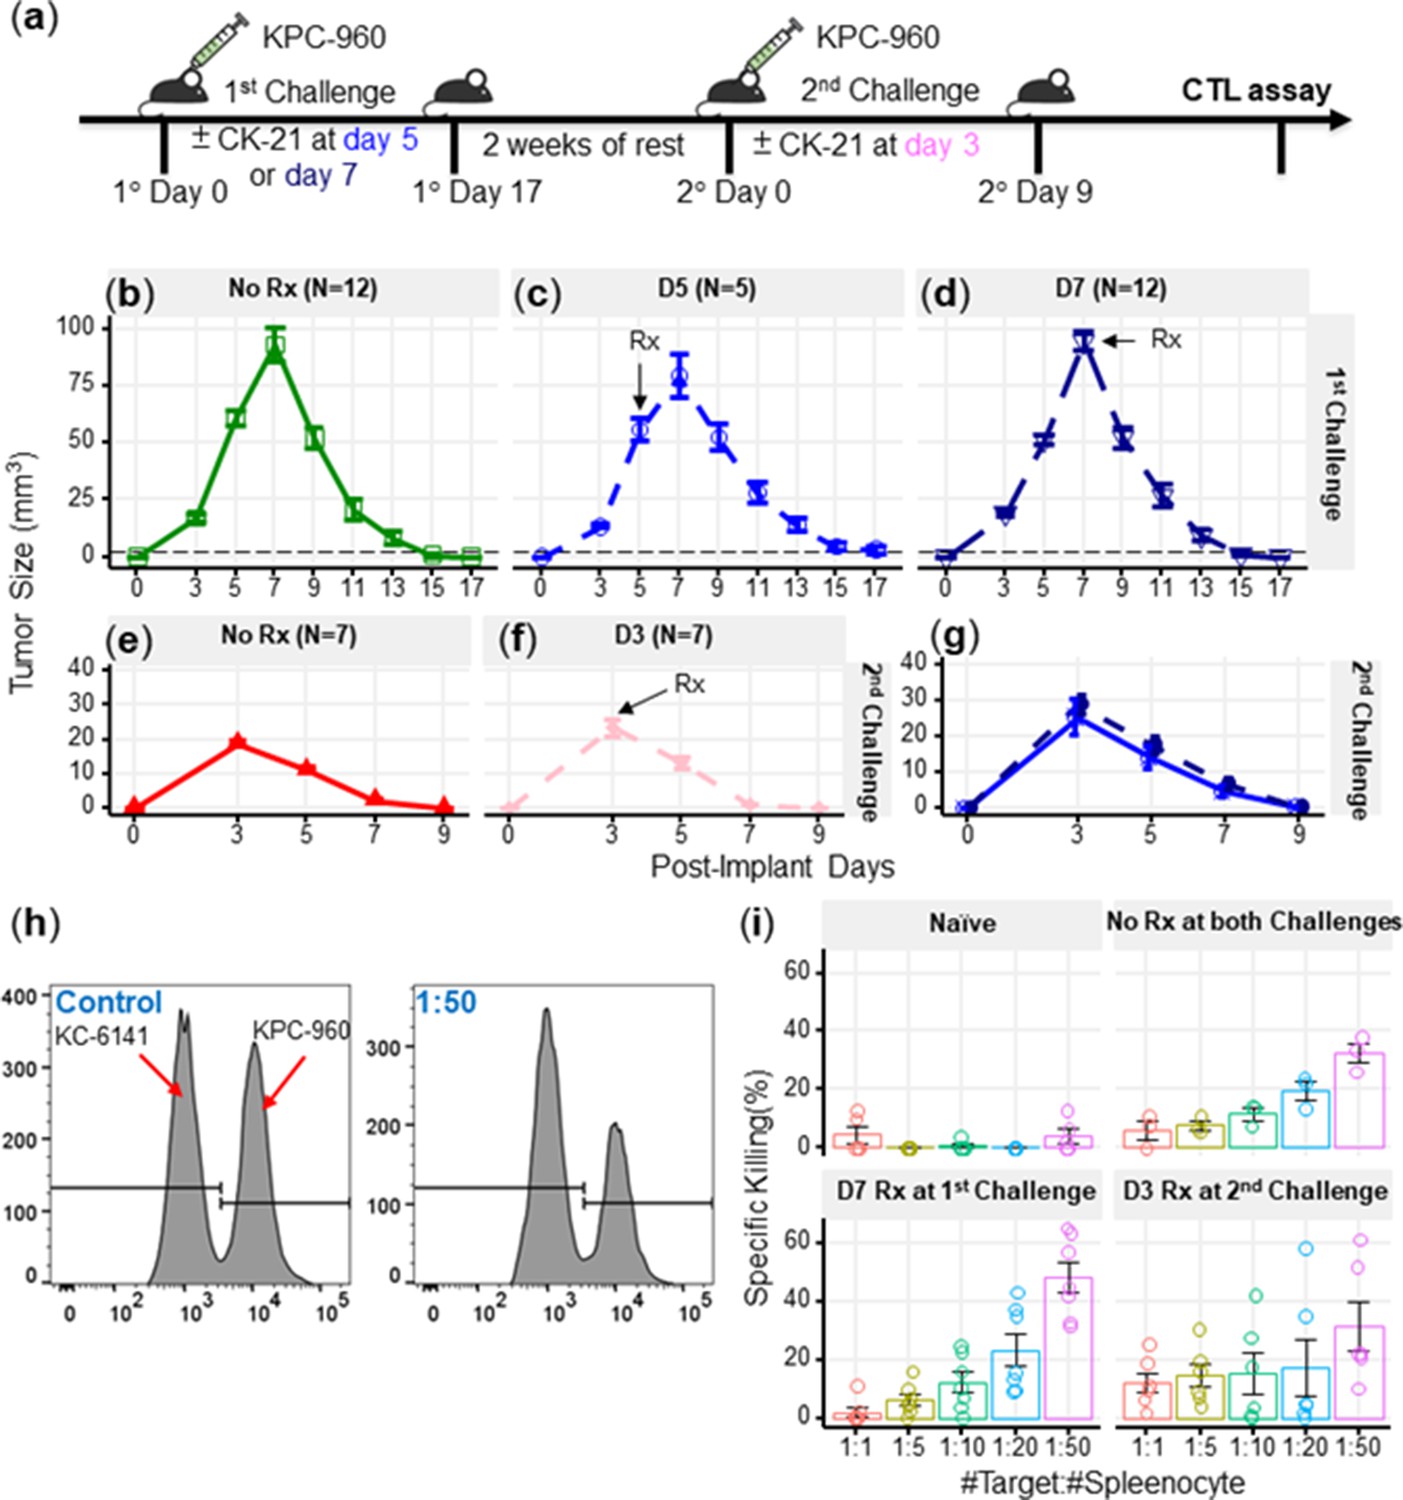
CK21 does not exhibit significant immunosuppression in a spontaneous tumor rejection model.
(a) Scheme of a subcutaneous model of mouse pancreatic tumor, KPC-960, with CK21 treatment. CK21 was provided at 3 mg/kg daily starting on day 5 or day 7. During secondary challenge, CK21 was provided at 3 mg/kg daily from day 3 post-tumor implantation. Tumor size of mice receiving first challenge (b) without any CK21, (c) with CK21 starting on day 5, (d) or day 7. Tumor size of mice receiving a second challenge (e) without any CK21, or (f) with CK21 treatment starting on day 3. (g) Mice that cleared KPC-960 tumor in (c) and (d) received a second tumor challenge without any CK21; tumor size were quantified weekly (h) Flow plots of CTL assay, another mouse pancreatic tumor, KC-6141, was used as a non-specific target. Quantification of the recovered KPC-960 compared to KC-6141, as a quantification of specific cytotoxic T cell (CTL) killing. (i) Specific CTL killing of KPC-960 cells with splenocytes from (e), (f), (g). Splenocytes from naïve mice was included as a negative control. Data presented in all the graphs are mean ± standard error. Statistical analysis: Two-way ANOVA with post-hoc comparison of the means of each time point was conducted for (b) and (e), (* P<0.05, ** P<0.01, *** P<0.001).
Figure 7—figure supplement 1
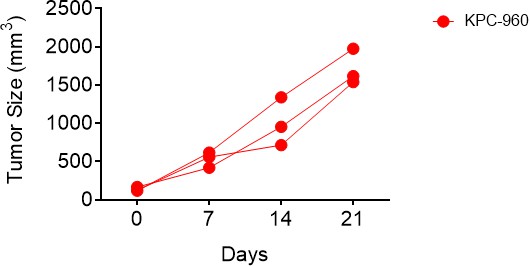
Tumor size of KPC-960 after subcutaneous implantation in nude mice.
CK21 given at 3 mg/kg/day resulted in limited efficacy on tumor growth. Each line represents an animal.
Tables
Key resources table
| Reagent type (species) or resource | Designation | Source or reference | Identifiers | Additional information |
|---|---|---|---|---|
| Chemical compound, drug | CK21 | In house | NA | |
| Chemical compound, drug | Gemcitabine | Actavis | 45963-619-59 | |
| Cell line (Homo-sapiens) | AsPC-1 | ATCC | CRL-1682 | |
| Cell line (Homo-sapiens) | Luciferase transfected AsPC-1 | Indiana University | N/A | Luciferase transfected |
| Cell line (Homo-sapiens) | Panc-1 | ATCC | CRL-1469 | |
| Cell line (Mus) | KC-6141 | University of Nebraska | N/A | |
| Cell line (Mus) | KPC-960 | University of Nebraska | N/A | |
| Cell line (Mus) | KPC-961 | University of Nebraska | N/A | |
| Biological sample (Mus) | B6129SF1/J | Jackson Laboratory | 101043 | |
| Biological sample (Mus) | C57BL/6 J | Jackson Laboratory | 000664 | |
| Biological sample (Mus) | Athymic Nude-Foxn1nu | Envigo | ||
| Commercial assay or kit | DMEM | ATCC | 30–2002 | |
| Commercial assay or kit | RPMI | Quality Biological | 112-024-101 | |
| Commercial assay or kit | Fetal bovine serum | Atlanta Biologicals | S115OH | |
| Commercial assay or kit | Penicillin streptomycin | Gibco | 15140–122 | |
| Commercial assay or kit | L-Glutamine | Gibco | 25030–081 | |
| Commercial assay or kit | DMSO | Sigma | 276855 | |
| Commercial assay or kit | Trypsin-EDTA | Stemcell | 07901 | |
| Commercial assay or kit | TrypLE express | Gibco | 12605–010 | |
| Commercial assay or kit | Sodium pyruvate | Gibco | 11360–070 | |
| Commercial assay or kit | MEM nonessential amino acids | Cellgro | 25–025 CL | |
| Commercial assay or kit | 2-Mercaptoethanol | Gibco | 21985–023 | |
| Commercial assay or kit | IntestiCult organoid growth medium | Stemcell | 6005 | |
| Commercial assay or kit | A83-01 | Sigma | SML0788 | |
| Commercial assay or kit | FGF-10 | Sigma | SRP3262 | |
| Commercial assay or kit | Gastrin I | Sigma | G9145 | |
| Commercial assay or kit | N-acetylcysteine | Sigma | A9165 | |
| Commercial assay or kit | Nicotinamide | Sigma | N0636 | |
| Commercial assay or kit | B27 supplement | Gibco | 17504–044 | |
| Commercial assay or kit | Primocine | Invivogen | ant-pm-1 | |
| Commercial assay or kit | Y-27632 | Tocris | 1254 | |
| Commercial assay or kit | Matrigel | Corning | 356231 | |
| Commercial assay or kit | TrypLE | Gibco | 12605–010 | |
| Commercial assay or kit | CellTiter 96 AQueous one solution | Promega | G3580 | |
| Commercial assay or kit | Caspase-3/7 green detection | Thermo Fisher | C10427 | |
| Commercial assay or kit | SYTOX dead cell stain | Thermo Fisher | C10427 | |
| Commercial assay or kit | CFSE cell proliferation kit | Thermo Fisher | C34554 | |
| Commercial assay or kit | ACK lysing buffer | Quality Biological | 118-156-101 | |
| Commercial assay or kit | ROS-Glo H2O2 assay | Promega | G8820 | |
| Commercial assay or kit | NuPAGE 10% Bis-Tris gel | Invitrogen | NP0301BOX | |
| Commercial assay or kit | NuPAGE MES SDS running buffer | Novex | NP002 | |
| Commercial assay or kit | NuPAGE MOPS SDS running buffer | Novex | NP001 | |
| Commercial assay or kit | NuPAGE transfer buffer | Novex | NP0006-1 | |
| Commercial assay or kit | NuPAGE LDS sample reducing agent | Invitrogen | NP0007 | |
| Commercial assay or kit | NuPAGE sample buffer | Invitrogen | NP0009 | |
| Commercial assay or kit | NuPAGE antioxidant | Invitrogen | NP0005 | |
| Commercial assay or kit | TBS Tween-20 buffer | Thermo Scientific | 28360 | |
| Commercial assay or kit | Invitrolon PVDF filter paper | Novex | LC2005 | |
| Commercial assay or kit | PageRuler prestained protein ladder | Thermo Scientific | 26616 | |
| Commercial assay or kit | Methanol | Fisher Scientific | A452-4 | |
| Commercial assay or kit | Pierce protease&phosphatase inhibitor | Thermo Scientific | A32959 | |
| Commercial assay or kit | Bovine serum albumin | Sigma | A7906 | |
| Commercial assay or kit | SuperSignal west pico PLUS | Thermo Scientific | 34579 | |
| Commercial assay or kit | Pierce bradford assay kit | Thermo Scientific | 23246 | |
| Antibody | Anti-beta actin (Rabbit polyclonal) | Abcam | ab8227 | (1:2000) |
| Antibody | Recombinant anti-REDD-1/DDIT4 (Rabbit monoclonal) | Abcam | ab191871 | (1:1000) |
| Antibody | Anti-Caspase-3 (Rabbit polyclonal) | Abcam | ab13847 | (1:500) |
| Antibody | Recombinant anti- BCL2 (Rabbit monoclonal) | Abcam | ab182858 | (1:2000) |
| Antibody | Goat anti-rabbit IgG H&L (Goat polyclonal) | Abcam | ab205718 | (1:10000) |
| Antibody | Phospho-NFkB p65, PE, eBioscience(Mouse monoclonal) | Invitrogen | 12986342 | (1:100) |
| Commercial assay or kit | 4',6-Diamidino-2-Phenylindole, Dilactate | Biolegend | 422801 | (1:1000) |
| Commercial assay or kit | PowerUp SYBR green master mix | Applied Biosystem | A25742 | |
| Commercial assay or kit | High capacity cDNA reverse transcription | Applied Biosystem | 4368814 | |
| Commercial assay or kit | D-Luciferin potassium salt | Perkin Elmer | 122799 | |
| Commercial assay or kit | PBS | GenClone | 25–508 | |
| Commercial assay or kit | Cell recovery solution | Corning | 354253 | |
| Commercial assay or kit | RNeasy Plus Mini Kit | Qiangen | 74124 | |
| Commercial assay or kit | DNase I recombinant | Roche | 04536282001 |
Additional files
Download links
A two-part list of links to download the article, or parts of the article, in various formats.
Downloads (link to download the article as PDF)
Open citations (links to open the citations from this article in various online reference manager services)
Cite this article (links to download the citations from this article in formats compatible with various reference manager tools)
A novel triptolide analog downregulates NF-κB and induces mitochondrial apoptosis pathways in human pancreatic cancer
eLife 12:e85862.
https://doi.org/10.7554/eLife.85862


