The interferon-rich skin environment regulates Langerhans cell ADAM17 to promote photosensitivity in lupus
- Autoimmunity and Inflammation Program, Hospital for Special Surgery Research Institute, United States
- Department of Microbiology and Immunology, Weill Cornell Medical College, United States
- David Z. Rosensweig Genomics Research Center, Hospital for Special Surgery Research Institute, United States
- Arthritis and Tissue Degeneration Program, Hospital for Special Surgery Research Institute, United States
- Physiology, Biophysics, and Systems Biology Program, Weill Cornell Graduate School of Medical Sciences, United States
- Department of Medicine, AMPEL BioSolutions, United States
- Pediatric Rheumatology, Department of Medicine, Hospital for Special Surgery, United States
- Department of Pediatrics, Weill Cornell Medical College, United States
- Rheumatology, Department of Medicine, Hospital for Special Surgery, United States
- Department of Dermatology, Weill Cornell Medical College, United States
- Weill Cornell/Rockefeller/Sloan-Kettering Tri-Institutional MD-PhD Program, Weill Cornell Medical College, United States
- Immunology and Microbial Pathogenesis Program, Weill Cornell Graduate School of Medical Sciences, United States
- Department of Dermatology, University of Massachusetts Medical School, United States
- Laboratory of Investigative Dermatology, Rockefeller University, United States
- Department of Physiology, Biophysics, and Systems Biology, Weill Cornell Medical College, United States
Figures
Figure 1 with 1 supplement
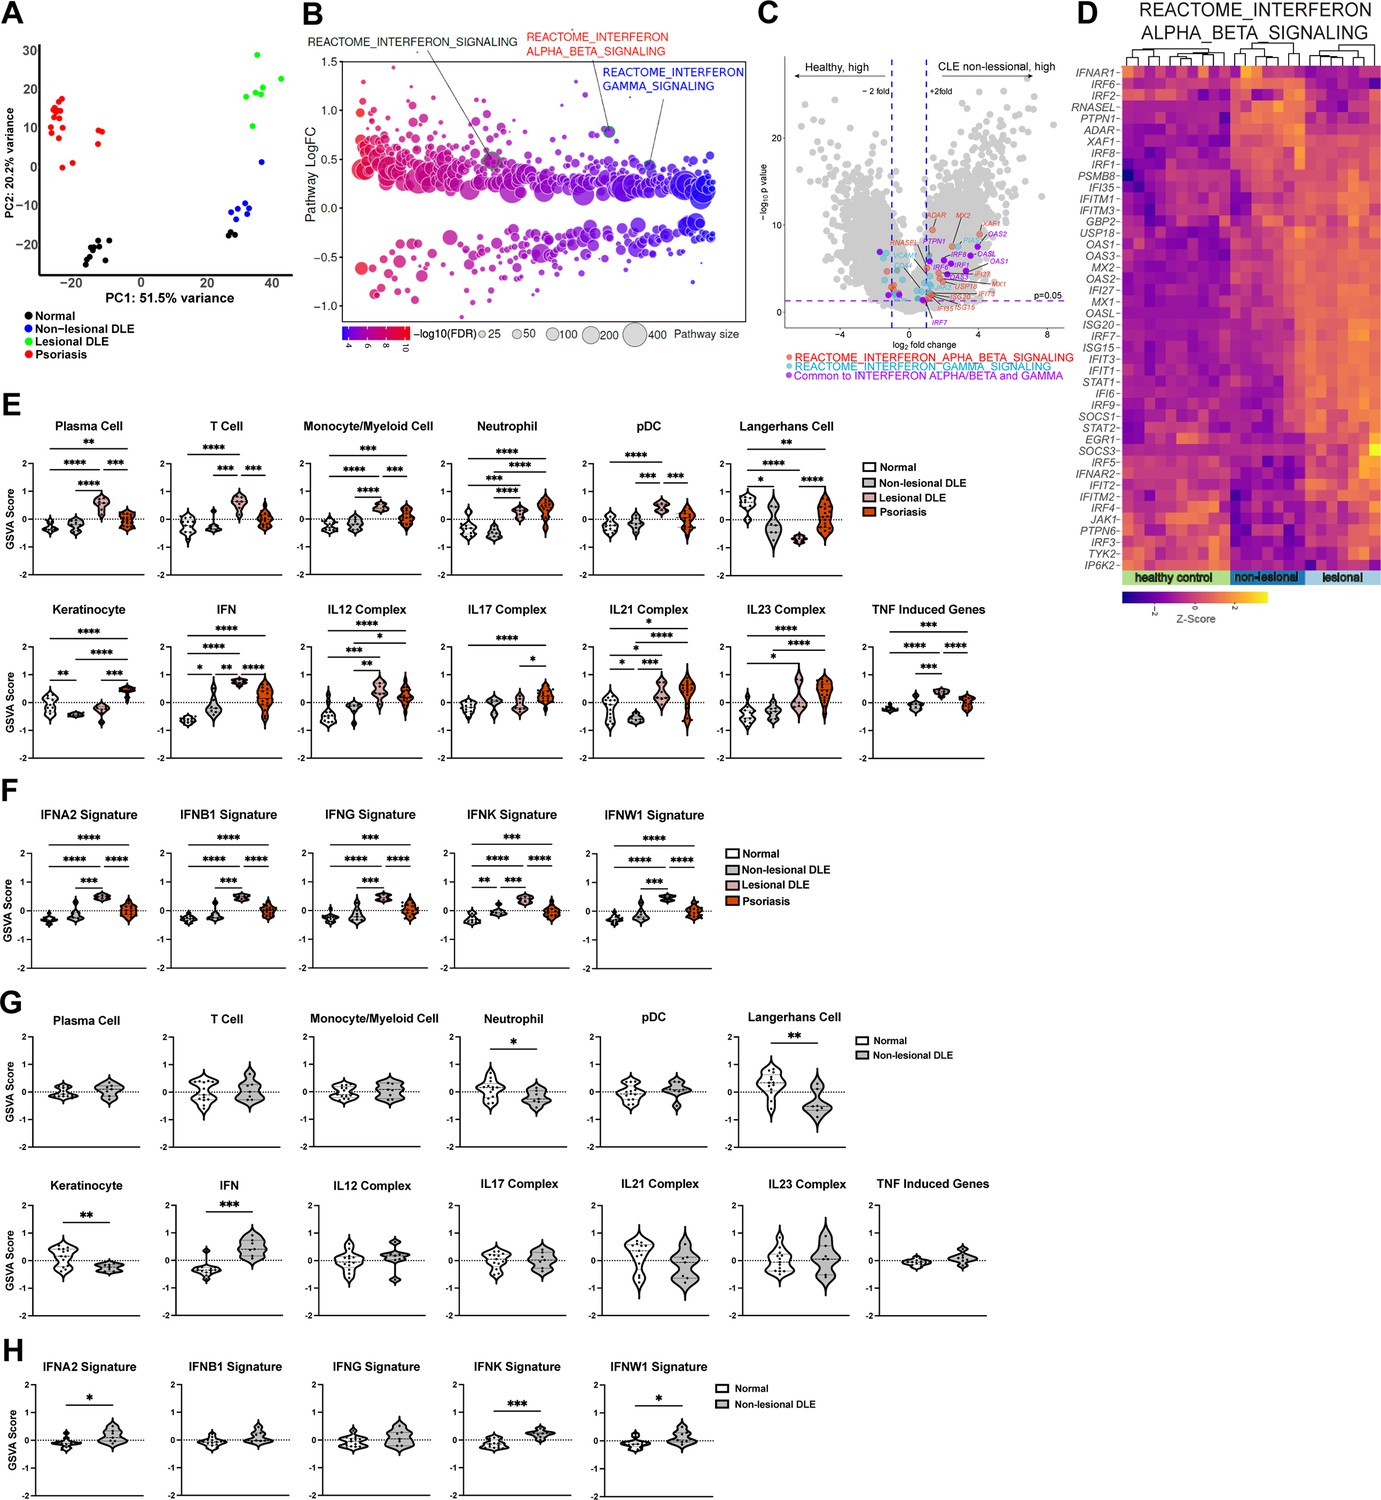
Analysis of a new cohort shows an IFN-rich environment in non-lesional DLE skin.
(A–H) Microarray analysis of gene expression from non-lesional skin of DLE (n=7, this manuscript), lesional DLE (n=7), psoriasis patients (n=17), and healthy controls (n=13) (Jabbari et al., 2014). In (A, D–F), analyses include lesional DLE or both lesional and psoriasis samples. (A) Principal component analysis (PCA) of patient samples using top 500 genes. (B) Differentially expressed pathways in control and non-lesional DLE skin were determined using QuSAGE pathway analysis against Molecular Signatures Database (MSigDB). (C) Volcano plot of differentially expressed genes. Genes from IFN-α/β (red), IFN-γ (blue) pathways, and IRF transcription factors (green) are marked. (D) Heatmap of z-score transformed gene expression in the IFN-α/β signaling pathway. (E–H) Gene Set Variation Analysis (GSVA) of gene sets relevant to lupus (Martínez et al., 2022), with (G–H) comparing only control and non-lesional skin. (F, H) GSVA using gene sets comprising specific IFN subtypes. (E–H) *p<0.05, **p<0.01, ***p<0.001, ****p<0.0001 by unpaired t-test.
Figure 1—figure supplement 1
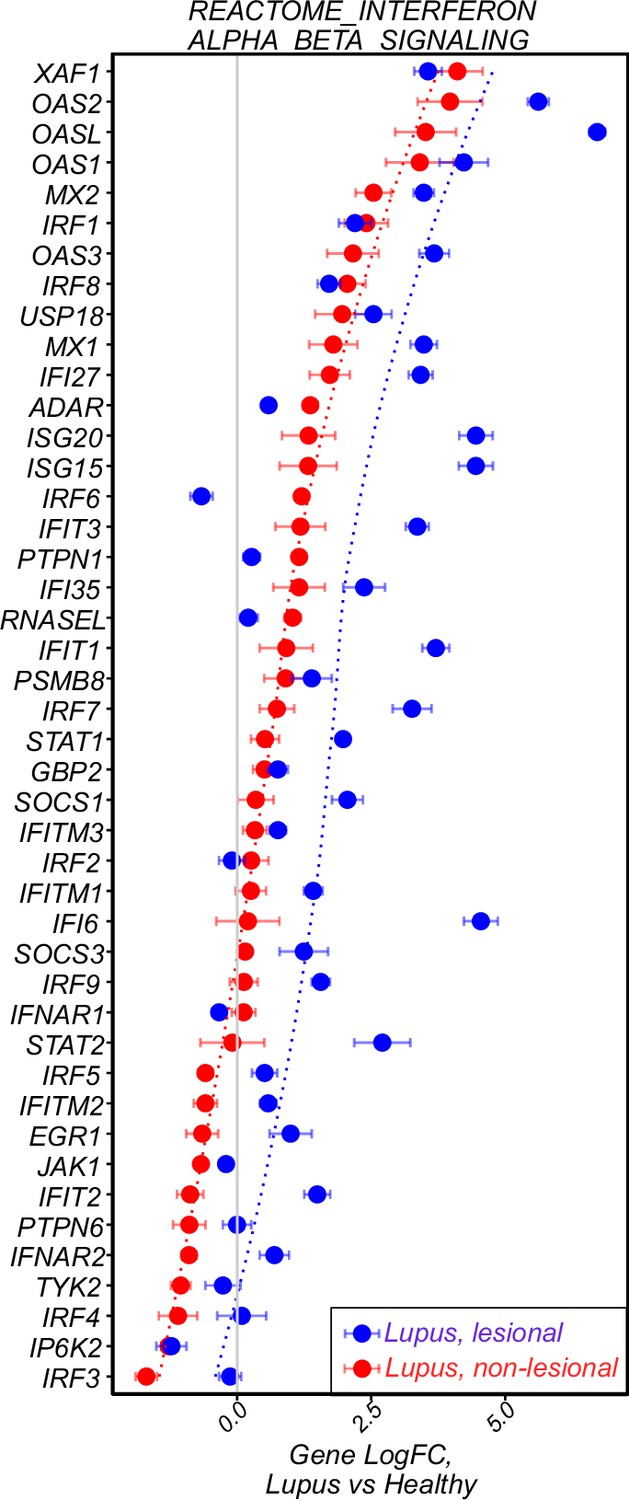
Further analysis of gene expression in human DLE.
Log-transformed expression fold change for genes in the IFN α/β pathway for human DLE skin.
Figure 2 with 1 supplement
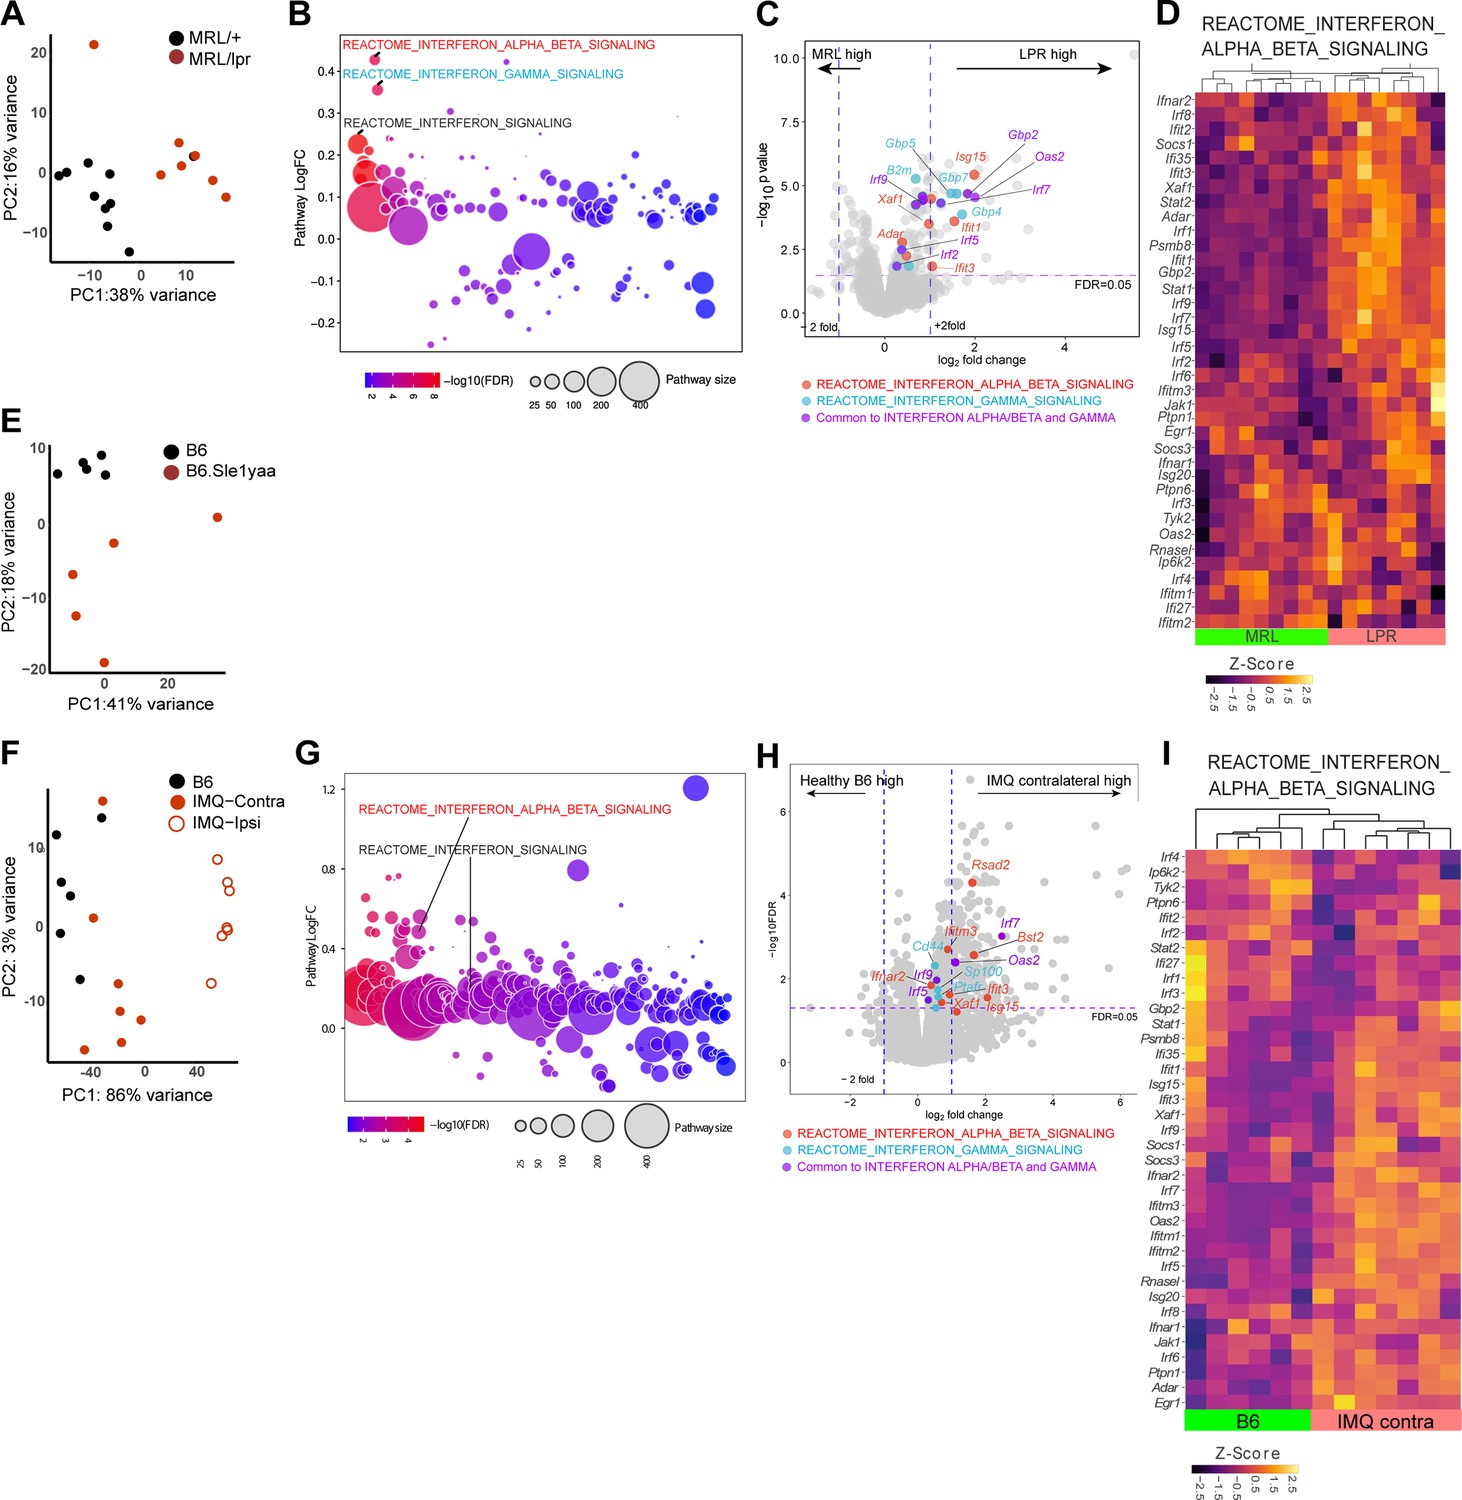
Three photosensitive SLE models show upregulated IFN-related gene expression in non-lesional skin by QuSAGE analysis.
(A–I) RNAseq analysis of gene expression and pathway analyses from MRL/lpr (LPR) and control MRL/+ (MRL) (A–D), B6.Sle1yaa and control B6 mice (E), and IMQ and control B6 mice (F–I). For the IMQ model, mice were painted on one ear (ipsilateral) and the unpainted ear (contralateral) was taken as the non-lesional ear. (A, E, F) PCA using top 500 genes. (B, G) Differentially expressed pathways determined by QuSAGE pathway analysis against MSigDB. (C, H) Volcano plot of differentially expressed genes. Genes from IFN-α/β (red), IFN-γ (blue), and IRF transcription factor (green) pathways are marked. (D, I) Heatmap of z-score transformed gene expression in the IFN α/β signaling pathway. (A, E, F) Each symbol represents one mouse.
Figure 2—figure supplement 1
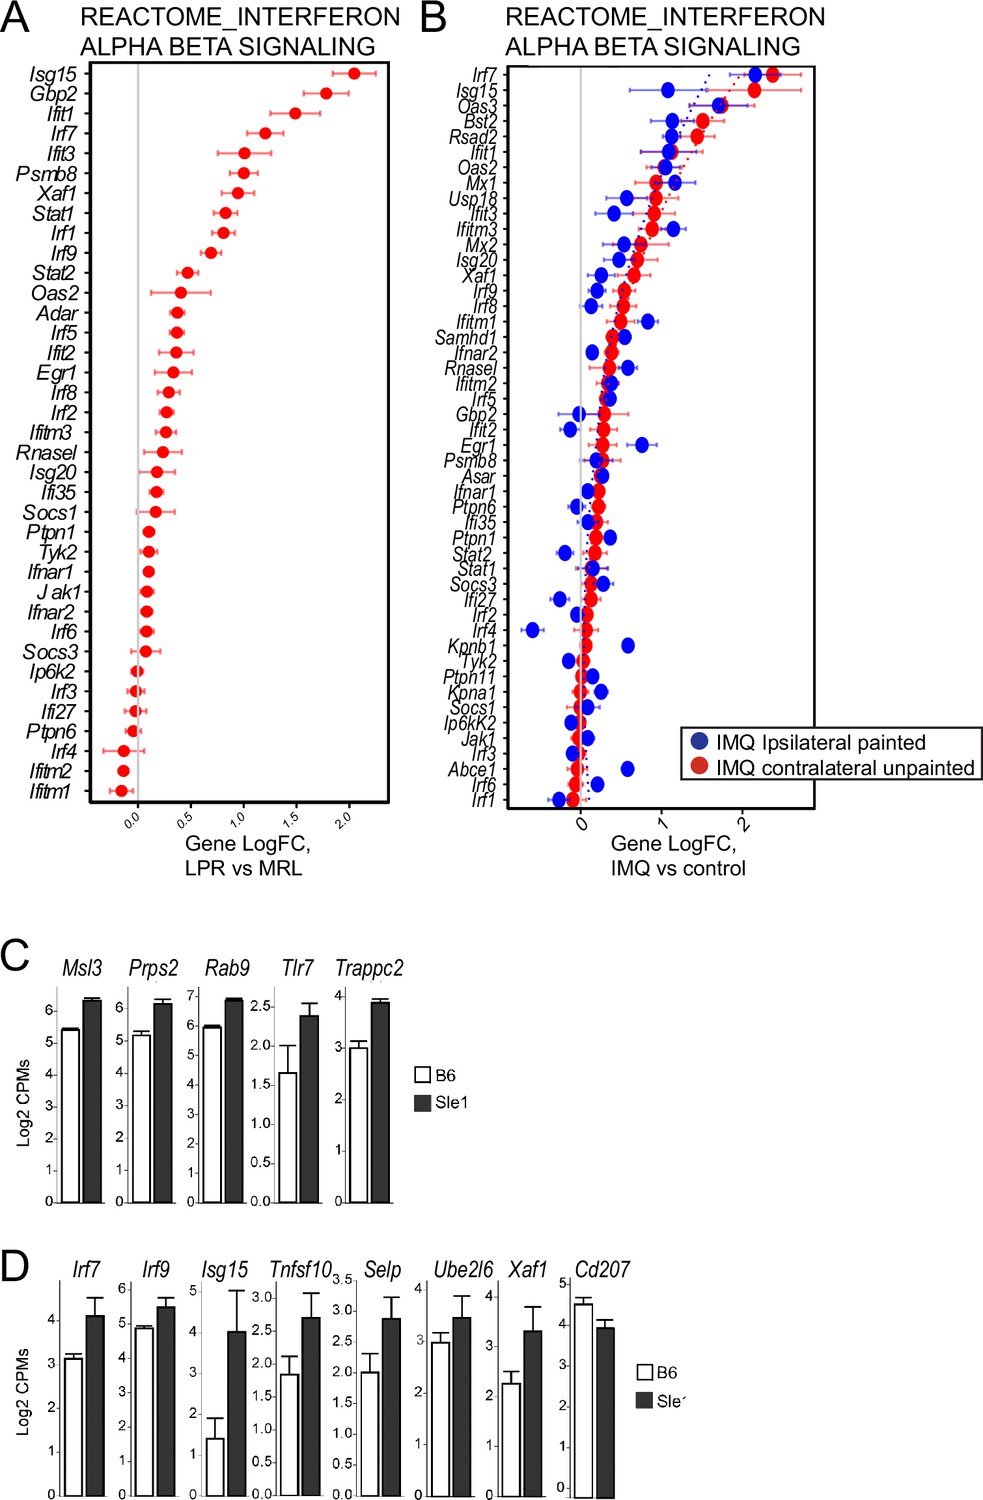
Further analysis of gene expression in skin of multiple murine lupus models.
(A–B) Log-transformed expression fold change for genes in the IFN α/β pathway for skin of MRL/lpr (A) and IMQ (B) model mice. (C) Genes from yaa locus are expressed at a higher levels in B6.Sle1yaa mice. (D) IRF transcription factors and their targets are expressed at a higher levels and CD207 is expressed at lower level in B6.Sle1yaa mice compared to controls.
Figure 3 with 1 supplement
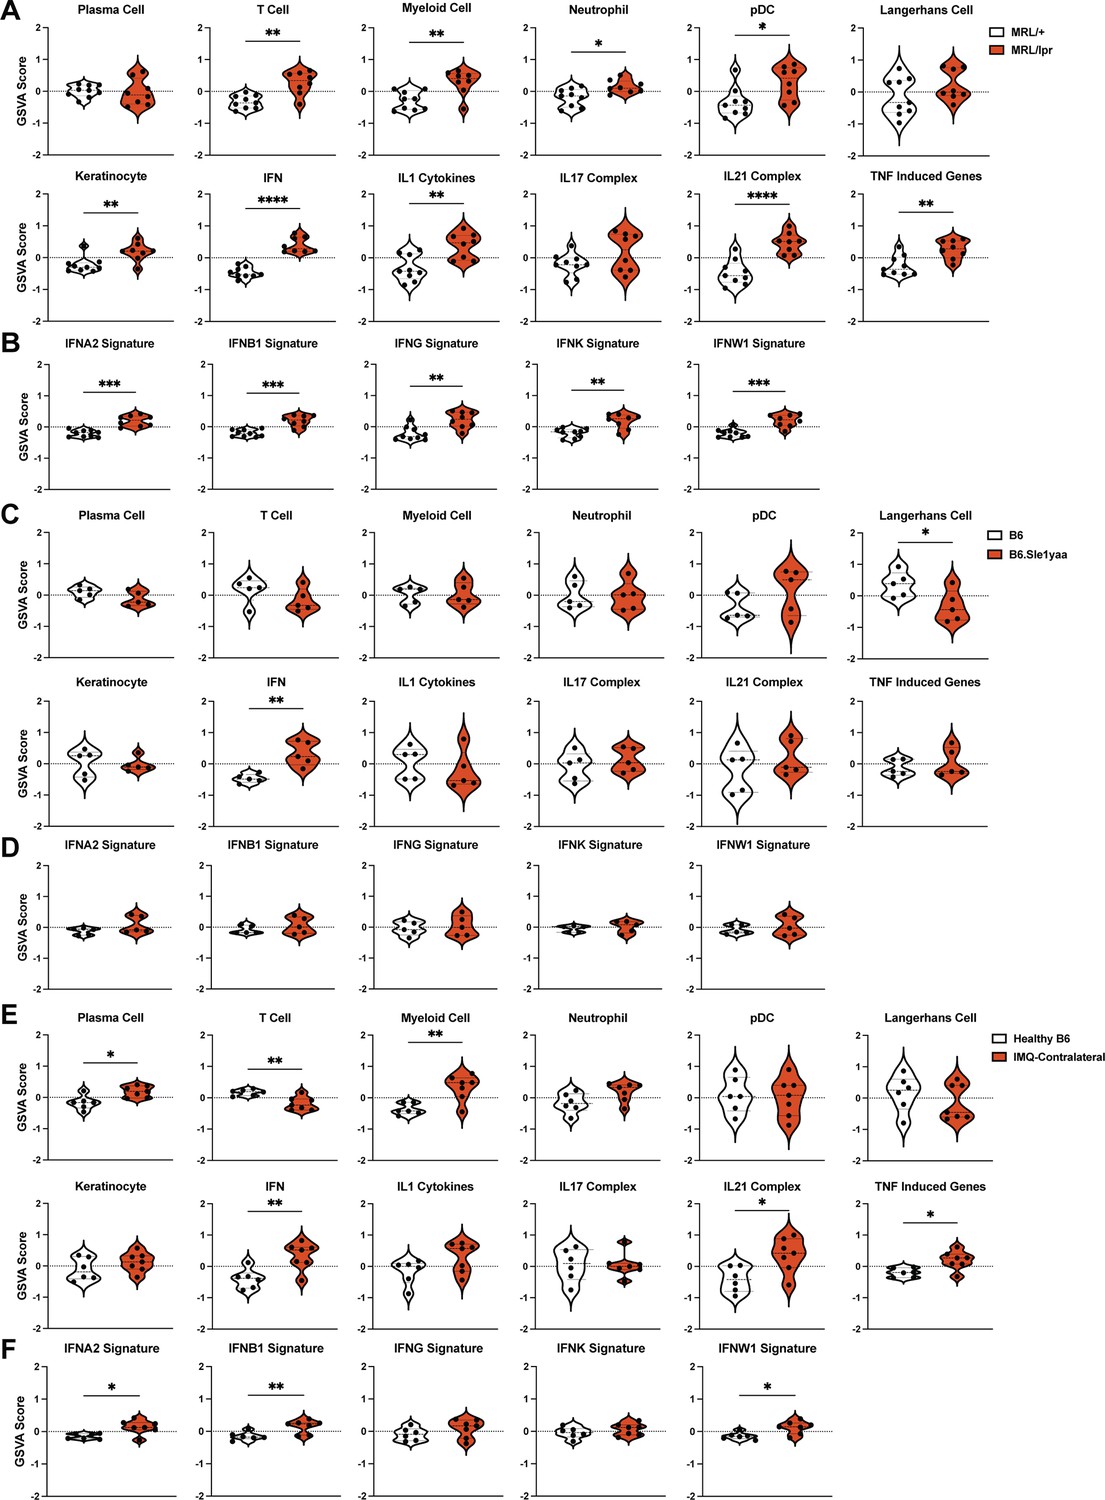
The SLE models share upregulated IFN signatures in non-lesional skin by gene set variation analysis (GSVA).
(A–F) The RNAseq data from Figure 2 of MRL/lpr (A–B), B6.Sle1yaa (C–D), and IMQ (E–F) models were analyzed by GSVA. (A, C, E) GSVA of gene sets relevant to lupus, adapted for murine models (Kingsmore et al., 2021). (B, D, F) GSVA of gene signatures specific to distinct IFN subtypes. (A–F) Each symbol represents one mouse. *p<0.05, **p<0.01, ***p<0.001, ****p<0.0001 by unpaired t-test.
Figure 3—figure supplement 1
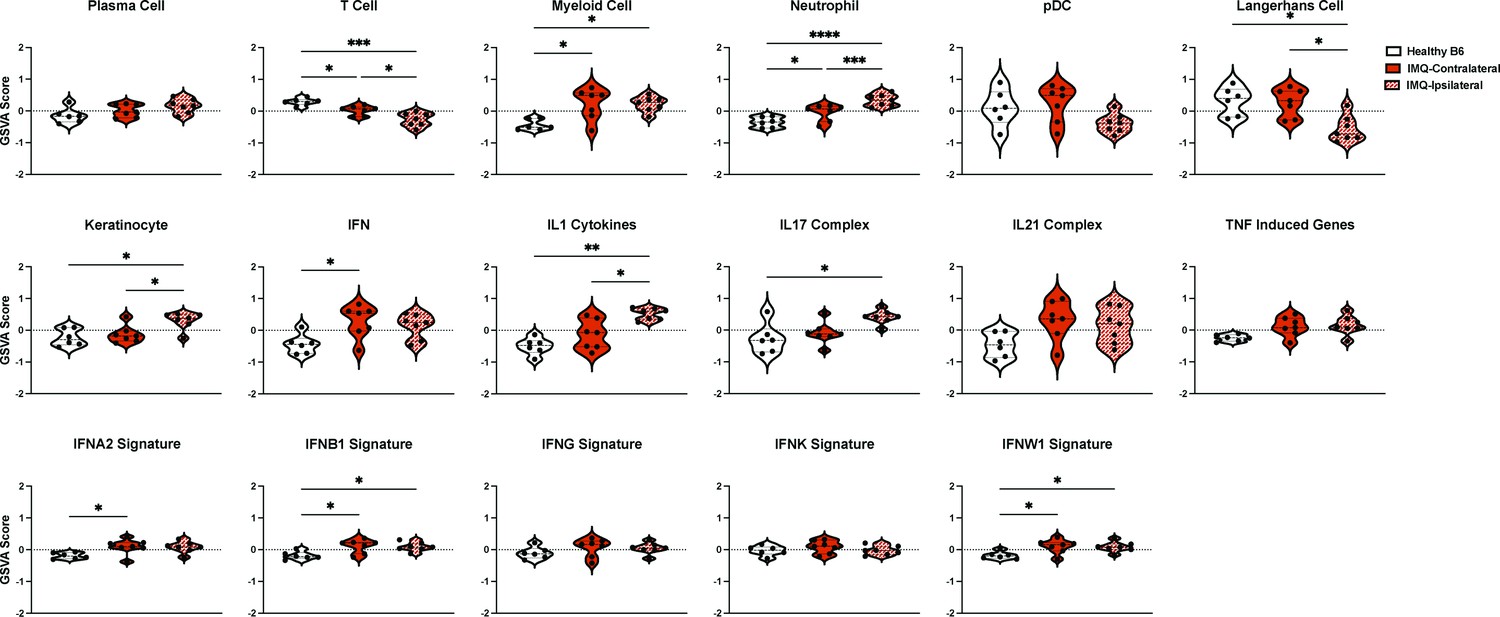
GSVA of ipsilateral IMQ-painted skin together with contralateral ear skin.
GSVA of skin from ipsilateral IMQ painted ears and contralateral unpainted “non-lesional” ear of IMQ-treated mice.
Figure 4
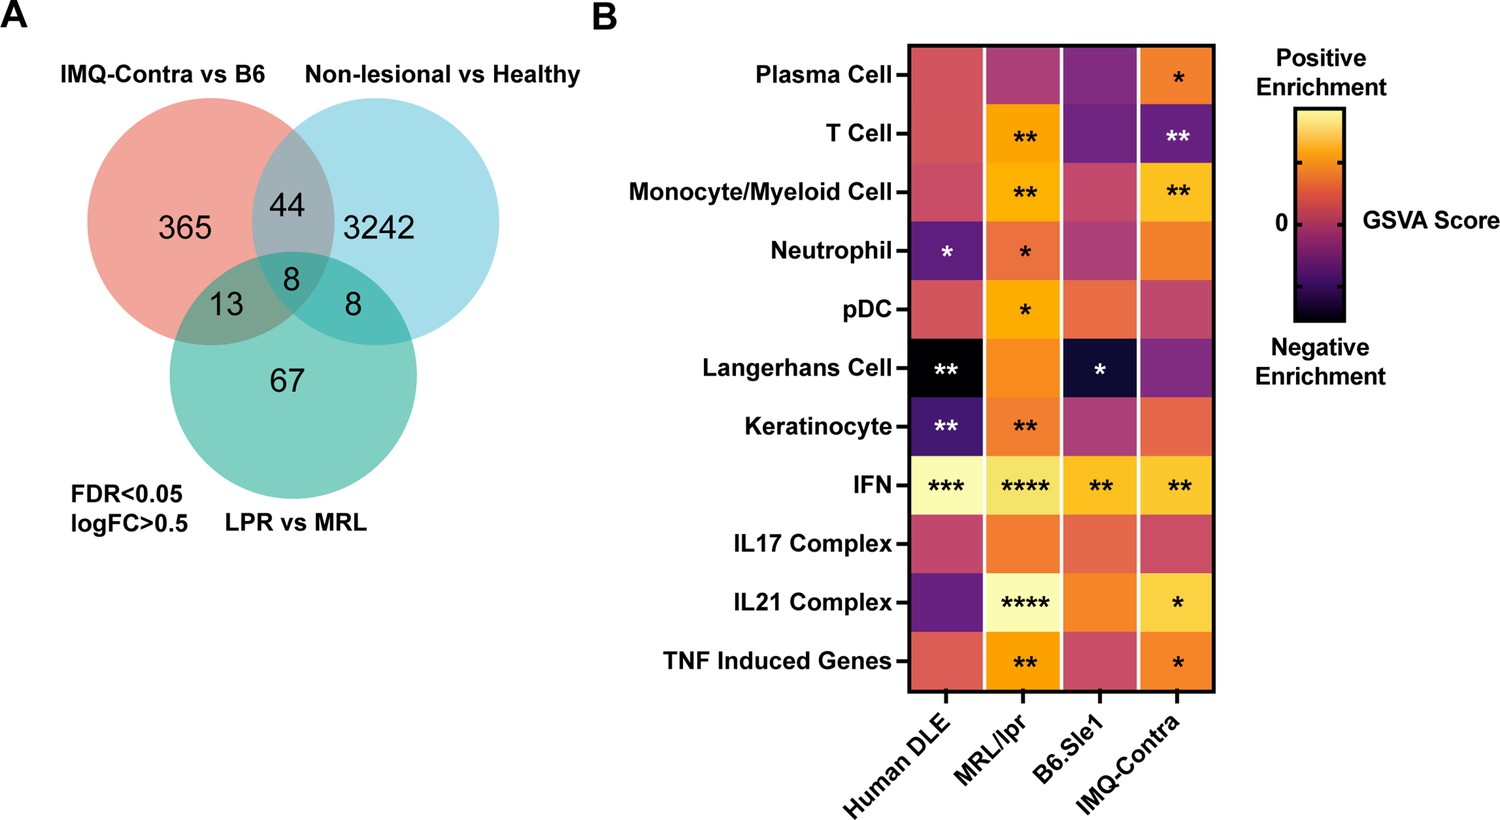
Comparison of human DLE and murine lupus models shows shared upregulation of IFN-associated genes.
(A) Venn diagram of differentially expressed genes among DLE patients, LPR mice, and IMQ mice using FDR <0.05 and logFC >0.5. (B) Heatmap of GSVA scores for shared gene sets between non-lesional skin from DLE patients, LPR mice, B6.Sle1yaa mice, and IMQ mice. Asterisks indicate significant differences in GSVA scores compared to controls for each dataset.
Figure 5 with 1 supplement
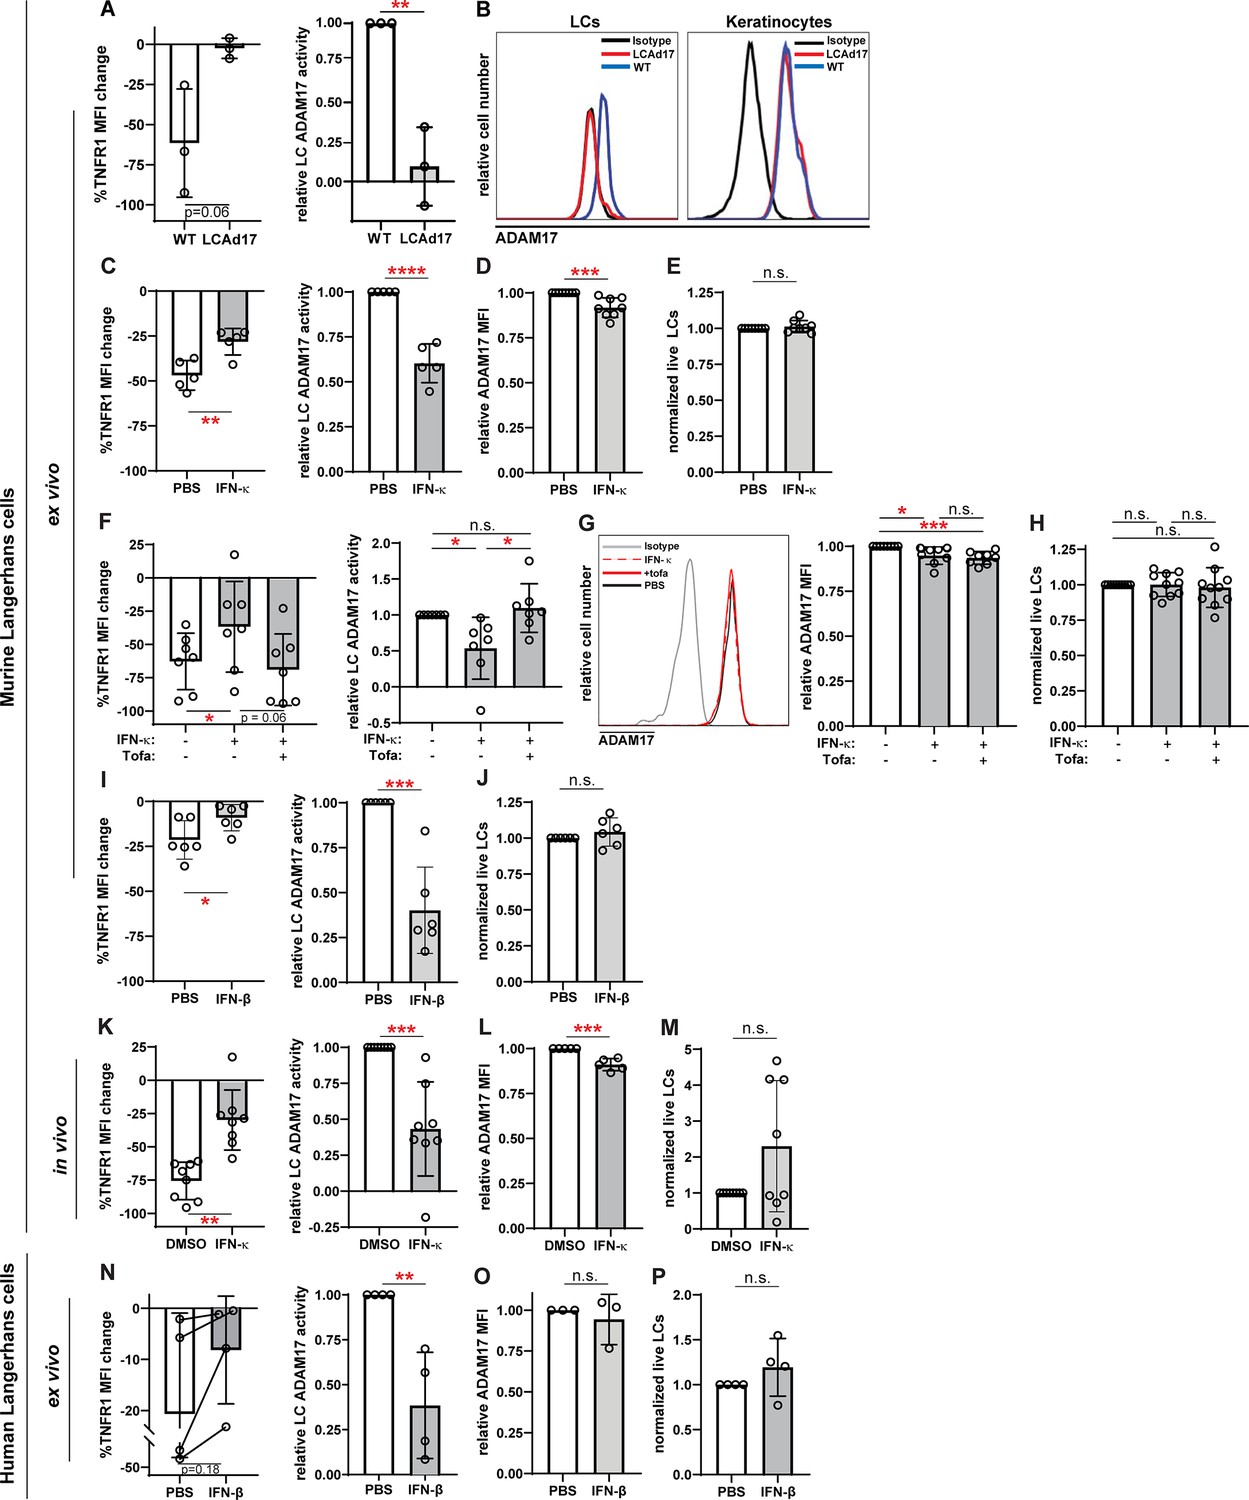
IFN-I inhibits LC ADAM17 sheddase activity.
(A) Epidermal cell suspensions from WT and LCAd17 mice lacking ADAM17 in LCs were assayed for LC ADAM17 sheddase activity as indicated by the extent of UVR-induced cell surface TNFR1 loss. Percent change in cell surface TNFR1 mean fluorescence intensity (MFI) after UVR (left); relative LC ADAM17 activity calculated by normalizing TNFR1 loss to that of vehicle controls (right). (B) Representative histograms from cell surface ADAM17 staining of WT and LCAd17 epidermal cell suspensions. assayed. (C–P) Murine and human epidermal cell suspensions were treated ex vivo or mice were treated in vivo with IFN-I prior to assaying for UVR-induced LC ADAM17 sheddase activity (C, F, I, K, N), LC ADAM17 levels (D, G, L, O), and LC numbers (E, H, J, M, P). (C–J) Cells from WT mice were treated with IFN-κ or vehicle (C–E), with or without tofacitinib (F–H), or with IFN-βor vehicle (I–J). (K–M) IFN-κ or vehicle was applied topically to ears of WT mice 16–20 hr prior to examination. (N–P) Suction blister epidermal cell suspensions from healthy human donors were treated with IFN-β or vehicle. In (N), lines connect samples from the same donor. (A,C–P) Each symbol represents cells from a single mouse or donor, bars represent average values, and error bars are SD. n=3–10 per condition over 3–5 independent experiments. *p<0.05, **p<0.01, ***p<0.001, n.s.=not significant by paired (A, C, F, I, K, N (left)) or unpaired (A, C, F, I, K, N (right)), (D–E, G–H, J, L–M, O–P) t-test.
-
Figure 5—source data 1
This file is the source file that contains all the data that led to the graphs in Figure 5.
- https://cdn.elifesciences.org/articles/85914/elife-85914-fig5-data1-v2.xlsx
Figure 5—figure supplement 1
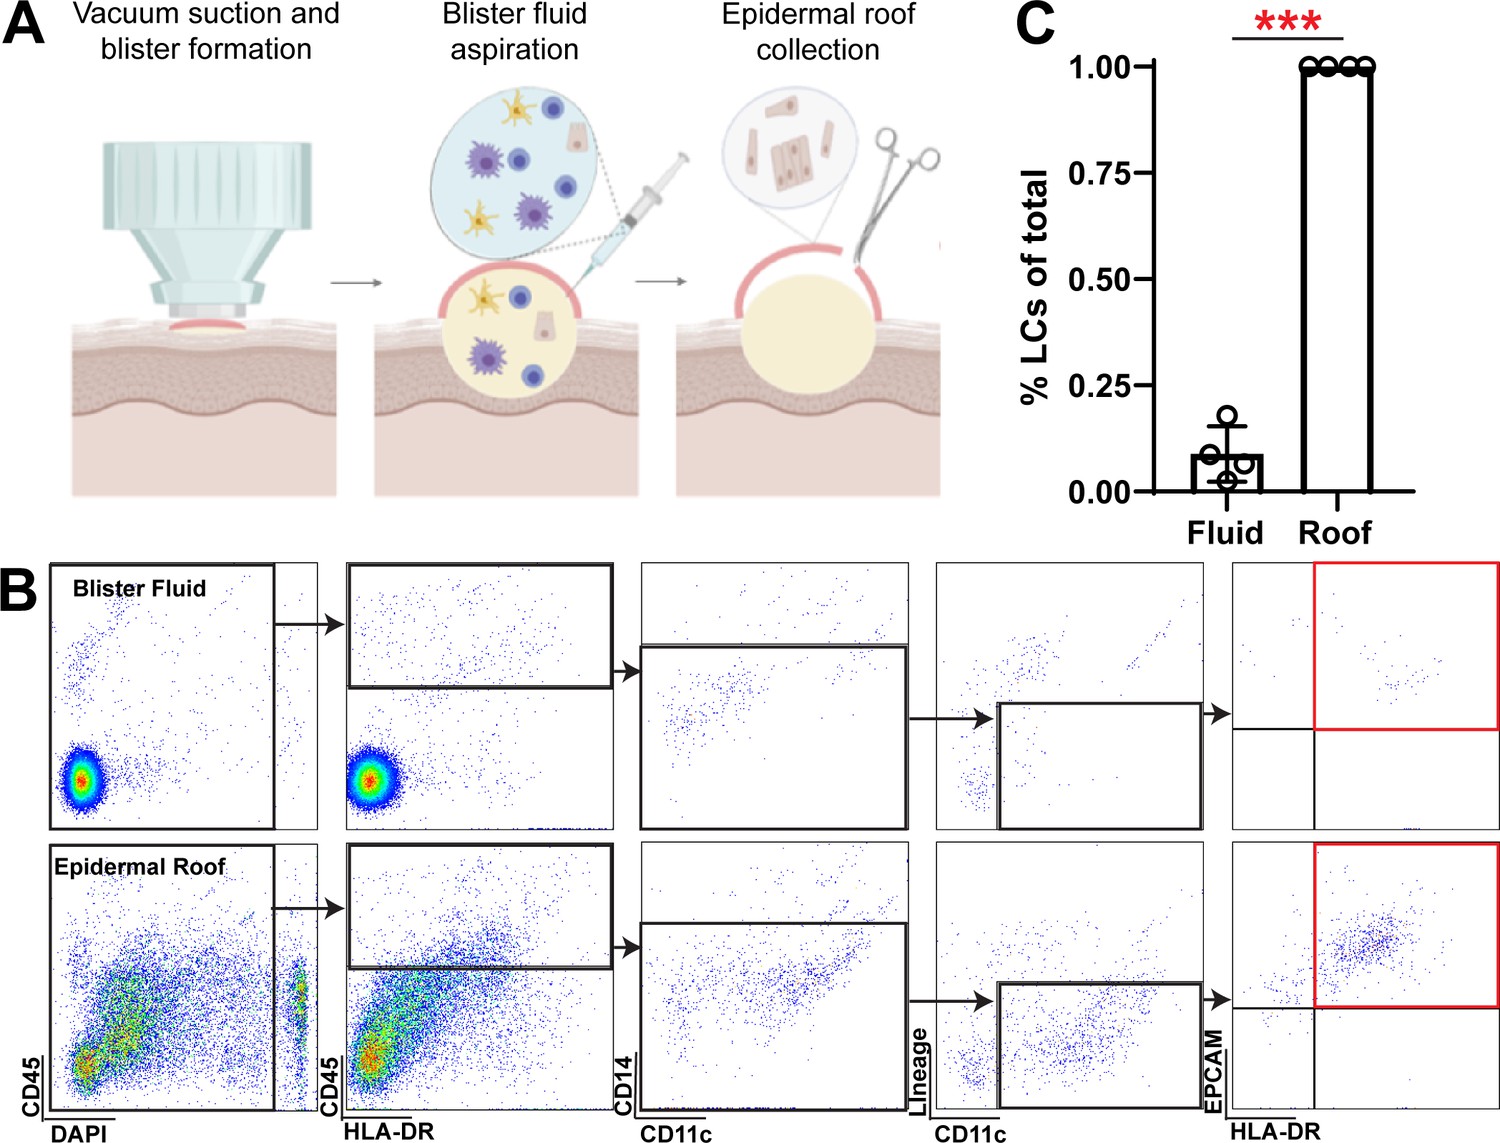
Langerhans cell yield and gating with suction blistering of human skin.
(A) Schematic of suction blistering and sample collection. (B) Gating of Langerhans cells in blister. fluid and in epidermal roof cell suspension. (C) Langerhans cell abundance in blister fluid and. epidermal roof samples. Each symbol represents 1 healthy donor. ****p<0.0001 unpaired t-test.
Figure 6
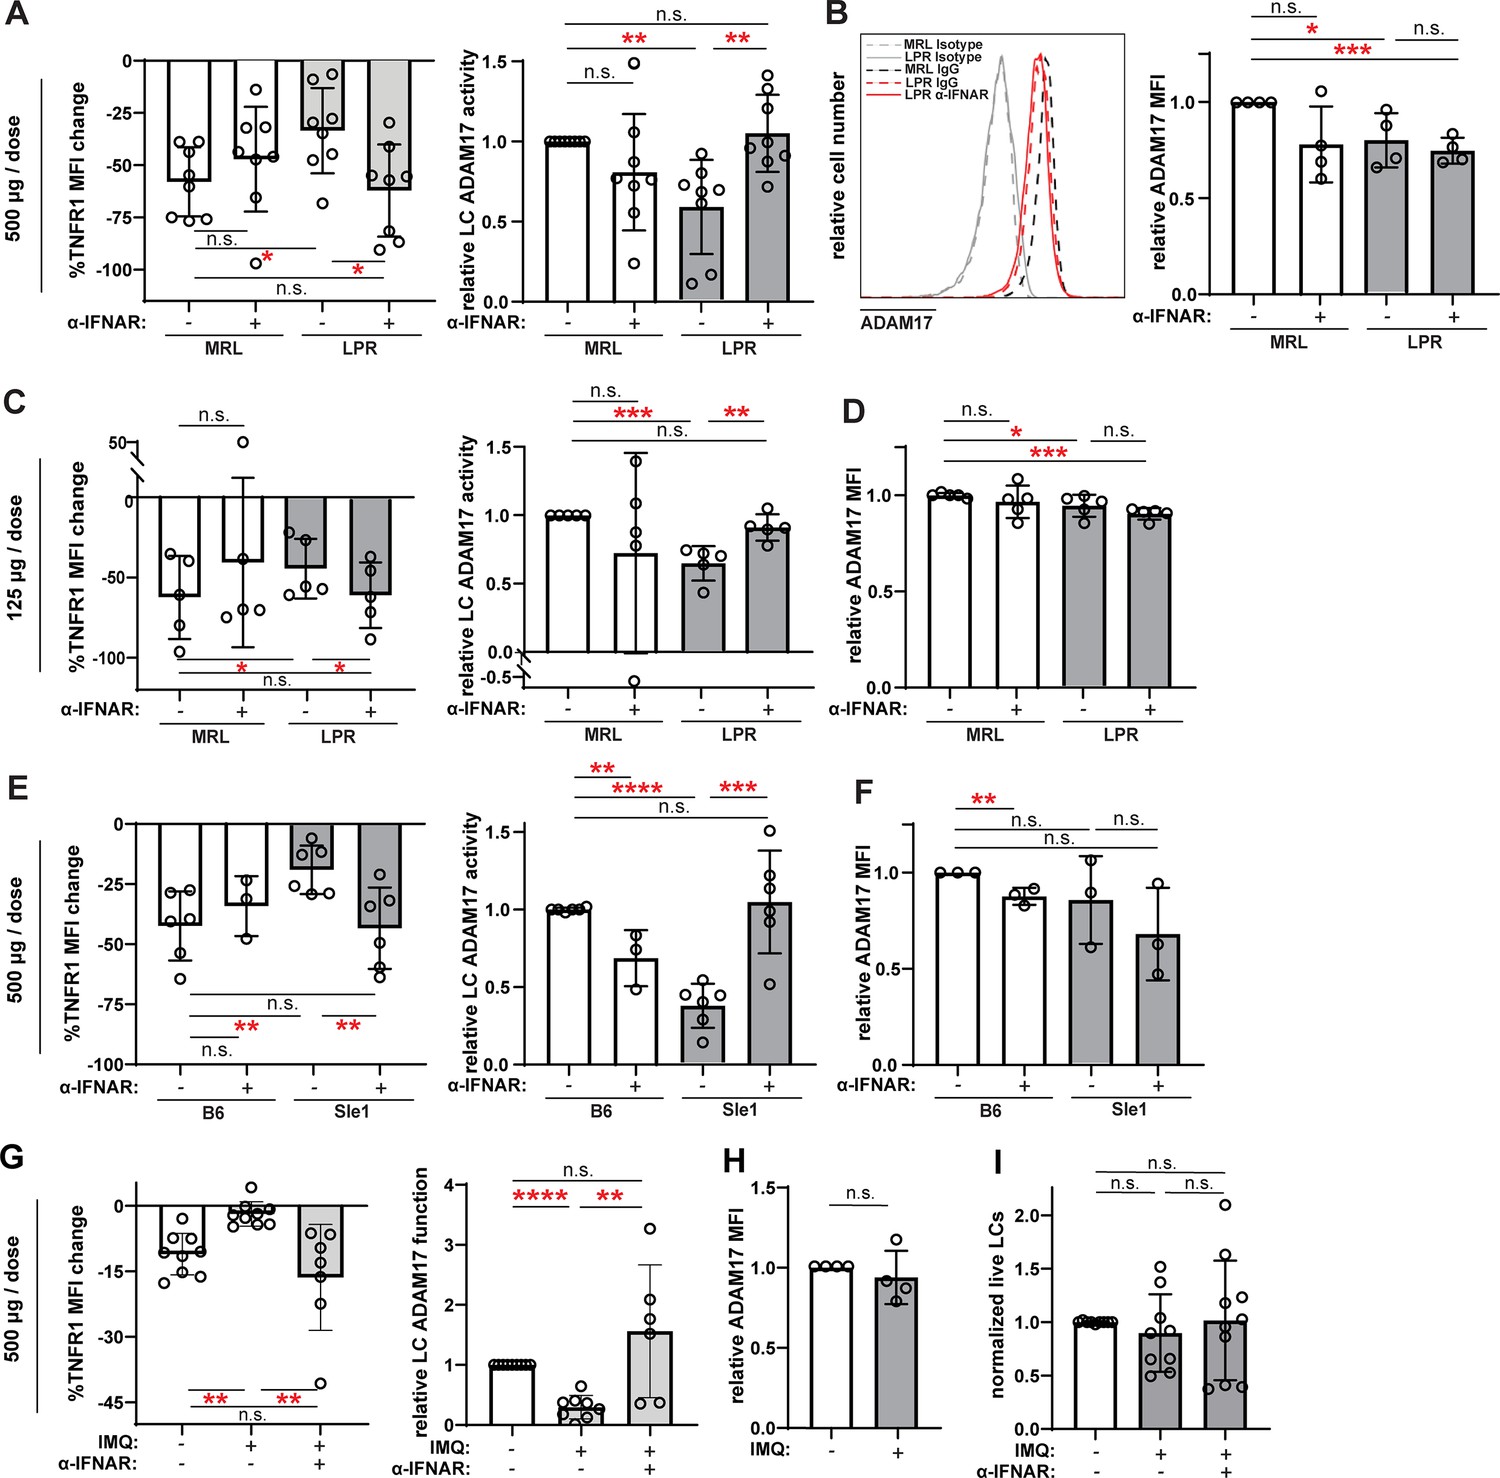
Anti-IFNAR restores LC ADAM17 activity in multiple lupus models.
(A–I) MRL/lpr (A–D), B6.Sle1yaa (E–F), and IMQ (G–I) lupus model mice and their controls were treated twice with anti-IFNAR or isotype control at indicated doses over 6 days prior to collection of non-lesional epidermal cells. (A, C, E, G) UVR-induced LC ADAM17 sheddase activity as in Figure 5. (B, D, F, H) Relative cell surface ADAM17 levels. (I) Relative LC numbers. (A–I) Each symbol represents a mouse, bars represent average values, and error bars are SD. n=3–9 per condition over 3–8 independent experiments. *p<0.05, **p<0.01, ***p<0.001, n.s.=not significant by paired (A, C, E, G (left)) or unpaired (A, C, E, G (right)), (B, D, F, H–I) t-test.
-
Figure 6—source data 1
This file is the source file that contains all the data that led to the graphs in Figure 6.
- https://cdn.elifesciences.org/articles/85914/elife-85914-fig6-data1-v2.xlsx
Figure 7
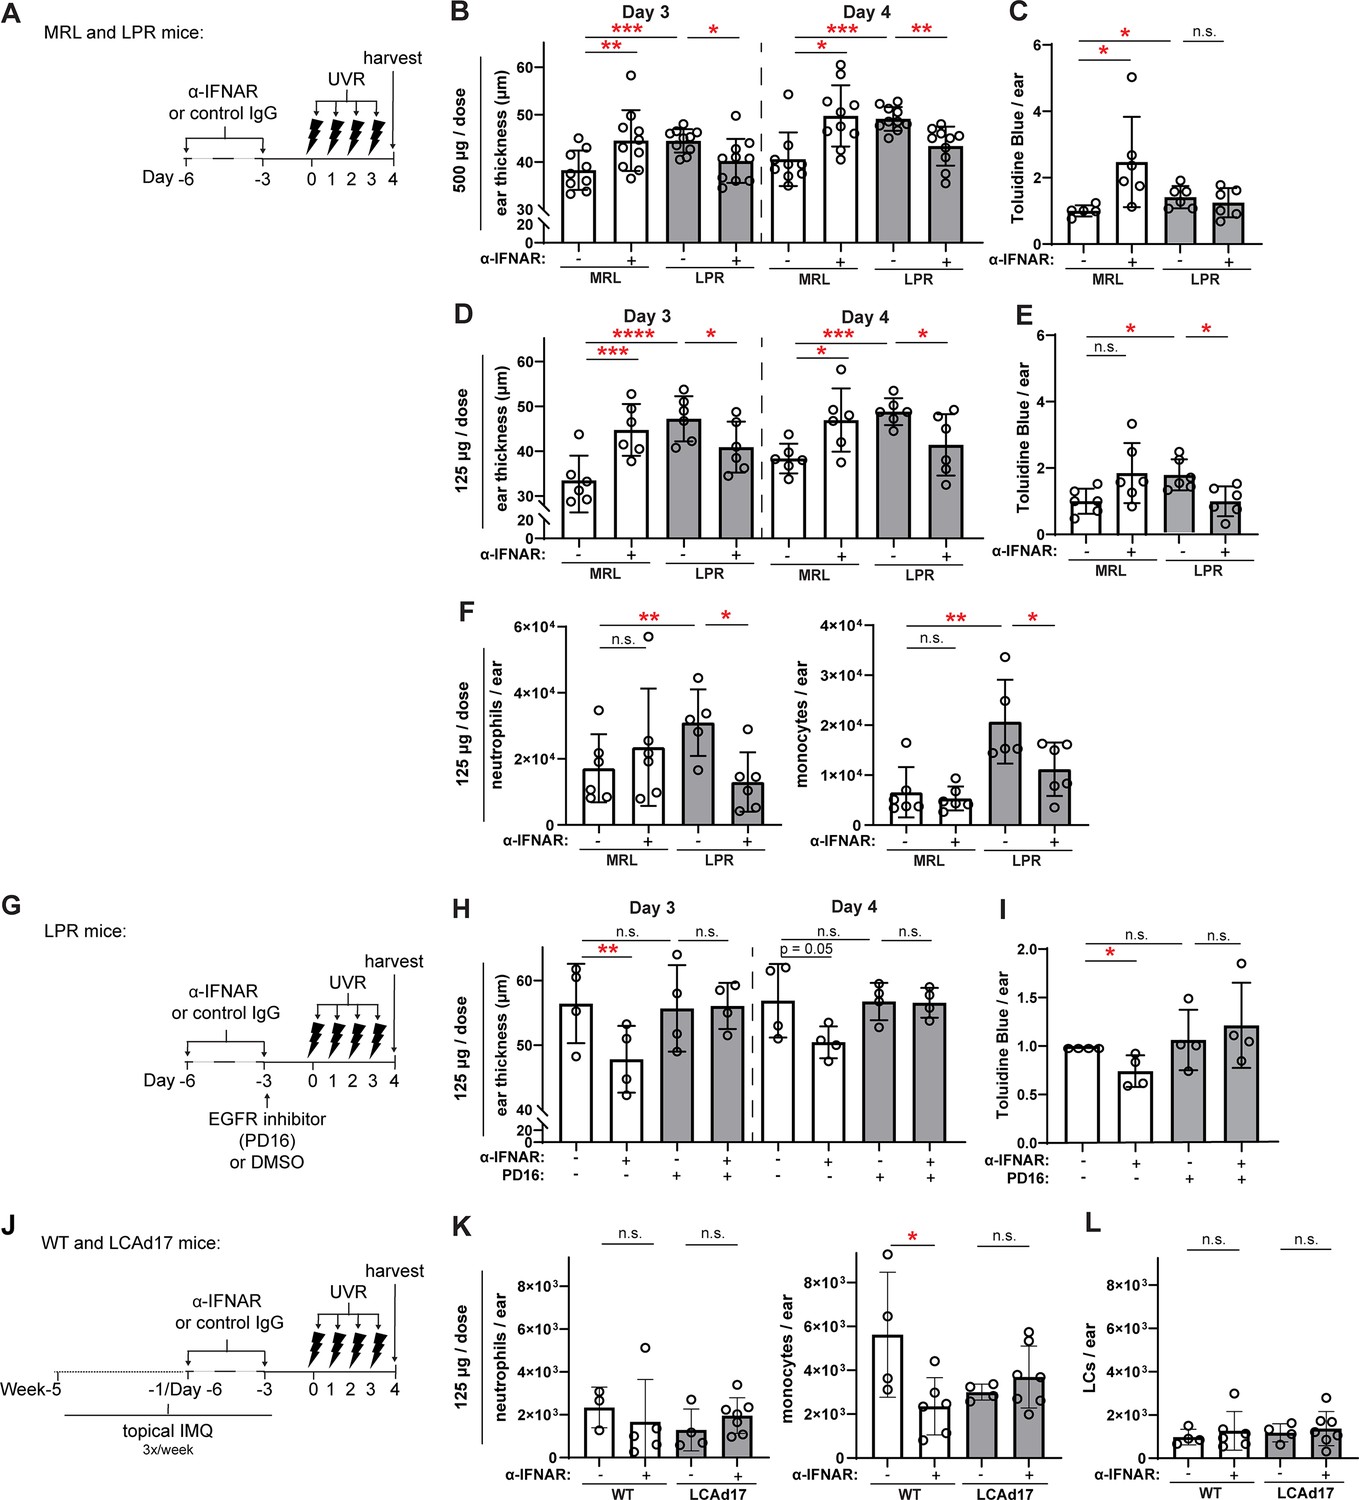
Anti-IFNAR reduces photosensitivity in EGFR- and LC ADAM17- dependent manners.
(A–L) MRL/lpr (A–I) and LCAd17 (J–L) mice and controls were treated according to schematics in (A, G, J) and non-lesional ears were harvested. (B, D, H) Ear thickness. (C, E, I) Epidermal permeability as indicated by toluidine blue retention. (F, K) Neutrophils and monocytes, and (L) LCs per ear. (B–F, H–I, K–L) n=4–10 per condition over four to six independent experiments. *p<0.05, **p<0.01, ***p<0.001, n.s.=not significant by paired (B, D, H) and unpaired (C, E, F, I, K–L) t-test.
-
Figure 7—source data 1
This file is the source file that contains all the data that led to the graphs in Figure 7.
- https://cdn.elifesciences.org/articles/85914/elife-85914-fig7-data1-v2.xlsx
Figure 8
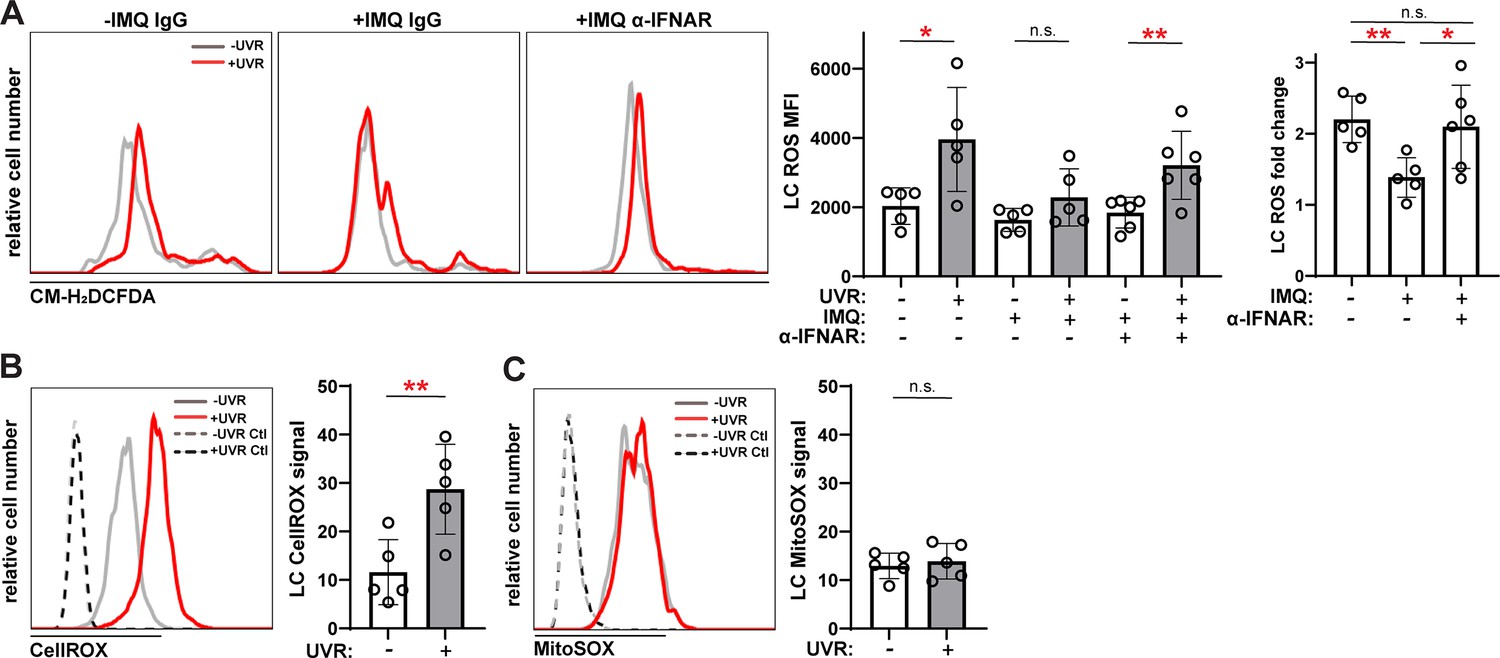
Anti-IFNAR restores UVR-induced LC ROS expression in a lupus model and UVR stimulates cytoplasmic ROS.
(A) Epidermal cell suspensions from control or IMQ mice treated with IgG or anti-IFNAR were exposed to UVR. Cells were loaded with the general ROS indicator CM-H2DCFDA prior to staining for LC markers for flow cytometry analysis. Representative histograms (left), CM-H2DCFDA signal MFI (middle), and fold change with UVR exposure (right). (B–C) Healthy B6 epidermal cells were loaded with the cytoplasmic ROS indicator CellROX (B) or mitochondrial ROS indicator MitoSOX (C) prior to UVR exposure and staining of LC markers. Signal was calculated by dividing the ROS indicator MFI by the MFI of its respective negative control. Each symbol represents one mouse, bars represent average values, and error bars are SD. n=5–6 per condition over four to five experiments. *p<0.05, **p<0.01, n.s.=not significant by paired A (left), (B, C) and unpaired (A (right)) t-test.
-
Figure 8—source data 1
This file is the source file that contains all the data that led to the graphs in Figure 8.
- https://cdn.elifesciences.org/articles/85914/elife-85914-fig8-data1-v2.xlsx
Tables
Table 1
IFN inhibition of LC ADAM17 sheddase activity is uncoupled from LC numbers and LC ADAM17 surface expression.
| LC numbers | LC ADAM17 sheddase activity | LC ADAM17 cell surface levels | |
|---|---|---|---|
| In vitro IFN | |||
| Human skin +IFN | Unchanged | Down | Unchanged |
| Murine skin +IFN | Unchanged | Down | Modestly down |
| In vivo IFN (murine) | Unchanged | Down | Modestly down |
| MRL/lpr model | Unchanged | Down | Modestly down |
| Anti-IFNAR | Restored | Unchanged | |
| B6.Sle.1yaa model | Unchanged | Down | Unchanged |
| Anti-IFNAR | Restored | Unchanged | |
| IMQ model | Unchanged | Down | Unchanged |
| Anti-IFNAR | Unchanged | Restored | Unchanged |
Additional files
-
Supplementary file 1
Differentially expressed genes in DLE vs healthy control non-lesional skin microarray.
- https://cdn.elifesciences.org/articles/85914/elife-85914-supp1-v2.xlsx
-
Supplementary file 2
Differentially expressed pathways in DLE vs healthy control non-lesional skin using QuSAGE.
- https://cdn.elifesciences.org/articles/85914/elife-85914-supp2-v2.xlsx
-
Supplementary file 3
Human gene sets used for GVSA.
- https://cdn.elifesciences.org/articles/85914/elife-85914-supp3-v2.xlsx
-
Supplementary file 4
Differentially expressed genes in MRL/lpr vs control MRL/+non-lesional skin RNAseq.
- https://cdn.elifesciences.org/articles/85914/elife-85914-supp4-v2.xlsx
-
Supplementary file 5
Differential expressed pathways in MRL/lpr vs control MRL/+non-lesional skin using QuSAGE.
- https://cdn.elifesciences.org/articles/85914/elife-85914-supp5-v2.xlsx
-
Supplementary file 6
Differentially expressed genes in B6.Sle1yaa vs control B6 non-lesional skin RNAseq.
- https://cdn.elifesciences.org/articles/85914/elife-85914-supp6-v2.xlsx
-
Supplementary file 7
Differentially expressed genes in IMQ vs control non-lesional skin RNAseq.
- https://cdn.elifesciences.org/articles/85914/elife-85914-supp7-v2.xlsx
-
Supplementary file 8
Differential expressed pathways in IMQ vs control non-lesional skin using QuSAGE.
- https://cdn.elifesciences.org/articles/85914/elife-85914-supp8-v2.xlsx
-
Supplementary file 9
Murine gene sets used for GVSA.
- https://cdn.elifesciences.org/articles/85914/elife-85914-supp9-v2.xlsx
-
Supplementary file 10
Common upregulated genes in human DLE, MRL/lpr mice, and IMQ mice.
- https://cdn.elifesciences.org/articles/85914/elife-85914-supp10-v2.csv
-
Supplementary file 11
Antibodies used.
- https://cdn.elifesciences.org/articles/85914/elife-85914-supp11-v2.xlsx
-
MDAR checklist
- https://cdn.elifesciences.org/articles/85914/elife-85914-mdarchecklist1-v2.docx
Download links
A two-part list of links to download the article, or parts of the article, in various formats.
Downloads (link to download the article as PDF)
Open citations (links to open the citations from this article in various online reference manager services)
Cite this article (links to download the citations from this article in formats compatible with various reference manager tools)
The interferon-rich skin environment regulates Langerhans cell ADAM17 to promote photosensitivity in lupus
eLife 13:e85914.
https://doi.org/10.7554/eLife.85914


